Zip Codes with the Highest Percentage of Population with a Degree in Science and Engineering in California
RELATED REPORTS & OPTIONS
Science and Engineering
California
Compare Zip Codes
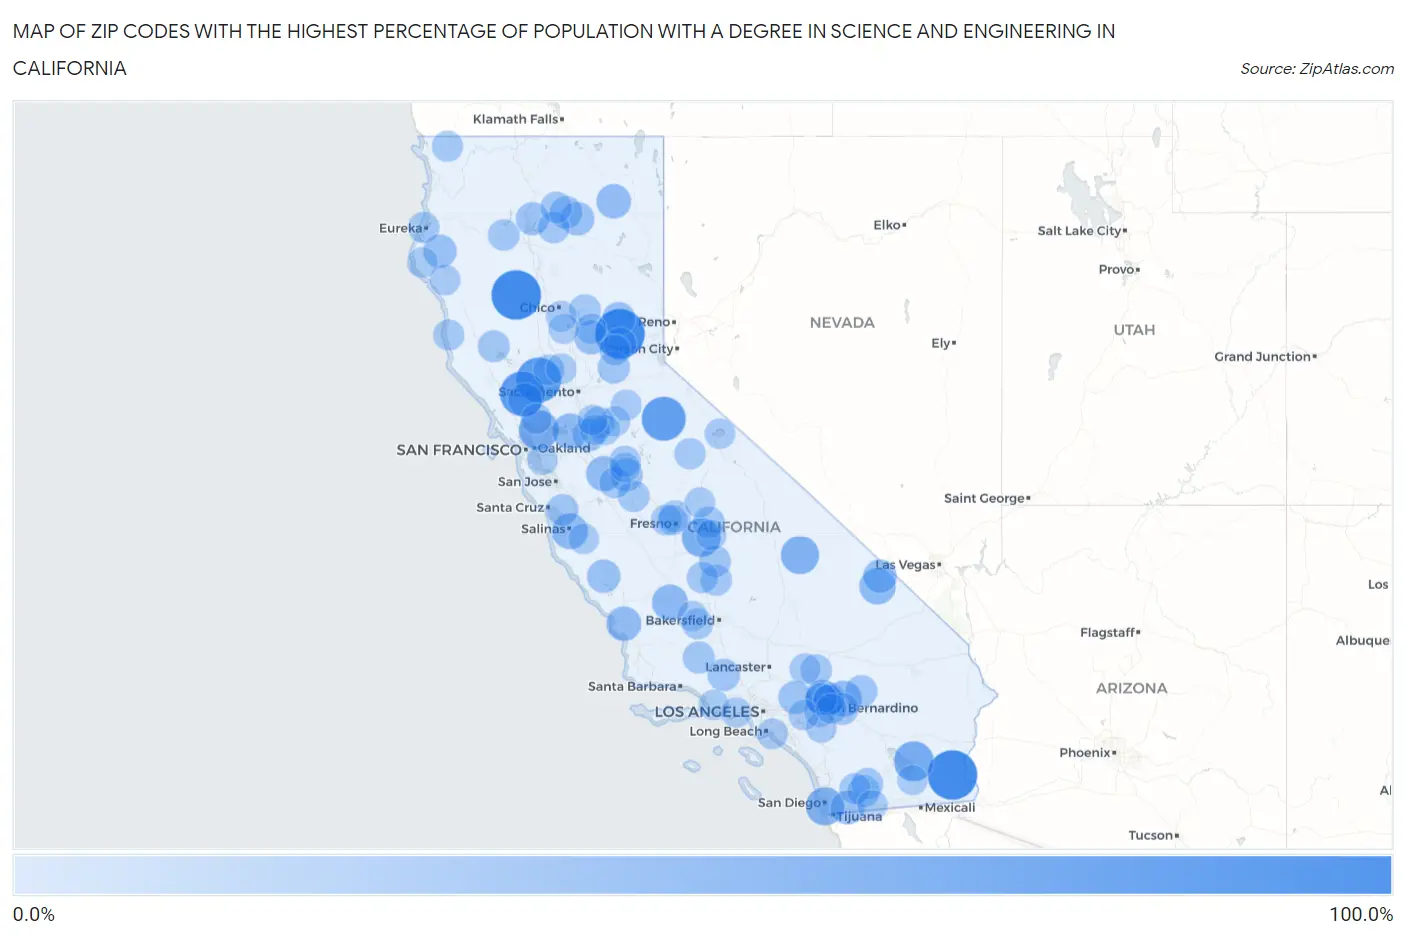
Map of Zip Codes with the Highest Percentage of Population with a Degree in Science and Engineering in California
0.0%
100.0%
Zip Codes with the Highest Percentage of Population with a Degree in Science and Engineering in California
| Zip Code | % Graduates | vs State | vs National | |
| 1. | 96074 | 100.0% | 8.3%(+91.7)#1 | 9.8%(+90.2)#55 |
| 2. | 92266 | 100.0% | 8.3%(+91.7)#2 | 9.8%(+90.2)#57 |
| 3. | 95986 | 100.0% | 8.3%(+91.7)#3 | 9.8%(+90.2)#73 |
| 4. | 95606 | 80.0% | 8.3%(+71.7)#4 | 9.8%(+70.2)#135 |
| 5. | 94576 | 79.7% | 8.3%(+71.4)#5 | 9.8%(+69.9)#137 |
| 6. | 95375 | 75.4% | 8.3%(+67.1)#6 | 9.8%(+65.6)#151 |
| 7. | 92257 | 58.0% | 8.3%(+49.7)#7 | 9.8%(+48.2)#284 |
| 8. | 94569 | 57.4% | 8.3%(+49.2)#8 | 9.8%(+47.7)#288 |
| 9. | 93666 | 52.9% | 8.3%(+44.7)#9 | 9.8%(+43.2)#350 |
| 10. | 92155 | 50.0% | 8.3%(+41.7)#10 | 9.8%(+40.2)#401 |
| 11. | 93522 | 50.0% | 8.3%(+41.7)#11 | 9.8%(+40.2)#412 |
| 12. | 92389 | 42.1% | 8.3%(+33.8)#12 | 9.8%(+32.3)#604 |
| 13. | 93249 | 40.9% | 8.3%(+32.6)#13 | 9.8%(+31.1)#630 |
| 14. | 93962 | 40.8% | 8.3%(+32.6)#14 | 9.8%(+31.0)#638 |
| 15. | 92386 | 40.1% | 8.3%(+31.9)#15 | 9.8%(+30.4)#667 |
| 16. | 94511 | 38.8% | 8.3%(+30.5)#16 | 9.8%(+29.0)#721 |
| 17. | 92317 | 38.2% | 8.3%(+29.9)#17 | 9.8%(+28.4)#744 |
| 18. | 95313 | 37.4% | 8.3%(+29.1)#18 | 9.8%(+27.6)#789 |
| 19. | 93409 | 35.4% | 8.3%(+27.2)#19 | 9.8%(+25.6)#912 |
| 20. | 96006 | 34.8% | 8.3%(+26.5)#20 | 9.8%(+25.0)#949 |
| 21. | 91917 | 32.5% | 8.3%(+24.3)#21 | 9.8%(+22.7)#1,100 |
| 22. | 95962 | 32.5% | 8.3%(+24.2)#22 | 9.8%(+22.7)#1,104 |
| 23. | 94573 | 31.6% | 8.3%(+23.3)#23 | 9.8%(+21.8)#1,169 |
| 24. | 96016 | 30.7% | 8.3%(+22.4)#24 | 9.8%(+20.9)#1,256 |
| 25. | 92384 | 30.4% | 8.3%(+22.2)#25 | 9.8%(+20.7)#1,277 |
| 26. | 95936 | 30.0% | 8.3%(+21.7)#26 | 9.8%(+20.2)#1,323 |
| 27. | 93932 | 29.8% | 8.3%(+21.6)#27 | 9.8%(+20.0)#1,335 |
| 28. | 95528 | 29.6% | 8.3%(+21.4)#28 | 9.8%(+19.8)#1,352 |
| 29. | 96051 | 28.9% | 8.3%(+20.7)#29 | 9.8%(+19.1)#1,418 |
| 30. | 91759 | 28.8% | 8.3%(+20.5)#30 | 9.8%(+19.0)#1,439 |
| 31. | 95312 | 28.6% | 8.3%(+20.3)#31 | 9.8%(+18.8)#1,473 |
| 32. | 95211 | 27.3% | 8.3%(+19.0)#32 | 9.8%(+17.5)#1,623 |
| 33. | 96013 | 27.0% | 8.3%(+18.7)#33 | 9.8%(+17.2)#1,667 |
| 34. | 95701 | 26.6% | 8.3%(+18.3)#34 | 9.8%(+16.8)#1,710 |
| 35. | 93040 | 25.6% | 8.3%(+17.3)#35 | 9.8%(+15.8)#1,842 |
| 36. | 92341 | 25.5% | 8.3%(+17.3)#36 | 9.8%(+15.8)#1,857 |
| 37. | 92285 | 25.1% | 8.3%(+16.8)#37 | 9.8%(+15.3)#1,927 |
| 38. | 92339 | 24.7% | 8.3%(+16.5)#38 | 9.8%(+14.9)#2,026 |
| 39. | 92378 | 24.5% | 8.3%(+16.2)#39 | 9.8%(+14.7)#2,060 |
| 40. | 95635 | 24.4% | 8.3%(+16.1)#40 | 9.8%(+14.6)#2,078 |
| 41. | 93252 | 23.9% | 8.3%(+15.6)#41 | 9.8%(+14.1)#2,172 |
| 42. | 93675 | 23.8% | 8.3%(+15.5)#42 | 9.8%(+14.0)#2,188 |
| 43. | 95493 | 23.4% | 8.3%(+15.1)#43 | 9.8%(+13.6)#2,290 |
| 44. | 91948 | 23.3% | 8.3%(+15.1)#44 | 9.8%(+13.6)#2,307 |
| 45. | 95019 | 23.3% | 8.3%(+15.1)#45 | 9.8%(+13.5)#2,308 |
| 46. | 93247 | 23.0% | 8.3%(+14.8)#46 | 9.8%(+13.2)#2,385 |
| 47. | 95237 | 22.9% | 8.3%(+14.6)#47 | 9.8%(+13.1)#2,406 |
| 48. | 93650 | 22.7% | 8.3%(+14.4)#48 | 9.8%(+12.9)#2,471 |
| 49. | 96084 | 22.6% | 8.3%(+14.4)#49 | 9.8%(+12.8)#2,476 |
| 50. | 93270 | 22.6% | 8.3%(+14.3)#50 | 9.8%(+12.8)#2,478 |
| 51. | 96052 | 22.2% | 8.3%(+14.0)#51 | 9.8%(+12.4)#2,570 |
| 52. | 95317 | 22.2% | 8.3%(+14.0)#52 | 9.8%(+12.4)#2,578 |
| 53. | 96011 | 22.2% | 8.3%(+14.0)#53 | 9.8%(+12.4)#2,598 |
| 54. | 95916 | 22.1% | 8.3%(+13.8)#54 | 9.8%(+12.3)#2,620 |
| 55. | 92036 | 22.1% | 8.3%(+13.8)#55 | 9.8%(+12.3)#2,623 |
| 56. | 95564 | 22.0% | 8.3%(+13.8)#56 | 9.8%(+12.3)#2,640 |
| 57. | 95374 | 21.8% | 8.3%(+13.6)#57 | 9.8%(+12.0)#2,693 |
| 58. | 92354 | 21.6% | 8.3%(+13.3)#58 | 9.8%(+11.8)#2,761 |
| 59. | 93256 | 21.6% | 8.3%(+13.3)#59 | 9.8%(+11.8)#2,767 |
| 60. | 92368 | 21.5% | 8.3%(+13.2)#60 | 9.8%(+11.7)#2,783 |
| 61. | 95323 | 20.9% | 8.3%(+12.7)#61 | 9.8%(+11.1)#2,988 |
| 62. | 95389 | 20.8% | 8.3%(+12.5)#62 | 9.8%(+11.0)#3,035 |
| 63. | 95717 | 20.6% | 8.3%(+12.3)#63 | 9.8%(+10.8)#3,119 |
| 64. | 95937 | 20.3% | 8.3%(+12.0)#64 | 9.8%(+10.5)#3,230 |
| 65. | 91916 | 20.2% | 8.3%(+12.0)#65 | 9.8%(+10.5)#3,247 |
| 66. | 95543 | 20.2% | 8.3%(+11.9)#66 | 9.8%(+10.4)#3,274 |
| 67. | 93276 | 20.0% | 8.3%(+11.7)#67 | 9.8%(+10.2)#3,385 |
| 68. | 95420 | 19.9% | 8.3%(+11.7)#68 | 9.8%(+10.1)#3,405 |
| 69. | 92391 | 19.9% | 8.3%(+11.6)#69 | 9.8%(+10.1)#3,419 |
| 70. | 92382 | 19.4% | 8.3%(+11.1)#70 | 9.8%(+9.58)#3,625 |
| 71. | 93723 | 19.2% | 8.3%(+11.0)#71 | 9.8%(+9.46)#3,676 |
| 72. | 90742 | 19.2% | 8.3%(+10.9)#72 | 9.8%(+9.42)#3,709 |
| 73. | 92301 | 19.2% | 8.3%(+10.9)#73 | 9.8%(+9.37)#3,730 |
| 74. | 95938 | 18.8% | 8.3%(+10.5)#74 | 9.8%(+9.02)#3,883 |
| 75. | 95665 | 18.8% | 8.3%(+10.5)#75 | 9.8%(+9.01)#3,887 |
| 76. | 92571 | 18.6% | 8.3%(+10.4)#76 | 9.8%(+8.85)#3,973 |
| 77. | 95542 | 18.6% | 8.3%(+10.3)#77 | 9.8%(+8.79)#4,005 |
| 78. | 95558 | 18.5% | 8.3%(+10.3)#78 | 9.8%(+8.74)#4,037 |
| 79. | 91752 | 18.3% | 8.3%(+10.1)#79 | 9.8%(+8.56)#4,122 |
| 80. | 94503 | 18.3% | 8.3%(+10.1)#80 | 9.8%(+8.55)#4,127 |
| 81. | 93926 | 18.0% | 8.3%(+9.73)#81 | 9.8%(+8.21)#4,327 |
| 82. | 95919 | 17.9% | 8.3%(+9.69)#82 | 9.8%(+8.17)#4,351 |
| 83. | 95645 | 17.9% | 8.3%(+9.66)#83 | 9.8%(+8.14)#4,368 |
| 84. | 93541 | 17.8% | 8.3%(+9.51)#84 | 9.8%(+7.99)#4,444 |
| 85. | 92359 | 17.6% | 8.3%(+9.38)#85 | 9.8%(+7.86)#4,531 |
| 86. | 93033 | 17.6% | 8.3%(+9.36)#86 | 9.8%(+7.84)#4,540 |
| 87. | 95252 | 17.6% | 8.3%(+9.35)#87 | 9.8%(+7.83)#4,544 |
| 88. | 93206 | 17.6% | 8.3%(+9.31)#88 | 9.8%(+7.79)#4,572 |
| 89. | 93602 | 17.6% | 8.3%(+9.30)#89 | 9.8%(+7.78)#4,577 |
| 90. | 95236 | 17.5% | 8.3%(+9.24)#90 | 9.8%(+7.72)#4,616 |
| 91. | 90263 | 17.5% | 8.3%(+9.20)#91 | 9.8%(+7.68)#4,652 |
| 92. | 92281 | 17.4% | 8.3%(+9.18)#92 | 9.8%(+7.66)#4,667 |
| 93. | 95212 | 17.4% | 8.3%(+9.18)#93 | 9.8%(+7.66)#4,672 |
| 94. | 91905 | 17.3% | 8.3%(+9.05)#94 | 9.8%(+7.53)#4,732 |
| 95. | 95917 | 17.2% | 8.3%(+8.97)#95 | 9.8%(+7.45)#4,773 |
| 96. | 93647 | 17.0% | 8.3%(+8.79)#96 | 9.8%(+7.27)#4,911 |
| 97. | 95316 | 16.9% | 8.3%(+8.69)#97 | 9.8%(+7.16)#4,990 |
| 98. | 94545 | 16.9% | 8.3%(+8.68)#98 | 9.8%(+7.16)#4,993 |
| 99. | 95220 | 16.9% | 8.3%(+8.67)#99 | 9.8%(+7.14)#5,002 |
| 100. | 93705 | 16.9% | 8.3%(+8.63)#100 | 9.8%(+7.11)#5,035 |
Common Questions
What are the Top 10 Zip Codes with the Highest Percentage of Population with a Degree in Science and Engineering in California?
Top 10 Zip Codes with the Highest Percentage of Population with a Degree in Science and Engineering in California are:
What zip code has the Highest Percentage of Population with a Degree in Science and Engineering in California?
96074 has the Highest Percentage of Population with a Degree in Science and Engineering in California with 100.0%.
What is the Percentage of Population with a Degree in Science and Engineering in the State of California?
Percentage of Population with a Degree in Science and Engineering in California is 8.3%.
What is the Percentage of Population with a Degree in Science and Engineering in the United States?
Percentage of Population with a Degree in Science and Engineering in the United States is 9.8%.