Cities with the Highest Percentage of Population with a Degree in Science and Engineering in Pennsylvania
RELATED REPORTS & OPTIONS
Science and Engineering
Pennsylvania
Compare Cities
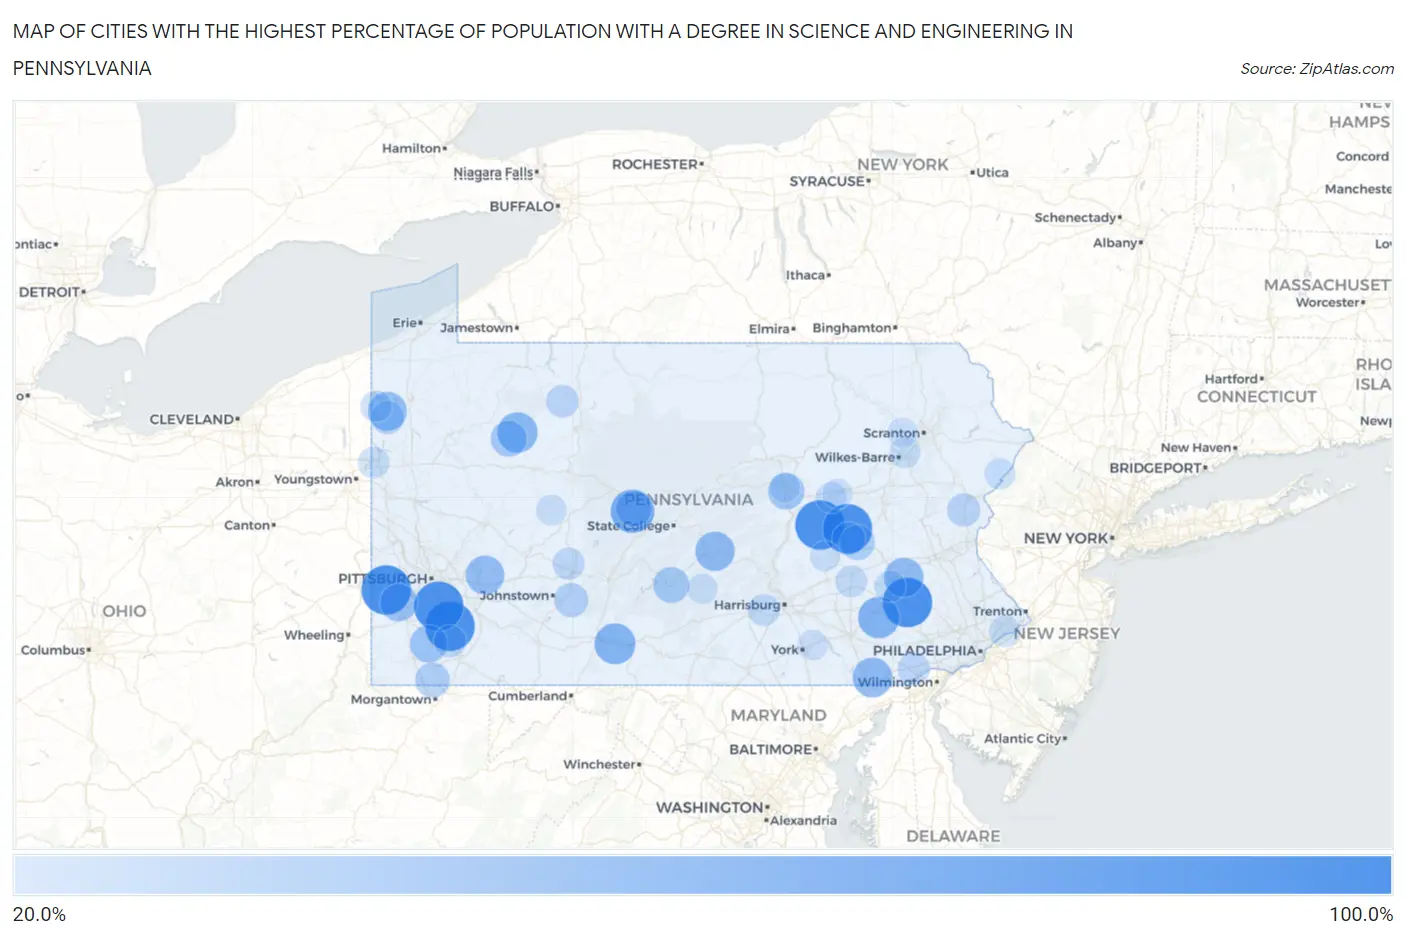
Map of Cities with the Highest Percentage of Population with a Degree in Science and Engineering in Pennsylvania
0.0%
100.0%
Cities with the Highest Percentage of Population with a Degree in Science and Engineering in Pennsylvania
| City | % Graduates | vs State | vs National | |
| 1. | Slovan | 100.0% | 10.9%(+89.1)#1 | 9.8%(+90.2)#32 |
| 2. | Arnold City | 100.0% | 10.9%(+89.1)#2 | 9.8%(+90.2)#46 |
| 3. | Tharptown Uniontown | 100.0% | 10.9%(+89.1)#3 | 9.8%(+90.2)#62 |
| 4. | Fountain Springs | 100.0% | 10.9%(+89.1)#4 | 9.8%(+90.2)#64 |
| 5. | Elrama | 100.0% | 10.9%(+89.1)#5 | 9.8%(+90.2)#69 |
| 6. | Casanova | 100.0% | 10.9%(+89.1)#6 | 9.8%(+90.2)#81 |
| 7. | Baumstown | 100.0% | 10.9%(+89.1)#7 | 9.8%(+90.2)#97 |
| 8. | Casselman Borough | 100.0% | 10.9%(+89.1)#8 | 9.8%(+90.2)#161 |
| 9. | Beavertown | 100.0% | 10.9%(+89.1)#9 | 9.8%(+90.2)#197 |
| 10. | South Philipsburg | 77.5% | 10.9%(+66.6)#10 | 9.8%(+67.7)#259 |
| 11. | Cassville Borough | 75.0% | 10.9%(+64.1)#11 | 9.8%(+65.2)#274 |
| 12. | Fivepointville | 69.6% | 10.9%(+58.7)#12 | 9.8%(+59.8)#306 |
| 13. | Henrietta | 68.8% | 10.9%(+57.9)#13 | 9.8%(+59.0)#311 |
| 14. | Earlston | 68.0% | 10.9%(+57.1)#14 | 9.8%(+58.2)#315 |
| 15. | Smicksburg Borough | 66.7% | 10.9%(+55.8)#15 | 9.8%(+56.9)#346 |
| 16. | Vowinckel | 65.4% | 10.9%(+54.5)#16 | 9.8%(+55.6)#354 |
| 17. | Little Britain | 63.2% | 10.9%(+52.3)#17 | 9.8%(+53.4)#365 |
| 18. | East Altoona | 62.5% | 10.9%(+51.6)#18 | 9.8%(+52.7)#373 |
| 19. | Walnuttown | 61.9% | 10.9%(+51.0)#19 | 9.8%(+52.1)#379 |
| 20. | Maitland | 61.9% | 10.9%(+51.0)#20 | 9.8%(+52.1)#380 |
| 21. | Slickville | 60.0% | 10.9%(+49.1)#21 | 9.8%(+50.2)#405 |
| 22. | Hartstown | 60.0% | 10.9%(+49.1)#22 | 9.8%(+50.2)#410 |
| 23. | West Middletown Borough | 55.6% | 10.9%(+44.7)#23 | 9.8%(+45.8)#473 |
| 24. | Ohiopyle Borough | 55.6% | 10.9%(+44.7)#24 | 9.8%(+45.8)#474 |
| 25. | Westland | 55.6% | 10.9%(+44.7)#25 | 9.8%(+45.8)#476 |
| 26. | Fredericktown | 54.9% | 10.9%(+44.0)#26 | 9.8%(+45.1)#482 |
| 27. | Runville | 52.1% | 10.9%(+41.3)#27 | 9.8%(+42.3)#519 |
| 28. | West Milton | 51.2% | 10.9%(+40.4)#28 | 9.8%(+41.4)#530 |
| 29. | Leeper | 50.0% | 10.9%(+39.1)#29 | 9.8%(+40.2)#592 |
| 30. | Cedar Crest | 50.0% | 10.9%(+39.1)#30 | 9.8%(+40.2)#613 |
| 31. | North Philipsburg | 48.7% | 10.9%(+37.8)#31 | 9.8%(+38.9)#648 |
| 32. | Rouseville Borough | 46.4% | 10.9%(+35.6)#32 | 9.8%(+36.6)#714 |
| 33. | Marlin | 45.7% | 10.9%(+34.9)#33 | 9.8%(+35.9)#727 |
| 34. | Claysville Borough | 45.4% | 10.9%(+34.5)#34 | 9.8%(+35.6)#736 |
| 35. | Bobtown | 44.8% | 10.9%(+33.9)#35 | 9.8%(+35.0)#748 |
| 36. | Worthville Borough | 44.4% | 10.9%(+33.6)#36 | 9.8%(+34.7)#775 |
| 37. | Salix | 42.4% | 10.9%(+31.5)#37 | 9.8%(+32.6)#856 |
| 38. | Smithton Borough | 42.4% | 10.9%(+31.5)#38 | 9.8%(+32.6)#858 |
| 39. | Lanesboro Borough | 40.0% | 10.9%(+29.1)#39 | 9.8%(+30.2)#945 |
| 40. | Troutville Borough | 40.0% | 10.9%(+29.1)#40 | 9.8%(+30.2)#960 |
| 41. | Adamsville | 40.0% | 10.9%(+29.1)#41 | 9.8%(+30.2)#975 |
| 42. | Saylorsburg | 39.4% | 10.9%(+28.6)#42 | 9.8%(+29.6)#992 |
| 43. | Buck Run | 38.9% | 10.9%(+28.0)#43 | 9.8%(+29.1)#1,021 |
| 44. | Stillwater Borough | 37.9% | 10.9%(+27.1)#44 | 9.8%(+28.1)#1,073 |
| 45. | James City | 37.5% | 10.9%(+26.6)#45 | 9.8%(+27.7)#1,099 |
| 46. | Skelp | 37.5% | 10.9%(+26.6)#46 | 9.8%(+27.7)#1,105 |
| 47. | Oakland Cdp Lawrence County | 36.9% | 10.9%(+26.1)#47 | 9.8%(+27.2)#1,125 |
| 48. | Grindstone | 36.2% | 10.9%(+25.3)#48 | 9.8%(+26.4)#1,160 |
| 49. | Colver | 36.1% | 10.9%(+25.2)#49 | 9.8%(+26.3)#1,164 |
| 50. | Toughkenamon | 35.9% | 10.9%(+25.1)#50 | 9.8%(+26.1)#1,178 |
| 51. | Avoca Borough | 35.4% | 10.9%(+24.6)#51 | 9.8%(+25.7)#1,208 |
| 52. | Farwell | 35.4% | 10.9%(+24.5)#52 | 9.8%(+25.6)#1,210 |
| 53. | Ehrenfeld Borough | 35.3% | 10.9%(+24.4)#53 | 9.8%(+25.5)#1,218 |
| 54. | Coudersport Borough | 35.0% | 10.9%(+24.1)#54 | 9.8%(+25.2)#1,243 |
| 55. | New Kingstown | 34.9% | 10.9%(+24.0)#55 | 9.8%(+25.1)#1,246 |
| 56. | Mount Aetna | 34.8% | 10.9%(+23.9)#56 | 9.8%(+25.0)#1,252 |
| 57. | Madison Borough | 34.8% | 10.9%(+23.9)#57 | 9.8%(+25.0)#1,253 |
| 58. | Salona | 34.1% | 10.9%(+23.3)#58 | 9.8%(+24.4)#1,286 |
| 59. | Eddington | 33.7% | 10.9%(+22.9)#59 | 9.8%(+23.9)#1,300 |
| 60. | Farrell | 33.3% | 10.9%(+22.5)#60 | 9.8%(+23.6)#1,311 |
| 61. | Vanderbilt Borough | 33.3% | 10.9%(+22.5)#61 | 9.8%(+23.6)#1,336 |
| 62. | Dudley Borough | 33.3% | 10.9%(+22.5)#62 | 9.8%(+23.6)#1,354 |
| 63. | Atwood Borough | 33.3% | 10.9%(+22.5)#63 | 9.8%(+23.6)#1,359 |
| 64. | Shirleysburg Borough | 33.3% | 10.9%(+22.5)#64 | 9.8%(+23.6)#1,366 |
| 65. | Utica Borough | 33.3% | 10.9%(+22.5)#65 | 9.8%(+23.6)#1,380 |
| 66. | Riverview Park | 33.3% | 10.9%(+22.4)#66 | 9.8%(+23.5)#1,414 |
| 67. | Roaring Spring Borough | 32.9% | 10.9%(+22.1)#67 | 9.8%(+23.1)#1,424 |
| 68. | Pymatuning Central | 32.7% | 10.9%(+21.9)#68 | 9.8%(+23.0)#1,433 |
| 69. | Central City Borough | 32.6% | 10.9%(+21.7)#69 | 9.8%(+22.8)#1,441 |
| 70. | Nottingham | 32.3% | 10.9%(+21.5)#70 | 9.8%(+22.6)#1,457 |
| 71. | Hudson | 32.1% | 10.9%(+21.3)#71 | 9.8%(+22.3)#1,475 |
| 72. | Austin Borough | 32.0% | 10.9%(+21.1)#72 | 9.8%(+22.2)#1,478 |
| 73. | Pine Ridge | 31.7% | 10.9%(+20.9)#73 | 9.8%(+22.0)#1,500 |
| 74. | Nanty Glo Borough | 31.6% | 10.9%(+20.8)#74 | 9.8%(+21.9)#1,504 |
| 75. | Rupert | 31.6% | 10.9%(+20.7)#75 | 9.8%(+21.8)#1,513 |
| 76. | Brisbin Borough | 31.2% | 10.9%(+20.3)#76 | 9.8%(+21.4)#1,557 |
| 77. | East Vandergrift Borough | 31.1% | 10.9%(+20.2)#77 | 9.8%(+21.3)#1,559 |
| 78. | Warrior Run Borough | 31.0% | 10.9%(+20.2)#78 | 9.8%(+21.3)#1,570 |
| 79. | Rossiter | 30.4% | 10.9%(+19.6)#79 | 9.8%(+20.7)#1,628 |
| 80. | Hop Bottom Borough | 30.0% | 10.9%(+19.1)#80 | 9.8%(+20.2)#1,670 |
| 81. | Woodcock Borough | 30.0% | 10.9%(+19.1)#81 | 9.8%(+20.2)#1,682 |
| 82. | Holters Crossing | 30.0% | 10.9%(+19.1)#82 | 9.8%(+20.2)#1,685 |
| 83. | Sligo Borough | 29.9% | 10.9%(+19.1)#83 | 9.8%(+20.1)#1,695 |
| 84. | Mayfield Borough | 29.7% | 10.9%(+18.9)#84 | 9.8%(+19.9)#1,708 |
| 85. | Northampton Borough | 29.7% | 10.9%(+18.8)#85 | 9.8%(+19.9)#1,724 |
| 86. | Yorklyn | 29.6% | 10.9%(+18.8)#86 | 9.8%(+19.9)#1,725 |
| 87. | East Waterford | 29.6% | 10.9%(+18.8)#87 | 9.8%(+19.8)#1,729 |
| 88. | Orwin | 29.4% | 10.9%(+18.6)#88 | 9.8%(+19.6)#1,752 |
| 89. | Georgetown Borough | 29.4% | 10.9%(+18.6)#89 | 9.8%(+19.6)#1,755 |
| 90. | Red Hill | 29.4% | 10.9%(+18.6)#90 | 9.8%(+19.6)#1,756 |
| 91. | Sandy Lake Borough | 29.2% | 10.9%(+18.4)#91 | 9.8%(+19.5)#1,772 |
| 92. | New Columbia | 29.0% | 10.9%(+18.2)#92 | 9.8%(+19.3)#1,803 |
| 93. | Stoneboro Borough | 28.9% | 10.9%(+18.1)#93 | 9.8%(+19.2)#1,817 |
| 94. | Hallam Borough | 28.9% | 10.9%(+18.1)#94 | 9.8%(+19.1)#1,823 |
| 95. | Mcsherrystown Borough | 28.9% | 10.9%(+18.0)#95 | 9.8%(+19.1)#1,827 |
| 96. | Espy | 28.7% | 10.9%(+17.9)#96 | 9.8%(+18.9)#1,838 |
| 97. | Versailles Borough | 28.6% | 10.9%(+17.7)#97 | 9.8%(+18.8)#1,849 |
| 98. | Upper Exeter | 28.6% | 10.9%(+17.7)#98 | 9.8%(+18.8)#1,851 |
| 99. | Newry Borough | 28.6% | 10.9%(+17.7)#99 | 9.8%(+18.8)#1,877 |
| 100. | Chest Springs Borough | 28.6% | 10.9%(+17.7)#100 | 9.8%(+18.8)#1,887 |
Common Questions
What are the Top 10 Cities with the Highest Percentage of Population with a Degree in Science and Engineering in Pennsylvania?
Top 10 Cities with the Highest Percentage of Population with a Degree in Science and Engineering in Pennsylvania are:
#1
100.0%
#2
100.0%
#3
100.0%
#4
100.0%
#5
100.0%
#6
100.0%
#7
77.5%
#8
69.6%
#9
68.0%
#10
65.4%
What city has the Highest Percentage of Population with a Degree in Science and Engineering in Pennsylvania?
Slovan has the Highest Percentage of Population with a Degree in Science and Engineering in Pennsylvania with 100.0%.
What is the Percentage of Population with a Degree in Science and Engineering in the State of Pennsylvania?
Percentage of Population with a Degree in Science and Engineering in Pennsylvania is 10.9%.
What is the Percentage of Population with a Degree in Science and Engineering in the United States?
Percentage of Population with a Degree in Science and Engineering in the United States is 9.8%.