Geyserville, CA Map & Demographics
Geyserville Map

Geyserville Overview
$46,724
PER CAPITA INCOME
$127,031
AVG FAMILY INCOME
$115,046
AVG HOUSEHOLD INCOME
9.4%
WAGE / INCOME GAP [ % ]
90.6¢/ $1
WAGE / INCOME GAP [ $ ]
0.38
INEQUALITY / GINI INDEX
837
TOTAL POPULATION
474
MALE POPULATION
363
FEMALE POPULATION
130.58
MALES / 100 FEMALES
76.58
FEMALES / 100 MALES
58.0
MEDIAN AGE
2.9
AVG FAMILY SIZE
2.4
AVG HOUSEHOLD SIZE
484
LABOR FORCE [ PEOPLE ]
66.4%
PERCENT IN LABOR FORCE
6.6%
UNEMPLOYMENT RATE
Geyserville Zip Codes
Geyserville Area Codes
Income in Geyserville
Income Overview in Geyserville
Per Capita Income in Geyserville is $46,724, while median incomes of families and households are $127,031 and $115,046 respectively.
| Characteristic | Number | Measure |
| Per Capita Income | 837 | $46,724 |
| Median Family Income | 241 | $127,031 |
| Mean Family Income | 241 | $133,999 |
| Median Household Income | 345 | $115,046 |
| Mean Household Income | 345 | $112,669 |
| Income Deficit | 241 | $0 |
| Wage / Income Gap (%) | 837 | 9.41% |
| Wage / Income Gap ($) | 837 | 90.59¢ per $1 |
| Gini / Inequality Index | 837 | 0.38 |
Earnings by Sex in Geyserville
Average Earnings in Geyserville are $46,992, $46,071 for men and $50,859 for women, a difference of 9.4%.
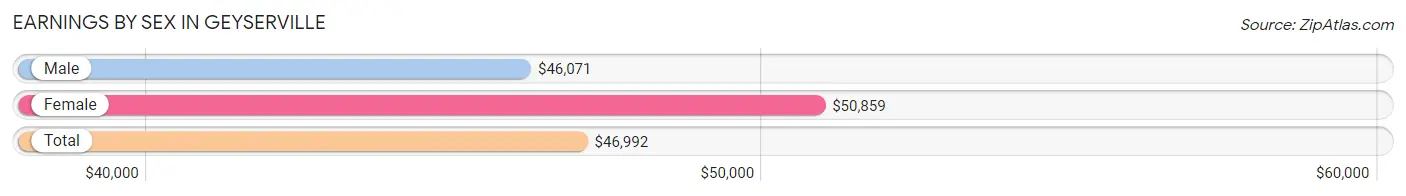
| Sex | Number | Average Earnings |
| Male | 300 (58.3%) | $46,071 |
| Female | 215 (41.7%) | $50,859 |
| Total | 515 (100.0%) | $46,992 |
Earnings by Sex by Income Bracket in Geyserville
The most common earnings brackets in Geyserville are $100,000+ for men (62 | 20.7%) and $65,000 to $74,999 for women (34 | 15.8%).
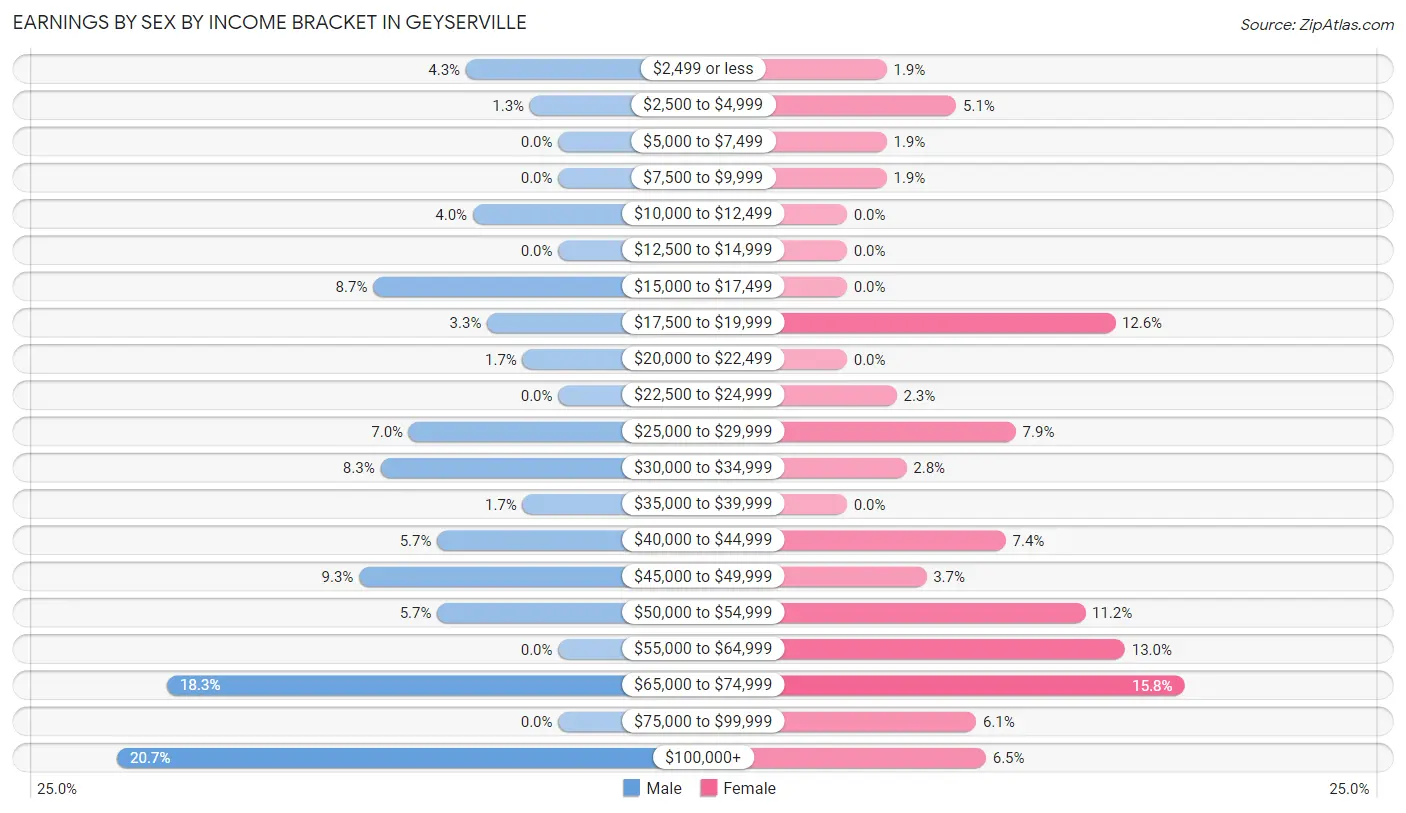
| Income | Male | Female |
| $2,499 or less | 13 (4.3%) | 4 (1.9%) |
| $2,500 to $4,999 | 4 (1.3%) | 11 (5.1%) |
| $5,000 to $7,499 | 0 (0.0%) | 4 (1.9%) |
| $7,500 to $9,999 | 0 (0.0%) | 4 (1.9%) |
| $10,000 to $12,499 | 12 (4.0%) | 0 (0.0%) |
| $12,500 to $14,999 | 0 (0.0%) | 0 (0.0%) |
| $15,000 to $17,499 | 26 (8.7%) | 0 (0.0%) |
| $17,500 to $19,999 | 10 (3.3%) | 27 (12.6%) |
| $20,000 to $22,499 | 5 (1.7%) | 0 (0.0%) |
| $22,500 to $24,999 | 0 (0.0%) | 5 (2.3%) |
| $25,000 to $29,999 | 21 (7.0%) | 17 (7.9%) |
| $30,000 to $34,999 | 25 (8.3%) | 6 (2.8%) |
| $35,000 to $39,999 | 5 (1.7%) | 0 (0.0%) |
| $40,000 to $44,999 | 17 (5.7%) | 16 (7.4%) |
| $45,000 to $49,999 | 28 (9.3%) | 8 (3.7%) |
| $50,000 to $54,999 | 17 (5.7%) | 24 (11.2%) |
| $55,000 to $64,999 | 0 (0.0%) | 28 (13.0%) |
| $65,000 to $74,999 | 55 (18.3%) | 34 (15.8%) |
| $75,000 to $99,999 | 0 (0.0%) | 13 (6.0%) |
| $100,000+ | 62 (20.7%) | 14 (6.5%) |
| Total | 300 (100.0%) | 215 (100.0%) |
Earnings by Sex by Educational Attainment in Geyserville
Average earnings in Geyserville are $46,161 for men and $54,219 for women, a difference of 14.9%. Men with an educational attainment of bachelor's degree enjoy the highest average annual earnings of $110,962, while those with graduate degree education earn the least with $38,000. Women with an educational attainment of bachelor's degree earn the most with the average annual earnings of $77,596, while those with high school diploma education have the smallest earnings of $51,979.
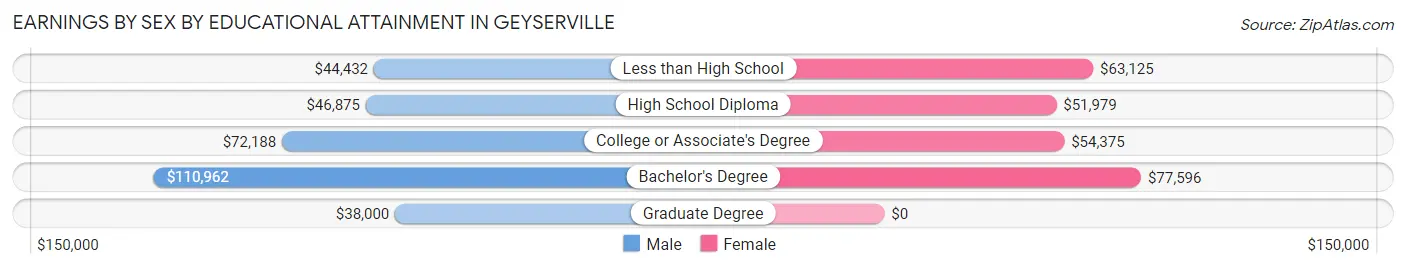
| Educational Attainment | Male Income | Female Income |
| Less than High School | $44,432 | $63,125 |
| High School Diploma | $46,875 | $51,979 |
| College or Associate's Degree | $72,188 | $54,375 |
| Bachelor's Degree | $110,962 | $77,596 |
| Graduate Degree | $38,000 | $0 |
| Total | $46,161 | $54,219 |
Family Income in Geyserville
Family Income Brackets in Geyserville
According to the Geyserville family income data, there are 76 families falling into the $100,000 to $149,999 income range, which is the most common income bracket and makes up 31.5% of all families.
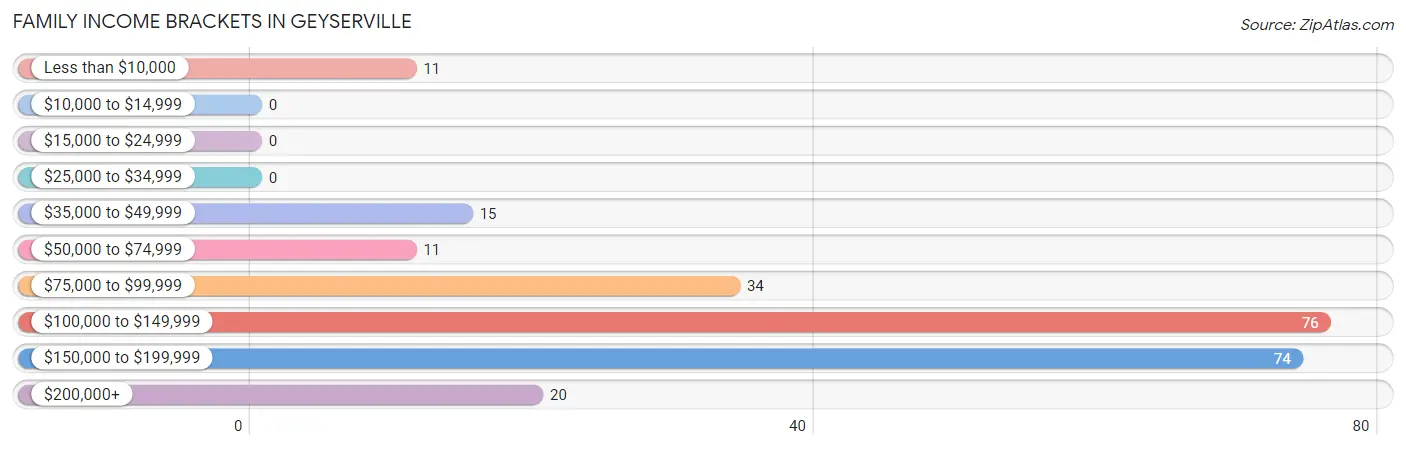
| Income Bracket | # Families | % Families |
| Less than $10,000 | 11 | 4.6% |
| $10,000 to $14,999 | 0 | 0.0% |
| $15,000 to $24,999 | 0 | 0.0% |
| $25,000 to $34,999 | 0 | 0.0% |
| $35,000 to $49,999 | 15 | 6.2% |
| $50,000 to $74,999 | 11 | 4.6% |
| $75,000 to $99,999 | 34 | 14.1% |
| $100,000 to $149,999 | 76 | 31.5% |
| $150,000 to $199,999 | 74 | 30.7% |
| $200,000+ | 20 | 8.3% |
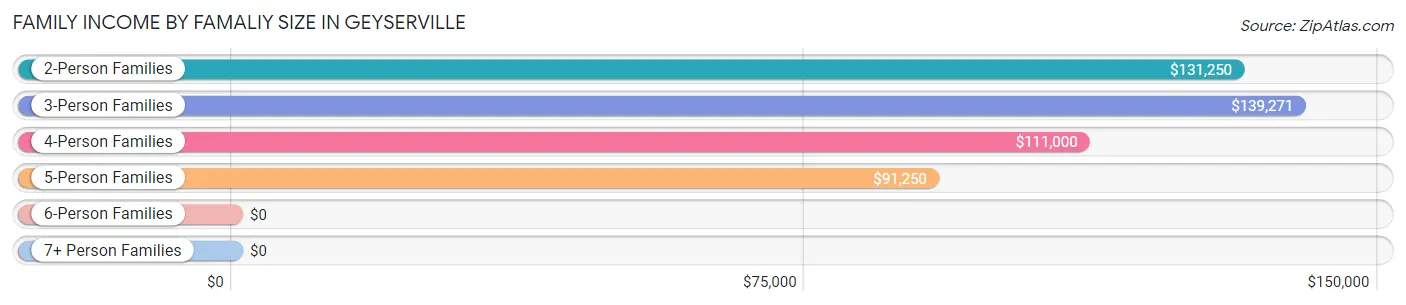
Family Income by Famaliy Size in Geyserville
3-person families (35 | 14.5%) account for the highest median family income in Geyserville with $139,271 per family, while 2-person families (156 | 64.7%) have the highest median income of $65,625 per family member.
| Income Bracket | # Families | Median Income |
| 2-Person Families | 156 (64.7%) | $131,250 |
| 3-Person Families | 35 (14.5%) | $139,271 |
| 4-Person Families | 18 (7.5%) | $111,000 |
| 5-Person Families | 20 (8.3%) | $91,250 |
| 6-Person Families | 0 (0.0%) | $0 |
| 7+ Person Families | 12 (5.0%) | $0 |
| Total | 241 (100.0%) | $127,031 |
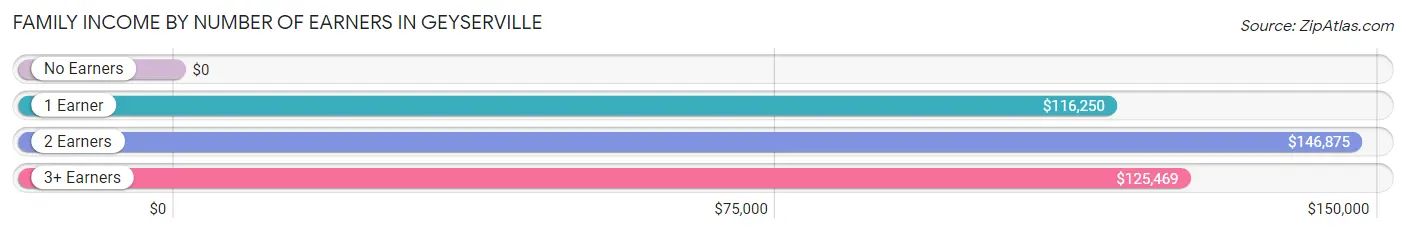
Family Income by Number of Earners in Geyserville
| Number of Earners | # Families | Median Income |
| No Earners | 54 (22.4%) | $0 |
| 1 Earner | 20 (8.3%) | $116,250 |
| 2 Earners | 106 (44.0%) | $146,875 |
| 3+ Earners | 61 (25.3%) | $125,469 |
| Total | 241 (100.0%) | $127,031 |
Household Income in Geyserville
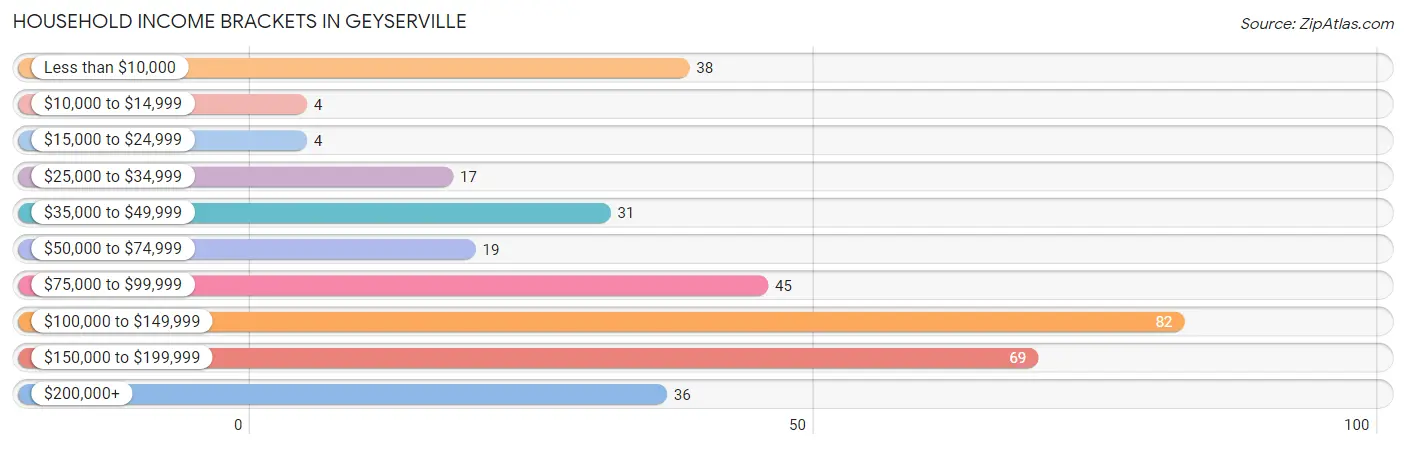
Household Income Brackets in Geyserville
With 82 households falling in the category, the $100,000 to $149,999 income range is the most frequent in Geyserville, accounting for 23.8% of all households. In contrast, only 4 households (1.2%) fall into the $10,000 to $14,999 income bracket, making it the least populous group.
| Income Bracket | # Households | % Households |
| Less than $10,000 | 38 | 11.0% |
| $10,000 to $14,999 | 4 | 1.2% |
| $15,000 to $24,999 | 4 | 1.2% |
| $25,000 to $34,999 | 17 | 4.9% |
| $35,000 to $49,999 | 31 | 9.0% |
| $50,000 to $74,999 | 19 | 5.5% |
| $75,000 to $99,999 | 45 | 13.0% |
| $100,000 to $149,999 | 82 | 23.8% |
| $150,000 to $199,999 | 69 | 20.0% |
| $200,000+ | 36 | 10.4% |
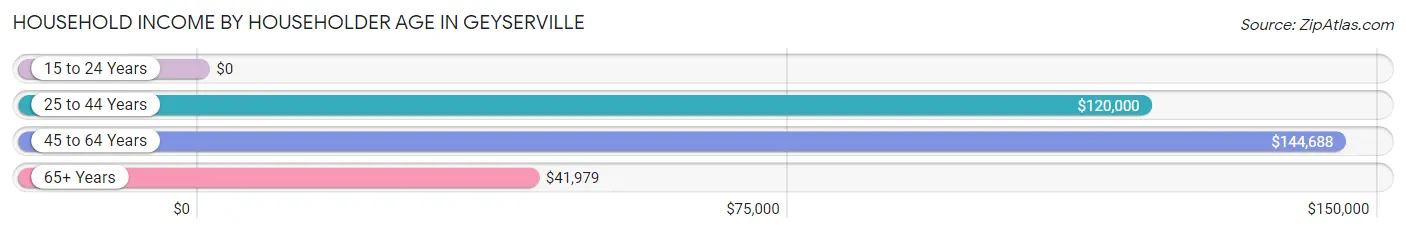
Household Income by Householder Age in Geyserville
The median household income in Geyserville is $115,046, with the highest median household income of $144,688 found in the 45 to 64 years age bracket for the primary householder. A total of 147 households (42.6%) fall into this category. Meanwhile, the 15 to 24 years age bracket for the primary householder has the lowest median household income of $0, with 11 households (3.2%) in this group.
| Income Bracket | # Households | Median Income |
| 15 to 24 Years | 11 (3.2%) | $0 |
| 25 to 44 Years | 50 (14.5%) | $120,000 |
| 45 to 64 Years | 147 (42.6%) | $144,688 |
| 65+ Years | 137 (39.7%) | $41,979 |
| Total | 345 (100.0%) | $115,046 |
Poverty in Geyserville
Income Below Poverty by Sex and Age in Geyserville
With 8.9% poverty level for males and 7.4% for females among the residents of Geyserville, 65 to 74 year old males and 65 to 74 year old females are the most vulnerable to poverty, with 38 males (28.1%) and 16 females (23.9%) in their respective age groups living below the poverty level.
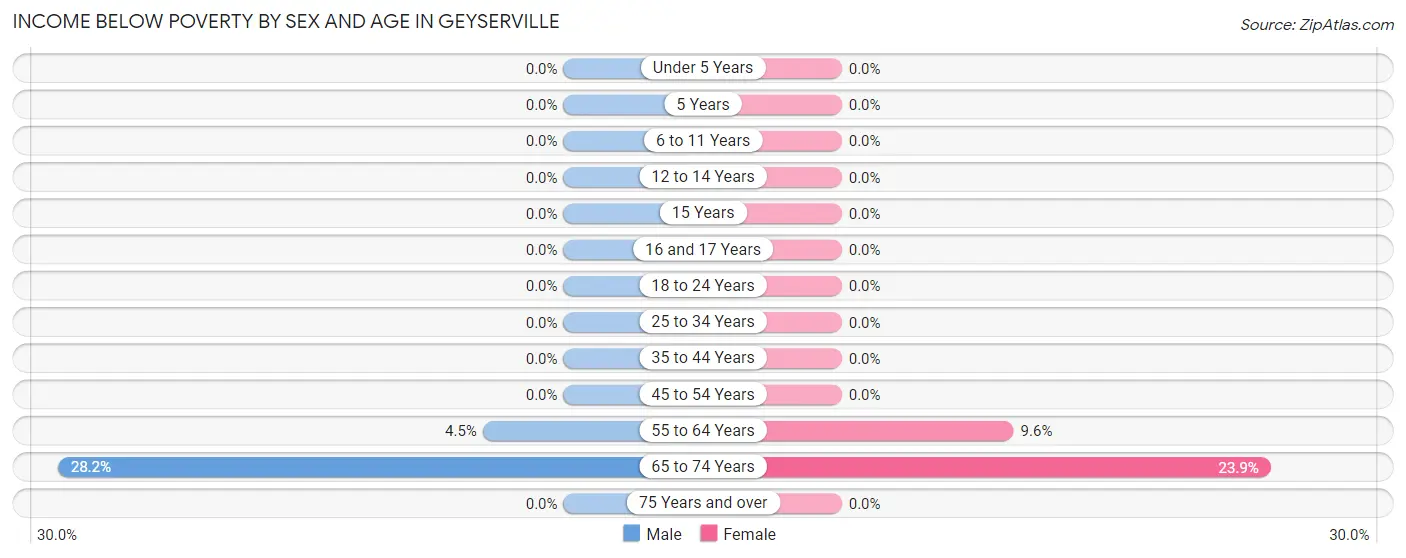
| Age Bracket | Male | Female |
| Under 5 Years | 0 (0.0%) | 0 (0.0%) |
| 5 Years | 0 (0.0%) | 0 (0.0%) |
| 6 to 11 Years | 0 (0.0%) | 0 (0.0%) |
| 12 to 14 Years | 0 (0.0%) | 0 (0.0%) |
| 15 Years | 0 (0.0%) | 0 (0.0%) |
| 16 and 17 Years | 0 (0.0%) | 0 (0.0%) |
| 18 to 24 Years | 0 (0.0%) | 0 (0.0%) |
| 25 to 34 Years | 0 (0.0%) | 0 (0.0%) |
| 35 to 44 Years | 0 (0.0%) | 0 (0.0%) |
| 45 to 54 Years | 0 (0.0%) | 0 (0.0%) |
| 55 to 64 Years | 4 (4.5%) | 11 (9.6%) |
| 65 to 74 Years | 38 (28.1%) | 16 (23.9%) |
| 75 Years and over | 0 (0.0%) | 0 (0.0%) |
| Total | 42 (8.9%) | 27 (7.4%) |
Income Above Poverty by Sex and Age in Geyserville
According to the poverty statistics in Geyserville, males aged under 5 years and females aged 6 to 11 years are the age groups that are most secure financially, with 100.0% of males and 100.0% of females in these age groups living above the poverty line.
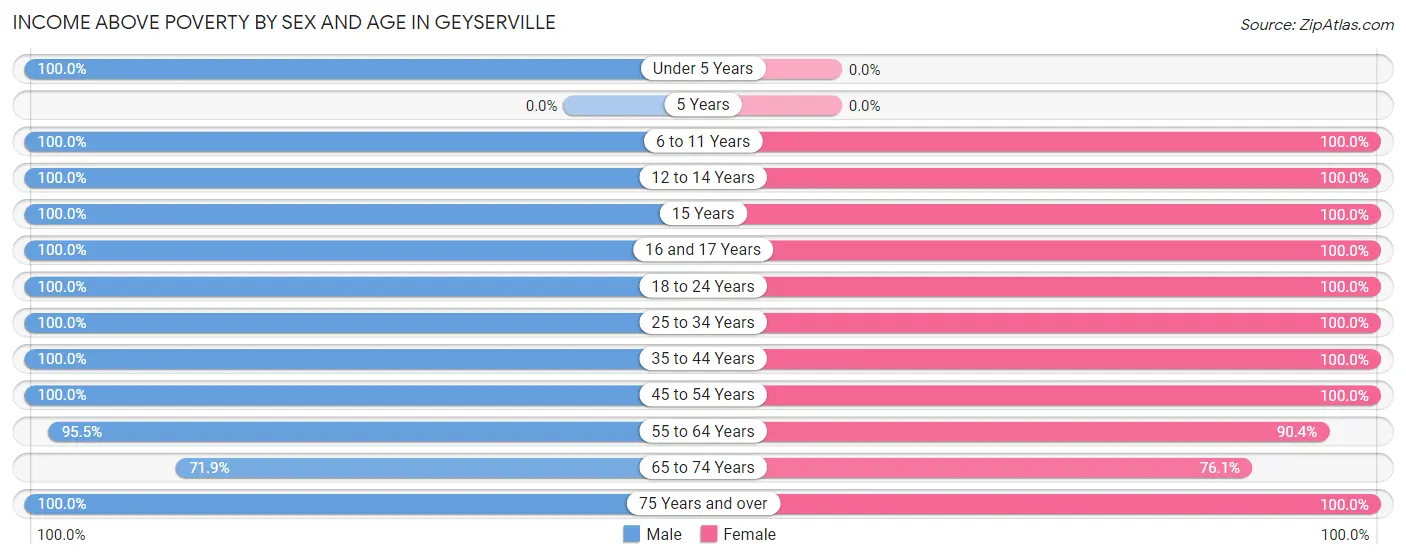
| Age Bracket | Male | Female |
| Under 5 Years | 23 (100.0%) | 0 (0.0%) |
| 5 Years | 0 (0.0%) | 0 (0.0%) |
| 6 to 11 Years | 15 (100.0%) | 32 (100.0%) |
| 12 to 14 Years | 21 (100.0%) | 8 (100.0%) |
| 15 Years | 5 (100.0%) | 4 (100.0%) |
| 16 and 17 Years | 4 (100.0%) | 4 (100.0%) |
| 18 to 24 Years | 20 (100.0%) | 28 (100.0%) |
| 25 to 34 Years | 31 (100.0%) | 19 (100.0%) |
| 35 to 44 Years | 54 (100.0%) | 41 (100.0%) |
| 45 to 54 Years | 37 (100.0%) | 35 (100.0%) |
| 55 to 64 Years | 85 (95.5%) | 104 (90.4%) |
| 65 to 74 Years | 97 (71.9%) | 51 (76.1%) |
| 75 Years and over | 40 (100.0%) | 10 (100.0%) |
| Total | 432 (91.1%) | 336 (92.6%) |
Income Below Poverty Among Married-Couple Families in Geyserville
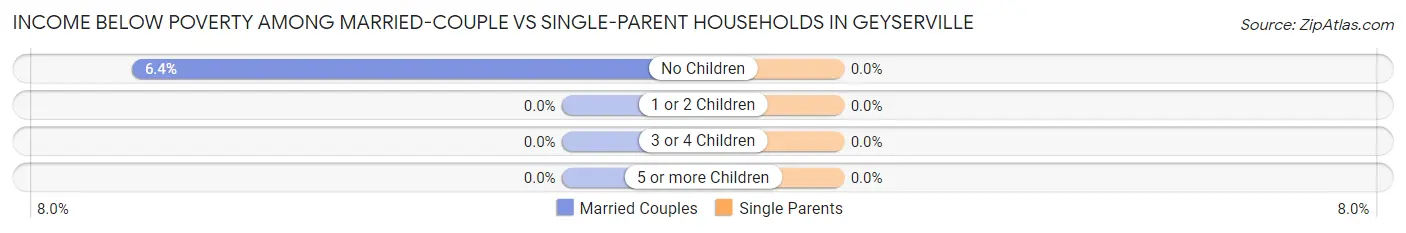
The poverty statistics for married-couple families in Geyserville show that 5.2% or 11 of the total 212 families live below the poverty line. Families with no children have the highest poverty rate of 6.4%, comprising of 11 families. On the other hand, families with 1 or 2 children have the lowest poverty rate of 0.0%, which includes 0 families.
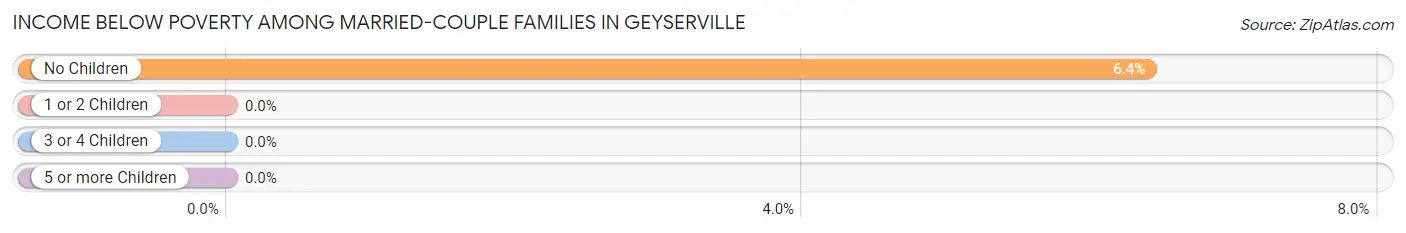
| Children | Above Poverty | Below Poverty |
| No Children | 161 (93.6%) | 11 (6.4%) |
| 1 or 2 Children | 32 (100.0%) | 0 (0.0%) |
| 3 or 4 Children | 8 (100.0%) | 0 (0.0%) |
| 5 or more Children | 0 (0.0%) | 0 (0.0%) |
| Total | 201 (94.8%) | 11 (5.2%) |
Income Below Poverty Among Single-Parent Households in Geyserville
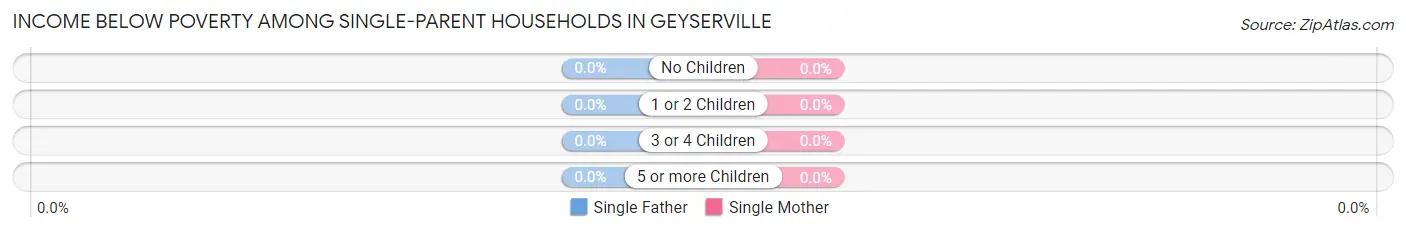
| Children | Single Father | Single Mother |
| No Children | 0 (0.0%) | 0 (0.0%) |
| 1 or 2 Children | 0 (0.0%) | 0 (0.0%) |
| 3 or 4 Children | 0 (0.0%) | 0 (0.0%) |
| 5 or more Children | 0 (0.0%) | 0 (0.0%) |
| Total | 0 (0.0%) | 0 (0.0%) |
Income Below Poverty Among Married-Couple vs Single-Parent Households in Geyserville
| Children | Married-Couple Families | Single-Parent Households |
| No Children | 11 (6.4%) | 0 (0.0%) |
| 1 or 2 Children | 0 (0.0%) | 0 (0.0%) |
| 3 or 4 Children | 0 (0.0%) | 0 (0.0%) |
| 5 or more Children | 0 (0.0%) | 0 (0.0%) |
| Total | 11 (5.2%) | 0 (0.0%) |
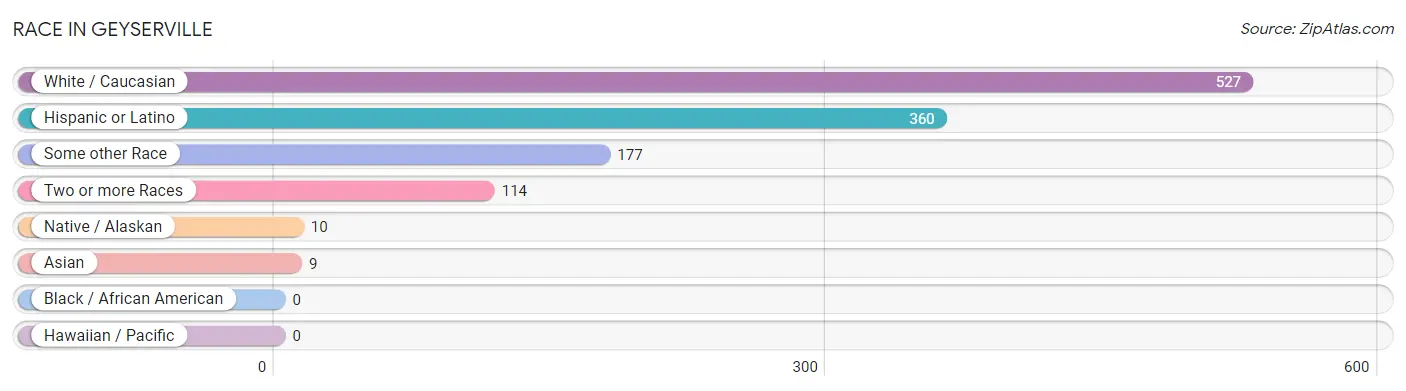
Race in Geyserville
The most populous races in Geyserville are White / Caucasian (527 | 63.0%), Hispanic or Latino (360 | 43.0%), and Some other Race (177 | 21.1%).
| Race | # Population | % Population |
| Asian | 9 | 1.1% |
| Black / African American | 0 | 0.0% |
| Hawaiian / Pacific | 0 | 0.0% |
| Hispanic or Latino | 360 | 43.0% |
| Native / Alaskan | 10 | 1.2% |
| White / Caucasian | 527 | 63.0% |
| Two or more Races | 114 | 13.6% |
| Some other Race | 177 | 21.1% |
| Total | 837 | 100.0% |
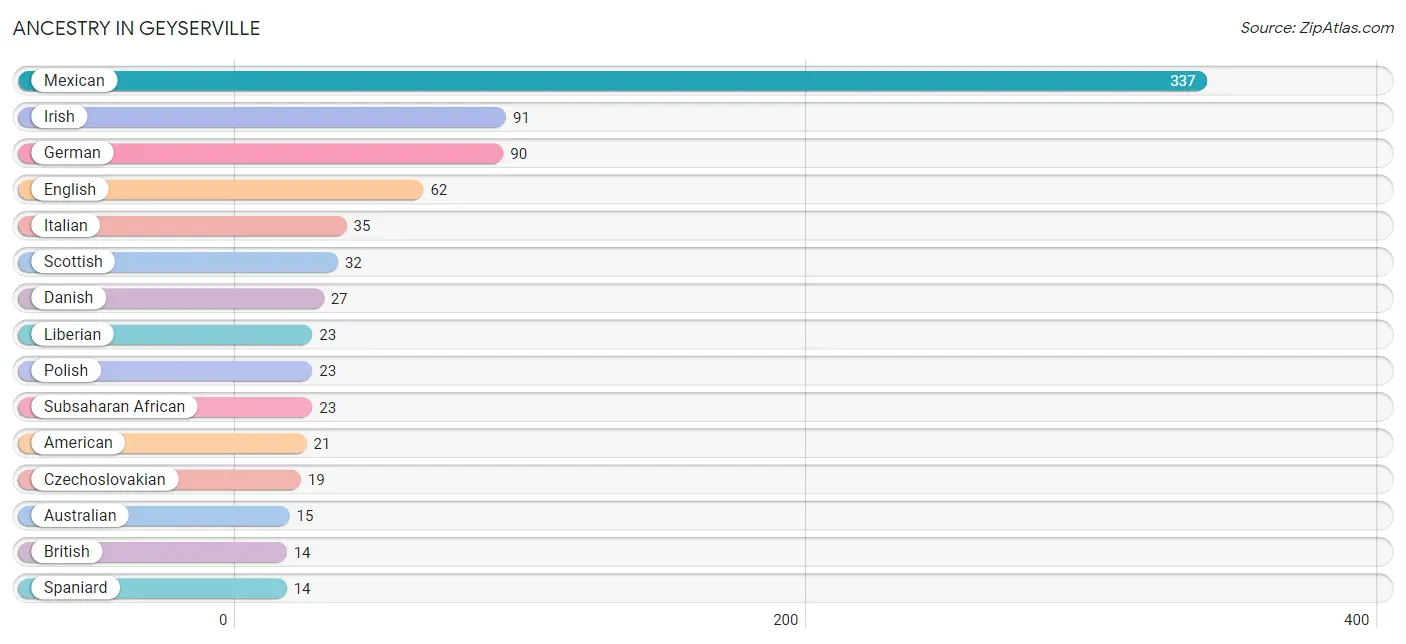
Ancestry in Geyserville
The most populous ancestries reported in Geyserville are Mexican (337 | 40.3%), Irish (91 | 10.9%), German (90 | 10.7%), English (62 | 7.4%), and Italian (35 | 4.2%), together accounting for 73.5% of all Geyserville residents.
| Ancestry | # Population | % Population |
| Afghan | 9 | 1.1% |
| American | 21 | 2.5% |
| Arab | 5 | 0.6% |
| Armenian | 4 | 0.5% |
| Australian | 15 | 1.8% |
| Basque | 4 | 0.5% |
| Belgian | 10 | 1.2% |
| British | 14 | 1.7% |
| Burmese | 4 | 0.5% |
| Czechoslovakian | 19 | 2.3% |
| Danish | 27 | 3.2% |
| Eastern European | 4 | 0.5% |
| Ecuadorian | 4 | 0.5% |
| English | 62 | 7.4% |
| European | 5 | 0.6% |
| French | 13 | 1.5% |
| German | 90 | 10.7% |
| Hungarian | 4 | 0.5% |
| Irish | 91 | 10.9% |
| Italian | 35 | 4.2% |
| Liberian | 23 | 2.8% |
| Mexican | 337 | 40.3% |
| Norwegian | 4 | 0.5% |
| Polish | 23 | 2.8% |
| Portuguese | 4 | 0.5% |
| Russian | 4 | 0.5% |
| Samoan | 4 | 0.5% |
| Scottish | 32 | 3.8% |
| Slovak | 5 | 0.6% |
| South American | 4 | 0.5% |
| Spaniard | 14 | 1.7% |
| Spanish | 5 | 0.6% |
| Subsaharan African | 23 | 2.8% |
| Swiss | 3 | 0.4% | View All 34 Rows |
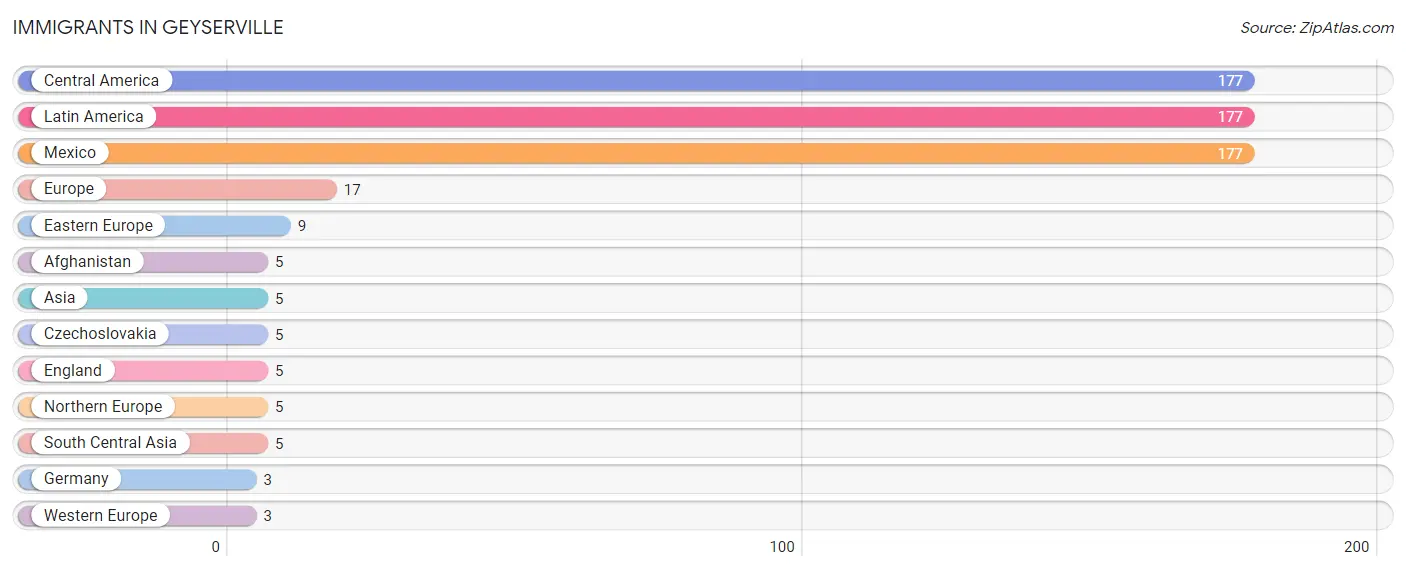
Immigrants in Geyserville
The most numerous immigrant groups reported in Geyserville came from Central America (177 | 21.1%), Latin America (177 | 21.1%), Mexico (177 | 21.1%), Europe (17 | 2.0%), and Eastern Europe (9 | 1.1%), together accounting for 66.6% of all Geyserville residents.
| Immigration Origin | # Population | % Population |
| Afghanistan | 5 | 0.6% |
| Asia | 5 | 0.6% |
| Central America | 177 | 21.1% |
| Czechoslovakia | 5 | 0.6% |
| Eastern Europe | 9 | 1.1% |
| England | 5 | 0.6% |
| Europe | 17 | 2.0% |
| Germany | 3 | 0.4% |
| Latin America | 177 | 21.1% |
| Mexico | 177 | 21.1% |
| Northern Europe | 5 | 0.6% |
| South Central Asia | 5 | 0.6% |
| Western Europe | 3 | 0.4% | View All 13 Rows |
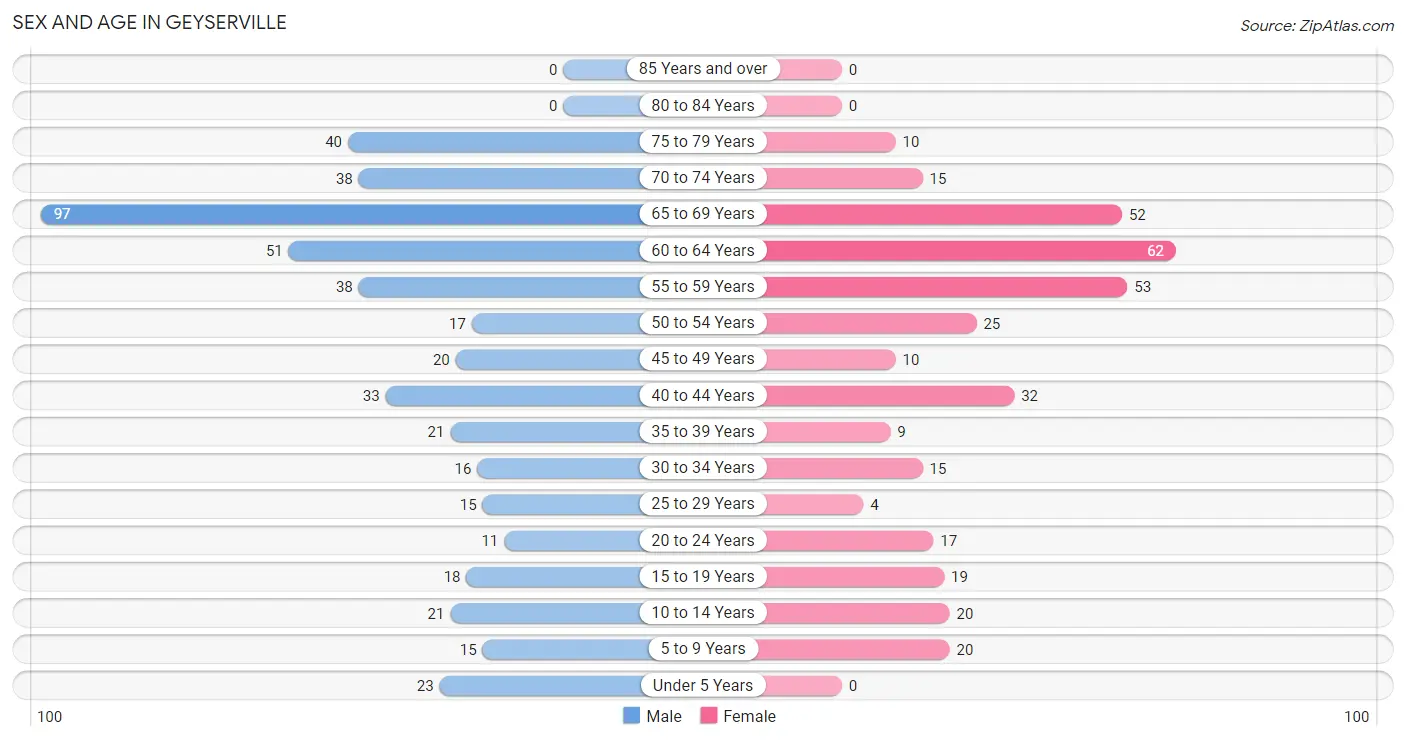
Sex and Age in Geyserville
Sex and Age in Geyserville
The most populous age groups in Geyserville are 65 to 69 Years (97 | 20.5%) for men and 60 to 64 Years (62 | 17.1%) for women.
| Age Bracket | Male | Female |
| Under 5 Years | 23 (4.9%) | 0 (0.0%) |
| 5 to 9 Years | 15 (3.2%) | 20 (5.5%) |
| 10 to 14 Years | 21 (4.4%) | 20 (5.5%) |
| 15 to 19 Years | 18 (3.8%) | 19 (5.2%) |
| 20 to 24 Years | 11 (2.3%) | 17 (4.7%) |
| 25 to 29 Years | 15 (3.2%) | 4 (1.1%) |
| 30 to 34 Years | 16 (3.4%) | 15 (4.1%) |
| 35 to 39 Years | 21 (4.4%) | 9 (2.5%) |
| 40 to 44 Years | 33 (7.0%) | 32 (8.8%) |
| 45 to 49 Years | 20 (4.2%) | 10 (2.8%) |
| 50 to 54 Years | 17 (3.6%) | 25 (6.9%) |
| 55 to 59 Years | 38 (8.0%) | 53 (14.6%) |
| 60 to 64 Years | 51 (10.8%) | 62 (17.1%) |
| 65 to 69 Years | 97 (20.5%) | 52 (14.3%) |
| 70 to 74 Years | 38 (8.0%) | 15 (4.1%) |
| 75 to 79 Years | 40 (8.4%) | 10 (2.8%) |
| 80 to 84 Years | 0 (0.0%) | 0 (0.0%) |
| 85 Years and over | 0 (0.0%) | 0 (0.0%) |
| Total | 474 (100.0%) | 363 (100.0%) |
Families and Households in Geyserville
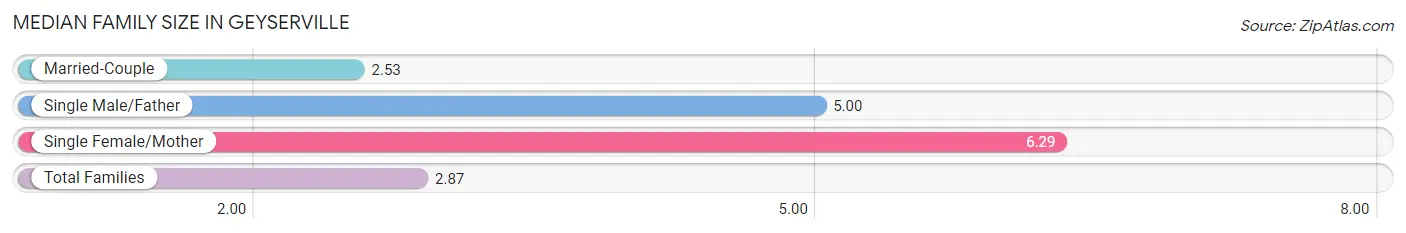
Median Family Size in Geyserville
The median family size in Geyserville is 2.87 persons per family, with single female/mother families (7 | 2.9%) accounting for the largest median family size of 6.29 persons per family. On the other hand, married-couple families (212 | 88.0%) represent the smallest median family size with 2.53 persons per family.
| Family Type | # Families | Family Size |
| Married-Couple | 212 (88.0%) | 2.53 |
| Single Male/Father | 22 (9.1%) | 5.00 |
| Single Female/Mother | 7 (2.9%) | 6.29 |
| Total Families | 241 (100.0%) | 2.87 |
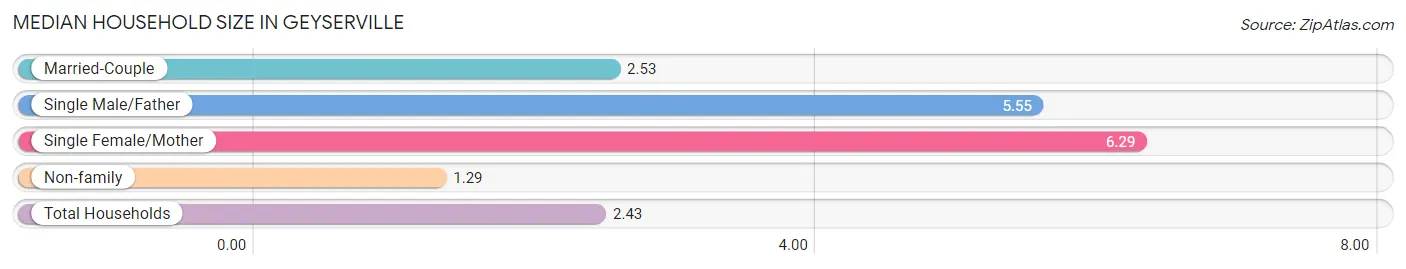
Median Household Size in Geyserville
The median household size in Geyserville is 2.43 persons per household, with single female/mother households (7 | 2.0%) accounting for the largest median household size of 6.29 persons per household. non-family households (104 | 30.1%) represent the smallest median household size with 1.29 persons per household.
| Household Type | # Households | Household Size |
| Married-Couple | 212 (61.5%) | 2.53 |
| Single Male/Father | 22 (6.4%) | 5.55 |
| Single Female/Mother | 7 (2.0%) | 6.29 |
| Non-family | 104 (30.1%) | 1.29 |
| Total Households | 345 (100.0%) | 2.43 |
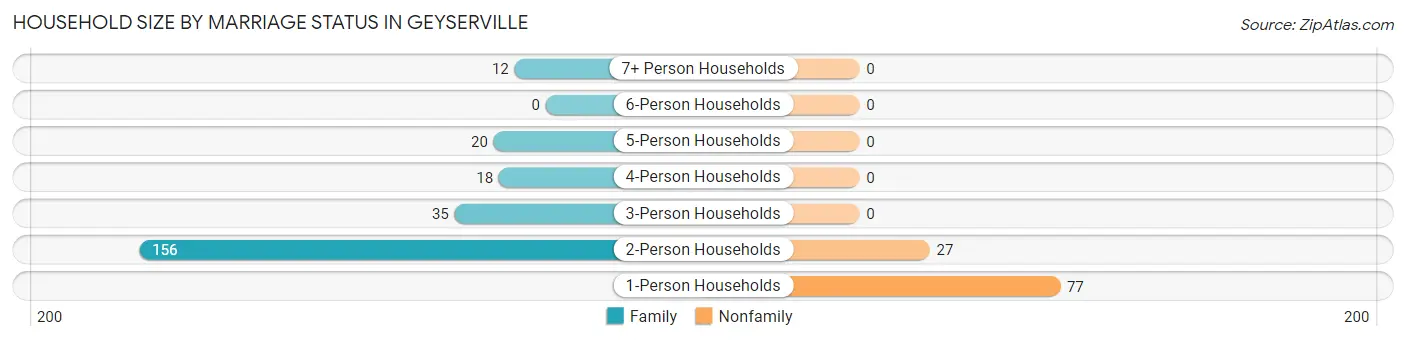
Household Size by Marriage Status in Geyserville
Out of a total of 345 households in Geyserville, 241 (69.9%) are family households, while 104 (30.1%) are nonfamily households. The most numerous type of family households are 2-person households, comprising 156, and the most common type of nonfamily households are 1-person households, comprising 77.
| Household Size | Family Households | Nonfamily Households |
| 1-Person Households | - | 77 (22.3%) |
| 2-Person Households | 156 (45.2%) | 27 (7.8%) |
| 3-Person Households | 35 (10.1%) | 0 (0.0%) |
| 4-Person Households | 18 (5.2%) | 0 (0.0%) |
| 5-Person Households | 20 (5.8%) | 0 (0.0%) |
| 6-Person Households | 0 (0.0%) | 0 (0.0%) |
| 7+ Person Households | 12 (3.5%) | 0 (0.0%) |
| Total | 241 (69.9%) | 104 (30.1%) |
Female Fertility in Geyserville
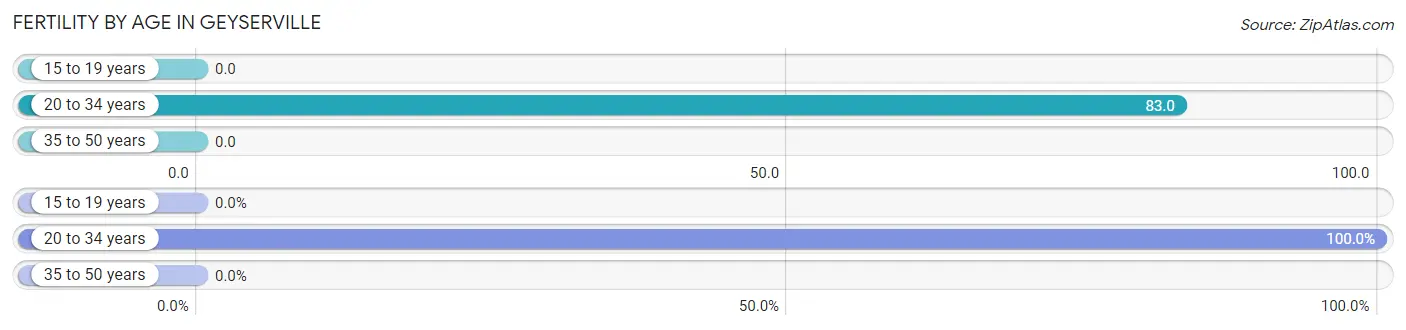
Fertility by Age in Geyserville
Average fertility rate in Geyserville is 27.0 births per 1,000 women. Women in the age bracket of 20 to 34 years have the highest fertility rate with 83.0 births per 1,000 women. Women in the age bracket of 20 to 34 years acount for 100.0% of all women with births.
| Age Bracket | Women with Births | Births / 1,000 Women |
| 15 to 19 years | 0 (0.0%) | 0.0 |
| 20 to 34 years | 3 (100.0%) | 83.0 |
| 35 to 50 years | 0 (0.0%) | 0.0 |
| Total | 3 (100.0%) | 27.0 |
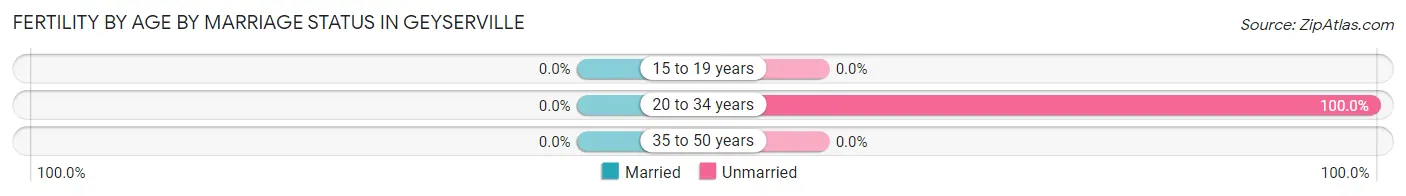
Fertility by Age by Marriage Status in Geyserville
| Age Bracket | Married | Unmarried |
| 15 to 19 years | 0 (0.0%) | 0 (0.0%) |
| 20 to 34 years | 0 (0.0%) | 3 (100.0%) |
| 35 to 50 years | 0 (0.0%) | 0 (0.0%) |
| Total | 0 (0.0%) | 3 (100.0%) |
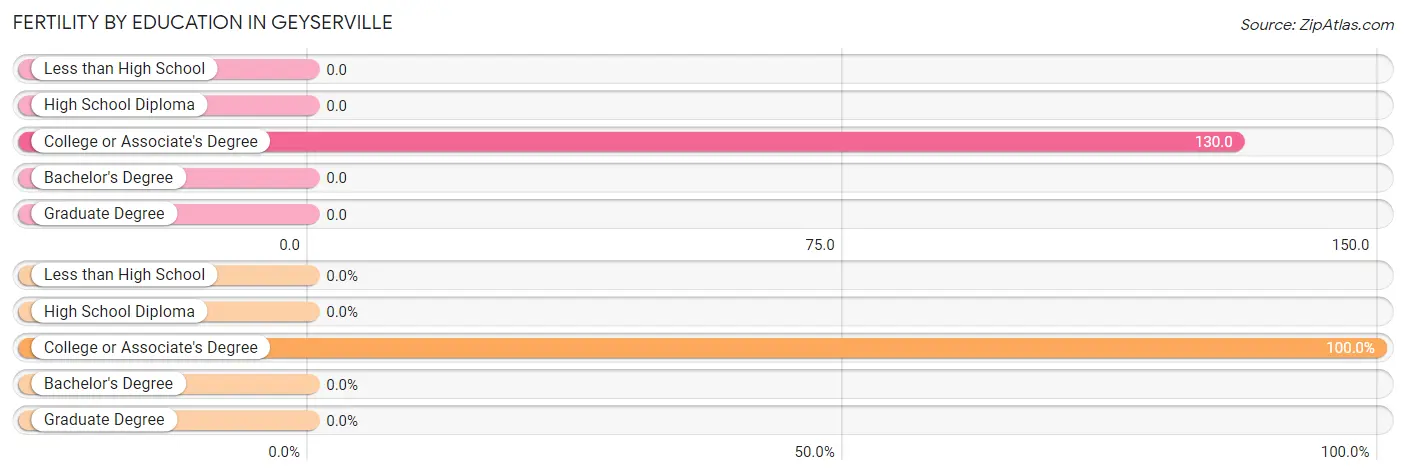
Fertility by Education in Geyserville
| Educational Attainment | Women with Births | Births / 1,000 Women |
| Less than High School | 0 (0.0%) | 0.0 |
| High School Diploma | 0 (0.0%) | 0.0 |
| College or Associate's Degree | 3 (100.0%) | 130.0 |
| Bachelor's Degree | 0 (0.0%) | 0.0 |
| Graduate Degree | 0 (0.0%) | 0.0 |
| Total | 3 (100.0%) | 27.0 |
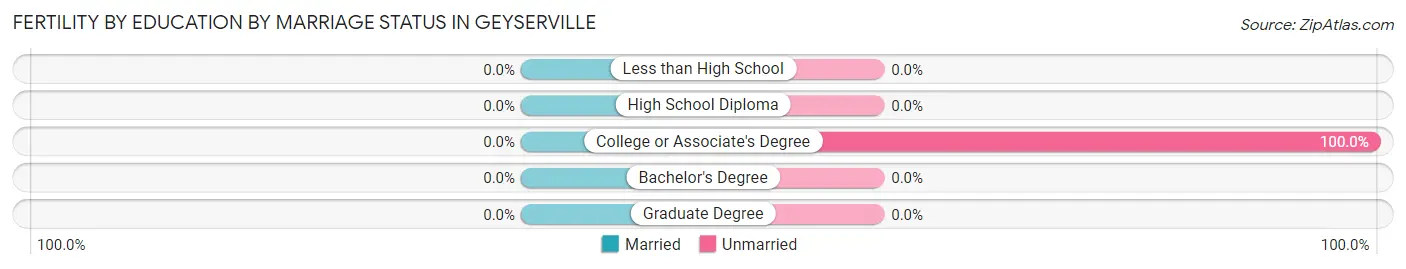
Fertility by Education by Marriage Status in Geyserville
| Educational Attainment | Married | Unmarried |
| Less than High School | 0 (0.0%) | 0 (0.0%) |
| High School Diploma | 0 (0.0%) | 0 (0.0%) |
| College or Associate's Degree | 0 (0.0%) | 3 (100.0%) |
| Bachelor's Degree | 0 (0.0%) | 0 (0.0%) |
| Graduate Degree | 0 (0.0%) | 0 (0.0%) |
| Total | 0 (0.0%) | 3 (100.0%) |
Employment Characteristics in Geyserville
Employment by Class of Employer in Geyserville
Among the 447 employed individuals in Geyserville, private company employees (277 | 62.0%), self-employed (not incorporated) (61 | 13.7%), and local government employees (56 | 12.5%) make up the most common classes of employment.
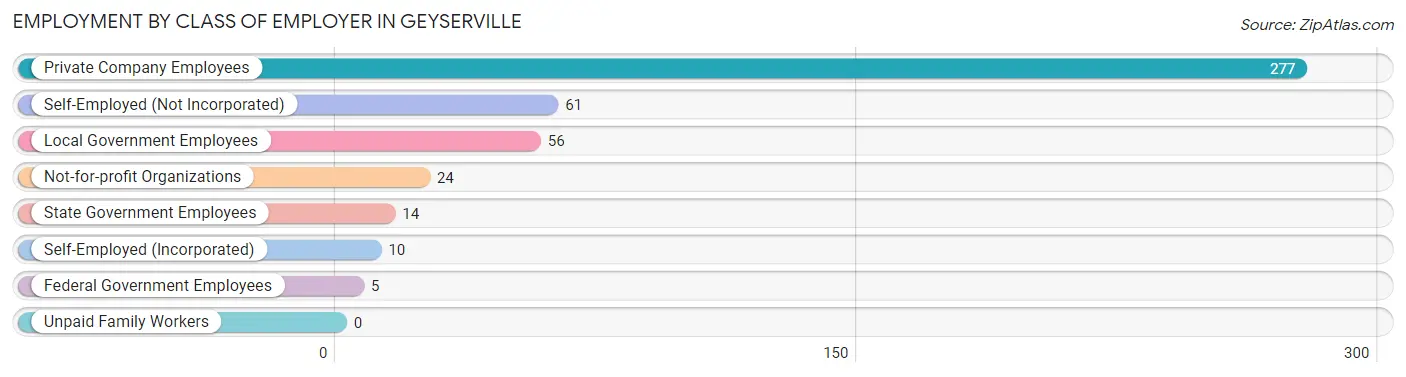
| Employer Class | # Employees | % Employees |
| Private Company Employees | 277 | 62.0% |
| Self-Employed (Incorporated) | 10 | 2.2% |
| Self-Employed (Not Incorporated) | 61 | 13.7% |
| Not-for-profit Organizations | 24 | 5.4% |
| Local Government Employees | 56 | 12.5% |
| State Government Employees | 14 | 3.1% |
| Federal Government Employees | 5 | 1.1% |
| Unpaid Family Workers | 0 | 0.0% |
| Total | 447 | 100.0% |
Employment Status by Age in Geyserville
According to the labor force statistics for Geyserville, out of the total population over 16 years of age (729), 66.4% or 484 individuals are in the labor force, with 6.6% or 32 of them unemployed. The age group with the highest labor force participation rate is 20 to 24 years, with 100.0% or 28 individuals in the labor force. Within the labor force, the 25 to 29 years age range has the highest percentage of unemployed individuals, with 73.3% or 11 of them being unemployed.
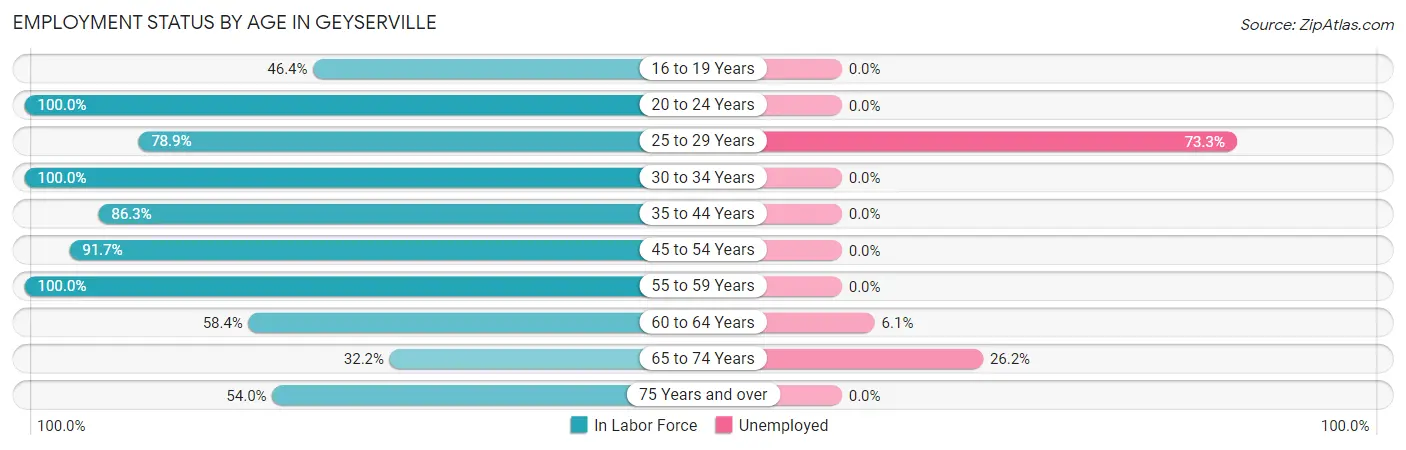
| Age Bracket | In Labor Force | Unemployed |
| 16 to 19 Years | 13 (46.4%) | 0 (0.0%) |
| 20 to 24 Years | 28 (100.0%) | 0 (0.0%) |
| 25 to 29 Years | 15 (78.9%) | 11 (73.3%) |
| 30 to 34 Years | 31 (100.0%) | 0 (0.0%) |
| 35 to 44 Years | 82 (86.3%) | 0 (0.0%) |
| 45 to 54 Years | 66 (91.7%) | 0 (0.0%) |
| 55 to 59 Years | 91 (100.0%) | 0 (0.0%) |
| 60 to 64 Years | 66 (58.4%) | 4 (6.1%) |
| 65 to 74 Years | 65 (32.2%) | 17 (26.2%) |
| 75 Years and over | 27 (54.0%) | 0 (0.0%) |
| Total | 484 (66.4%) | 32 (6.6%) |
Employment Status by Educational Attainment in Geyserville
According to labor force statistics for Geyserville, 83.4% of individuals (351) out of the total population between 25 and 64 years of age (421) are in the labor force, with 4.3% or 15 of them being unemployed. The group with the highest labor force participation rate are those with the educational attainment of less than high school, with 100.0% or 76 individuals in the labor force. Within the labor force, individuals with high school diploma education have the highest percentage of unemployment, with 10.3% or 11 of them being unemployed.
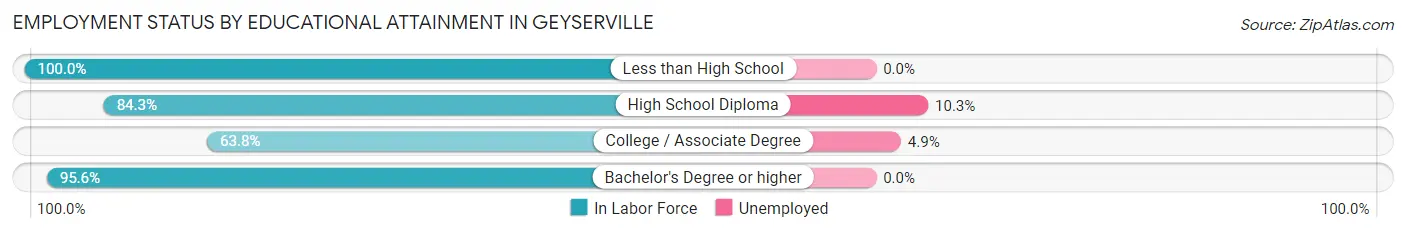
| Educational Attainment | In Labor Force | Unemployed |
| Less than High School | 76 (100.0%) | 0 (0.0%) |
| High School Diploma | 107 (84.3%) | 13 (10.3%) |
| College / Associate Degree | 81 (63.8%) | 6 (4.9%) |
| Bachelor's Degree or higher | 87 (95.6%) | 0 (0.0%) |
| Total | 351 (83.4%) | 18 (4.3%) |
Employment Occupations by Sex in Geyserville
Management, Business, Science and Arts Occupations
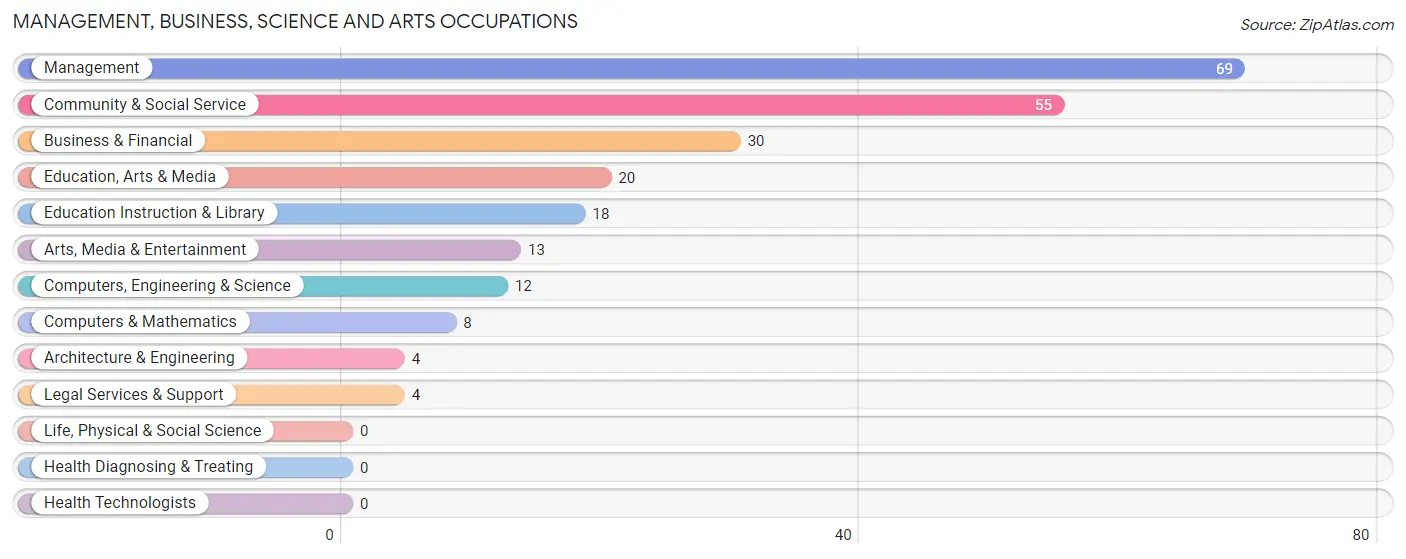
The most common Management, Business, Science and Arts occupations in Geyserville are Management (69 | 15.3%), Community & Social Service (55 | 12.2%), Business & Financial (30 | 6.6%), Education, Arts & Media (20 | 4.4%), and Education Instruction & Library (18 | 4.0%).
Management, Business, Science and Arts Occupations by Sex
Within the Management, Business, Science and Arts occupations in Geyserville, the most male-oriented occupations are Architecture & Engineering (100.0%), Business & Financial (86.7%), and Computers, Engineering & Science (66.7%), while the most female-oriented occupations are Legal Services & Support (100.0%), Education Instruction & Library (72.2%), and Arts, Media & Entertainment (69.2%).
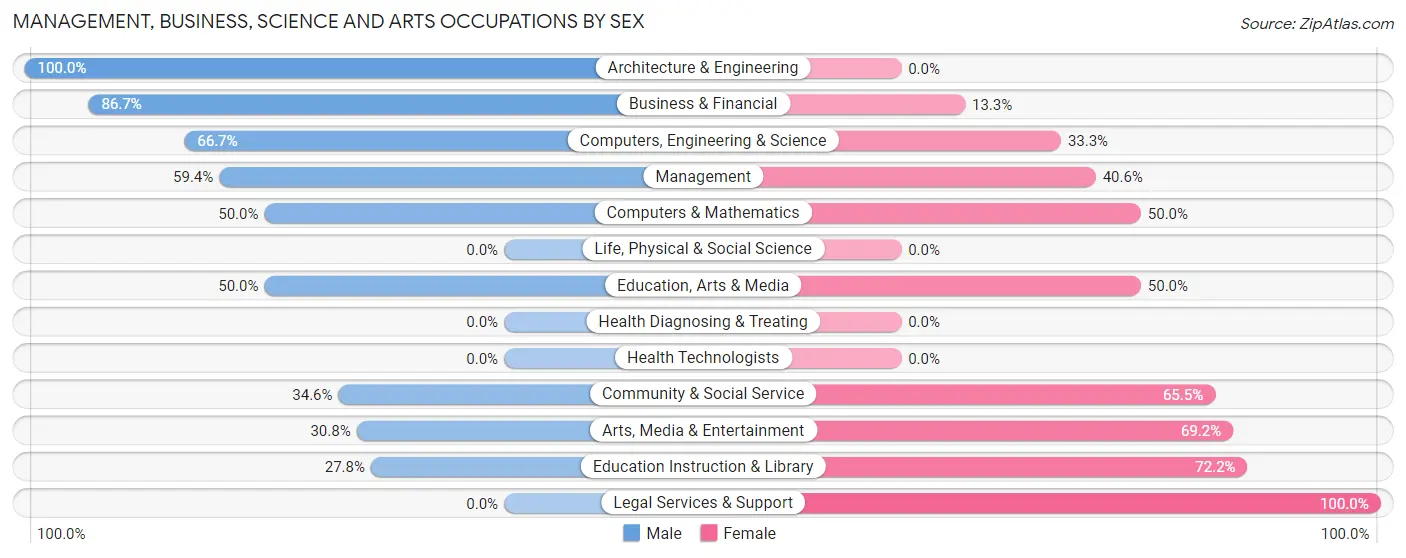
| Occupation | Male | Female |
| Management | 41 (59.4%) | 28 (40.6%) |
| Business & Financial | 26 (86.7%) | 4 (13.3%) |
| Computers, Engineering & Science | 8 (66.7%) | 4 (33.3%) |
| Computers & Mathematics | 4 (50.0%) | 4 (50.0%) |
| Architecture & Engineering | 4 (100.0%) | 0 (0.0%) |
| Life, Physical & Social Science | 0 (0.0%) | 0 (0.0%) |
| Community & Social Service | 19 (34.5%) | 36 (65.4%) |
| Education, Arts & Media | 10 (50.0%) | 10 (50.0%) |
| Legal Services & Support | 0 (0.0%) | 4 (100.0%) |
| Education Instruction & Library | 5 (27.8%) | 13 (72.2%) |
| Arts, Media & Entertainment | 4 (30.8%) | 9 (69.2%) |
| Health Diagnosing & Treating | 0 (0.0%) | 0 (0.0%) |
| Health Technologists | 0 (0.0%) | 0 (0.0%) |
| Total (Category) | 94 (56.6%) | 72 (43.4%) |
| Total (Overall) | 260 (57.5%) | 192 (42.5%) |
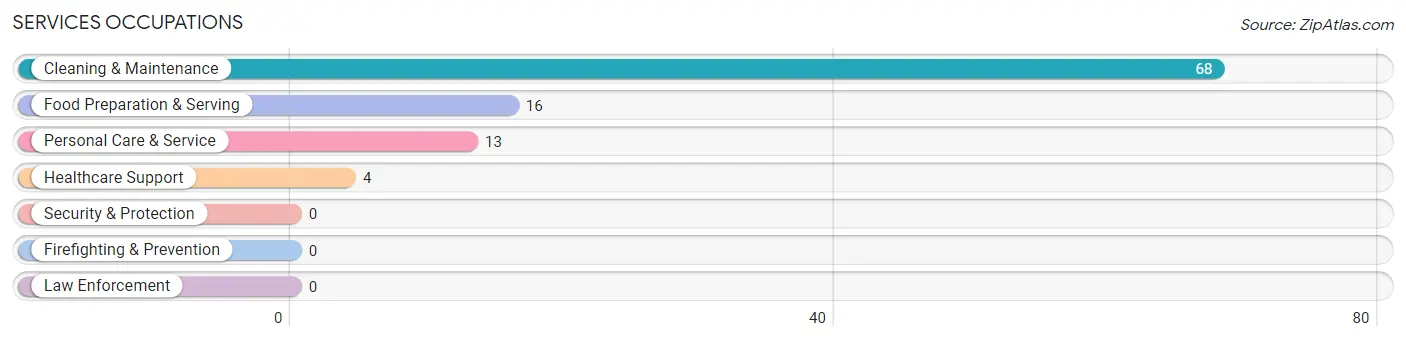
Services Occupations
The most common Services occupations in Geyserville are Cleaning & Maintenance (68 | 15.0%), Food Preparation & Serving (16 | 3.5%), Personal Care & Service (13 | 2.9%), and Healthcare Support (4 | 0.9%).
Services Occupations by Sex
Within the Services occupations in Geyserville, the most male-oriented occupations are Cleaning & Maintenance (79.4%), and Food Preparation & Serving (25.0%), while the most female-oriented occupations are Healthcare Support (100.0%), Personal Care & Service (100.0%), and Food Preparation & Serving (75.0%).
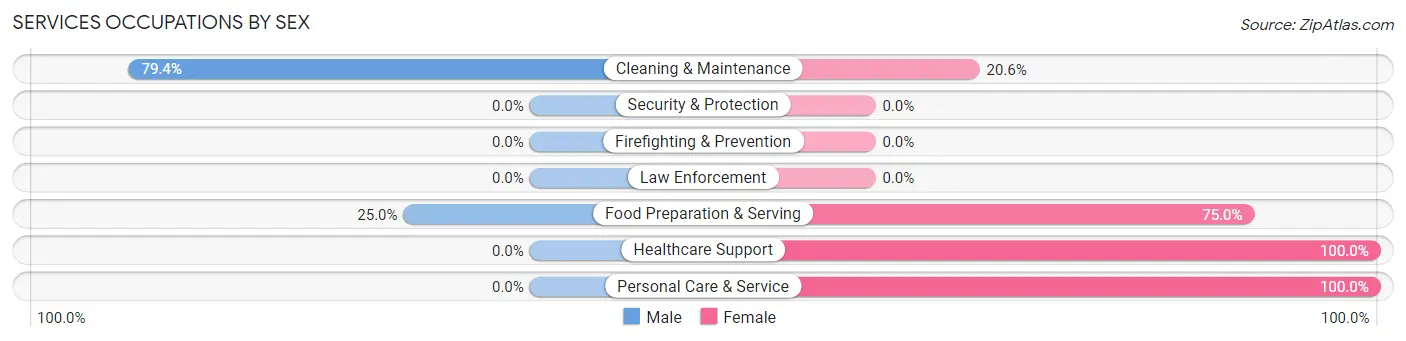
| Occupation | Male | Female |
| Healthcare Support | 0 (0.0%) | 4 (100.0%) |
| Security & Protection | 0 (0.0%) | 0 (0.0%) |
| Firefighting & Prevention | 0 (0.0%) | 0 (0.0%) |
| Law Enforcement | 0 (0.0%) | 0 (0.0%) |
| Food Preparation & Serving | 4 (25.0%) | 12 (75.0%) |
| Cleaning & Maintenance | 54 (79.4%) | 14 (20.6%) |
| Personal Care & Service | 0 (0.0%) | 13 (100.0%) |
| Total (Category) | 58 (57.4%) | 43 (42.6%) |
| Total (Overall) | 260 (57.5%) | 192 (42.5%) |
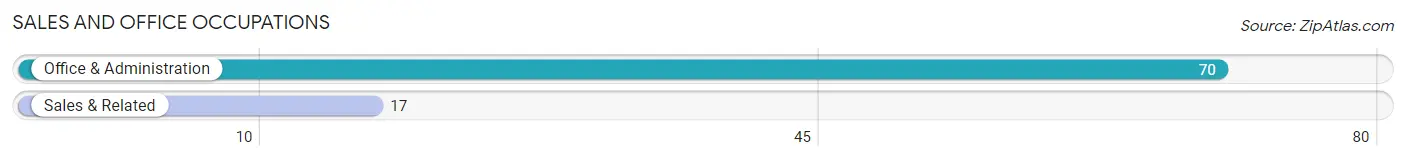
Sales and Office Occupations
The most common Sales and Office occupations in Geyserville are Office & Administration (70 | 15.5%), and Sales & Related (17 | 3.8%).
Sales and Office Occupations by Sex
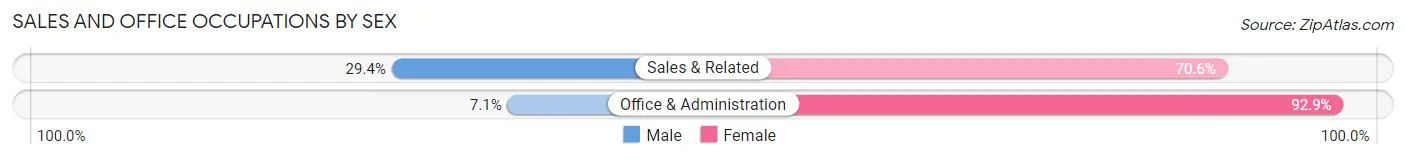
| Occupation | Male | Female |
| Sales & Related | 5 (29.4%) | 12 (70.6%) |
| Office & Administration | 5 (7.1%) | 65 (92.9%) |
| Total (Category) | 10 (11.5%) | 77 (88.5%) |
| Total (Overall) | 260 (57.5%) | 192 (42.5%) |
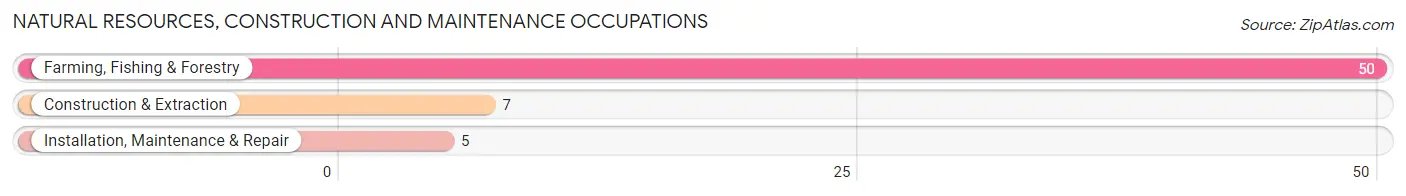
Natural Resources, Construction and Maintenance Occupations
The most common Natural Resources, Construction and Maintenance occupations in Geyserville are Farming, Fishing & Forestry (50 | 11.1%), Construction & Extraction (7 | 1.5%), and Installation, Maintenance & Repair (5 | 1.1%).
Natural Resources, Construction and Maintenance Occupations by Sex
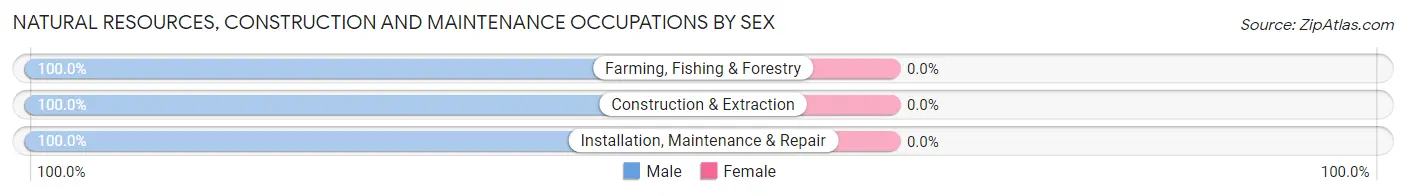
| Occupation | Male | Female |
| Farming, Fishing & Forestry | 50 (100.0%) | 0 (0.0%) |
| Construction & Extraction | 7 (100.0%) | 0 (0.0%) |
| Installation, Maintenance & Repair | 5 (100.0%) | 0 (0.0%) |
| Total (Category) | 62 (100.0%) | 0 (0.0%) |
| Total (Overall) | 260 (57.5%) | 192 (42.5%) |
Production, Transportation and Moving Occupations
The most common Production, Transportation and Moving occupations in Geyserville are Production (20 | 4.4%), and Transportation (16 | 3.5%).
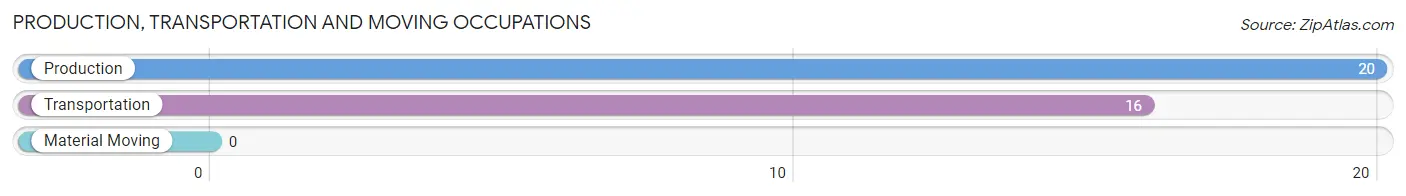
Production, Transportation and Moving Occupations by Sex
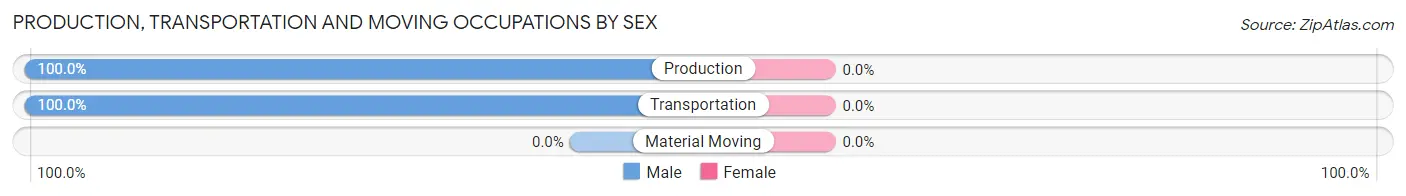
| Occupation | Male | Female |
| Production | 20 (100.0%) | 0 (0.0%) |
| Transportation | 16 (100.0%) | 0 (0.0%) |
| Material Moving | 0 (0.0%) | 0 (0.0%) |
| Total (Category) | 36 (100.0%) | 0 (0.0%) |
| Total (Overall) | 260 (57.5%) | 192 (42.5%) |
Employment Industries by Sex in Geyserville
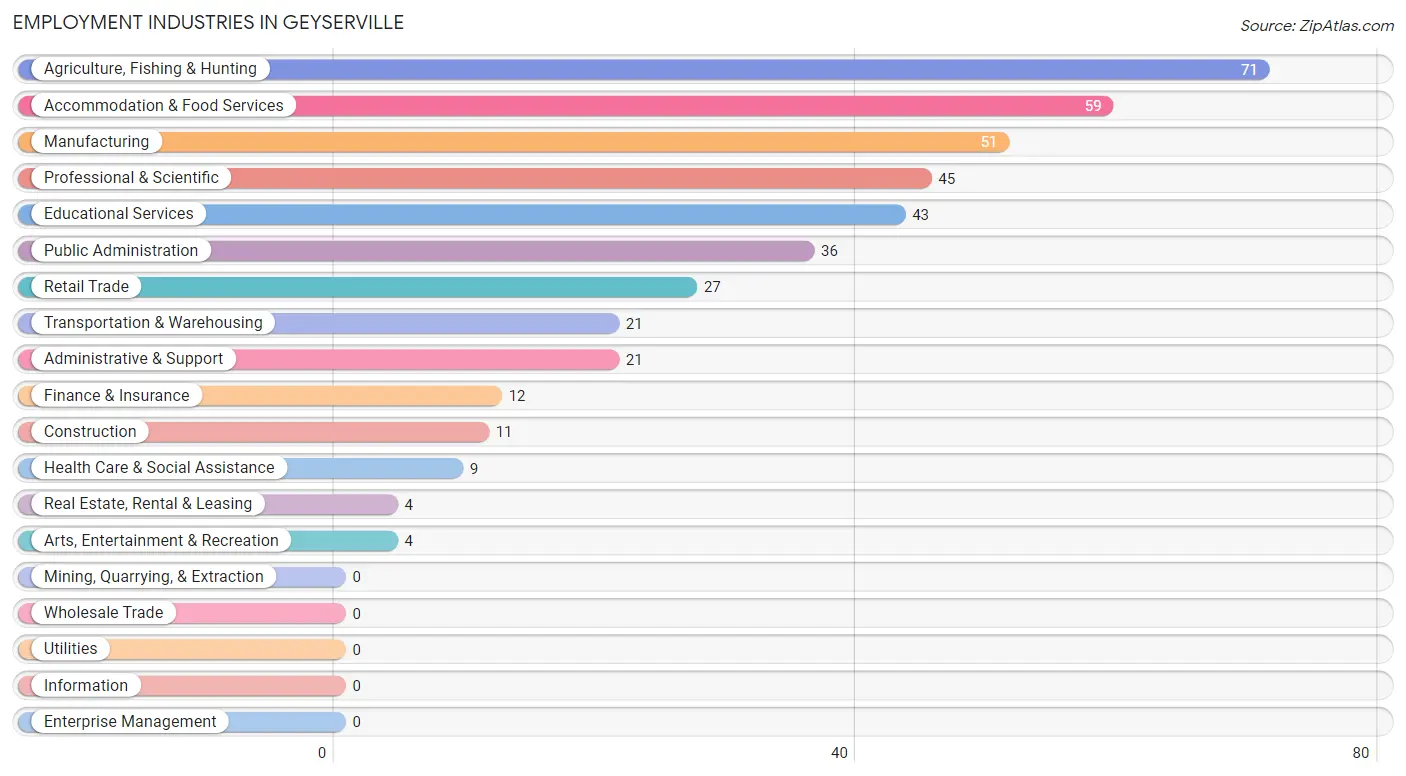
Employment Industries in Geyserville
The major employment industries in Geyserville include Agriculture, Fishing & Hunting (71 | 15.7%), Accommodation & Food Services (59 | 13.1%), Manufacturing (51 | 11.3%), Professional & Scientific (45 | 10.0%), and Educational Services (43 | 9.5%).
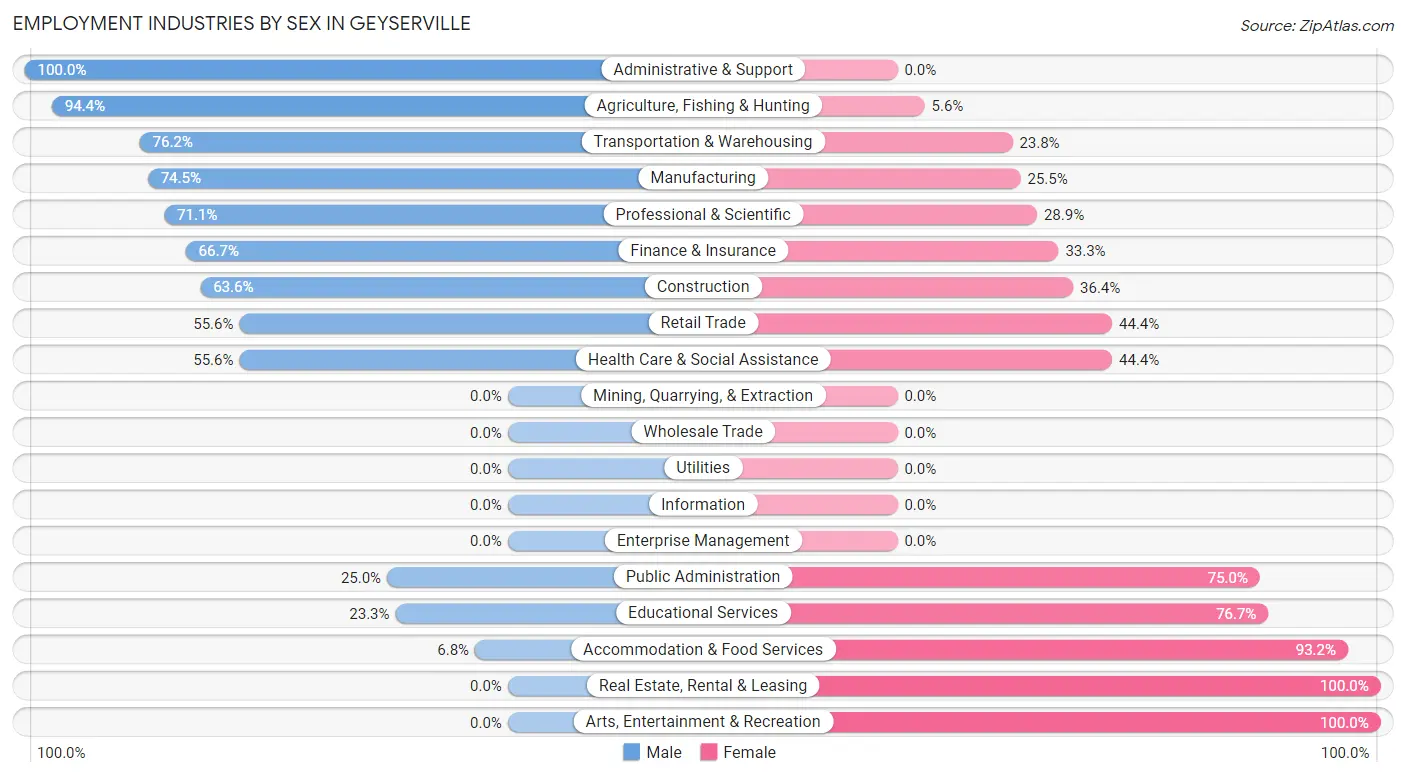
Employment Industries by Sex in Geyserville
The Geyserville industries that see more men than women are Administrative & Support (100.0%), Agriculture, Fishing & Hunting (94.4%), and Transportation & Warehousing (76.2%), whereas the industries that tend to have a higher number of women are Real Estate, Rental & Leasing (100.0%), Arts, Entertainment & Recreation (100.0%), and Accommodation & Food Services (93.2%).
| Industry | Male | Female |
| Agriculture, Fishing & Hunting | 67 (94.4%) | 4 (5.6%) |
| Mining, Quarrying, & Extraction | 0 (0.0%) | 0 (0.0%) |
| Construction | 7 (63.6%) | 4 (36.4%) |
| Manufacturing | 38 (74.5%) | 13 (25.5%) |
| Wholesale Trade | 0 (0.0%) | 0 (0.0%) |
| Retail Trade | 15 (55.6%) | 12 (44.4%) |
| Transportation & Warehousing | 16 (76.2%) | 5 (23.8%) |
| Utilities | 0 (0.0%) | 0 (0.0%) |
| Information | 0 (0.0%) | 0 (0.0%) |
| Finance & Insurance | 8 (66.7%) | 4 (33.3%) |
| Real Estate, Rental & Leasing | 0 (0.0%) | 4 (100.0%) |
| Professional & Scientific | 32 (71.1%) | 13 (28.9%) |
| Enterprise Management | 0 (0.0%) | 0 (0.0%) |
| Administrative & Support | 21 (100.0%) | 0 (0.0%) |
| Educational Services | 10 (23.3%) | 33 (76.7%) |
| Health Care & Social Assistance | 5 (55.6%) | 4 (44.4%) |
| Arts, Entertainment & Recreation | 0 (0.0%) | 4 (100.0%) |
| Accommodation & Food Services | 4 (6.8%) | 55 (93.2%) |
| Public Administration | 9 (25.0%) | 27 (75.0%) |
| Total | 260 (57.5%) | 192 (42.5%) |
Education in Geyserville
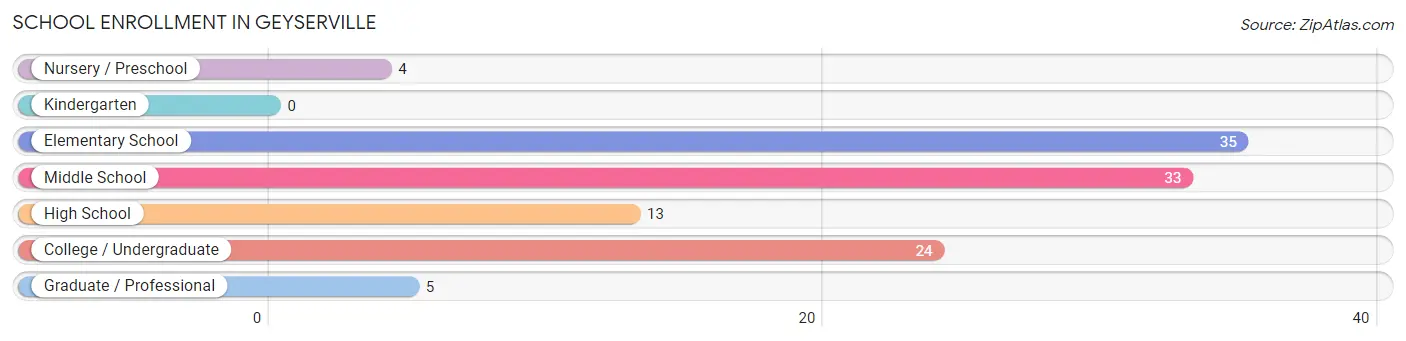
School Enrollment in Geyserville
The most common levels of schooling among the 114 students in Geyserville are elementary school (35 | 30.7%), middle school (33 | 28.9%), and college / undergraduate (24 | 21.0%).
| School Level | # Students | % Students |
| Nursery / Preschool | 4 | 3.5% |
| Kindergarten | 0 | 0.0% |
| Elementary School | 35 | 30.7% |
| Middle School | 33 | 28.9% |
| High School | 13 | 11.4% |
| College / Undergraduate | 24 | 21.0% |
| Graduate / Professional | 5 | 4.4% |
| Total | 114 | 100.0% |
School Enrollment by Age by Funding Source in Geyserville
Out of a total of 114 students who are enrolled in schools in Geyserville, 17 (14.9%) attend a private institution, while the remaining 97 (85.1%) are enrolled in public schools. The age group of 35 years and over has the highest likelihood of being enrolled in private schools, with 5 (100.0% in the age bracket) enrolled. Conversely, the age group of 3 to 4 year olds has the lowest likelihood of being enrolled in a private school, with 4 (100.0% in the age bracket) attending a public institution.
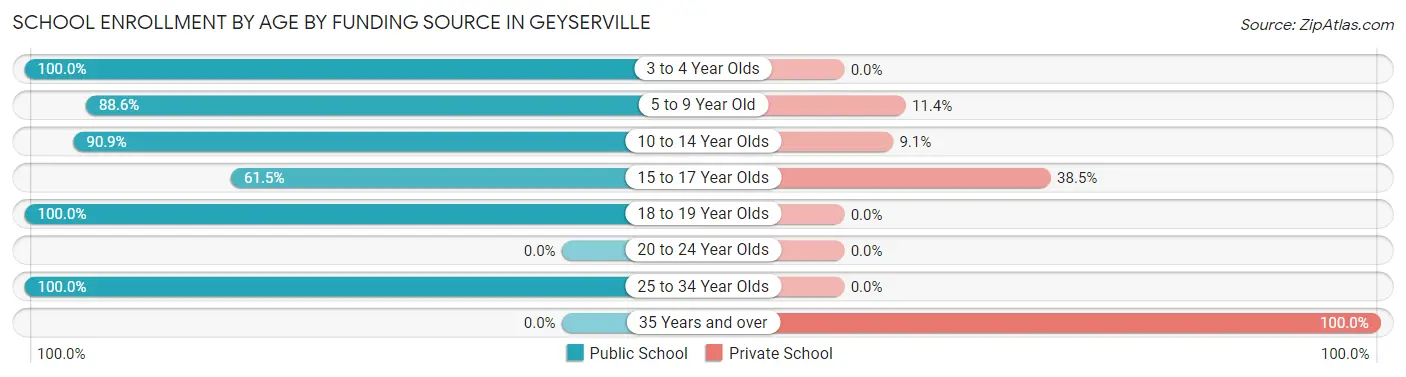
| Age Bracket | Public School | Private School |
| 3 to 4 Year Olds | 4 (100.0%) | 0 (0.0%) |
| 5 to 9 Year Old | 31 (88.6%) | 4 (11.4%) |
| 10 to 14 Year Olds | 30 (90.9%) | 3 (9.1%) |
| 15 to 17 Year Olds | 8 (61.5%) | 5 (38.5%) |
| 18 to 19 Year Olds | 20 (100.0%) | 0 (0.0%) |
| 20 to 24 Year Olds | 0 (0.0%) | 0 (0.0%) |
| 25 to 34 Year Olds | 4 (100.0%) | 0 (0.0%) |
| 35 Years and over | 0 (0.0%) | 5 (100.0%) |
| Total | 97 (85.1%) | 17 (14.9%) |
Educational Attainment by Field of Study in Geyserville
Business (89 | 38.2%), social sciences (52 | 22.3%), liberal arts & history (20 | 8.6%), bio, nature & agricultural (14 | 6.0%), and communications (14 | 6.0%) are the most common fields of study among 233 individuals in Geyserville who have obtained a bachelor's degree or higher.
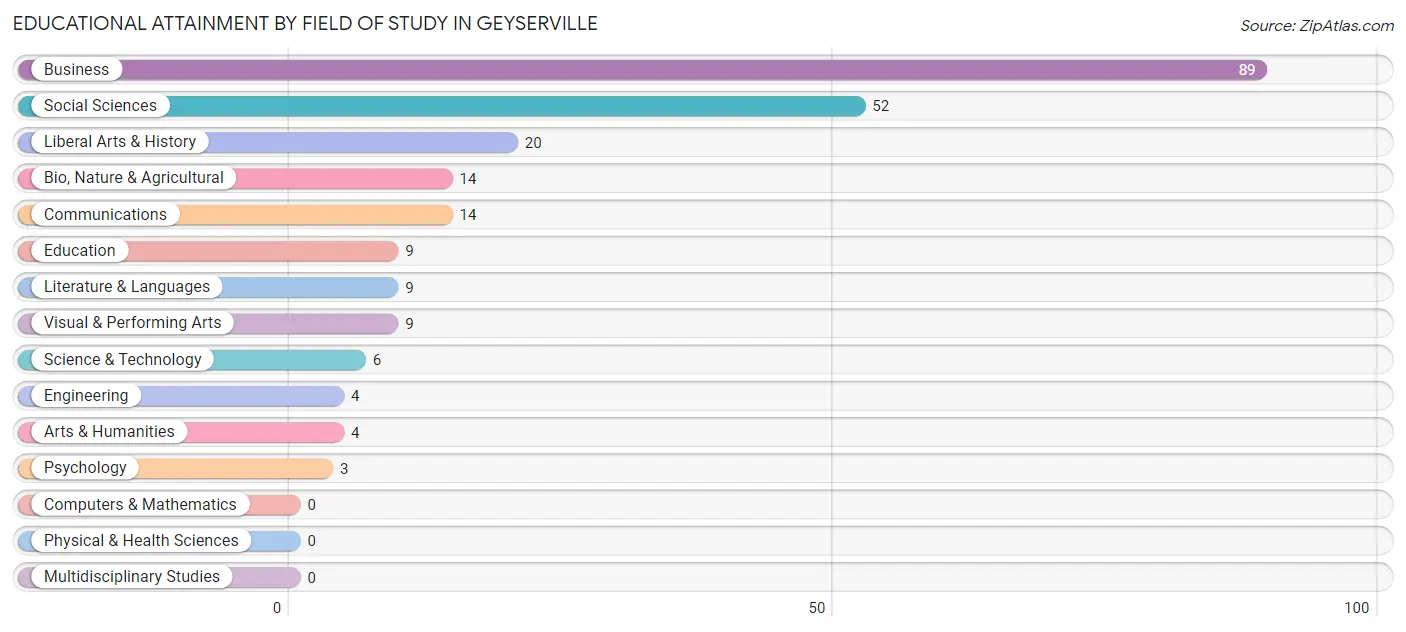
| Field of Study | # Graduates | % Graduates |
| Computers & Mathematics | 0 | 0.0% |
| Bio, Nature & Agricultural | 14 | 6.0% |
| Physical & Health Sciences | 0 | 0.0% |
| Psychology | 3 | 1.3% |
| Social Sciences | 52 | 22.3% |
| Engineering | 4 | 1.7% |
| Multidisciplinary Studies | 0 | 0.0% |
| Science & Technology | 6 | 2.6% |
| Business | 89 | 38.2% |
| Education | 9 | 3.9% |
| Literature & Languages | 9 | 3.9% |
| Liberal Arts & History | 20 | 8.6% |
| Visual & Performing Arts | 9 | 3.9% |
| Communications | 14 | 6.0% |
| Arts & Humanities | 4 | 1.7% |
| Total | 233 | 100.0% |
Transportation & Commute in Geyserville
Vehicle Availability by Sex in Geyserville
The most prevalent vehicle ownership categories in Geyserville are males with 2 vehicles (88, accounting for 34.5%) and females with 2 vehicles (85, making up 45.8%).
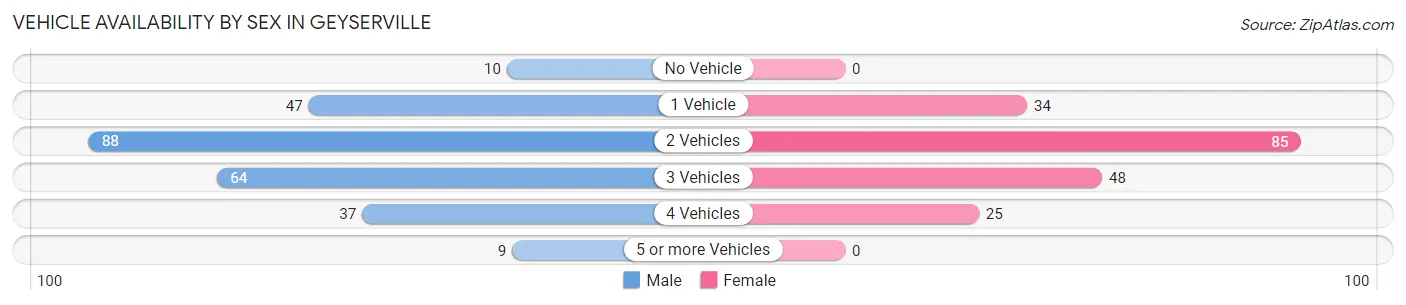
| Vehicles Available | Male | Female |
| No Vehicle | 10 (3.9%) | 0 (0.0%) |
| 1 Vehicle | 47 (18.4%) | 34 (17.7%) |
| 2 Vehicles | 88 (34.5%) | 85 (44.3%) |
| 3 Vehicles | 64 (25.1%) | 48 (25.0%) |
| 4 Vehicles | 37 (14.5%) | 25 (13.0%) |
| 5 or more Vehicles | 9 (3.5%) | 0 (0.0%) |
| Total | 255 (100.0%) | 192 (100.0%) |
Commute Time in Geyserville
The most frequently occuring commute durations in Geyserville are 5 to 9 minutes (56 commuters, 15.8%), 10 to 14 minutes (45 commuters, 12.7%), and 25 to 29 minutes (43 commuters, 12.1%).
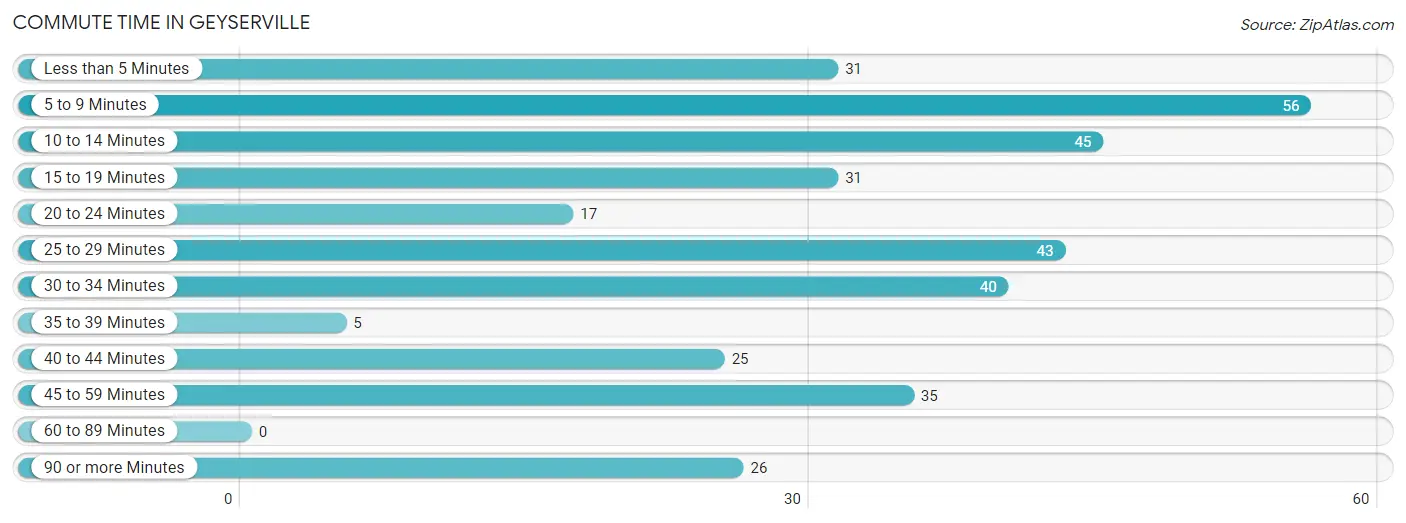
| Commute Time | # Commuters | % Commuters |
| Less than 5 Minutes | 31 | 8.8% |
| 5 to 9 Minutes | 56 | 15.8% |
| 10 to 14 Minutes | 45 | 12.7% |
| 15 to 19 Minutes | 31 | 8.8% |
| 20 to 24 Minutes | 17 | 4.8% |
| 25 to 29 Minutes | 43 | 12.1% |
| 30 to 34 Minutes | 40 | 11.3% |
| 35 to 39 Minutes | 5 | 1.4% |
| 40 to 44 Minutes | 25 | 7.1% |
| 45 to 59 Minutes | 35 | 9.9% |
| 60 to 89 Minutes | 0 | 0.0% |
| 90 or more Minutes | 26 | 7.3% |
Commute Time by Sex in Geyserville
The most common commute times in Geyserville are 10 to 14 minutes (36 commuters, 18.3%) for males and 5 to 9 minutes (33 commuters, 21.0%) for females.
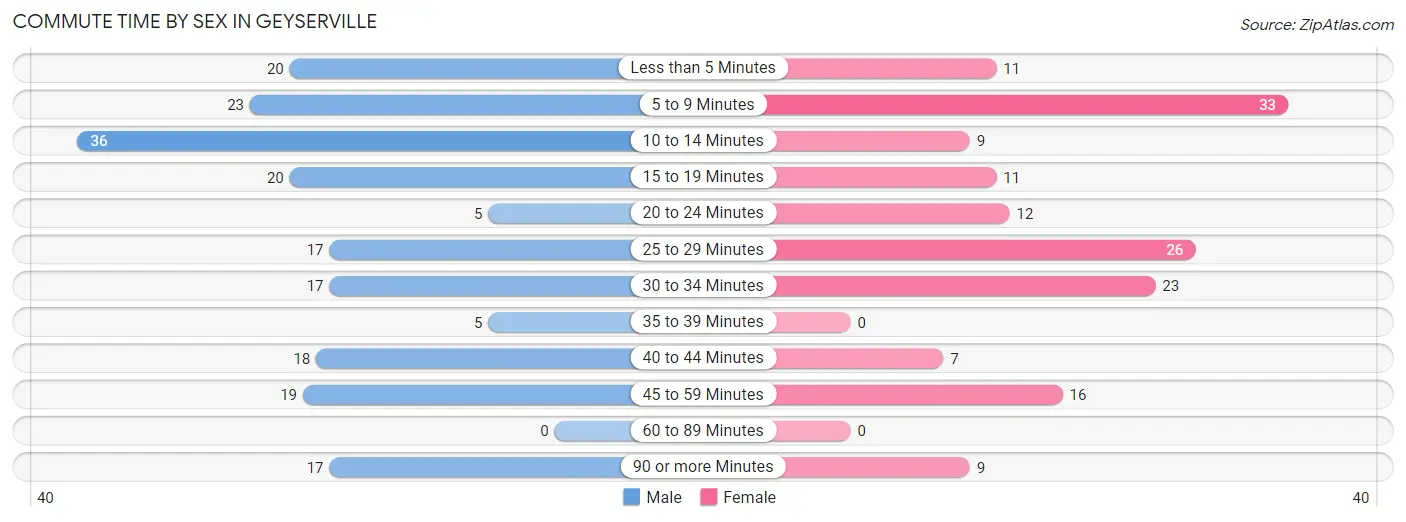
| Commute Time | Male | Female |
| Less than 5 Minutes | 20 (10.2%) | 11 (7.0%) |
| 5 to 9 Minutes | 23 (11.7%) | 33 (21.0%) |
| 10 to 14 Minutes | 36 (18.3%) | 9 (5.7%) |
| 15 to 19 Minutes | 20 (10.2%) | 11 (7.0%) |
| 20 to 24 Minutes | 5 (2.5%) | 12 (7.6%) |
| 25 to 29 Minutes | 17 (8.6%) | 26 (16.6%) |
| 30 to 34 Minutes | 17 (8.6%) | 23 (14.6%) |
| 35 to 39 Minutes | 5 (2.5%) | 0 (0.0%) |
| 40 to 44 Minutes | 18 (9.1%) | 7 (4.5%) |
| 45 to 59 Minutes | 19 (9.6%) | 16 (10.2%) |
| 60 to 89 Minutes | 0 (0.0%) | 0 (0.0%) |
| 90 or more Minutes | 17 (8.6%) | 9 (5.7%) |
Time of Departure to Work by Sex in Geyserville
The most frequent times of departure to work in Geyserville are 6:00 AM to 6:29 AM (60, 30.5%) for males and 6:30 AM to 6:59 AM (33, 21.0%) for females.
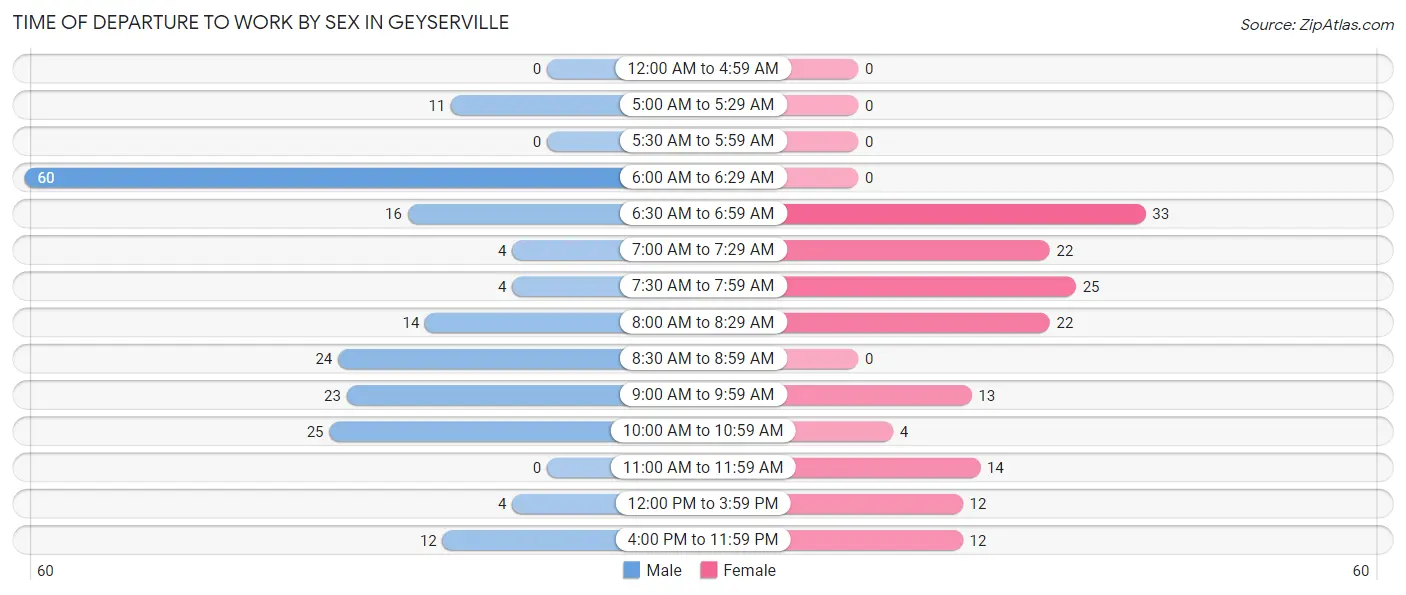
| Time of Departure | Male | Female |
| 12:00 AM to 4:59 AM | 0 (0.0%) | 0 (0.0%) |
| 5:00 AM to 5:29 AM | 11 (5.6%) | 0 (0.0%) |
| 5:30 AM to 5:59 AM | 0 (0.0%) | 0 (0.0%) |
| 6:00 AM to 6:29 AM | 60 (30.5%) | 0 (0.0%) |
| 6:30 AM to 6:59 AM | 16 (8.1%) | 33 (21.0%) |
| 7:00 AM to 7:29 AM | 4 (2.0%) | 22 (14.0%) |
| 7:30 AM to 7:59 AM | 4 (2.0%) | 25 (15.9%) |
| 8:00 AM to 8:29 AM | 14 (7.1%) | 22 (14.0%) |
| 8:30 AM to 8:59 AM | 24 (12.2%) | 0 (0.0%) |
| 9:00 AM to 9:59 AM | 23 (11.7%) | 13 (8.3%) |
| 10:00 AM to 10:59 AM | 25 (12.7%) | 4 (2.5%) |
| 11:00 AM to 11:59 AM | 0 (0.0%) | 14 (8.9%) |
| 12:00 PM to 3:59 PM | 4 (2.0%) | 12 (7.6%) |
| 4:00 PM to 11:59 PM | 12 (6.1%) | 12 (7.6%) |
| Total | 197 (100.0%) | 157 (100.0%) |
Housing Occupancy in Geyserville
Occupancy by Ownership in Geyserville
Of the total 345 dwellings in Geyserville, owner-occupied units account for 205 (59.4%), while renter-occupied units make up 140 (40.6%).
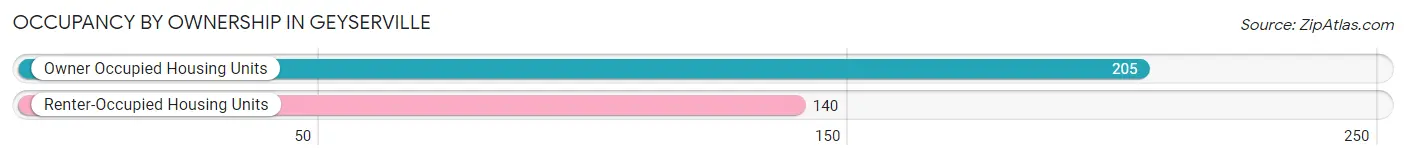
| Occupancy | # Housing Units | % Housing Units |
| Owner Occupied Housing Units | 205 | 59.4% |
| Renter-Occupied Housing Units | 140 | 40.6% |
| Total Occupied Housing Units | 345 | 100.0% |
Occupancy by Household Size in Geyserville
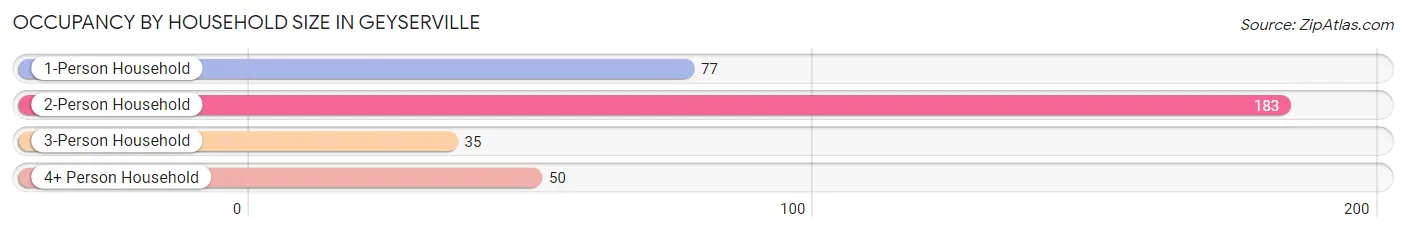
| Household Size | # Housing Units | % Housing Units |
| 1-Person Household | 77 | 22.3% |
| 2-Person Household | 183 | 53.0% |
| 3-Person Household | 35 | 10.1% |
| 4+ Person Household | 50 | 14.5% |
| Total Housing Units | 345 | 100.0% |
Occupancy by Ownership by Household Size in Geyserville
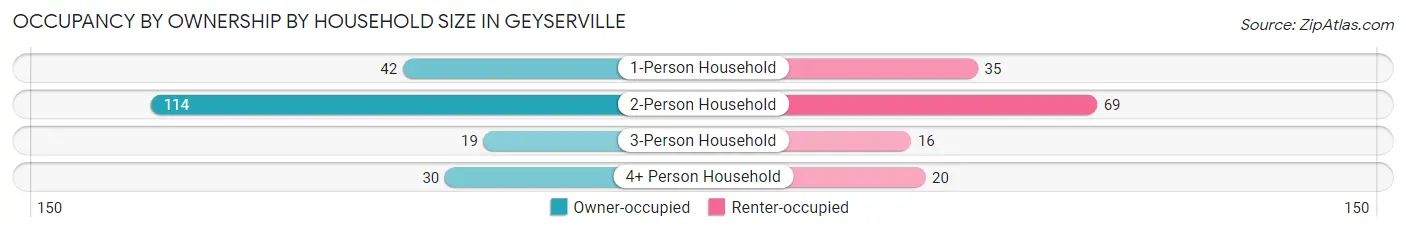
| Household Size | Owner-occupied | Renter-occupied |
| 1-Person Household | 42 (54.5%) | 35 (45.5%) |
| 2-Person Household | 114 (62.3%) | 69 (37.7%) |
| 3-Person Household | 19 (54.3%) | 16 (45.7%) |
| 4+ Person Household | 30 (60.0%) | 20 (40.0%) |
| Total Housing Units | 205 (59.4%) | 140 (40.6%) |
Occupancy by Educational Attainment in Geyserville
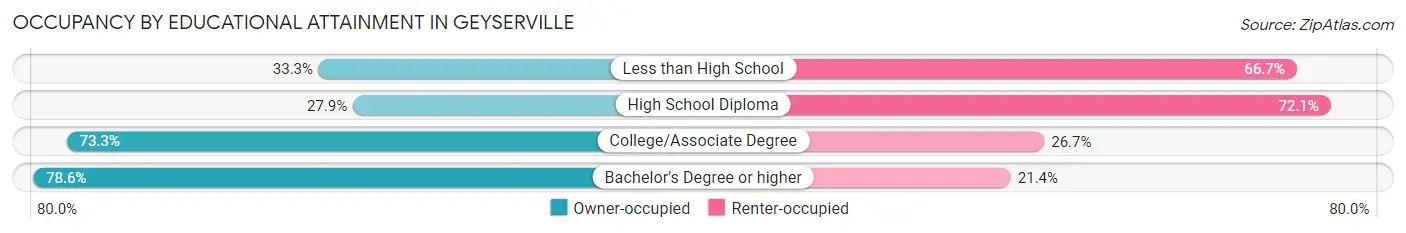
| Household Size | Owner-occupied | Renter-occupied |
| Less than High School | 12 (33.3%) | 24 (66.7%) |
| High School Diploma | 24 (27.9%) | 62 (72.1%) |
| College/Associate Degree | 88 (73.3%) | 32 (26.7%) |
| Bachelor's Degree or higher | 81 (78.6%) | 22 (21.4%) |
Occupancy by Age of Householder in Geyserville
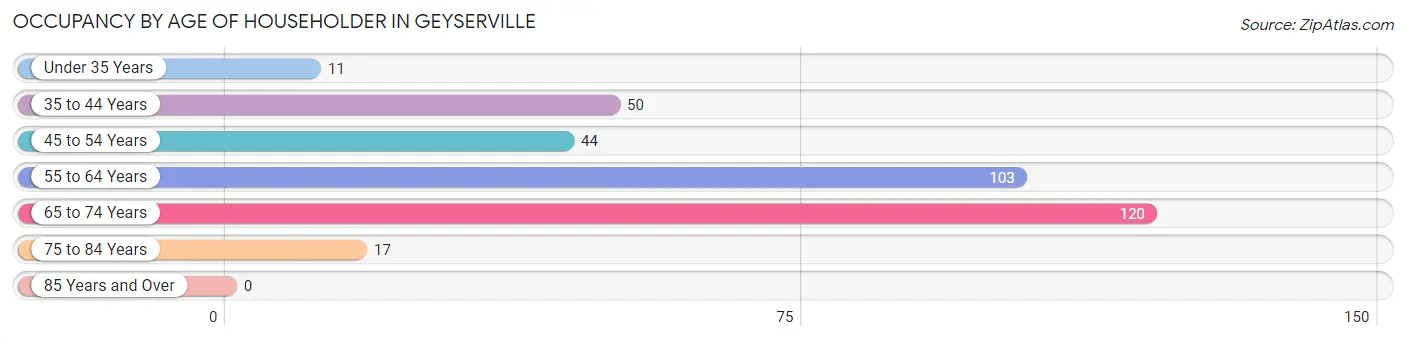
| Age Bracket | # Households | % Households |
| Under 35 Years | 11 | 3.2% |
| 35 to 44 Years | 50 | 14.5% |
| 45 to 54 Years | 44 | 12.8% |
| 55 to 64 Years | 103 | 29.9% |
| 65 to 74 Years | 120 | 34.8% |
| 75 to 84 Years | 17 | 4.9% |
| 85 Years and Over | 0 | 0.0% |
| Total | 345 | 100.0% |
Housing Finances in Geyserville
Median Income by Occupancy in Geyserville
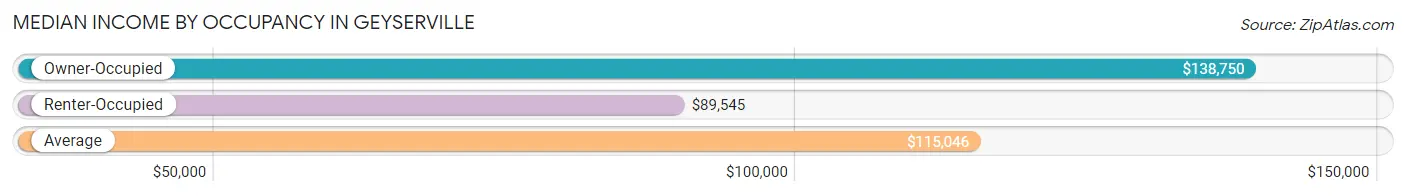
| Occupancy Type | # Households | Median Income |
| Owner-Occupied | 205 (59.4%) | $138,750 |
| Renter-Occupied | 140 (40.6%) | $89,545 |
| Average | 345 (100.0%) | $115,046 |
Occupancy by Householder Income Bracket in Geyserville
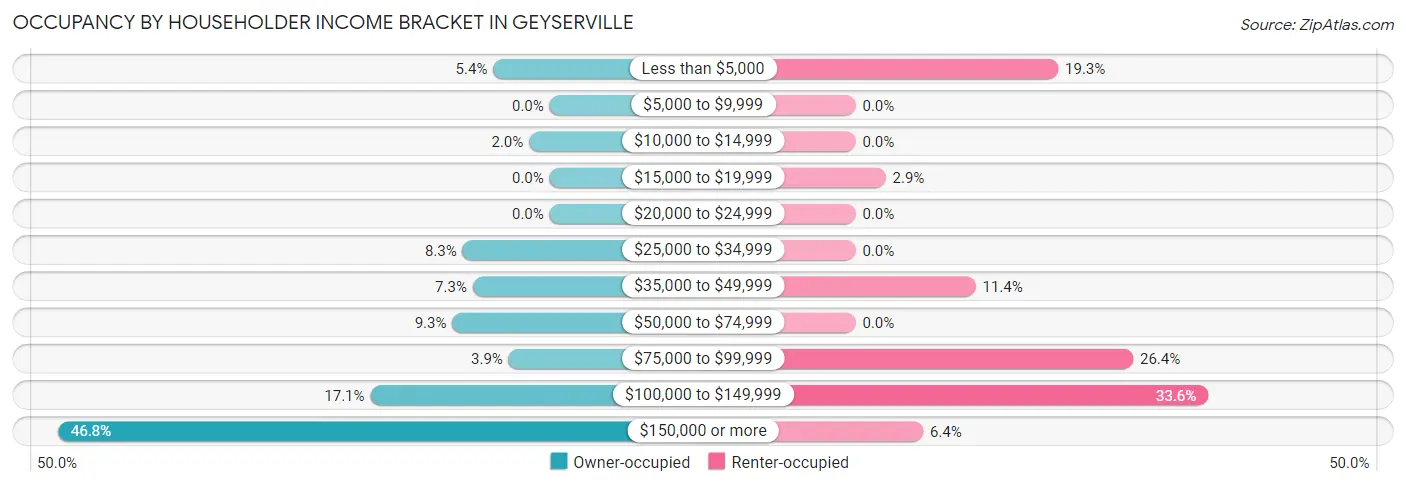
| Income Bracket | Owner-occupied | Renter-occupied |
| Less than $5,000 | 11 (5.4%) | 27 (19.3%) |
| $5,000 to $9,999 | 0 (0.0%) | 0 (0.0%) |
| $10,000 to $14,999 | 4 (1.9%) | 0 (0.0%) |
| $15,000 to $19,999 | 0 (0.0%) | 4 (2.9%) |
| $20,000 to $24,999 | 0 (0.0%) | 0 (0.0%) |
| $25,000 to $34,999 | 17 (8.3%) | 0 (0.0%) |
| $35,000 to $49,999 | 15 (7.3%) | 16 (11.4%) |
| $50,000 to $74,999 | 19 (9.3%) | 0 (0.0%) |
| $75,000 to $99,999 | 8 (3.9%) | 37 (26.4%) |
| $100,000 to $149,999 | 35 (17.1%) | 47 (33.6%) |
| $150,000 or more | 96 (46.8%) | 9 (6.4%) |
| Total | 205 (100.0%) | 140 (100.0%) |
Monthly Housing Cost Tiers in Geyserville
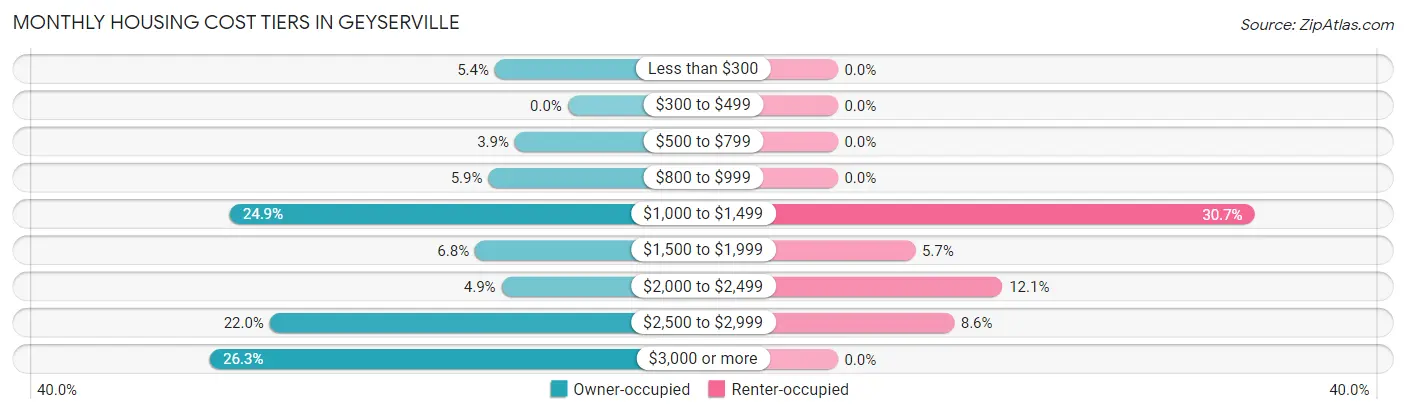
| Monthly Cost | Owner-occupied | Renter-occupied |
| Less than $300 | 11 (5.4%) | 0 (0.0%) |
| $300 to $499 | 0 (0.0%) | 0 (0.0%) |
| $500 to $799 | 8 (3.9%) | 0 (0.0%) |
| $800 to $999 | 12 (5.9%) | 0 (0.0%) |
| $1,000 to $1,499 | 51 (24.9%) | 43 (30.7%) |
| $1,500 to $1,999 | 14 (6.8%) | 8 (5.7%) |
| $2,000 to $2,499 | 10 (4.9%) | 17 (12.1%) |
| $2,500 to $2,999 | 45 (22.0%) | 12 (8.6%) |
| $3,000 or more | 54 (26.3%) | 0 (0.0%) |
| Total | 205 (100.0%) | 140 (100.0%) |
Physical Housing Characteristics in Geyserville
Housing Structures in Geyserville
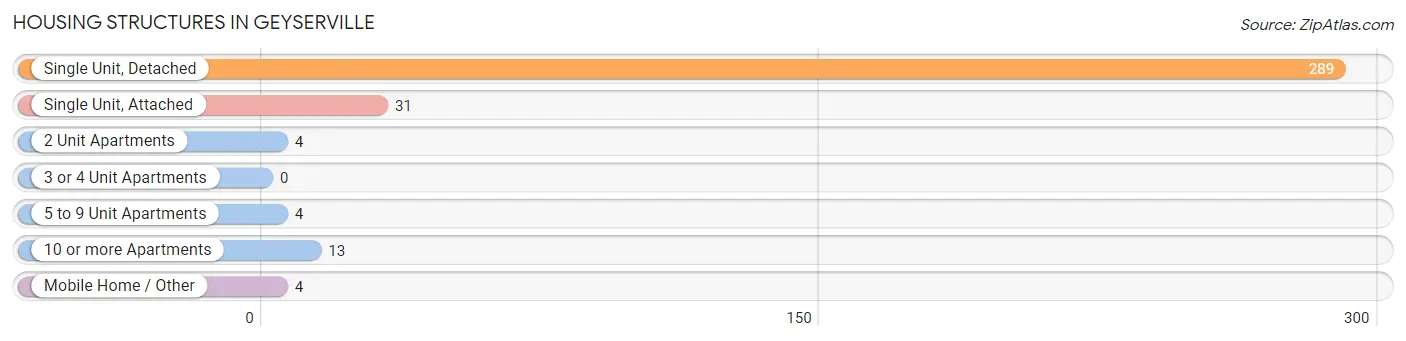
| Structure Type | # Housing Units | % Housing Units |
| Single Unit, Detached | 289 | 83.8% |
| Single Unit, Attached | 31 | 9.0% |
| 2 Unit Apartments | 4 | 1.2% |
| 3 or 4 Unit Apartments | 0 | 0.0% |
| 5 to 9 Unit Apartments | 4 | 1.2% |
| 10 or more Apartments | 13 | 3.8% |
| Mobile Home / Other | 4 | 1.2% |
| Total | 345 | 100.0% |
Housing Structures by Occupancy in Geyserville
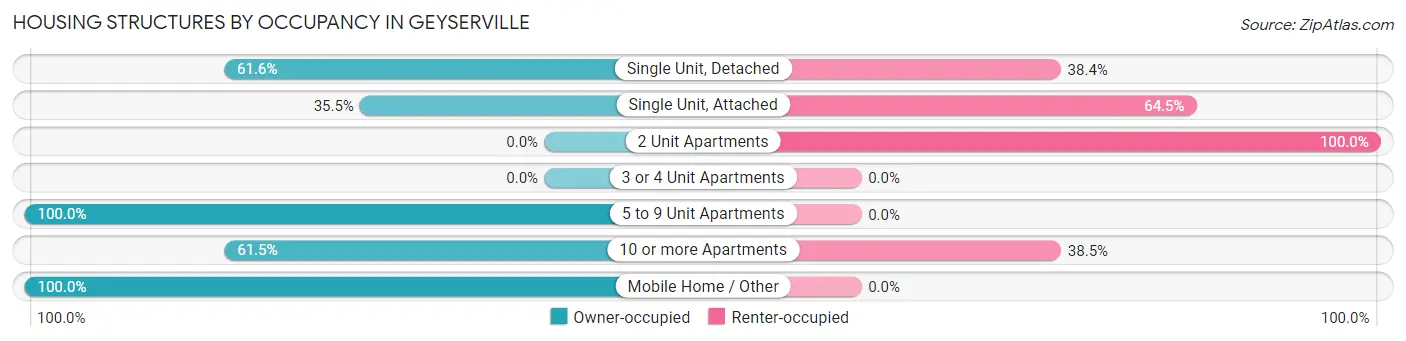
| Structure Type | Owner-occupied | Renter-occupied |
| Single Unit, Detached | 178 (61.6%) | 111 (38.4%) |
| Single Unit, Attached | 11 (35.5%) | 20 (64.5%) |
| 2 Unit Apartments | 0 (0.0%) | 4 (100.0%) |
| 3 or 4 Unit Apartments | 0 (0.0%) | 0 (0.0%) |
| 5 to 9 Unit Apartments | 4 (100.0%) | 0 (0.0%) |
| 10 or more Apartments | 8 (61.5%) | 5 (38.5%) |
| Mobile Home / Other | 4 (100.0%) | 0 (0.0%) |
| Total | 205 (59.4%) | 140 (40.6%) |
Housing Structures by Number of Rooms in Geyserville
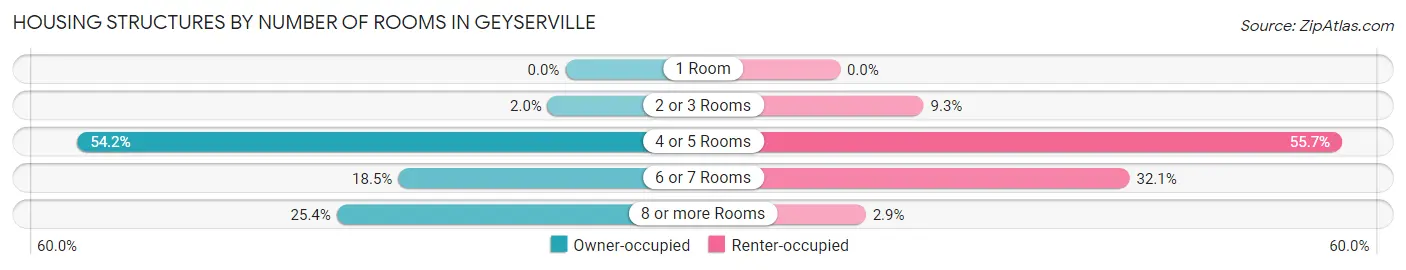
| Number of Rooms | Owner-occupied | Renter-occupied |
| 1 Room | 0 (0.0%) | 0 (0.0%) |
| 2 or 3 Rooms | 4 (1.9%) | 13 (9.3%) |
| 4 or 5 Rooms | 111 (54.1%) | 78 (55.7%) |
| 6 or 7 Rooms | 38 (18.5%) | 45 (32.1%) |
| 8 or more Rooms | 52 (25.4%) | 4 (2.9%) |
| Total | 205 (100.0%) | 140 (100.0%) |
Housing Structure by Heating Type in Geyserville
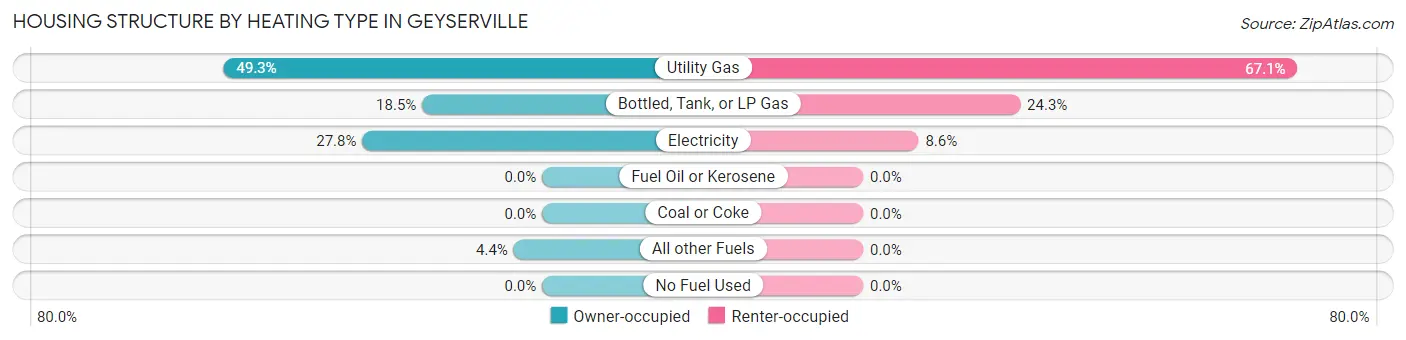
| Heating Type | Owner-occupied | Renter-occupied |
| Utility Gas | 101 (49.3%) | 94 (67.1%) |
| Bottled, Tank, or LP Gas | 38 (18.5%) | 34 (24.3%) |
| Electricity | 57 (27.8%) | 12 (8.6%) |
| Fuel Oil or Kerosene | 0 (0.0%) | 0 (0.0%) |
| Coal or Coke | 0 (0.0%) | 0 (0.0%) |
| All other Fuels | 9 (4.4%) | 0 (0.0%) |
| No Fuel Used | 0 (0.0%) | 0 (0.0%) |
| Total | 205 (100.0%) | 140 (100.0%) |
Household Vehicle Usage in Geyserville
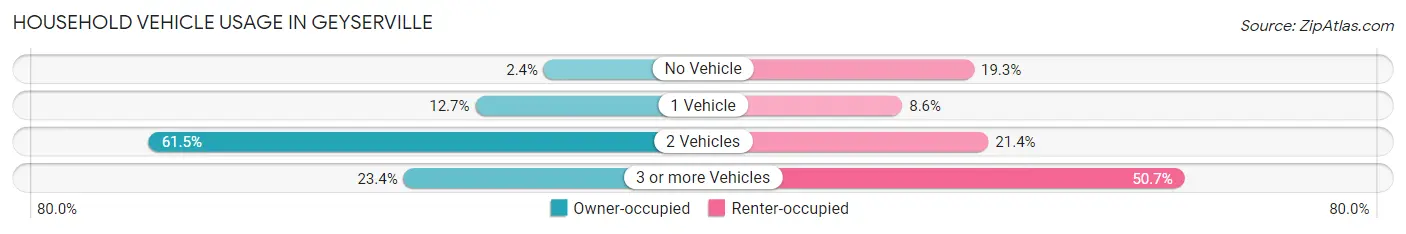
| Vehicles per Household | Owner-occupied | Renter-occupied |
| No Vehicle | 5 (2.4%) | 27 (19.3%) |
| 1 Vehicle | 26 (12.7%) | 12 (8.6%) |
| 2 Vehicles | 126 (61.5%) | 30 (21.4%) |
| 3 or more Vehicles | 48 (23.4%) | 71 (50.7%) |
| Total | 205 (100.0%) | 140 (100.0%) |
Real Estate & Mortgages in Geyserville
Real Estate and Mortgage Overview in Geyserville
| Characteristic | Without Mortgage | With Mortgage |
| Housing Units | 75 | 130 |
| Median Property Value | $1,784,100 | $703,900 |
| Median Household Income | $138,250 | $62 |
| Monthly Housing Costs | $1,196 | $54 |
| Real Estate Taxes | $7,625 | $0 |
Property Value by Mortgage Status in Geyserville
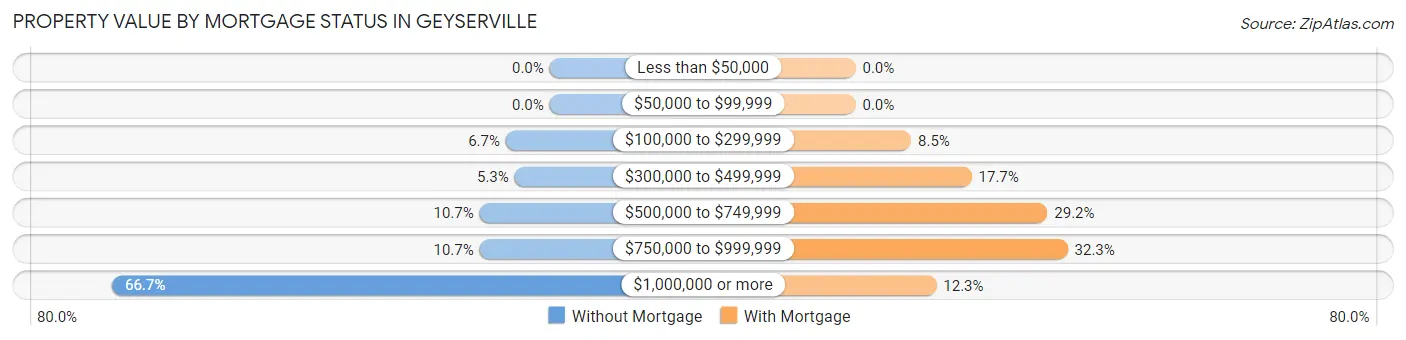
| Property Value | Without Mortgage | With Mortgage |
| Less than $50,000 | 0 (0.0%) | 0 (0.0%) |
| $50,000 to $99,999 | 0 (0.0%) | 0 (0.0%) |
| $100,000 to $299,999 | 5 (6.7%) | 11 (8.5%) |
| $300,000 to $499,999 | 4 (5.3%) | 23 (17.7%) |
| $500,000 to $749,999 | 8 (10.7%) | 38 (29.2%) |
| $750,000 to $999,999 | 8 (10.7%) | 42 (32.3%) |
| $1,000,000 or more | 50 (66.7%) | 16 (12.3%) |
| Total | 75 (100.0%) | 130 (100.0%) |
Household Income by Mortgage Status in Geyserville
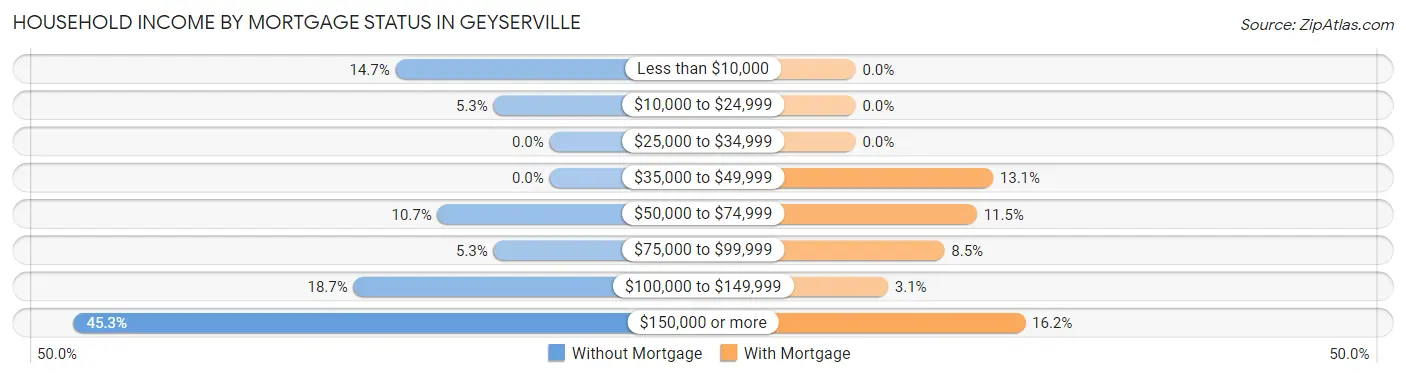
| Household Income | Without Mortgage | With Mortgage |
| Less than $10,000 | 11 (14.7%) | 0 (0.0%) |
| $10,000 to $24,999 | 4 (5.3%) | 0 (0.0%) |
| $25,000 to $34,999 | 0 (0.0%) | 0 (0.0%) |
| $35,000 to $49,999 | 0 (0.0%) | 17 (13.1%) |
| $50,000 to $74,999 | 8 (10.7%) | 15 (11.5%) |
| $75,000 to $99,999 | 4 (5.3%) | 11 (8.5%) |
| $100,000 to $149,999 | 14 (18.7%) | 4 (3.1%) |
| $150,000 or more | 34 (45.3%) | 21 (16.2%) |
| Total | 75 (100.0%) | 130 (100.0%) |
Property Value to Household Income Ratio in Geyserville
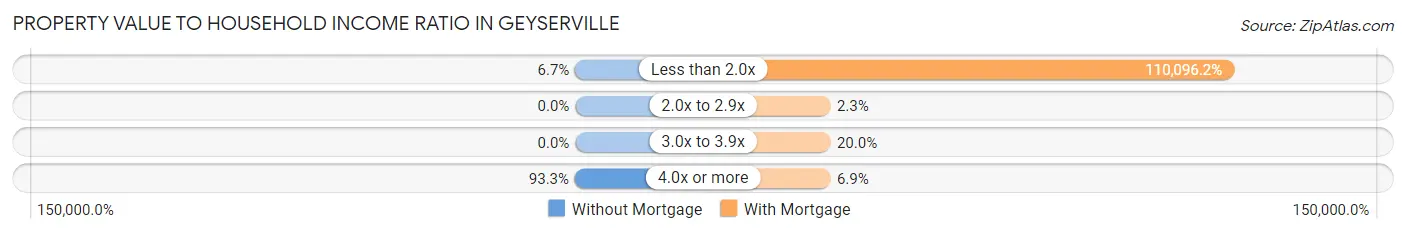
| Value-to-Income Ratio | Without Mortgage | With Mortgage |
| Less than 2.0x | 5 (6.7%) | 143,125 (110,096.1%) |
| 2.0x to 2.9x | 0 (0.0%) | 3 (2.3%) |
| 3.0x to 3.9x | 0 (0.0%) | 26 (20.0%) |
| 4.0x or more | 70 (93.3%) | 9 (6.9%) |
| Total | 75 (100.0%) | 130 (100.0%) |
Real Estate Taxes by Mortgage Status in Geyserville
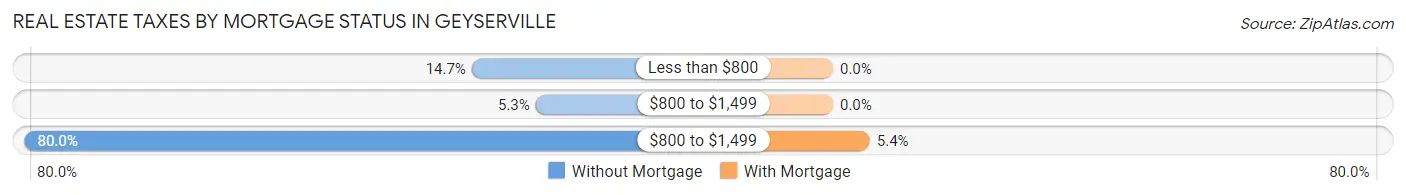
| Property Taxes | Without Mortgage | With Mortgage |
| Less than $800 | 11 (14.7%) | 0 (0.0%) |
| $800 to $1,499 | 4 (5.3%) | 0 (0.0%) |
| $800 to $1,499 | 60 (80.0%) | 7 (5.4%) |
| Total | 75 (100.0%) | 130 (100.0%) |
Health & Disability in Geyserville
Health Insurance Coverage by Age in Geyserville
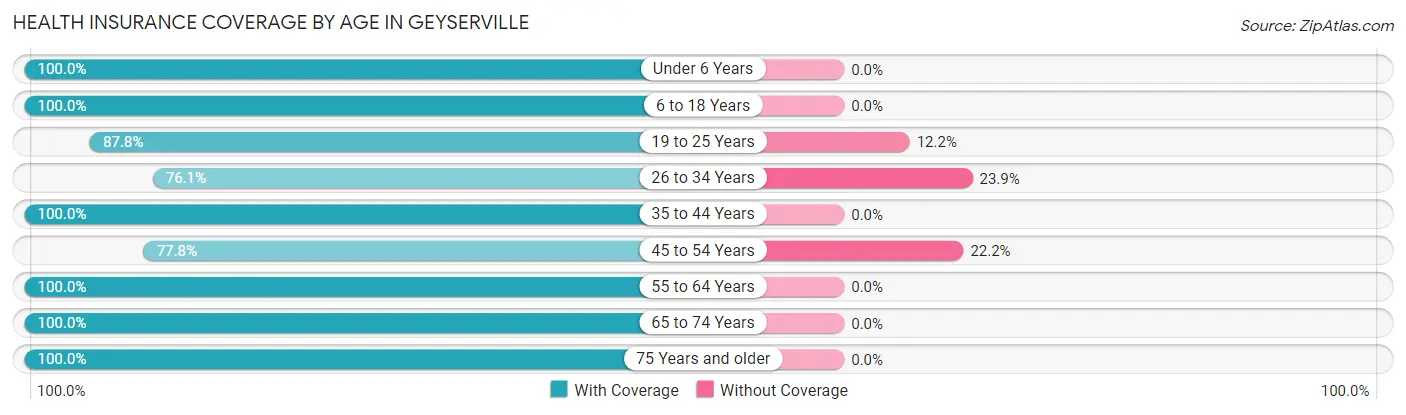
| Age Bracket | With Coverage | Without Coverage |
| Under 6 Years | 23 (100.0%) | 0 (0.0%) |
| 6 to 18 Years | 104 (100.0%) | 0 (0.0%) |
| 19 to 25 Years | 36 (87.8%) | 5 (12.2%) |
| 26 to 34 Years | 35 (76.1%) | 11 (23.9%) |
| 35 to 44 Years | 95 (100.0%) | 0 (0.0%) |
| 45 to 54 Years | 56 (77.8%) | 16 (22.2%) |
| 55 to 64 Years | 204 (100.0%) | 0 (0.0%) |
| 65 to 74 Years | 202 (100.0%) | 0 (0.0%) |
| 75 Years and older | 50 (100.0%) | 0 (0.0%) |
| Total | 805 (96.2%) | 32 (3.8%) |
Health Insurance Coverage by Citizenship Status in Geyserville
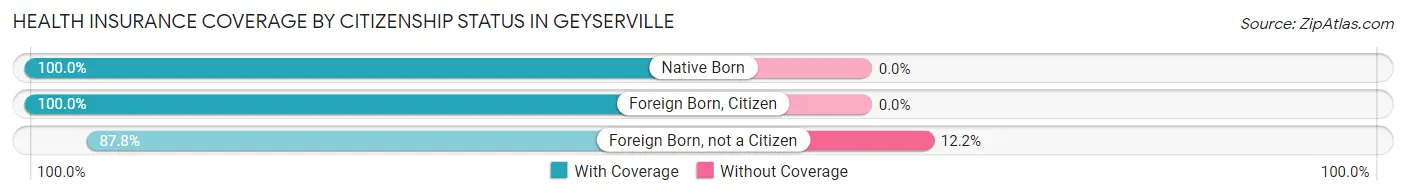
| Citizenship Status | With Coverage | Without Coverage |
| Native Born | 23 (100.0%) | 0 (0.0%) |
| Foreign Born, Citizen | 104 (100.0%) | 0 (0.0%) |
| Foreign Born, not a Citizen | 36 (87.8%) | 5 (12.2%) |
Health Insurance Coverage by Household Income in Geyserville
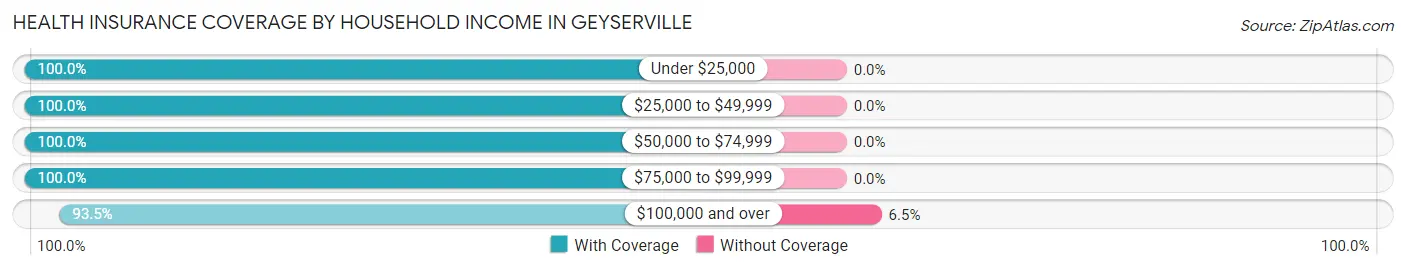
| Household Income | With Coverage | Without Coverage |
| Under $25,000 | 57 (100.0%) | 0 (0.0%) |
| $25,000 to $49,999 | 103 (100.0%) | 0 (0.0%) |
| $50,000 to $74,999 | 60 (100.0%) | 0 (0.0%) |
| $75,000 to $99,999 | 127 (100.0%) | 0 (0.0%) |
| $100,000 and over | 458 (93.5%) | 32 (6.5%) |
Public vs Private Health Insurance Coverage by Age in Geyserville
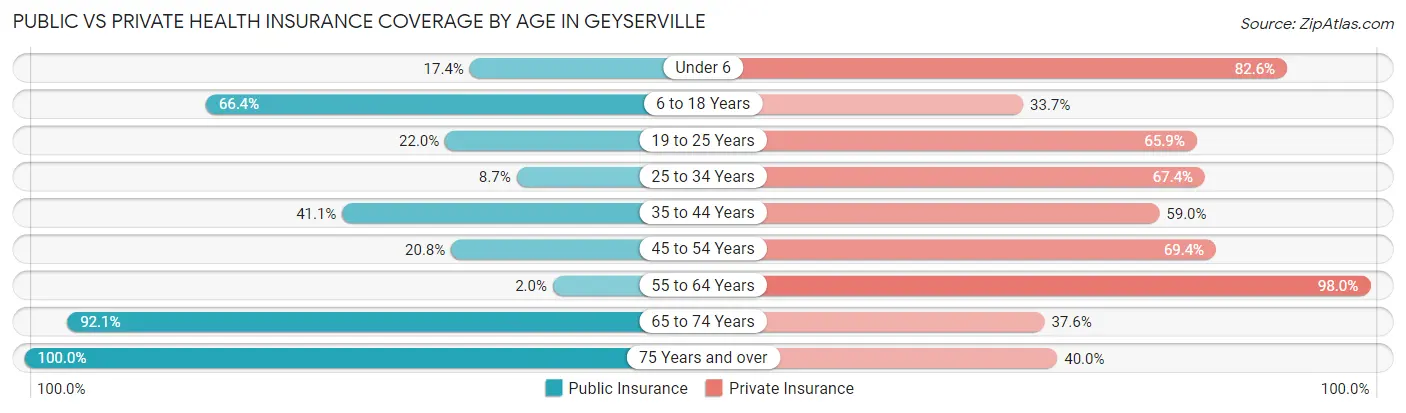
| Age Bracket | Public Insurance | Private Insurance |
| Under 6 | 4 (17.4%) | 19 (82.6%) |
| 6 to 18 Years | 69 (66.3%) | 35 (33.7%) |
| 19 to 25 Years | 9 (22.0%) | 27 (65.8%) |
| 25 to 34 Years | 4 (8.7%) | 31 (67.4%) |
| 35 to 44 Years | 39 (41.0%) | 56 (59.0%) |
| 45 to 54 Years | 15 (20.8%) | 50 (69.4%) |
| 55 to 64 Years | 4 (2.0%) | 200 (98.0%) |
| 65 to 74 Years | 186 (92.1%) | 76 (37.6%) |
| 75 Years and over | 50 (100.0%) | 20 (40.0%) |
| Total | 380 (45.4%) | 514 (61.4%) |
Disability Status by Sex by Age in Geyserville
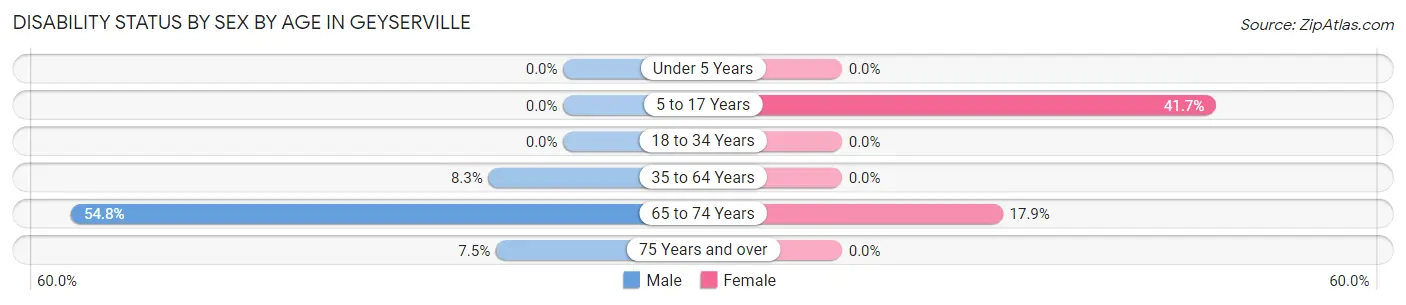
| Age Bracket | Male | Female |
| Under 5 Years | 0 (0.0%) | 0 (0.0%) |
| 5 to 17 Years | 0 (0.0%) | 20 (41.7%) |
| 18 to 34 Years | 0 (0.0%) | 0 (0.0%) |
| 35 to 64 Years | 15 (8.3%) | 0 (0.0%) |
| 65 to 74 Years | 74 (54.8%) | 12 (17.9%) |
| 75 Years and over | 3 (7.5%) | 0 (0.0%) |
Disability Class by Sex by Age in Geyserville
Disability Class: Hearing Difficulty
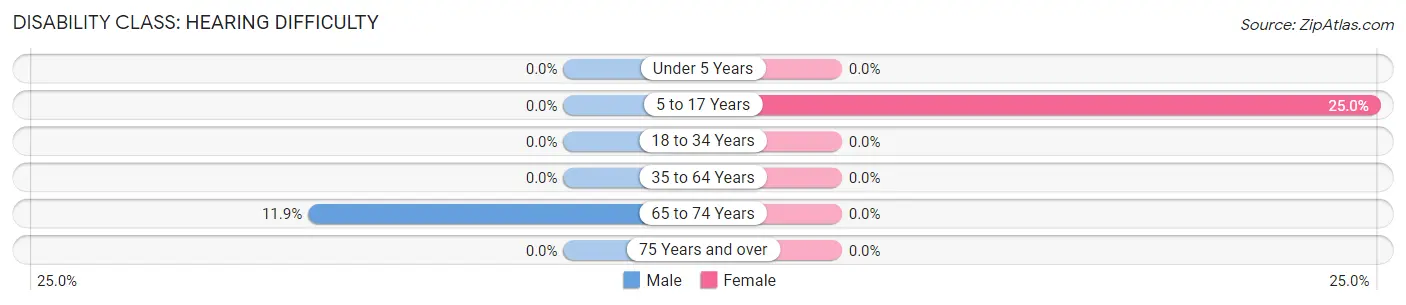
| Age Bracket | Male | Female |
| Under 5 Years | 0 (0.0%) | 0 (0.0%) |
| 5 to 17 Years | 0 (0.0%) | 12 (25.0%) |
| 18 to 34 Years | 0 (0.0%) | 0 (0.0%) |
| 35 to 64 Years | 0 (0.0%) | 0 (0.0%) |
| 65 to 74 Years | 16 (11.8%) | 0 (0.0%) |
| 75 Years and over | 0 (0.0%) | 0 (0.0%) |
Disability Class: Vision Difficulty
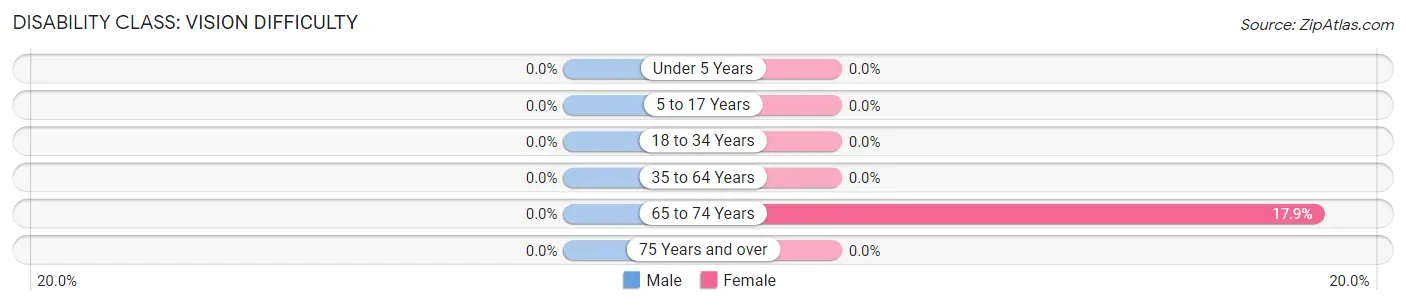
| Age Bracket | Male | Female |
| Under 5 Years | 0 (0.0%) | 0 (0.0%) |
| 5 to 17 Years | 0 (0.0%) | 0 (0.0%) |
| 18 to 34 Years | 0 (0.0%) | 0 (0.0%) |
| 35 to 64 Years | 0 (0.0%) | 0 (0.0%) |
| 65 to 74 Years | 0 (0.0%) | 12 (17.9%) |
| 75 Years and over | 0 (0.0%) | 0 (0.0%) |
Disability Class: Cognitive Difficulty
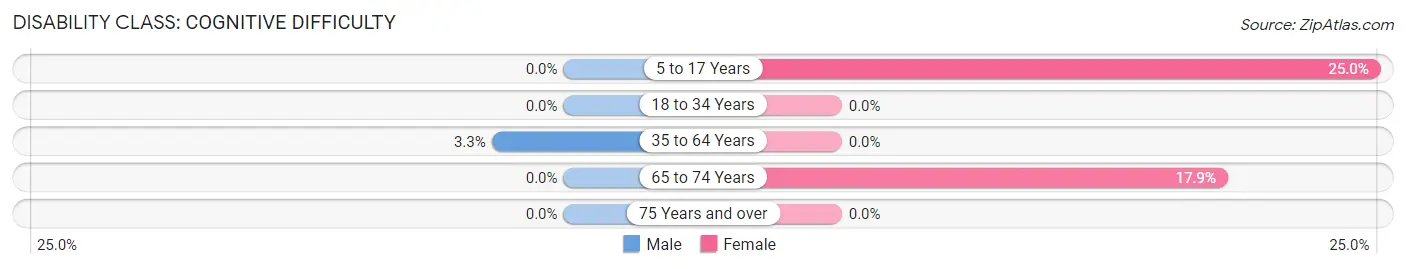
| Age Bracket | Male | Female |
| 5 to 17 Years | 0 (0.0%) | 12 (25.0%) |
| 18 to 34 Years | 0 (0.0%) | 0 (0.0%) |
| 35 to 64 Years | 6 (3.3%) | 0 (0.0%) |
| 65 to 74 Years | 0 (0.0%) | 12 (17.9%) |
| 75 Years and over | 0 (0.0%) | 0 (0.0%) |
Disability Class: Ambulatory Difficulty
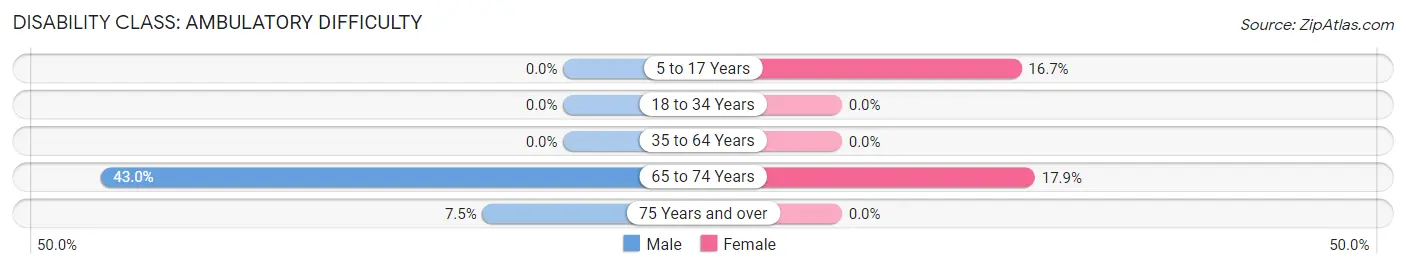
| Age Bracket | Male | Female |
| 5 to 17 Years | 0 (0.0%) | 8 (16.7%) |
| 18 to 34 Years | 0 (0.0%) | 0 (0.0%) |
| 35 to 64 Years | 0 (0.0%) | 0 (0.0%) |
| 65 to 74 Years | 58 (43.0%) | 12 (17.9%) |
| 75 Years and over | 3 (7.5%) | 0 (0.0%) |
Disability Class: Self-Care Difficulty
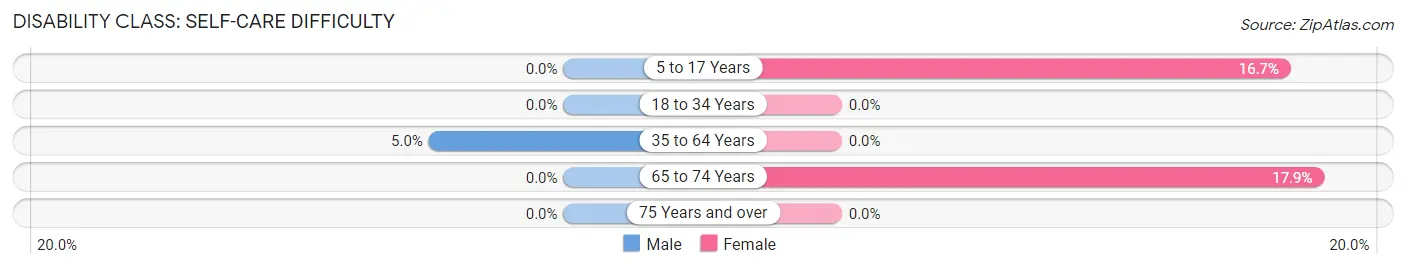
| Age Bracket | Male | Female |
| 5 to 17 Years | 0 (0.0%) | 8 (16.7%) |
| 18 to 34 Years | 0 (0.0%) | 0 (0.0%) |
| 35 to 64 Years | 9 (5.0%) | 0 (0.0%) |
| 65 to 74 Years | 0 (0.0%) | 12 (17.9%) |
| 75 Years and over | 0 (0.0%) | 0 (0.0%) |
Technology Access in Geyserville
Computing Device Access in Geyserville
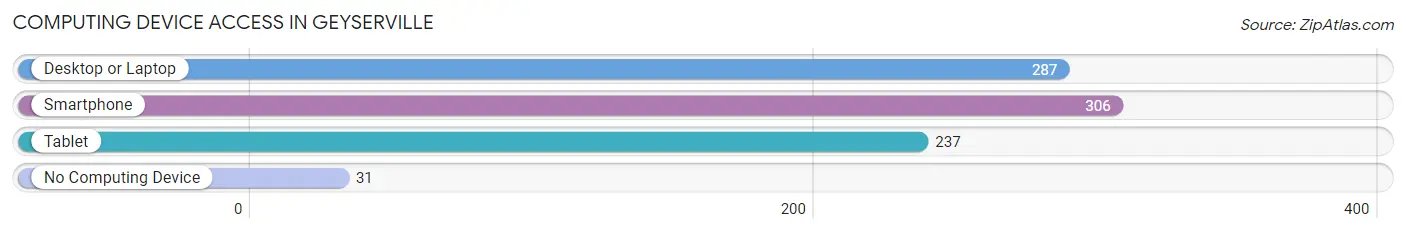
| Device Type | # Households | % Households |
| Desktop or Laptop | 287 | 83.2% |
| Smartphone | 306 | 88.7% |
| Tablet | 237 | 68.7% |
| No Computing Device | 31 | 9.0% |
| Total | 345 | 100.0% |
Internet Access in Geyserville
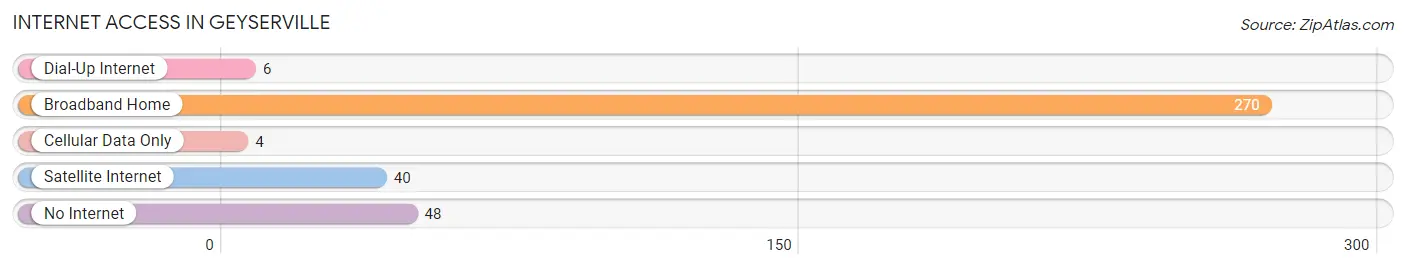
| Internet Type | # Households | % Households |
| Dial-Up Internet | 6 | 1.7% |
| Broadband Home | 270 | 78.3% |
| Cellular Data Only | 4 | 1.2% |
| Satellite Internet | 40 | 11.6% |
| No Internet | 48 | 13.9% |
| Total | 345 | 100.0% |
Geyserville Summary
Geyserville, California is a small unincorporated community located in Sonoma County, California. It is situated in the Alexander Valley, a wine-producing region of the North Coast AVA. The population of Geyserville was 862 at the 2010 census.
History
Geyserville was founded in 1847 by a group of settlers from the East Coast. The town was named after the nearby Geyser Creek, which was named after the geysers that were found in the area. The town was originally a mining camp, but it soon became a farming community. The first post office was established in 1854.
Geyserville was an important stop on the stagecoach route between Cloverdale and Healdsburg. The town was also a stop on the Northwestern Pacific Railroad, which ran from San Francisco to Eureka.
Geography
Geyserville is located in the Alexander Valley, a wine-producing region of the North Coast AVA. The town is situated at the intersection of State Route 128 and State Route 101. The town is surrounded by vineyards and rolling hills. The nearby Geyser Creek flows through the town.
The climate in Geyserville is Mediterranean, with hot, dry summers and mild, wet winters. The average annual temperature is 61°F (16°C). The average annual precipitation is 28 inches (71 cm).
Economy
The economy of Geyserville is largely based on agriculture and tourism. The town is home to several wineries, including the Geyser Peak Winery, which was founded in 1880. The town is also home to several restaurants, shops, and lodging establishments.
Demographics
As of the 2010 census, the population of Geyserville was 862. The racial makeup of the town was 79.2% White, 0.7% African American, 0.7% Native American, 0.7% Asian, 0.2% Pacific Islander, 16.2% from other races, and 2.2% from two or more races. Hispanic or Latino of any race were 28.2% of the population.
The median income for a household in Geyserville was $50,000, and the median income for a family was $54,375. The per capita income for the town was $25,945. About 11.2% of families and 14.2% of the population were below the poverty line, including 18.2% of those under age 18 and 8.3% of those age 65 or over.
Common Questions
What is Per Capita Income in Geyserville?
Per Capita income in Geyserville is $46,724.
What is the Median Family Income in Geyserville?
Median Family Income in Geyserville is $127,031.
What is the Median Household income in Geyserville?
Median Household Income in Geyserville is $115,046.
What is Income or Wage Gap in Geyserville?
Income or Wage Gap in Geyserville is 9.4%.
Women in Geyserville earn 90.6 cents for every dollar earned by a man.
What is Inequality or Gini Index in Geyserville?
Inequality or Gini Index in Geyserville is 0.38.
What is the Total Population of Geyserville?
Total Population of Geyserville is 837.
What is the Total Male Population of Geyserville?
Total Male Population of Geyserville is 474.
What is the Total Female Population of Geyserville?
Total Female Population of Geyserville is 363.
What is the Ratio of Males per 100 Females in Geyserville?
There are 130.58 Males per 100 Females in Geyserville.
What is the Ratio of Females per 100 Males in Geyserville?
There are 76.58 Females per 100 Males in Geyserville.
What is the Median Population Age in Geyserville?
Median Population Age in Geyserville is 58.0 Years.
What is the Average Family Size in Geyserville
Average Family Size in Geyserville is 2.9 People.
What is the Average Household Size in Geyserville
Average Household Size in Geyserville is 2.4 People.
How Large is the Labor Force in Geyserville?
There are 484 People in the Labor Forcein in Geyserville.
What is the Percentage of People in the Labor Force in Geyserville?
66.4% of People are in the Labor Force in Geyserville.
What is the Unemployment Rate in Geyserville?
Unemployment Rate in Geyserville is 6.6%.