Cities with the Highest Percentage of Subsaharan African Population in Pennsylvania
RELATED REPORTS & OPTIONS
Subsaharan African
Pennsylvania
Compare Cities
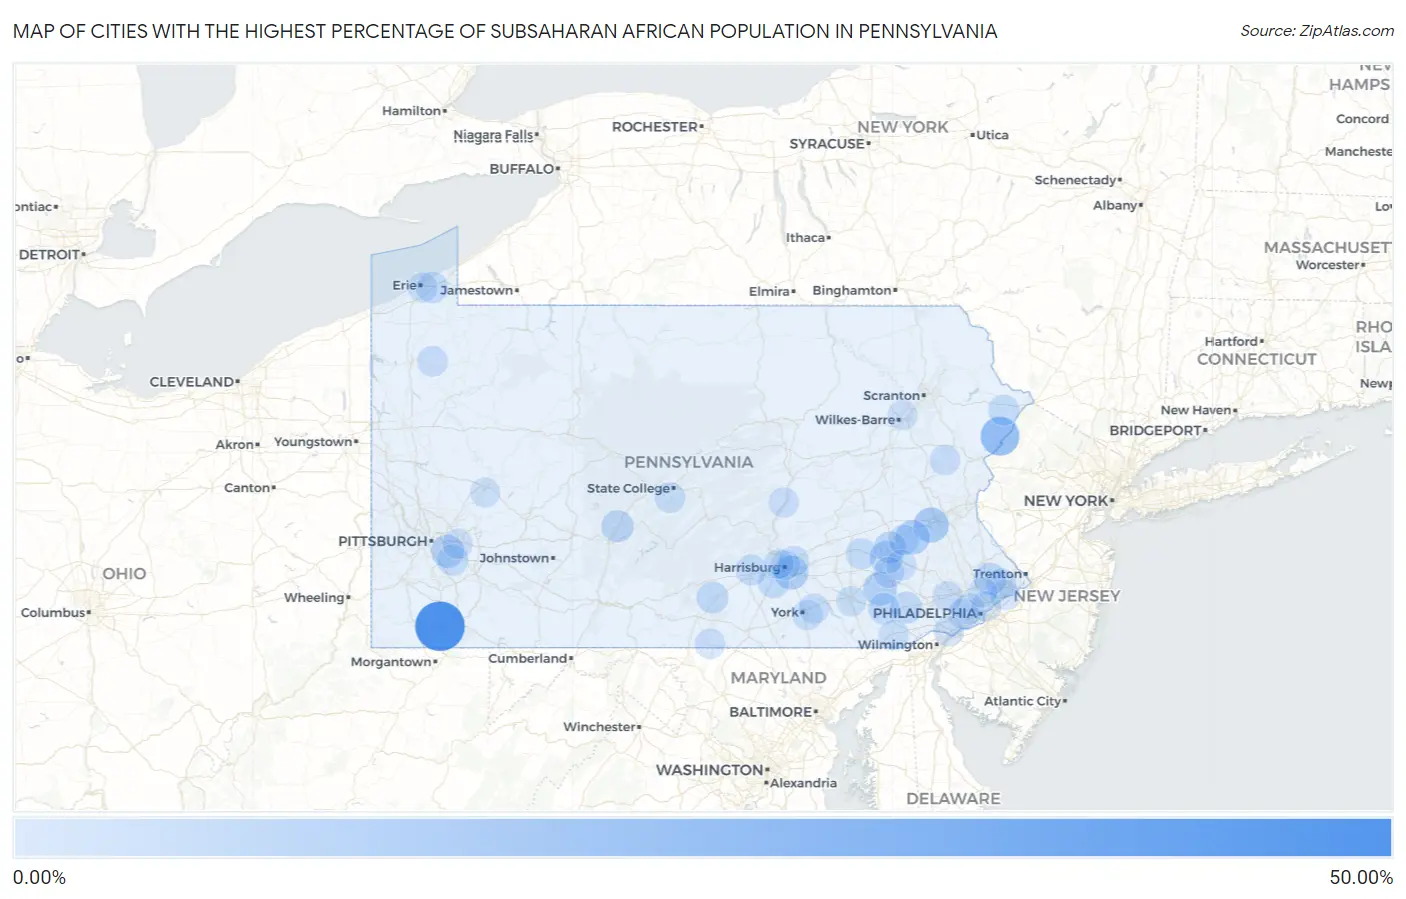
Map of Cities with the Highest Percentage of Subsaharan African Population in Pennsylvania
0.00%
50.00%
Cities with the Highest Percentage of Subsaharan African Population in Pennsylvania
| City | Subsaharan African | vs State | vs National | |
| 1. | Ronco | 46.15% | 0.99%(+45.2)#1 | 1.22%(+44.9)#11 |
| 2. | Colwyn Borough | 28.36% | 0.99%(+27.4)#2 | 1.22%(+27.1)#22 |
| 3. | Darby Borough | 21.65% | 0.99%(+20.7)#3 | 1.22%(+20.4)#44 |
| 4. | Pine Ridge | 21.10% | 0.99%(+20.1)#4 | 1.22%(+19.9)#46 |
| 5. | Folcroft Borough | 18.57% | 0.99%(+17.6)#5 | 1.22%(+17.4)#64 |
| 6. | Yeadon Borough | 15.81% | 0.99%(+14.8)#6 | 1.22%(+14.6)#87 |
| 7. | Seven Springs Borough | 15.79% | 0.99%(+14.8)#7 | 1.22%(+14.6)#88 |
| 8. | South Coatesville Borough | 14.68% | 0.99%(+13.7)#8 | 1.22%(+13.5)#106 |
| 9. | Trexlertown | 12.89% | 0.99%(+11.9)#9 | 1.22%(+11.7)#130 |
| 10. | Dryville | 11.35% | 0.99%(+10.4)#10 | 1.22%(+10.1)#155 |
| 11. | Lansdowne Borough | 11.05% | 0.99%(+10.1)#11 | 1.22%(+9.83)#165 |
| 12. | Enhaut | 10.78% | 0.99%(+9.79)#12 | 1.22%(+9.57)#177 |
| 13. | North Braddock Borough | 10.67% | 0.99%(+9.68)#13 | 1.22%(+9.46)#185 |
| 14. | Sharon Hill Borough | 10.64% | 0.99%(+9.65)#14 | 1.22%(+9.43)#187 |
| 15. | Blue Ball | 10.40% | 0.99%(+9.41)#15 | 1.22%(+9.18)#202 |
| 16. | Millbourne Borough | 10.04% | 0.99%(+9.05)#16 | 1.22%(+8.82)#213 |
| 17. | Aldan Borough | 9.63% | 0.99%(+8.64)#17 | 1.22%(+8.42)#224 |
| 18. | Braddock Borough | 8.71% | 0.99%(+7.72)#18 | 1.22%(+7.49)#263 |
| 19. | East Pittsburgh Borough | 8.57% | 0.99%(+7.59)#19 | 1.22%(+7.36)#272 |
| 20. | Schwenksville Borough | 8.49% | 0.99%(+7.50)#20 | 1.22%(+7.28)#276 |
| 21. | Duquesne | 8.45% | 0.99%(+7.46)#21 | 1.22%(+7.24)#277 |
| 22. | West Lawn | 8.37% | 0.99%(+7.38)#22 | 1.22%(+7.16)#284 |
| 23. | Chalfant Borough | 7.86% | 0.99%(+6.87)#23 | 1.22%(+6.64)#320 |
| 24. | Wall Borough | 7.41% | 0.99%(+6.43)#24 | 1.22%(+6.20)#352 |
| 25. | Warminster Heights | 6.85% | 0.99%(+5.86)#25 | 1.22%(+5.63)#395 |
| 26. | Greenwood | 6.78% | 0.99%(+5.80)#26 | 1.22%(+5.57)#400 |
| 27. | Fox Chase | 6.59% | 0.99%(+5.60)#27 | 1.22%(+5.38)#415 |
| 28. | Whitaker Borough | 6.09% | 0.99%(+5.10)#28 | 1.22%(+4.87)#469 |
| 29. | Coatesville | 6.05% | 0.99%(+5.07)#29 | 1.22%(+4.84)#471 |
| 30. | Shippensburg University | 5.77% | 0.99%(+4.78)#30 | 1.22%(+4.55)#509 |
| 31. | Loganville Borough | 5.76% | 0.99%(+4.77)#31 | 1.22%(+4.54)#510 |
| 32. | Collingdale Borough | 5.57% | 0.99%(+4.58)#32 | 1.22%(+4.36)#544 |
| 33. | East Lansdowne Borough | 5.29% | 0.99%(+4.30)#33 | 1.22%(+4.08)#583 |
| 34. | Penn State Erie Behrend | 5.18% | 0.99%(+4.20)#34 | 1.22%(+3.97)#604 |
| 35. | Gap | 5.08% | 0.99%(+4.09)#35 | 1.22%(+3.86)#627 |
| 36. | Homestead Borough | 5.06% | 0.99%(+4.07)#36 | 1.22%(+3.85)#629 |
| 37. | Langhorne Manor Borough | 5.05% | 0.99%(+4.07)#37 | 1.22%(+3.84)#630 |
| 38. | Messiah College | 5.03% | 0.99%(+4.04)#38 | 1.22%(+3.82)#638 |
| 39. | Greenock | 4.70% | 0.99%(+3.71)#39 | 1.22%(+3.48)#694 |
| 40. | Prospect Park Borough | 4.66% | 0.99%(+3.68)#40 | 1.22%(+3.45)#705 |
| 41. | Ambler Borough | 4.62% | 0.99%(+3.63)#41 | 1.22%(+3.40)#714 |
| 42. | Red Hill Borough | 4.58% | 0.99%(+3.59)#42 | 1.22%(+3.37)#720 |
| 43. | Morgan Hill | 4.51% | 0.99%(+3.52)#43 | 1.22%(+3.29)#737 |
| 44. | Newmanstown | 4.40% | 0.99%(+3.41)#44 | 1.22%(+3.18)#760 |
| 45. | Schlusser | 4.33% | 0.99%(+3.34)#45 | 1.22%(+3.12)#776 |
| 46. | Clifton Heights Borough | 4.11% | 0.99%(+3.12)#46 | 1.22%(+2.90)#832 |
| 47. | Sunrise Lake | 4.04% | 0.99%(+3.05)#47 | 1.22%(+2.82)#855 |
| 48. | East Stroudsburg Borough | 4.03% | 0.99%(+3.05)#48 | 1.22%(+2.82)#856 |
| 49. | Penn Wynne | 4.02% | 0.99%(+3.03)#49 | 1.22%(+2.80)#862 |
| 50. | Drexel Hill | 4.01% | 0.99%(+3.02)#50 | 1.22%(+2.79)#863 |
| 51. | Carlisle Borough | 3.94% | 0.99%(+2.96)#51 | 1.22%(+2.73)#878 |
| 52. | Nazareth Borough | 3.81% | 0.99%(+2.82)#52 | 1.22%(+2.59)#920 |
| 53. | Alleghenyville | 3.77% | 0.99%(+2.78)#53 | 1.22%(+2.55)#935 |
| 54. | Penbrook Borough | 3.56% | 0.99%(+2.58)#54 | 1.22%(+2.35)#1,003 |
| 55. | Pine Grove Mills | 3.51% | 0.99%(+2.53)#55 | 1.22%(+2.30)#1,015 |
| 56. | Colonial Park | 3.45% | 0.99%(+2.46)#56 | 1.22%(+2.24)#1,033 |
| 57. | Guys Mills | 3.39% | 0.99%(+2.40)#57 | 1.22%(+2.17)#1,052 |
| 58. | Blawnox Borough | 3.33% | 0.99%(+2.34)#58 | 1.22%(+2.11)#1,083 |
| 59. | Edwardsville Borough | 3.27% | 0.99%(+2.28)#59 | 1.22%(+2.05)#1,108 |
| 60. | Gibraltar | 3.24% | 0.99%(+2.25)#60 | 1.22%(+2.02)#1,125 |
| 61. | Walnuttown | 3.23% | 0.99%(+2.25)#61 | 1.22%(+2.02)#1,130 |
| 62. | Chesterbrook | 3.17% | 0.99%(+2.18)#62 | 1.22%(+1.95)#1,159 |
| 63. | Chalfont Borough | 3.10% | 0.99%(+2.11)#63 | 1.22%(+1.88)#1,196 |
| 64. | Boothwyn | 3.07% | 0.99%(+2.08)#64 | 1.22%(+1.85)#1,207 |
| 65. | Penndel Borough | 3.04% | 0.99%(+2.05)#65 | 1.22%(+1.83)#1,220 |
| 66. | Sun Valley | 3.04% | 0.99%(+2.05)#66 | 1.22%(+1.82)#1,222 |
| 67. | Norristown Borough | 3.04% | 0.99%(+2.05)#67 | 1.22%(+1.82)#1,224 |
| 68. | Mechanicsburg Borough | 3.00% | 0.99%(+2.01)#68 | 1.22%(+1.78)#1,244 |
| 69. | Queens Gate | 2.94% | 0.99%(+1.96)#69 | 1.22%(+1.73)#1,276 |
| 70. | Swissvale Borough | 2.93% | 0.99%(+1.95)#70 | 1.22%(+1.72)#1,281 |
| 71. | Loretto Borough | 2.89% | 0.99%(+1.90)#71 | 1.22%(+1.67)#1,297 |
| 72. | Stonybrook | 2.85% | 0.99%(+1.86)#72 | 1.22%(+1.64)#1,308 |
| 73. | Cornwells Heights | 2.84% | 0.99%(+1.85)#73 | 1.22%(+1.62)#1,317 |
| 74. | Freemansburg Borough | 2.83% | 0.99%(+1.84)#74 | 1.22%(+1.62)#1,321 |
| 75. | Trevose | 2.81% | 0.99%(+1.82)#75 | 1.22%(+1.59)#1,335 |
| 76. | Dover Borough | 2.78% | 0.99%(+1.79)#76 | 1.22%(+1.56)#1,358 |
| 77. | Wayne Heights | 2.73% | 0.99%(+1.75)#77 | 1.22%(+1.52)#1,382 |
| 78. | Lincoln University | 2.72% | 0.99%(+1.73)#78 | 1.22%(+1.51)#1,389 |
| 79. | Ingram Borough | 2.72% | 0.99%(+1.73)#79 | 1.22%(+1.50)#1,392 |
| 80. | Port Trevorton | 2.70% | 0.99%(+1.71)#80 | 1.22%(+1.49)#1,397 |
| 81. | Parkesburg Borough | 2.65% | 0.99%(+1.66)#81 | 1.22%(+1.43)#1,427 |
| 82. | Lancaster | 2.62% | 0.99%(+1.64)#82 | 1.22%(+1.41)#1,443 |
| 83. | Philadelphia | 2.59% | 0.99%(+1.60)#83 | 1.22%(+1.37)#1,465 |
| 84. | Castle Shannon Borough | 2.54% | 0.99%(+1.55)#84 | 1.22%(+1.32)#1,503 |
| 85. | Elkins Park | 2.51% | 0.99%(+1.52)#85 | 1.22%(+1.29)#1,516 |
| 86. | Monroeville | 2.49% | 0.99%(+1.50)#86 | 1.22%(+1.27)#1,535 |
| 87. | Pitcairn Borough | 2.46% | 0.99%(+1.48)#87 | 1.22%(+1.25)#1,549 |
| 88. | Wilkinsburg Borough | 2.41% | 0.99%(+1.43)#88 | 1.22%(+1.20)#1,578 |
| 89. | Rosemont | 2.41% | 0.99%(+1.42)#89 | 1.22%(+1.19)#1,580 |
| 90. | Plains | 2.40% | 0.99%(+1.41)#90 | 1.22%(+1.19)#1,587 |
| 91. | Harrisburg | 2.40% | 0.99%(+1.41)#91 | 1.22%(+1.19)#1,589 |
| 92. | Rankin Borough | 2.40% | 0.99%(+1.41)#92 | 1.22%(+1.18)#1,595 |
| 93. | Wyncote | 2.37% | 0.99%(+1.38)#93 | 1.22%(+1.15)#1,609 |
| 94. | Masontown Borough | 2.33% | 0.99%(+1.34)#94 | 1.22%(+1.11)#1,646 |
| 95. | Waynesboro Borough | 2.32% | 0.99%(+1.33)#95 | 1.22%(+1.10)#1,662 |
| 96. | Enola | 2.27% | 0.99%(+1.28)#96 | 1.22%(+1.06)#1,693 |
| 97. | Hayti | 2.27% | 0.99%(+1.28)#97 | 1.22%(+1.06)#1,694 |
| 98. | Lenape Heights | 2.27% | 0.99%(+1.28)#98 | 1.22%(+1.06)#1,696 |
| 99. | Crafton Borough | 2.23% | 0.99%(+1.25)#99 | 1.22%(+1.02)#1,727 |
| 100. | Erie | 2.20% | 0.99%(+1.22)#100 | 1.22%(+0.989)#1,758 |
Common Questions
What are the Top 10 Cities with the Highest Percentage of Subsaharan African Population in Pennsylvania?
Top 10 Cities with the Highest Percentage of Subsaharan African Population in Pennsylvania are:
#1
46.15%
#2
21.10%
#3
12.89%
#4
11.35%
#5
10.78%
#6
10.40%
#7
8.45%
#8
8.37%
#9
6.85%
#10
6.78%
What city has the Highest Percentage of Subsaharan African Population in Pennsylvania?
Ronco has the Highest Percentage of Subsaharan African Population in Pennsylvania with 46.15%.
What is the Percentage of Subsaharan African Population in the State of Pennsylvania?
Percentage of Subsaharan African Population in Pennsylvania is 0.99%.
What is the Percentage of Subsaharan African Population in the United States?
Percentage of Subsaharan African Population in the United States is 1.22%.