Cities with the Highest Percentage of Subsaharan African Population in Delaware
RELATED REPORTS & OPTIONS
Subsaharan African
Delaware
Compare Cities
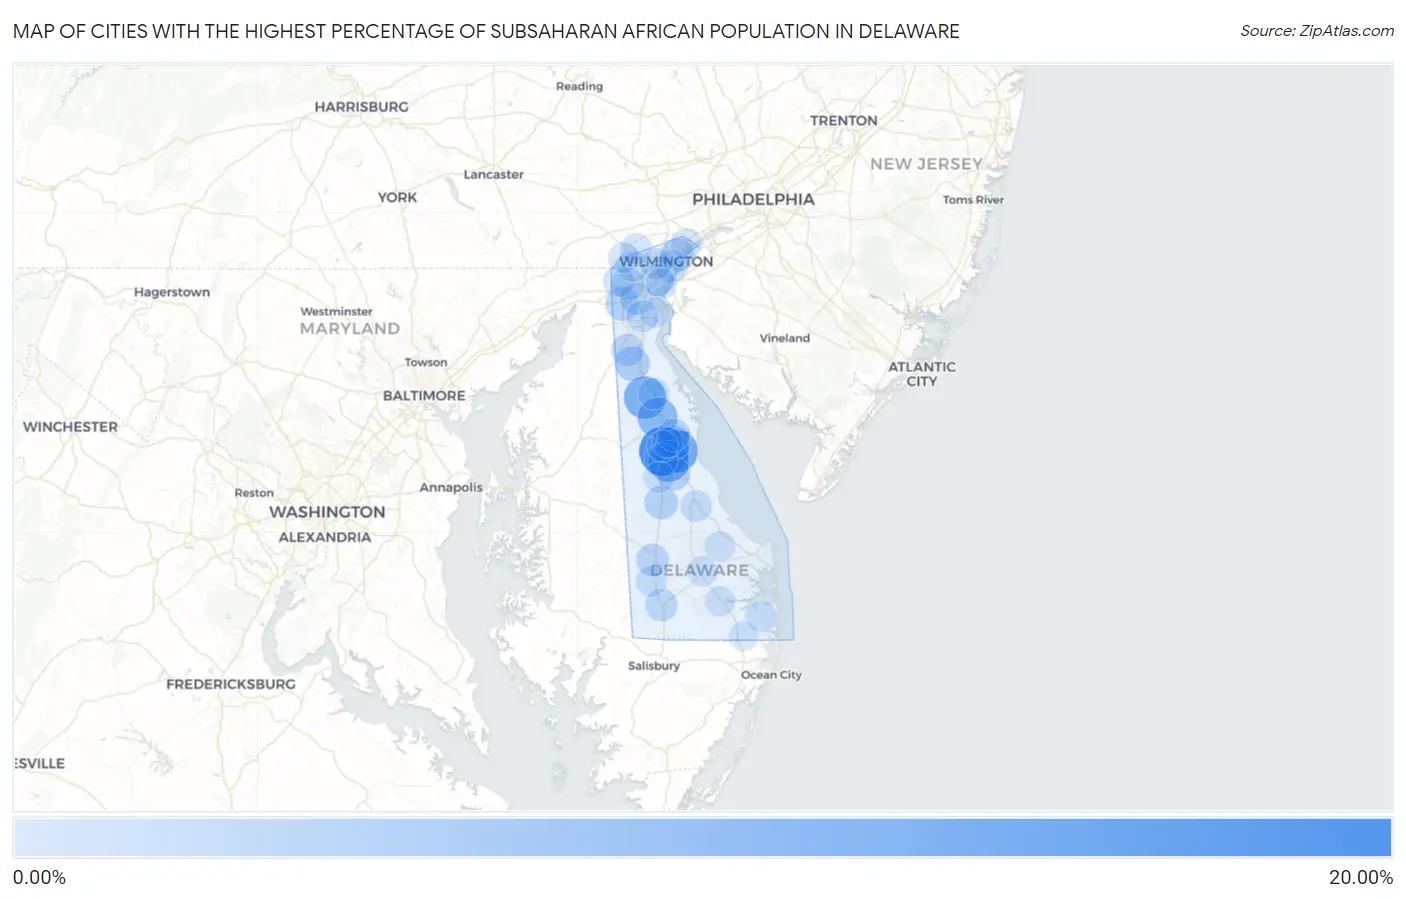
Map of Cities with the Highest Percentage of Subsaharan African Population in Delaware
0.00%
20.00%
Cities with the Highest Percentage of Subsaharan African Population in Delaware
| City | Subsaharan African | vs State | vs National | |
| 1. | Camden | 15.99% | 1.62%(+14.4)#1 | 1.22%(+14.8)#83 |
| 2. | Rising Sun Lebanon | 10.94% | 1.62%(+9.31)#2 | 1.22%(+9.72)#170 |
| 3. | Clayton | 9.85% | 1.62%(+8.23)#3 | 1.22%(+8.64)#218 |
| 4. | Woodside East | 9.04% | 1.62%(+7.42)#4 | 1.22%(+7.83)#246 |
| 5. | Cheswold | 8.05% | 1.62%(+6.43)#5 | 1.22%(+6.84)#304 |
| 6. | Townsend | 3.70% | 1.62%(+2.08)#6 | 1.22%(+2.49)#958 |
| 7. | Kent Acres | 3.11% | 1.62%(+1.49)#7 | 1.22%(+1.89)#1,194 |
| 8. | Glasgow | 2.95% | 1.62%(+1.33)#8 | 1.22%(+1.74)#1,268 |
| 9. | Harrington | 2.89% | 1.62%(+1.27)#9 | 1.22%(+1.68)#1,293 |
| 10. | Bellefonte | 2.82% | 1.62%(+1.20)#10 | 1.22%(+1.60)#1,325 |
| 11. | Riverview | 2.69% | 1.62%(+1.07)#11 | 1.22%(+1.47)#1,408 |
| 12. | Woodside | 2.37% | 1.62%(+0.750)#12 | 1.22%(+1.16)#1,607 |
| 13. | Middletown | 2.11% | 1.62%(+0.491)#13 | 1.22%(+0.897)#1,857 |
| 14. | Bridgeville | 2.08% | 1.62%(+0.464)#14 | 1.22%(+0.870)#1,890 |
| 15. | Dover | 2.05% | 1.62%(+0.426)#15 | 1.22%(+0.832)#1,917 |
| 16. | Wilmington | 2.00% | 1.62%(+0.382)#16 | 1.22%(+0.788)#1,969 |
| 17. | Laurel | 1.97% | 1.62%(+0.352)#17 | 1.22%(+0.758)#2,005 |
| 18. | Brookside | 1.93% | 1.62%(+0.312)#18 | 1.22%(+0.718)#2,046 |
| 19. | Bear | 1.80% | 1.62%(+0.178)#19 | 1.22%(+0.584)#2,214 |
| 20. | Wilmington Manor | 1.59% | 1.62%(-0.035)#20 | 1.22%(+0.371)#2,531 |
| 21. | St Georges | 1.46% | 1.62%(-0.164)#21 | 1.22%(+0.242)#2,737 |
| 22. | Milford | 1.23% | 1.62%(-0.392)#22 | 1.22%(+0.014)#3,203 |
| 23. | Smyrna | 1.13% | 1.62%(-0.494)#23 | 1.22%(-0.088)#3,417 |
| 24. | Newark | 0.99% | 1.62%(-0.636)#24 | 1.22%(-0.230)#3,764 |
| 25. | Seaford | 0.89% | 1.62%(-0.727)#25 | 1.22%(-0.321)#4,049 |
| 26. | Elsmere | 0.81% | 1.62%(-0.814)#26 | 1.22%(-0.408)#4,339 |
| 27. | Pike Creek Valley | 0.80% | 1.62%(-0.818)#27 | 1.22%(-0.412)#4,359 |
| 28. | Hockessin | 0.76% | 1.62%(-0.865)#28 | 1.22%(-0.459)#4,535 |
| 29. | Millville | 0.73% | 1.62%(-0.890)#29 | 1.22%(-0.484)#4,620 |
| 30. | New Castle | 0.71% | 1.62%(-0.915)#30 | 1.22%(-0.509)#4,710 |
| 31. | Claymont | 0.70% | 1.62%(-0.924)#31 | 1.22%(-0.518)#4,744 |
| 32. | Wyoming | 0.69% | 1.62%(-0.933)#32 | 1.22%(-0.527)#4,779 |
| 33. | North Star | 0.68% | 1.62%(-0.940)#33 | 1.22%(-0.534)#4,824 |
| 34. | Felton | 0.62% | 1.62%(-1.00)#34 | 1.22%(-0.599)#5,133 |
| 35. | Millsboro | 0.36% | 1.62%(-1.26)#35 | 1.22%(-0.852)#6,526 |
| 36. | Milton | 0.36% | 1.62%(-1.26)#36 | 1.22%(-0.857)#6,565 |
| 37. | Rodney Village | 0.23% | 1.62%(-1.39)#37 | 1.22%(-0.985)#7,543 |
| 38. | Georgetown | 0.21% | 1.62%(-1.41)#38 | 1.22%(-1.01)#7,730 |
| 39. | Delaware City | 0.10% | 1.62%(-1.52)#39 | 1.22%(-1.11)#8,607 |
| 40. | Selbyville | 0.034% | 1.62%(-1.59)#40 | 1.22%(-1.18)#9,137 |
1
Common Questions
What are the Top 10 Cities with the Highest Percentage of Subsaharan African Population in Delaware?
Top 10 Cities with the Highest Percentage of Subsaharan African Population in Delaware are:
#1
15.99%
#2
10.94%
#3
9.85%
#4
9.04%
#5
8.05%
#6
3.70%
#7
3.11%
#8
2.95%
#9
2.89%
#10
2.82%
What city has the Highest Percentage of Subsaharan African Population in Delaware?
Camden has the Highest Percentage of Subsaharan African Population in Delaware with 15.99%.
What is the Percentage of Subsaharan African Population in the State of Delaware?
Percentage of Subsaharan African Population in Delaware is 1.62%.
What is the Percentage of Subsaharan African Population in the United States?
Percentage of Subsaharan African Population in the United States is 1.22%.