Cities with the Highest Percentage of Subsaharan African Population in Oklahoma
RELATED REPORTS & OPTIONS
Subsaharan African
Oklahoma
Compare Cities
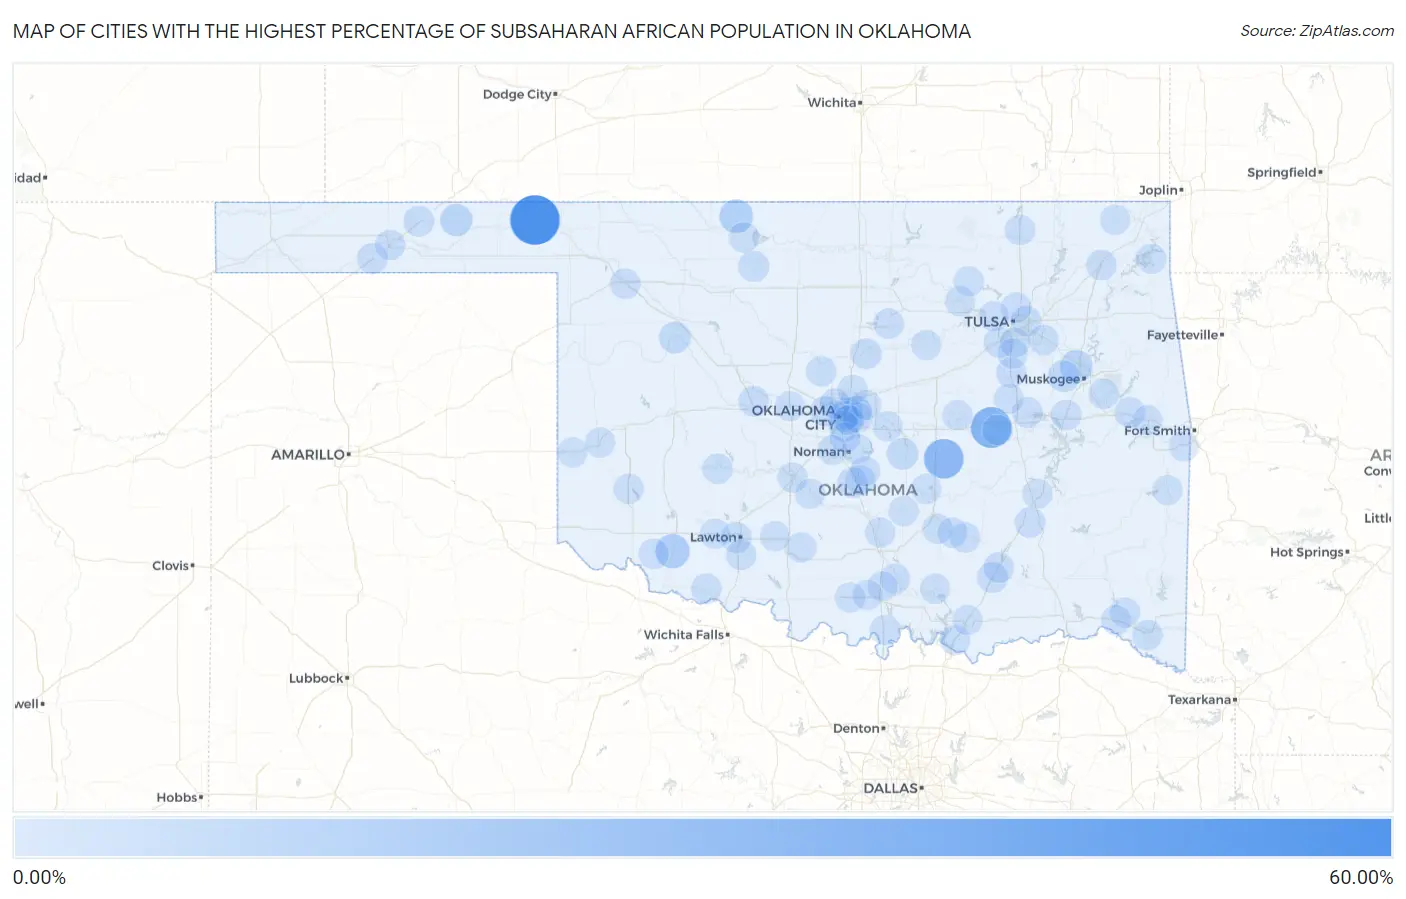
Map of Cities with the Highest Percentage of Subsaharan African Population in Oklahoma
0.00%
60.00%
Cities with the Highest Percentage of Subsaharan African Population in Oklahoma
| City | Subsaharan African | vs State | vs National | |
| 1. | Knowles | 54.55% | 0.61%(+53.9)#1 | 1.22%(+53.3)#6 |
| 2. | Clearview | 29.55% | 0.61%(+28.9)#2 | 1.22%(+28.3)#20 |
| 3. | Lima | 26.09% | 0.61%(+25.5)#3 | 1.22%(+24.9)#26 |
| 4. | Manitou | 10.92% | 0.61%(+10.3)#4 | 1.22%(+9.70)#171 |
| 5. | Burlington | 9.84% | 0.61%(+9.22)#5 | 1.22%(+8.62)#219 |
| 6. | Tullahassee | 6.61% | 0.61%(+6.00)#6 | 1.22%(+5.40)#413 |
| 7. | Turpin | 5.84% | 0.61%(+5.22)#7 | 1.22%(+4.62)#499 |
| 8. | Dixon | 5.36% | 0.61%(+4.75)#8 | 1.22%(+4.14)#573 |
| 9. | Taloga | 4.29% | 0.61%(+3.68)#9 | 1.22%(+3.08)#787 |
| 10. | Taft | 4.12% | 0.61%(+3.51)#10 | 1.22%(+2.91)#827 |
| 11. | Brooksville | 4.08% | 0.61%(+3.47)#11 | 1.22%(+2.87)#838 |
| 12. | Helena | 2.40% | 0.61%(+1.79)#12 | 1.22%(+1.18)#1,592 |
| 13. | Tushka | 2.35% | 0.61%(+1.74)#13 | 1.22%(+1.14)#1,623 |
| 14. | Canadian Shores | 2.14% | 0.61%(+1.52)#14 | 1.22%(+0.920)#1,830 |
| 15. | Forest Park | 2.04% | 0.61%(+1.43)#15 | 1.22%(+0.828)#1,921 |
| 16. | Hooker | 1.86% | 0.61%(+1.25)#16 | 1.22%(+0.643)#2,133 |
| 17. | Langston | 1.83% | 0.61%(+1.22)#17 | 1.22%(+0.618)#2,171 |
| 18. | Lawton | 1.67% | 0.61%(+1.06)#18 | 1.22%(+0.453)#2,406 |
| 19. | Spencer | 1.66% | 0.61%(+1.05)#19 | 1.22%(+0.448)#2,412 |
| 20. | Goodwell | 1.61% | 0.61%(+0.993)#20 | 1.22%(+0.390)#2,501 |
| 21. | Atoka | 1.55% | 0.61%(+0.939)#21 | 1.22%(+0.336)#2,572 |
| 22. | Geary | 1.52% | 0.61%(+0.912)#22 | 1.22%(+0.309)#2,613 |
| 23. | Grayson | 1.52% | 0.61%(+0.903)#23 | 1.22%(+0.300)#2,627 |
| 24. | Vian | 1.46% | 0.61%(+0.847)#24 | 1.22%(+0.244)#2,733 |
| 25. | Valley Brook | 1.36% | 0.61%(+0.753)#25 | 1.22%(+0.150)#2,920 |
| 26. | Pittsburg | 1.28% | 0.61%(+0.670)#26 | 1.22%(+0.067)#3,087 |
| 27. | Checotah | 1.25% | 0.61%(+0.635)#27 | 1.22%(+0.032)#3,164 |
| 28. | Midwest City | 1.25% | 0.61%(+0.634)#28 | 1.22%(+0.031)#3,167 |
| 29. | Tulsa | 1.21% | 0.61%(+0.598)#29 | 1.22%(-0.005)#3,236 |
| 30. | Oklahoma City | 1.21% | 0.61%(+0.597)#30 | 1.22%(-0.006)#3,238 |
| 31. | Colbert | 1.20% | 0.61%(+0.586)#31 | 1.22%(-0.018)#3,265 |
| 32. | Guymon | 1.14% | 0.61%(+0.526)#32 | 1.22%(-0.077)#3,387 |
| 33. | Big Cabin | 1.14% | 0.61%(+0.524)#33 | 1.22%(-0.079)#3,393 |
| 34. | Bethany | 1.07% | 0.61%(+0.460)#34 | 1.22%(-0.143)#3,520 |
| 35. | Stillwater | 1.06% | 0.61%(+0.447)#35 | 1.22%(-0.156)#3,545 |
| 36. | The Village | 1.05% | 0.61%(+0.443)#36 | 1.22%(-0.160)#3,555 |
| 37. | Woodward | 1.05% | 0.61%(+0.440)#37 | 1.22%(-0.163)#3,566 |
| 38. | Dewey | 1.04% | 0.61%(+0.424)#38 | 1.22%(-0.179)#3,608 |
| 39. | Tupelo | 1.03% | 0.61%(+0.419)#39 | 1.22%(-0.184)#3,629 |
| 40. | Turley | 0.99% | 0.61%(+0.382)#40 | 1.22%(-0.221)#3,735 |
| 41. | Grandfield | 0.99% | 0.61%(+0.375)#41 | 1.22%(-0.228)#3,760 |
| 42. | Purcell | 0.98% | 0.61%(+0.368)#42 | 1.22%(-0.235)#3,779 |
| 43. | Beggs | 0.98% | 0.61%(+0.365)#43 | 1.22%(-0.238)#3,788 |
| 44. | Gene Autry | 0.96% | 0.61%(+0.349)#44 | 1.22%(-0.254)#3,825 |
| 45. | Tipton | 0.96% | 0.61%(+0.348)#45 | 1.22%(-0.255)#3,829 |
| 46. | Sand Hill | 0.93% | 0.61%(+0.322)#46 | 1.22%(-0.281)#3,923 |
| 47. | Idabel | 0.93% | 0.61%(+0.317)#47 | 1.22%(-0.286)#3,939 |
| 48. | Geronimo | 0.92% | 0.61%(+0.312)#48 | 1.22%(-0.292)#3,955 |
| 49. | Moore | 0.86% | 0.61%(+0.245)#49 | 1.22%(-0.358)#4,160 |
| 50. | Weleetka | 0.84% | 0.61%(+0.229)#50 | 1.22%(-0.374)#4,216 |
| 51. | Edmond | 0.84% | 0.61%(+0.224)#51 | 1.22%(-0.379)#4,246 |
| 52. | Carnegie | 0.82% | 0.61%(+0.208)#52 | 1.22%(-0.395)#4,300 |
| 53. | Del City | 0.80% | 0.61%(+0.190)#53 | 1.22%(-0.413)#4,360 |
| 54. | Norwood | 0.78% | 0.61%(+0.173)#54 | 1.22%(-0.431)#4,420 |
| 55. | Broken Arrow | 0.78% | 0.61%(+0.165)#55 | 1.22%(-0.438)#4,442 |
| 56. | Ada | 0.76% | 0.61%(+0.150)#56 | 1.22%(-0.453)#4,512 |
| 57. | Cashion | 0.76% | 0.61%(+0.146)#57 | 1.22%(-0.457)#4,526 |
| 58. | Sapulpa | 0.74% | 0.61%(+0.123)#58 | 1.22%(-0.480)#4,604 |
| 59. | Boley | 0.72% | 0.61%(+0.110)#59 | 1.22%(-0.493)#4,654 |
| 60. | Welch | 0.65% | 0.61%(+0.037)#60 | 1.22%(-0.566)#4,977 |
| 61. | Norman | 0.64% | 0.61%(+0.032)#61 | 1.22%(-0.571)#5,002 |
| 62. | Glenpool | 0.64% | 0.61%(+0.031)#62 | 1.22%(-0.572)#5,011 |
| 63. | Cherokee | 0.64% | 0.61%(+0.031)#63 | 1.22%(-0.572)#5,015 |
| 64. | Mcloud | 0.64% | 0.61%(+0.025)#64 | 1.22%(-0.578)#5,037 |
| 65. | Cleveland | 0.62% | 0.61%(+0.010)#65 | 1.22%(-0.593)#5,102 |
| 66. | Konawa | 0.60% | 0.61%(-0.013)#66 | 1.22%(-0.616)#5,201 |
| 67. | Ardmore | 0.59% | 0.61%(-0.027)#67 | 1.22%(-0.630)#5,263 |
| 68. | Pocola | 0.58% | 0.61%(-0.030)#68 | 1.22%(-0.633)#5,272 |
| 69. | Hominy | 0.54% | 0.61%(-0.071)#69 | 1.22%(-0.674)#5,478 |
| 70. | Cache | 0.54% | 0.61%(-0.074)#70 | 1.22%(-0.677)#5,491 |
| 71. | Wright City | 0.52% | 0.61%(-0.094)#71 | 1.22%(-0.697)#5,595 |
| 72. | Stratford | 0.52% | 0.61%(-0.094)#72 | 1.22%(-0.697)#5,597 |
| 73. | Okmulgee | 0.51% | 0.61%(-0.102)#73 | 1.22%(-0.705)#5,647 |
| 74. | Jenks | 0.51% | 0.61%(-0.106)#74 | 1.22%(-0.709)#5,668 |
| 75. | Chickasha | 0.51% | 0.61%(-0.107)#75 | 1.22%(-0.710)#5,674 |
| 76. | Marietta | 0.50% | 0.61%(-0.116)#76 | 1.22%(-0.719)#5,722 |
| 77. | Sayre | 0.48% | 0.61%(-0.136)#77 | 1.22%(-0.739)#5,852 |
| 78. | Stonewall | 0.47% | 0.61%(-0.145)#78 | 1.22%(-0.748)#5,899 |
| 79. | Durant | 0.45% | 0.61%(-0.159)#79 | 1.22%(-0.762)#5,971 |
| 80. | Newcastle | 0.44% | 0.61%(-0.169)#80 | 1.22%(-0.772)#6,028 |
| 81. | Lexington | 0.44% | 0.61%(-0.170)#81 | 1.22%(-0.773)#6,035 |
| 82. | Erick | 0.42% | 0.61%(-0.193)#82 | 1.22%(-0.796)#6,162 |
| 83. | Valliant | 0.42% | 0.61%(-0.195)#83 | 1.22%(-0.798)#6,182 |
| 84. | Sand Springs | 0.41% | 0.61%(-0.206)#84 | 1.22%(-0.809)#6,246 |
| 85. | Slaughterville | 0.41% | 0.61%(-0.206)#85 | 1.22%(-0.809)#6,252 |
| 86. | Central High | 0.41% | 0.61%(-0.207)#86 | 1.22%(-0.810)#6,256 |
| 87. | Howe | 0.40% | 0.61%(-0.213)#87 | 1.22%(-0.816)#6,300 |
| 88. | Mcalester | 0.39% | 0.61%(-0.220)#88 | 1.22%(-0.823)#6,356 |
| 89. | Jones | 0.38% | 0.61%(-0.236)#89 | 1.22%(-0.839)#6,449 |
| 90. | El Reno | 0.35% | 0.61%(-0.263)#90 | 1.22%(-0.866)#6,626 |
| 91. | Duncan | 0.33% | 0.61%(-0.287)#91 | 1.22%(-0.890)#6,793 |
| 92. | Cushing | 0.32% | 0.61%(-0.288)#92 | 1.22%(-0.891)#6,799 |
| 93. | Tishomingo | 0.32% | 0.61%(-0.291)#93 | 1.22%(-0.894)#6,817 |
| 94. | Alex | 0.32% | 0.61%(-0.296)#94 | 1.22%(-0.899)#6,856 |
| 95. | Wilson | 0.31% | 0.61%(-0.302)#95 | 1.22%(-0.905)#6,891 |
| 96. | Sallisaw | 0.31% | 0.61%(-0.307)#96 | 1.22%(-0.910)#6,921 |
| 97. | Wynnewood | 0.28% | 0.61%(-0.329)#97 | 1.22%(-0.932)#7,074 |
| 98. | Lone Grove | 0.28% | 0.61%(-0.334)#98 | 1.22%(-0.937)#7,107 |
| 99. | Granite | 0.27% | 0.61%(-0.341)#99 | 1.22%(-0.944)#7,170 |
| 100. | Grove | 0.27% | 0.61%(-0.341)#100 | 1.22%(-0.944)#7,177 |
Common Questions
What are the Top 10 Cities with the Highest Percentage of Subsaharan African Population in Oklahoma?
Top 10 Cities with the Highest Percentage of Subsaharan African Population in Oklahoma are:
#1
54.55%
#2
29.55%
#3
26.09%
#4
10.92%
#5
9.84%
#6
6.61%
#7
5.84%
#8
4.29%
#9
4.12%
#10
4.08%
What city has the Highest Percentage of Subsaharan African Population in Oklahoma?
Knowles has the Highest Percentage of Subsaharan African Population in Oklahoma with 54.55%.
What is the Percentage of Subsaharan African Population in the State of Oklahoma?
Percentage of Subsaharan African Population in Oklahoma is 0.61%.
What is the Percentage of Subsaharan African Population in the United States?
Percentage of Subsaharan African Population in the United States is 1.22%.