Cities with the Highest Percentage of Subsaharan African Population in Virginia
RELATED REPORTS & OPTIONS
Subsaharan African
Virginia
Compare Cities
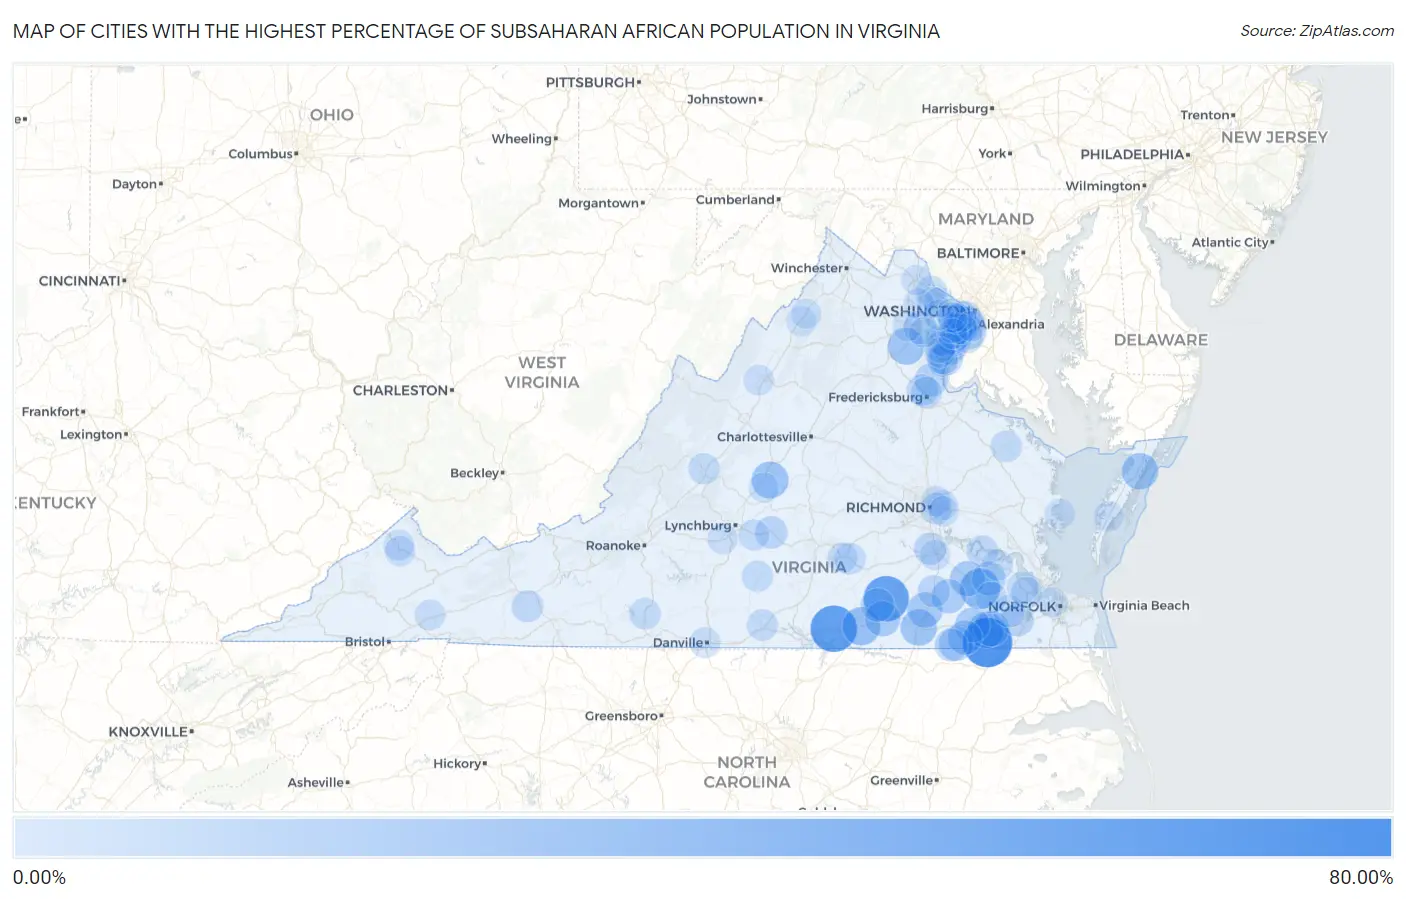
Map of Cities with the Highest Percentage of Subsaharan African Population in Virginia
0.00%
80.00%
Cities with the Highest Percentage of Subsaharan African Population in Virginia
| City | Subsaharan African | vs State | vs National | |
| 1. | Southampton Meadows | 65.55% | 2.38%(+63.2)#1 | 1.22%(+64.3)#4 |
| 2. | Baskerville | 55.41% | 2.38%(+53.0)#2 | 1.22%(+54.2)#5 |
| 3. | Warfield | 52.17% | 2.38%(+49.8)#3 | 1.22%(+51.0)#8 |
| 4. | Wakefield | 35.23% | 2.38%(+32.8)#4 | 1.22%(+34.0)#15 |
| 5. | Brodnax | 28.22% | 2.38%(+25.8)#5 | 1.22%(+27.0)#23 |
| 6. | Shipman | 24.37% | 2.38%(+22.0)#6 | 1.22%(+23.2)#32 |
| 7. | Catlett | 24.21% | 2.38%(+21.8)#7 | 1.22%(+23.0)#34 |
| 8. | Gargatha | 22.87% | 2.38%(+20.5)#8 | 1.22%(+21.7)#37 |
| 9. | Franklin | 22.81% | 2.38%(+20.4)#9 | 1.22%(+21.6)#40 |
| 10. | Emporia | 22.75% | 2.38%(+20.4)#10 | 1.22%(+21.5)#42 |
| 11. | Camptown | 19.78% | 2.38%(+17.4)#11 | 1.22%(+18.6)#53 |
| 12. | Jarratt | 19.68% | 2.38%(+17.3)#12 | 1.22%(+18.5)#54 |
| 13. | Lawrenceville | 19.18% | 2.38%(+16.8)#13 | 1.22%(+18.0)#60 |
| 14. | Waverly | 18.69% | 2.38%(+16.3)#14 | 1.22%(+17.5)#63 |
| 15. | Courtland | 17.66% | 2.38%(+15.3)#15 | 1.22%(+16.4)#69 |
| 16. | Boykins | 16.91% | 2.38%(+14.5)#16 | 1.22%(+15.7)#76 |
| 17. | Newsoms | 16.62% | 2.38%(+14.2)#17 | 1.22%(+15.4)#80 |
| 18. | Sussex | 16.55% | 2.38%(+14.2)#18 | 1.22%(+15.3)#81 |
| 19. | Dendron | 14.81% | 2.38%(+12.4)#19 | 1.22%(+13.6)#103 |
| 20. | Lincolnia | 13.89% | 2.38%(+11.5)#20 | 1.22%(+12.7)#115 |
| 21. | Alberta | 13.47% | 2.38%(+11.1)#21 | 1.22%(+12.3)#121 |
| 22. | Woodlawn Cdp Fairfax County | 13.35% | 2.38%(+11.0)#22 | 1.22%(+12.1)#123 |
| 23. | Leesylvania | 13.01% | 2.38%(+10.6)#23 | 1.22%(+11.8)#127 |
| 24. | Stafford Courthouse | 12.91% | 2.38%(+10.5)#24 | 1.22%(+11.7)#129 |
| 25. | Cherry Hill | 12.53% | 2.38%(+10.1)#25 | 1.22%(+11.3)#132 |
| 26. | Disputanta | 12.14% | 2.38%(+9.77)#26 | 1.22%(+10.9)#136 |
| 27. | Bailey S Crossroads | 12.08% | 2.38%(+9.70)#27 | 1.22%(+10.9)#137 |
| 28. | Bull Run | 11.99% | 2.38%(+9.61)#28 | 1.22%(+10.8)#142 |
| 29. | Hybla Valley | 11.58% | 2.38%(+9.20)#29 | 1.22%(+10.4)#151 |
| 30. | Branchville | 11.45% | 2.38%(+9.07)#30 | 1.22%(+10.2)#153 |
| 31. | Suffolk | 11.27% | 2.38%(+8.89)#31 | 1.22%(+10.1)#159 |
| 32. | Appomattox | 10.52% | 2.38%(+8.15)#32 | 1.22%(+9.31)#192 |
| 33. | Woodbridge | 10.16% | 2.38%(+7.78)#33 | 1.22%(+8.95)#208 |
| 34. | Stony Creek | 9.71% | 2.38%(+7.34)#34 | 1.22%(+8.50)#222 |
| 35. | Ettrick | 9.36% | 2.38%(+6.98)#35 | 1.22%(+8.14)#235 |
| 36. | Windsor | 9.01% | 2.38%(+6.63)#36 | 1.22%(+7.79)#248 |
| 37. | Alexandria | 8.90% | 2.38%(+6.52)#37 | 1.22%(+7.68)#253 |
| 38. | Kingstowne | 8.81% | 2.38%(+6.43)#38 | 1.22%(+7.60)#257 |
| 39. | Ivanhoe | 8.39% | 2.38%(+6.01)#39 | 1.22%(+7.17)#282 |
| 40. | Innovation | 8.28% | 2.38%(+5.90)#40 | 1.22%(+7.06)#285 |
| 41. | Lorton | 8.22% | 2.38%(+5.84)#41 | 1.22%(+7.00)#290 |
| 42. | Claremont | 8.08% | 2.38%(+5.70)#42 | 1.22%(+6.86)#300 |
| 43. | Southern Gateway | 8.00% | 2.38%(+5.62)#43 | 1.22%(+6.78)#309 |
| 44. | Smithfield | 7.97% | 2.38%(+5.59)#44 | 1.22%(+6.75)#313 |
| 45. | Falmouth | 7.63% | 2.38%(+5.26)#45 | 1.22%(+6.42)#337 |
| 46. | East Lexington | 7.52% | 2.38%(+5.14)#46 | 1.22%(+6.31)#344 |
| 47. | Warsaw | 7.47% | 2.38%(+5.09)#47 | 1.22%(+6.25)#349 |
| 48. | Crewe | 7.37% | 2.38%(+4.99)#48 | 1.22%(+6.15)#358 |
| 49. | Montrose | 7.37% | 2.38%(+4.99)#49 | 1.22%(+6.15)#360 |
| 50. | South Boston | 7.30% | 2.38%(+4.92)#50 | 1.22%(+6.09)#364 |
| 51. | Oak Level | 7.28% | 2.38%(+4.91)#51 | 1.22%(+6.07)#366 |
| 52. | Newington | 7.25% | 2.38%(+4.87)#52 | 1.22%(+6.03)#369 |
| 53. | Ivor | 7.25% | 2.38%(+4.87)#53 | 1.22%(+6.03)#371 |
| 54. | Brookneal | 6.94% | 2.38%(+4.56)#54 | 1.22%(+5.72)#391 |
| 55. | Laurel Hill | 6.77% | 2.38%(+4.39)#55 | 1.22%(+5.56)#401 |
| 56. | Triangle | 6.58% | 2.38%(+4.20)#56 | 1.22%(+5.36)#416 |
| 57. | Dulles Town Center | 6.51% | 2.38%(+4.13)#57 | 1.22%(+5.29)#423 |
| 58. | Mcnair | 6.48% | 2.38%(+4.10)#58 | 1.22%(+5.26)#427 |
| 59. | Mount Vernon | 6.42% | 2.38%(+4.04)#59 | 1.22%(+5.21)#434 |
| 60. | County Center | 6.34% | 2.38%(+3.96)#60 | 1.22%(+5.12)#444 |
| 61. | Lake Ridge | 6.14% | 2.38%(+3.76)#61 | 1.22%(+4.93)#464 |
| 62. | Springfield | 6.14% | 2.38%(+3.76)#62 | 1.22%(+4.92)#466 |
| 63. | Benns Church | 6.14% | 2.38%(+3.76)#63 | 1.22%(+4.92)#467 |
| 64. | Concord | 5.91% | 2.38%(+3.53)#64 | 1.22%(+4.69)#489 |
| 65. | Arcola | 5.74% | 2.38%(+3.37)#65 | 1.22%(+4.53)#512 |
| 66. | Dumfries | 5.72% | 2.38%(+3.34)#66 | 1.22%(+4.51)#517 |
| 67. | Dale City | 5.67% | 2.38%(+3.29)#67 | 1.22%(+4.45)#524 |
| 68. | Franconia | 5.60% | 2.38%(+3.22)#68 | 1.22%(+4.39)#535 |
| 69. | Danville | 5.60% | 2.38%(+3.22)#69 | 1.22%(+4.38)#537 |
| 70. | Grundy | 5.53% | 2.38%(+3.16)#70 | 1.22%(+4.32)#548 |
| 71. | Surry | 5.41% | 2.38%(+3.03)#71 | 1.22%(+4.19)#565 |
| 72. | West Springfield | 5.24% | 2.38%(+2.86)#72 | 1.22%(+4.02)#592 |
| 73. | Emory | 5.13% | 2.38%(+2.75)#73 | 1.22%(+3.92)#617 |
| 74. | Lake Barcroft | 4.99% | 2.38%(+2.62)#74 | 1.22%(+3.78)#650 |
| 75. | Annandale | 4.82% | 2.38%(+2.44)#75 | 1.22%(+3.60)#676 |
| 76. | Petersburg | 4.76% | 2.38%(+2.38)#76 | 1.22%(+3.55)#683 |
| 77. | Timberlake | 4.60% | 2.38%(+2.22)#77 | 1.22%(+3.39)#716 |
| 78. | Dayton | 4.49% | 2.38%(+2.11)#78 | 1.22%(+3.28)#741 |
| 79. | Vansant | 4.37% | 2.38%(+1.99)#79 | 1.22%(+3.15)#764 |
| 80. | Highland Springs | 4.33% | 2.38%(+1.96)#80 | 1.22%(+3.12)#774 |
| 81. | Burkeville | 4.33% | 2.38%(+1.95)#81 | 1.22%(+3.11)#777 |
| 82. | Fair Oaks | 3.98% | 2.38%(+1.60)#82 | 1.22%(+2.76)#868 |
| 83. | Montclair | 3.87% | 2.38%(+1.49)#83 | 1.22%(+2.66)#900 |
| 84. | East Highland Park | 3.84% | 2.38%(+1.46)#84 | 1.22%(+2.63)#910 |
| 85. | Gainesville | 3.82% | 2.38%(+1.45)#85 | 1.22%(+2.61)#917 |
| 86. | Reston | 3.82% | 2.38%(+1.44)#86 | 1.22%(+2.60)#918 |
| 87. | Leesburg | 3.78% | 2.38%(+1.40)#87 | 1.22%(+2.56)#933 |
| 88. | Gwynn | 3.76% | 2.38%(+1.38)#88 | 1.22%(+2.54)#940 |
| 89. | Merrifield | 3.73% | 2.38%(+1.35)#89 | 1.22%(+2.51)#948 |
| 90. | Edinburg | 3.71% | 2.38%(+1.33)#90 | 1.22%(+2.49)#954 |
| 91. | Newington Forest | 3.68% | 2.38%(+1.31)#91 | 1.22%(+2.47)#962 |
| 92. | Sandston | 3.66% | 2.38%(+1.28)#92 | 1.22%(+2.45)#970 |
| 93. | Huntington | 3.61% | 2.38%(+1.23)#93 | 1.22%(+2.39)#987 |
| 94. | Portsmouth | 3.53% | 2.38%(+1.15)#94 | 1.22%(+2.31)#1,012 |
| 95. | Arrington | 3.51% | 2.38%(+1.13)#95 | 1.22%(+2.29)#1,020 |
| 96. | Nassawadox | 3.50% | 2.38%(+1.13)#96 | 1.22%(+2.29)#1,021 |
| 97. | One Loudoun | 3.45% | 2.38%(+1.08)#97 | 1.22%(+2.24)#1,032 |
| 98. | Manassas | 3.40% | 2.38%(+1.02)#98 | 1.22%(+2.18)#1,047 |
| 99. | Woodburn | 3.33% | 2.38%(+0.955)#99 | 1.22%(+2.12)#1,077 |
| 100. | Woodstock | 3.31% | 2.38%(+0.933)#100 | 1.22%(+2.10)#1,087 |
Common Questions
What are the Top 10 Cities with the Highest Percentage of Subsaharan African Population in Virginia?
Top 10 Cities with the Highest Percentage of Subsaharan African Population in Virginia are:
#1
65.55%
#2
55.41%
#3
52.17%
#4
35.23%
#5
28.22%
#6
24.37%
#7
24.21%
#8
22.87%
#9
22.81%
#10
22.75%
What city has the Highest Percentage of Subsaharan African Population in Virginia?
Southampton Meadows has the Highest Percentage of Subsaharan African Population in Virginia with 65.55%.
What is the Percentage of Subsaharan African Population in the State of Virginia?
Percentage of Subsaharan African Population in Virginia is 2.38%.
What is the Percentage of Subsaharan African Population in the United States?
Percentage of Subsaharan African Population in the United States is 1.22%.