East Pasadena, CA Map & Demographics
East Pasadena Map
East Pasadena Overview
$52,018
PER CAPITA INCOME
$116,591
AVG FAMILY INCOME
$100,985
AVG HOUSEHOLD INCOME
8.4%
WAGE / INCOME GAP [ % ]
91.6¢/ $1
WAGE / INCOME GAP [ $ ]
$9,331
FAMILY INCOME DEFICIT
0.49
INEQUALITY / GINI INDEX
5,474
TOTAL POPULATION
2,738
MALE POPULATION
2,736
FEMALE POPULATION
100.07
MALES / 100 FEMALES
99.93
FEMALES / 100 MALES
45.5
MEDIAN AGE
3.5
AVG FAMILY SIZE
2.8
AVG HOUSEHOLD SIZE
2,720
LABOR FORCE [ PEOPLE ]
60.6%
PERCENT IN LABOR FORCE
2.2%
UNEMPLOYMENT RATE
Income in East Pasadena
Income Overview in East Pasadena
Per Capita Income in East Pasadena is $52,018, while median incomes of families and households are $116,591 and $100,985 respectively.
| Characteristic | Number | Measure |
| Per Capita Income | 5,474 | $52,018 |
| Median Family Income | 1,328 | $116,591 |
| Mean Family Income | 1,328 | $175,569 |
| Median Household Income | 1,942 | $100,985 |
| Mean Household Income | 1,942 | $144,067 |
| Income Deficit | 1,328 | $9,331 |
| Wage / Income Gap (%) | 5,474 | 8.41% |
| Wage / Income Gap ($) | 5,474 | 91.59¢ per $1 |
| Gini / Inequality Index | 5,474 | 0.49 |
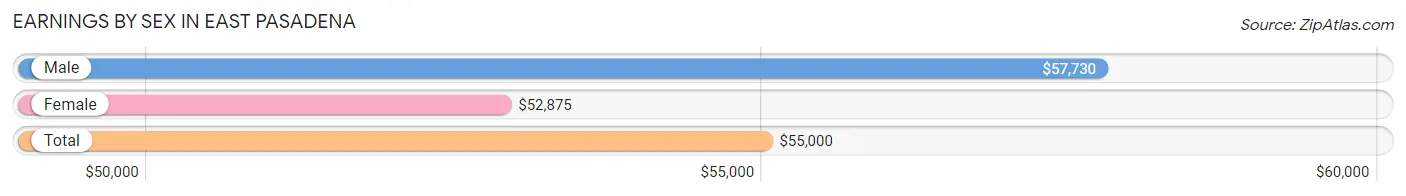
Earnings by Sex in East Pasadena
Average Earnings in East Pasadena are $55,000, $57,730 for men and $52,875 for women, a difference of 8.4%.
| Sex | Number | Average Earnings |
| Male | 1,676 (60.0%) | $57,730 |
| Female | 1,118 (40.0%) | $52,875 |
| Total | 2,794 (100.0%) | $55,000 |
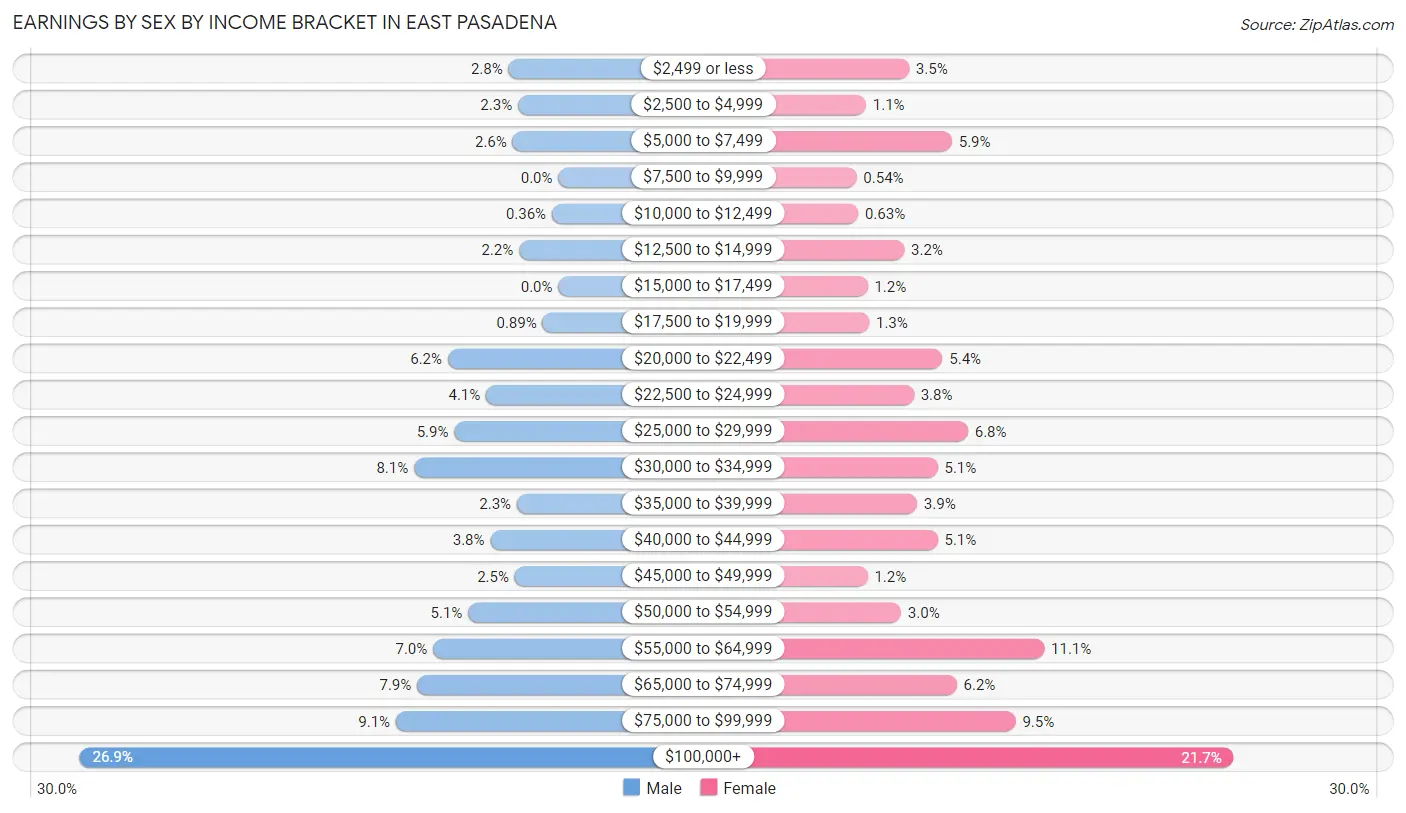
Earnings by Sex by Income Bracket in East Pasadena
The most common earnings brackets in East Pasadena are $100,000+ for men (451 | 26.9%) and $100,000+ for women (243 | 21.7%).
| Income | Male | Female |
| $2,499 or less | 47 (2.8%) | 39 (3.5%) |
| $2,500 to $4,999 | 38 (2.3%) | 12 (1.1%) |
| $5,000 to $7,499 | 43 (2.6%) | 66 (5.9%) |
| $7,500 to $9,999 | 0 (0.0%) | 6 (0.5%) |
| $10,000 to $12,499 | 6 (0.4%) | 7 (0.6%) |
| $12,500 to $14,999 | 37 (2.2%) | 36 (3.2%) |
| $15,000 to $17,499 | 0 (0.0%) | 13 (1.2%) |
| $17,500 to $19,999 | 15 (0.9%) | 14 (1.3%) |
| $20,000 to $22,499 | 104 (6.2%) | 60 (5.4%) |
| $22,500 to $24,999 | 68 (4.1%) | 42 (3.8%) |
| $25,000 to $29,999 | 98 (5.9%) | 76 (6.8%) |
| $30,000 to $34,999 | 136 (8.1%) | 57 (5.1%) |
| $35,000 to $39,999 | 39 (2.3%) | 44 (3.9%) |
| $40,000 to $44,999 | 64 (3.8%) | 57 (5.1%) |
| $45,000 to $49,999 | 41 (2.5%) | 13 (1.2%) |
| $50,000 to $54,999 | 85 (5.1%) | 34 (3.0%) |
| $55,000 to $64,999 | 118 (7.0%) | 124 (11.1%) |
| $65,000 to $74,999 | 133 (7.9%) | 69 (6.2%) |
| $75,000 to $99,999 | 153 (9.1%) | 106 (9.5%) |
| $100,000+ | 451 (26.9%) | 243 (21.7%) |
| Total | 1,676 (100.0%) | 1,118 (100.0%) |
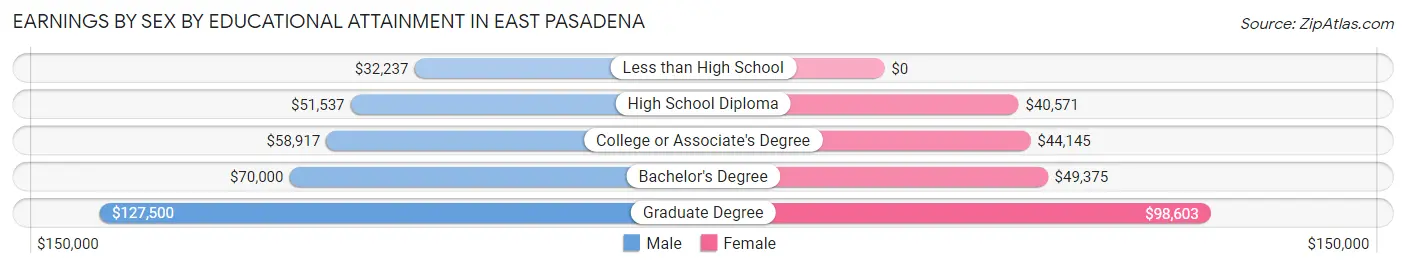
Earnings by Sex by Educational Attainment in East Pasadena
Average earnings in East Pasadena are $59,554 for men and $57,760 for women, a difference of 3.0%. Men with an educational attainment of graduate degree enjoy the highest average annual earnings of $127,500, while those with less than high school education earn the least with $32,237. Women with an educational attainment of graduate degree earn the most with the average annual earnings of $98,603, while those with high school diploma education have the smallest earnings of $40,571.
| Educational Attainment | Male Income | Female Income |
| Less than High School | $32,237 | $0 |
| High School Diploma | $51,537 | $40,571 |
| College or Associate's Degree | $58,917 | $44,145 |
| Bachelor's Degree | $70,000 | $49,375 |
| Graduate Degree | $127,500 | $98,603 |
| Total | $59,554 | $57,760 |
Family Income in East Pasadena
Family Income Brackets in East Pasadena
According to the East Pasadena family income data, there are 401 families falling into the $200,000+ income range, which is the most common income bracket and makes up 30.2% of all families. Conversely, the $10,000 to $14,999 income bracket is the least frequent group with only 12 families (0.9%) belonging to this category.
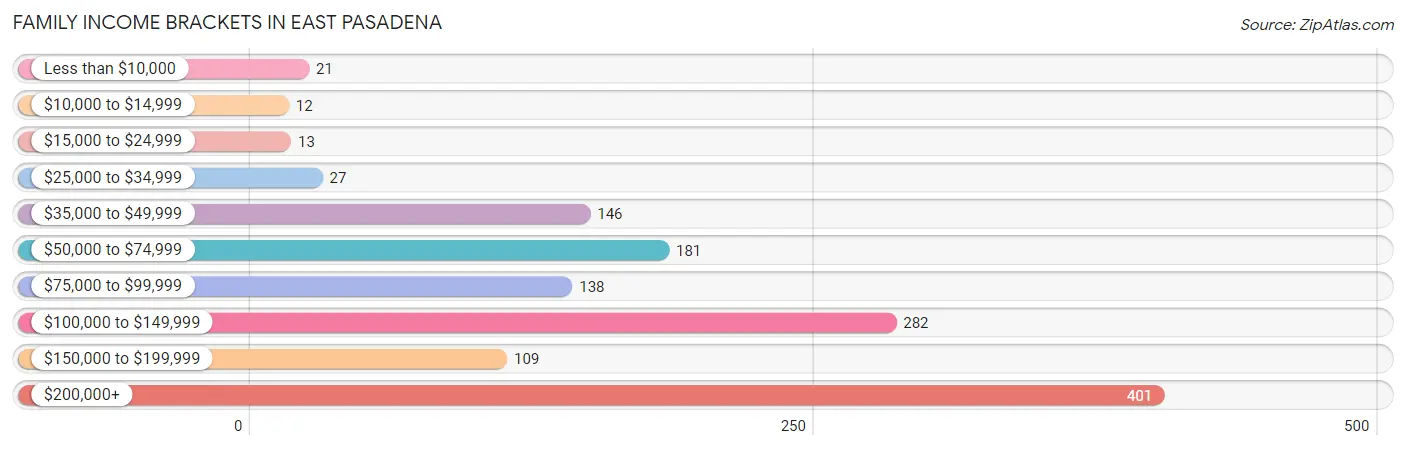
| Income Bracket | # Families | % Families |
| Less than $10,000 | 21 | 1.6% |
| $10,000 to $14,999 | 12 | 0.9% |
| $15,000 to $24,999 | 13 | 1.0% |
| $25,000 to $34,999 | 27 | 2.0% |
| $35,000 to $49,999 | 146 | 11.0% |
| $50,000 to $74,999 | 181 | 13.6% |
| $75,000 to $99,999 | 138 | 10.4% |
| $100,000 to $149,999 | 282 | 21.2% |
| $150,000 to $199,999 | 109 | 8.2% |
| $200,000+ | 401 | 30.2% |
Family Income by Famaliy Size in East Pasadena
5-person families (125 | 9.4%) account for the highest median family income in East Pasadena with $250,001 per family, while 5-person families (125 | 9.4%) have the highest median income of $50,000 per family member.
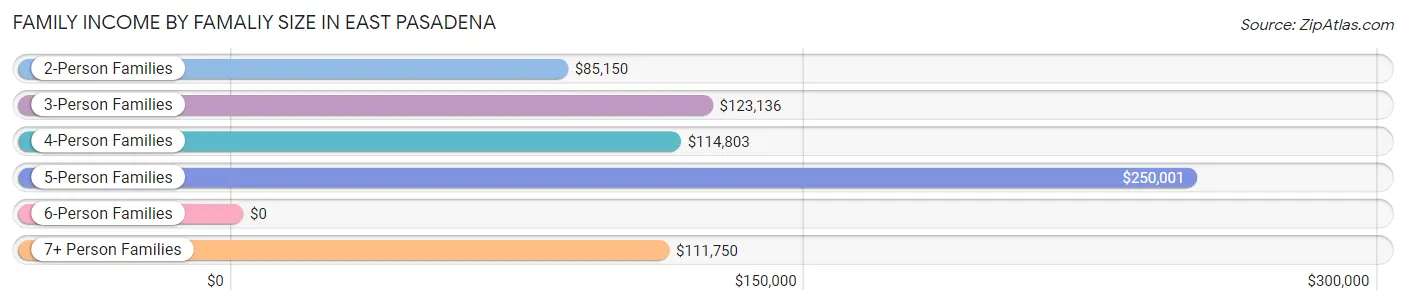
| Income Bracket | # Families | Median Income |
| 2-Person Families | 445 (33.5%) | $85,150 |
| 3-Person Families | 488 (36.7%) | $123,136 |
| 4-Person Families | 195 (14.7%) | $114,803 |
| 5-Person Families | 125 (9.4%) | $250,001 |
| 6-Person Families | 33 (2.5%) | $0 |
| 7+ Person Families | 42 (3.2%) | $111,750 |
| Total | 1,328 (100.0%) | $116,591 |
Family Income by Number of Earners in East Pasadena
The median family income in East Pasadena is $116,591, with families comprising 2 earners (443) having the highest median family income of $161,250, while families with 1 earner (478) have the lowest median family income of $68,487, accounting for 33.4% and 36.0% of families, respectively.
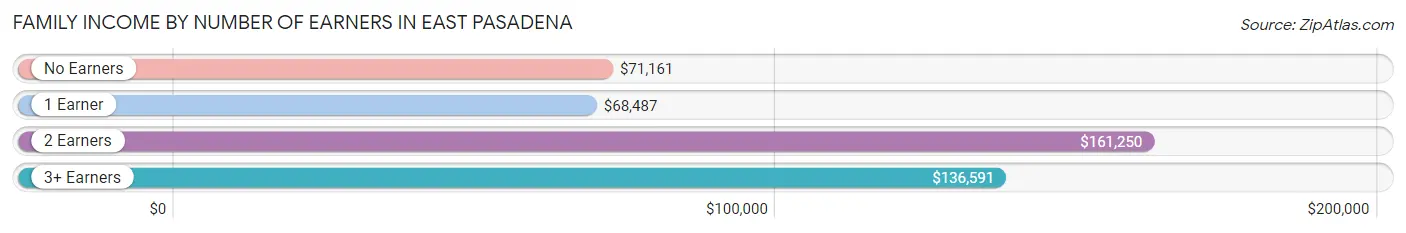
| Number of Earners | # Families | Median Income |
| No Earners | 157 (11.8%) | $71,161 |
| 1 Earner | 478 (36.0%) | $68,487 |
| 2 Earners | 443 (33.4%) | $161,250 |
| 3+ Earners | 250 (18.8%) | $136,591 |
| Total | 1,328 (100.0%) | $116,591 |
Household Income in East Pasadena
Household Income Brackets in East Pasadena
With 427 households falling in the category, the $200,000+ income range is the most frequent in East Pasadena, accounting for 22.0% of all households. In contrast, only 12 households (0.6%) fall into the $10,000 to $14,999 income bracket, making it the least populous group.
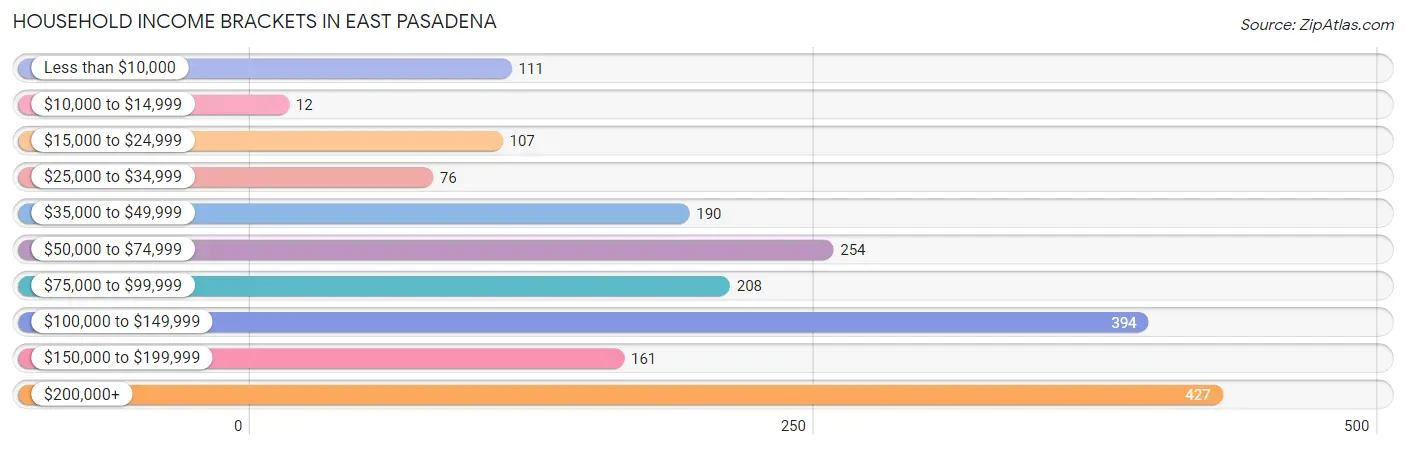
| Income Bracket | # Households | % Households |
| Less than $10,000 | 111 | 5.7% |
| $10,000 to $14,999 | 12 | 0.6% |
| $15,000 to $24,999 | 107 | 5.5% |
| $25,000 to $34,999 | 76 | 3.9% |
| $35,000 to $49,999 | 190 | 9.8% |
| $50,000 to $74,999 | 254 | 13.1% |
| $75,000 to $99,999 | 208 | 10.7% |
| $100,000 to $149,999 | 394 | 20.3% |
| $150,000 to $199,999 | 161 | 8.3% |
| $200,000+ | 427 | 22.0% |
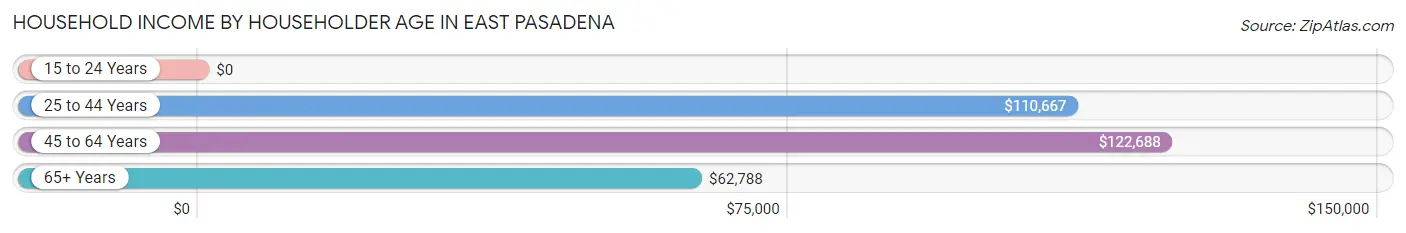
Household Income by Householder Age in East Pasadena
The median household income in East Pasadena is $100,985, with the highest median household income of $122,688 found in the 45 to 64 years age bracket for the primary householder. A total of 747 households (38.5%) fall into this category.
| Income Bracket | # Households | Median Income |
| 15 to 24 Years | 0 (0.0%) | $0 |
| 25 to 44 Years | 514 (26.5%) | $110,667 |
| 45 to 64 Years | 747 (38.5%) | $122,688 |
| 65+ Years | 681 (35.1%) | $62,788 |
| Total | 1,942 (100.0%) | $100,985 |
Poverty in East Pasadena
Income Below Poverty by Sex and Age in East Pasadena
With 7.5% poverty level for males and 5.7% for females among the residents of East Pasadena, under 5 year old males and 6 to 11 year old females are the most vulnerable to poverty, with 31 males (38.3%) and 42 females (21.3%) in their respective age groups living below the poverty level.
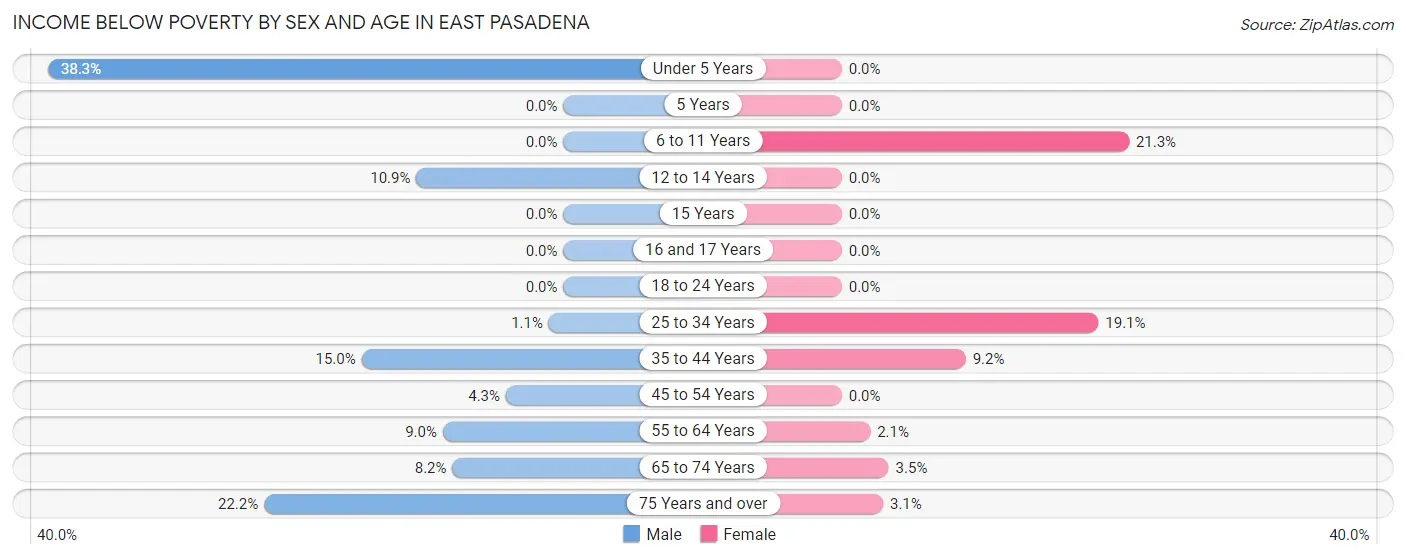
| Age Bracket | Male | Female |
| Under 5 Years | 31 (38.3%) | 0 (0.0%) |
| 5 Years | 0 (0.0%) | 0 (0.0%) |
| 6 to 11 Years | 0 (0.0%) | 42 (21.3%) |
| 12 to 14 Years | 13 (10.9%) | 0 (0.0%) |
| 15 Years | 0 (0.0%) | 0 (0.0%) |
| 16 and 17 Years | 0 (0.0%) | 0 (0.0%) |
| 18 to 24 Years | 0 (0.0%) | 0 (0.0%) |
| 25 to 34 Years | 4 (1.1%) | 44 (19.1%) |
| 35 to 44 Years | 34 (15.0%) | 38 (9.2%) |
| 45 to 54 Years | 29 (4.3%) | 0 (0.0%) |
| 55 to 64 Years | 23 (8.9%) | 8 (2.1%) |
| 65 to 74 Years | 23 (8.2%) | 11 (3.5%) |
| 75 Years and over | 48 (22.2%) | 11 (3.1%) |
| Total | 205 (7.5%) | 154 (5.7%) |
Income Above Poverty by Sex and Age in East Pasadena
According to the poverty statistics in East Pasadena, males aged 5 years and females aged under 5 years are the age groups that are most secure financially, with 100.0% of males and 100.0% of females in these age groups living above the poverty line.
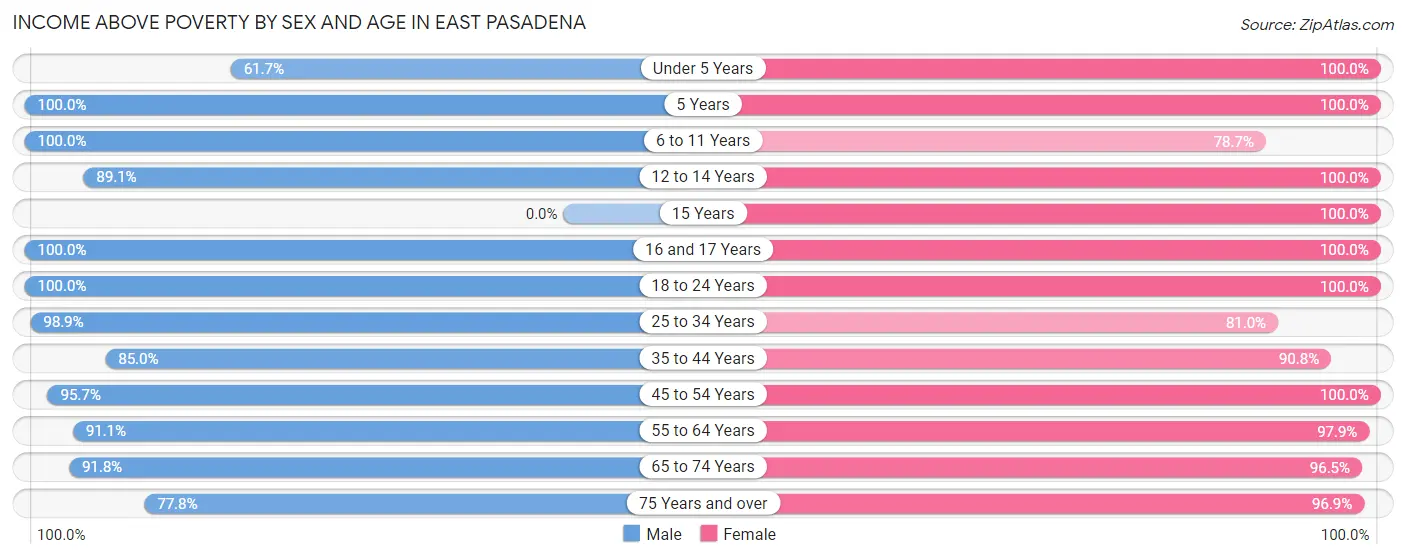
| Age Bracket | Male | Female |
| Under 5 Years | 50 (61.7%) | 212 (100.0%) |
| 5 Years | 14 (100.0%) | 12 (100.0%) |
| 6 to 11 Years | 246 (100.0%) | 155 (78.7%) |
| 12 to 14 Years | 106 (89.1%) | 72 (100.0%) |
| 15 Years | 0 (0.0%) | 8 (100.0%) |
| 16 and 17 Years | 64 (100.0%) | 16 (100.0%) |
| 18 to 24 Years | 176 (100.0%) | 168 (100.0%) |
| 25 to 34 Years | 368 (98.9%) | 187 (80.9%) |
| 35 to 44 Years | 193 (85.0%) | 375 (90.8%) |
| 45 to 54 Years | 650 (95.7%) | 323 (100.0%) |
| 55 to 64 Years | 234 (91.0%) | 372 (97.9%) |
| 65 to 74 Years | 256 (91.8%) | 305 (96.5%) |
| 75 Years and over | 168 (77.8%) | 349 (96.9%) |
| Total | 2,525 (92.5%) | 2,554 (94.3%) |
Income Below Poverty Among Married-Couple Families in East Pasadena
The poverty statistics for married-couple families in East Pasadena show that 5.9% or 59 of the total 1,008 families live below the poverty line. Families with 1 or 2 children have the highest poverty rate of 9.6%, comprising of 38 families. On the other hand, families with 3 or 4 children have the lowest poverty rate of 0.0%, which includes 0 families.
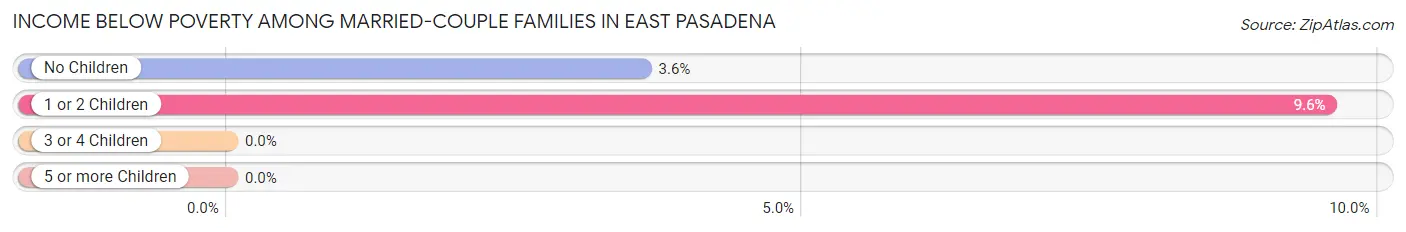
| Children | Above Poverty | Below Poverty |
| No Children | 563 (96.4%) | 21 (3.6%) |
| 1 or 2 Children | 359 (90.4%) | 38 (9.6%) |
| 3 or 4 Children | 27 (100.0%) | 0 (0.0%) |
| 5 or more Children | 0 (0.0%) | 0 (0.0%) |
| Total | 949 (94.2%) | 59 (5.9%) |
Income Below Poverty Among Single-Parent Households in East Pasadena
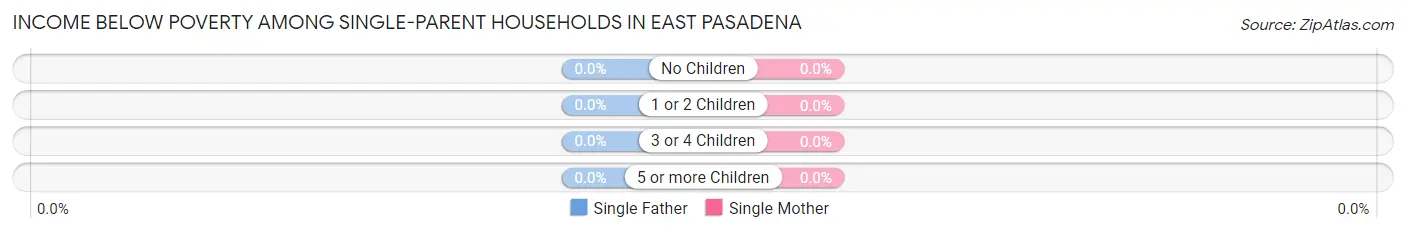
| Children | Single Father | Single Mother |
| No Children | 0 (0.0%) | 0 (0.0%) |
| 1 or 2 Children | 0 (0.0%) | 0 (0.0%) |
| 3 or 4 Children | 0 (0.0%) | 0 (0.0%) |
| 5 or more Children | 0 (0.0%) | 0 (0.0%) |
| Total | 0 (0.0%) | 0 (0.0%) |
Income Below Poverty Among Married-Couple vs Single-Parent Households in East Pasadena
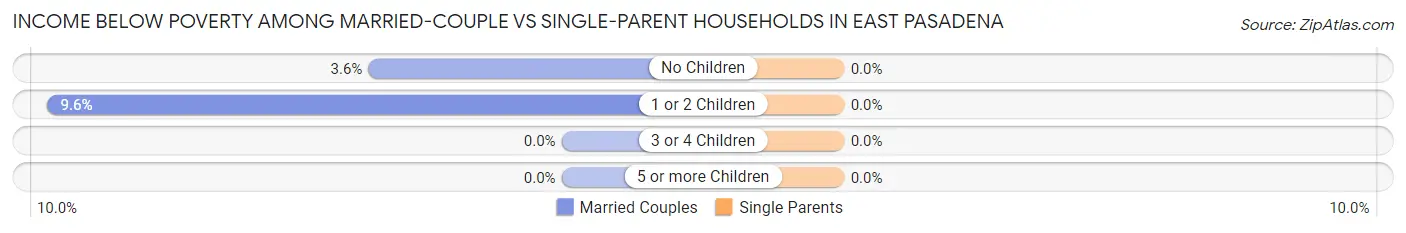
| Children | Married-Couple Families | Single-Parent Households |
| No Children | 21 (3.6%) | 0 (0.0%) |
| 1 or 2 Children | 38 (9.6%) | 0 (0.0%) |
| 3 or 4 Children | 0 (0.0%) | 0 (0.0%) |
| 5 or more Children | 0 (0.0%) | 0 (0.0%) |
| Total | 59 (5.9%) | 0 (0.0%) |
Race in East Pasadena
The most populous races in East Pasadena are White / Caucasian (2,210 | 40.4%), Hispanic or Latino (2,174 | 39.7%), and Asian (1,591 | 29.1%).
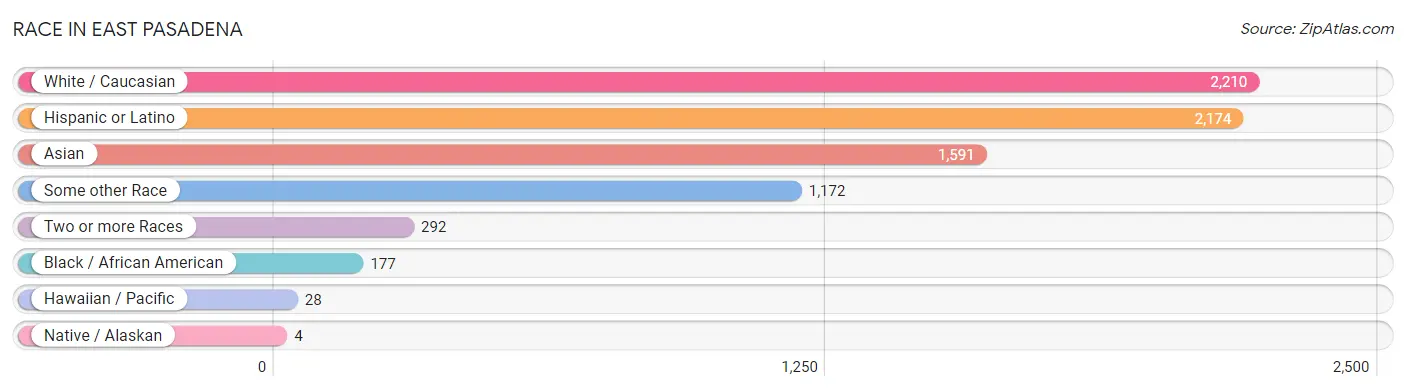
| Race | # Population | % Population |
| Asian | 1,591 | 29.1% |
| Black / African American | 177 | 3.2% |
| Hawaiian / Pacific | 28 | 0.5% |
| Hispanic or Latino | 2,174 | 39.7% |
| Native / Alaskan | 4 | 0.1% |
| White / Caucasian | 2,210 | 40.4% |
| Two or more Races | 292 | 5.3% |
| Some other Race | 1,172 | 21.4% |
| Total | 5,474 | 100.0% |
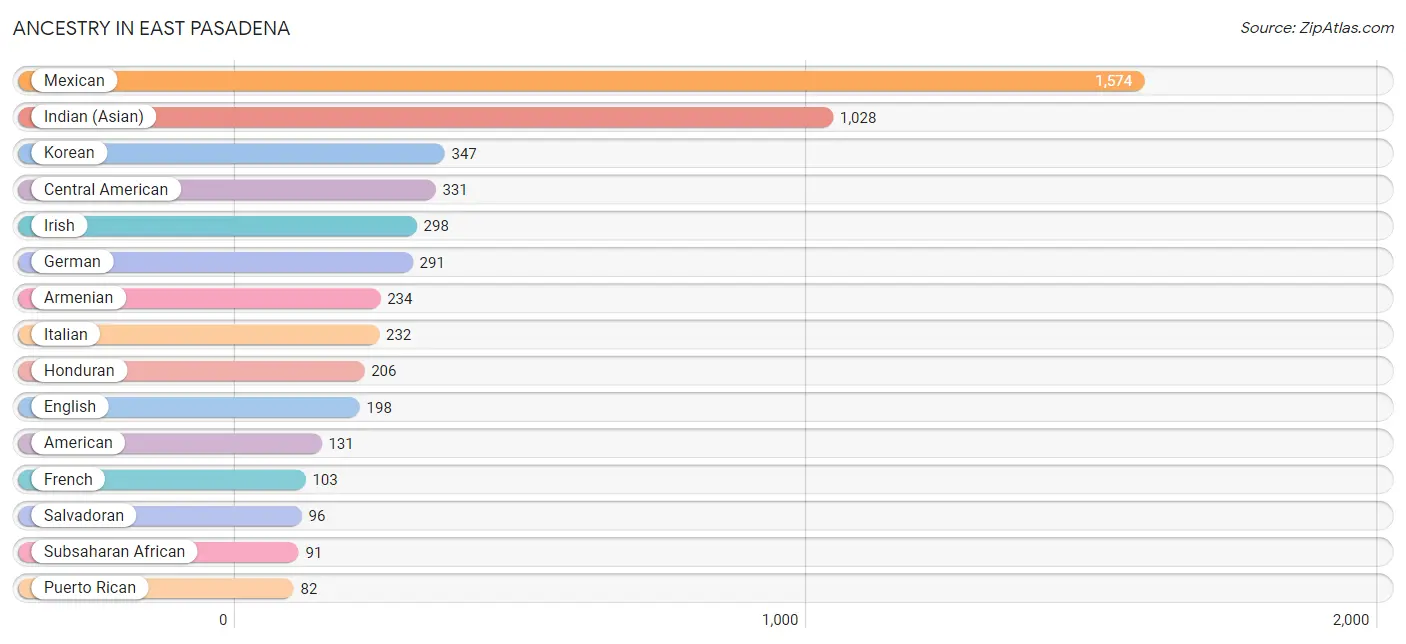
Ancestry in East Pasadena
The most populous ancestries reported in East Pasadena are Mexican (1,574 | 28.7%), Indian (Asian) (1,028 | 18.8%), Korean (347 | 6.3%), Central American (331 | 6.0%), and Irish (298 | 5.4%), together accounting for 65.4% of all East Pasadena residents.
| Ancestry | # Population | % Population |
| African | 5 | 0.1% |
| American | 131 | 2.4% |
| Arab | 25 | 0.5% |
| Armenian | 234 | 4.3% |
| Austrian | 12 | 0.2% |
| Bhutanese | 56 | 1.0% |
| Bolivian | 49 | 0.9% |
| Brazilian | 5 | 0.1% |
| British | 9 | 0.2% |
| Burmese | 70 | 1.3% |
| Central American | 331 | 6.0% |
| Central American Indian | 4 | 0.1% |
| Chilean | 4 | 0.1% |
| Colombian | 18 | 0.3% |
| Costa Rican | 8 | 0.2% |
| Cuban | 15 | 0.3% |
| Danish | 42 | 0.8% |
| Egyptian | 25 | 0.5% |
| English | 198 | 3.6% |
| Ethiopian | 21 | 0.4% |
| European | 13 | 0.2% |
| Filipino | 40 | 0.7% |
| Finnish | 9 | 0.2% |
| French | 103 | 1.9% |
| French Canadian | 4 | 0.1% |
| German | 291 | 5.3% |
| Greek | 54 | 1.0% |
| Guatemalan | 17 | 0.3% |
| Honduran | 206 | 3.8% |
| Hungarian | 11 | 0.2% |
| Indian (Asian) | 1,028 | 18.8% |
| Irish | 298 | 5.4% |
| Italian | 232 | 4.2% |
| Korean | 347 | 6.3% |
| Laotian | 81 | 1.5% |
| Liberian | 4 | 0.1% |
| Mexican | 1,574 | 28.7% |
| Mexican American Indian | 15 | 0.3% |
| Native Hawaiian | 34 | 0.6% |
| Nicaraguan | 4 | 0.1% |
| Nigerian | 61 | 1.1% |
| Northern European | 5 | 0.1% |
| Norwegian | 29 | 0.5% |
| Pakistani | 14 | 0.3% |
| Peruvian | 7 | 0.1% |
| Polish | 30 | 0.5% |
| Portuguese | 8 | 0.2% |
| Puerto Rican | 82 | 1.5% |
| Russian | 47 | 0.9% |
| Salvadoran | 96 | 1.8% |
| Scandinavian | 13 | 0.2% |
| Scottish | 23 | 0.4% |
| South American | 78 | 1.4% |
| Spaniard | 70 | 1.3% |
| Spanish | 8 | 0.2% |
| Spanish American Indian | 10 | 0.2% |
| Sri Lankan | 38 | 0.7% |
| Subsaharan African | 91 | 1.7% |
| Swedish | 13 | 0.2% |
| Thai | 66 | 1.2% |
| Yaqui | 4 | 0.1% |
| Yugoslavian | 7 | 0.1% | View All 62 Rows |
Immigrants in East Pasadena
The most numerous immigrant groups reported in East Pasadena came from Asia (1,125 | 20.5%), Latin America (741 | 13.5%), Central America (689 | 12.6%), Eastern Asia (632 | 11.6%), and China (591 | 10.8%), together accounting for 69.0% of all East Pasadena residents.
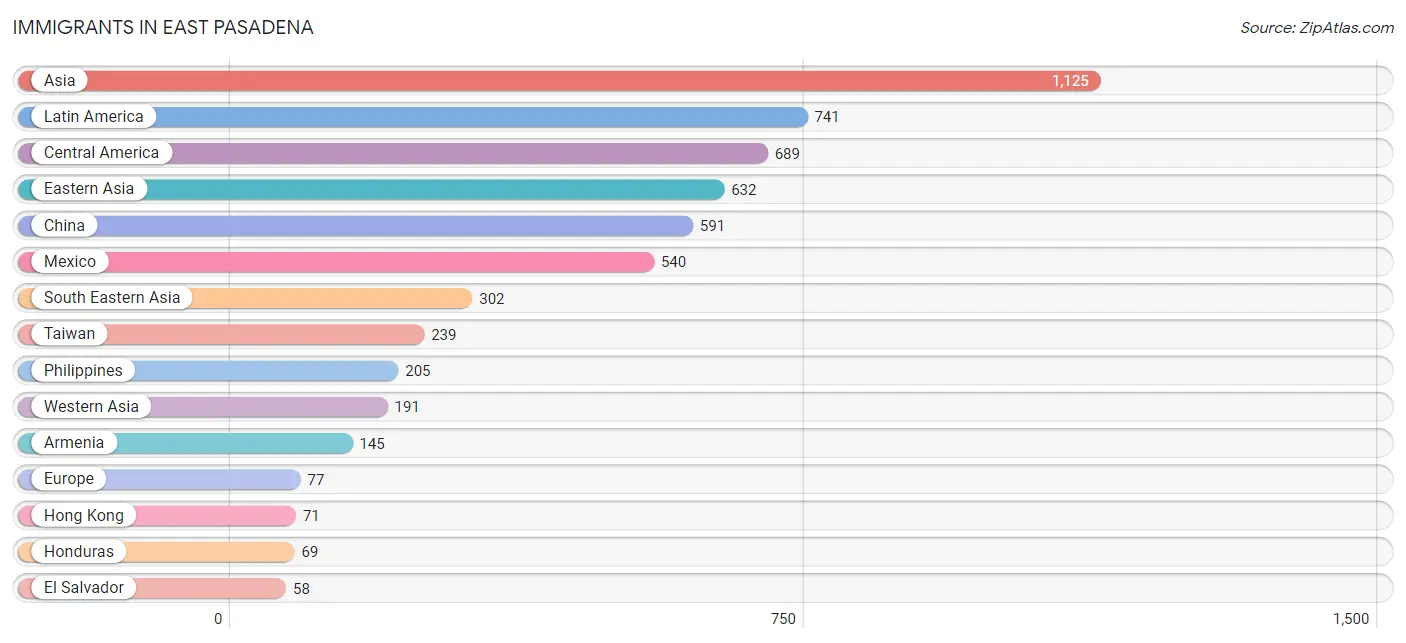
| Immigration Origin | # Population | % Population |
| Africa | 46 | 0.8% |
| Armenia | 145 | 2.6% |
| Asia | 1,125 | 20.5% |
| Bolivia | 23 | 0.4% |
| Central America | 689 | 12.6% |
| Chile | 4 | 0.1% |
| China | 591 | 10.8% |
| Colombia | 18 | 0.3% |
| Costa Rica | 6 | 0.1% |
| Eastern Africa | 21 | 0.4% |
| Eastern Asia | 632 | 11.6% |
| Egypt | 25 | 0.5% |
| El Salvador | 58 | 1.1% |
| England | 31 | 0.6% |
| Ethiopia | 21 | 0.4% |
| Europe | 77 | 1.4% |
| Germany | 17 | 0.3% |
| Greece | 11 | 0.2% |
| Guatemala | 12 | 0.2% |
| Honduras | 69 | 1.3% |
| Hong Kong | 71 | 1.3% |
| Indonesia | 58 | 1.1% |
| Iraq | 19 | 0.4% |
| Italy | 5 | 0.1% |
| Japan | 7 | 0.1% |
| Korea | 34 | 0.6% |
| Latin America | 741 | 13.5% |
| Lebanon | 27 | 0.5% |
| Mexico | 540 | 9.9% |
| Netherlands | 13 | 0.2% |
| Nicaragua | 4 | 0.1% |
| Northern Africa | 25 | 0.5% |
| Northern Europe | 31 | 0.6% |
| Oceania | 5 | 0.1% |
| Peru | 7 | 0.1% |
| Philippines | 205 | 3.7% |
| South America | 52 | 0.9% |
| South Eastern Asia | 302 | 5.5% |
| Southern Europe | 16 | 0.3% |
| Taiwan | 239 | 4.4% |
| Vietnam | 39 | 0.7% |
| Western Asia | 191 | 3.5% |
| Western Europe | 30 | 0.5% | View All 43 Rows |
Sex and Age in East Pasadena
Sex and Age in East Pasadena
The most populous age groups in East Pasadena are 45 to 49 Years (388 | 14.2%) for men and 65 to 69 Years (243 | 8.9%) for women.
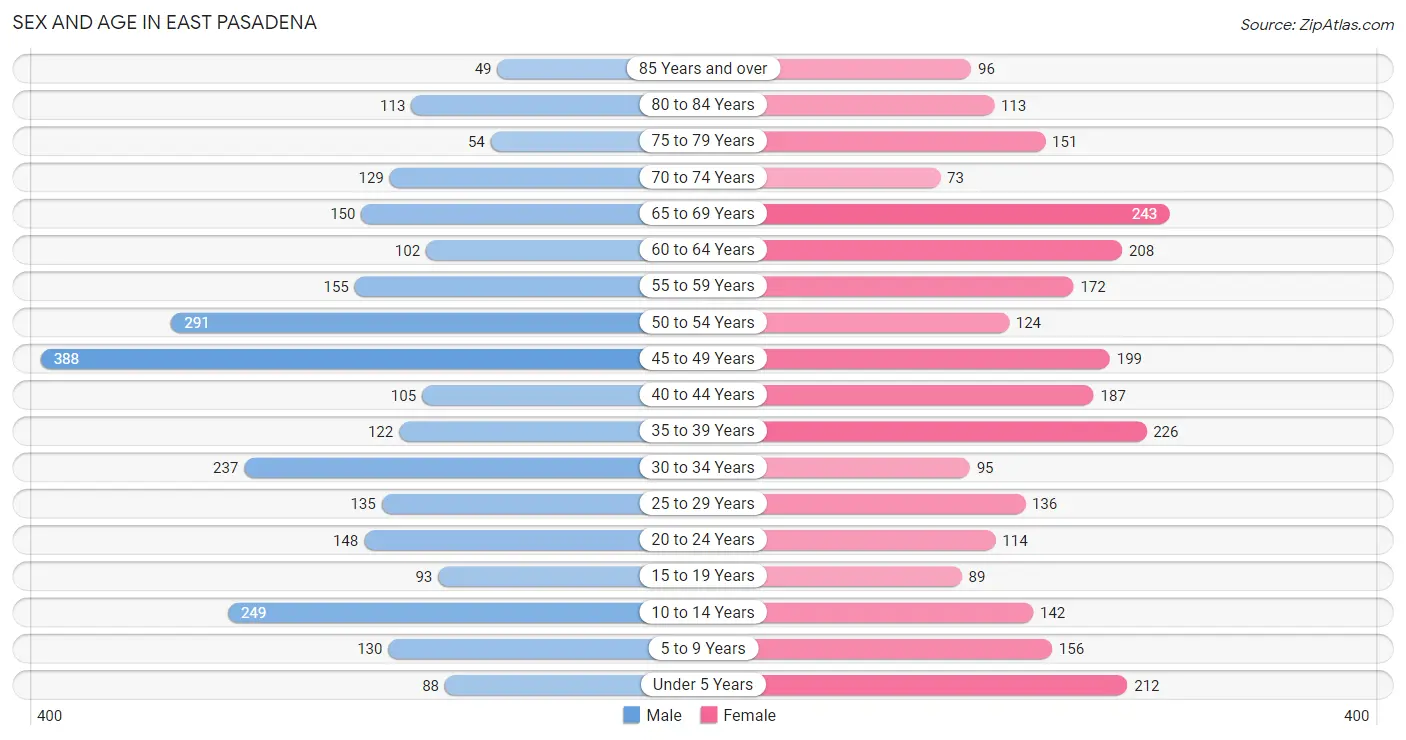
| Age Bracket | Male | Female |
| Under 5 Years | 88 (3.2%) | 212 (7.7%) |
| 5 to 9 Years | 130 (4.8%) | 156 (5.7%) |
| 10 to 14 Years | 249 (9.1%) | 142 (5.2%) |
| 15 to 19 Years | 93 (3.4%) | 89 (3.3%) |
| 20 to 24 Years | 148 (5.4%) | 114 (4.2%) |
| 25 to 29 Years | 135 (4.9%) | 136 (5.0%) |
| 30 to 34 Years | 237 (8.7%) | 95 (3.5%) |
| 35 to 39 Years | 122 (4.5%) | 226 (8.3%) |
| 40 to 44 Years | 105 (3.8%) | 187 (6.8%) |
| 45 to 49 Years | 388 (14.2%) | 199 (7.3%) |
| 50 to 54 Years | 291 (10.6%) | 124 (4.5%) |
| 55 to 59 Years | 155 (5.7%) | 172 (6.3%) |
| 60 to 64 Years | 102 (3.7%) | 208 (7.6%) |
| 65 to 69 Years | 150 (5.5%) | 243 (8.9%) |
| 70 to 74 Years | 129 (4.7%) | 73 (2.7%) |
| 75 to 79 Years | 54 (2.0%) | 151 (5.5%) |
| 80 to 84 Years | 113 (4.1%) | 113 (4.1%) |
| 85 Years and over | 49 (1.8%) | 96 (3.5%) |
| Total | 2,738 (100.0%) | 2,736 (100.0%) |
Families and Households in East Pasadena
Median Family Size in East Pasadena
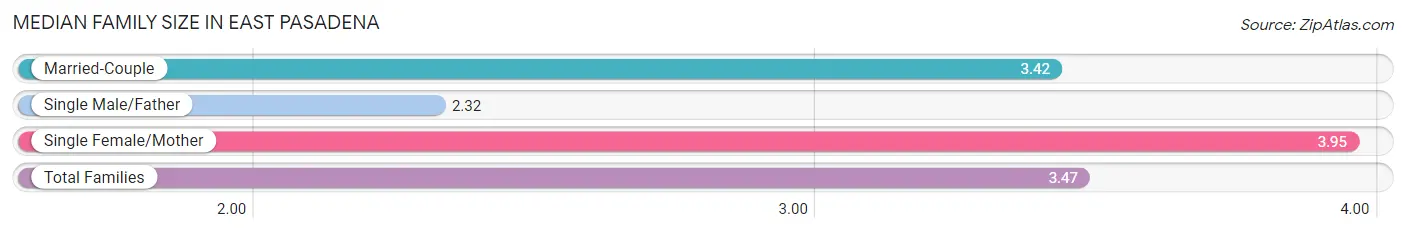
The median family size in East Pasadena is 3.47 persons per family, with single female/mother families (254 | 19.1%) accounting for the largest median family size of 3.95 persons per family. On the other hand, single male/father families (66 | 5.0%) represent the smallest median family size with 2.32 persons per family.
| Family Type | # Families | Family Size |
| Married-Couple | 1,008 (75.9%) | 3.42 |
| Single Male/Father | 66 (5.0%) | 2.32 |
| Single Female/Mother | 254 (19.1%) | 3.95 |
| Total Families | 1,328 (100.0%) | 3.47 |
Median Household Size in East Pasadena
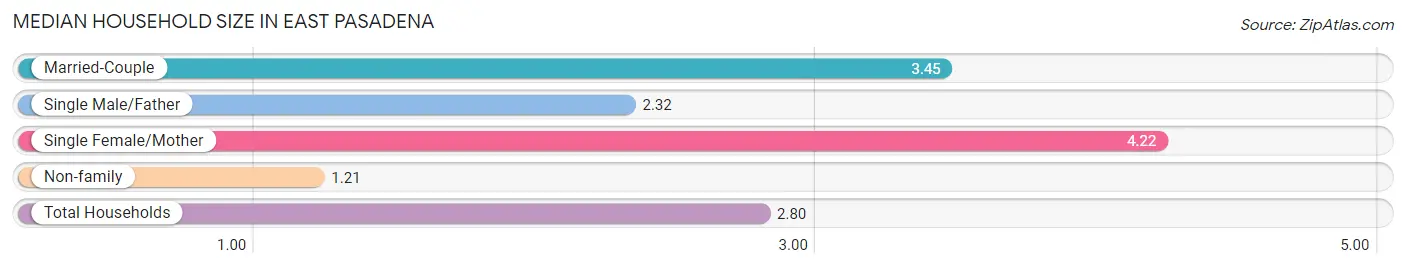
The median household size in East Pasadena is 2.80 persons per household, with single female/mother households (254 | 13.1%) accounting for the largest median household size of 4.22 persons per household. non-family households (614 | 31.6%) represent the smallest median household size with 1.21 persons per household.
| Household Type | # Households | Household Size |
| Married-Couple | 1,008 (51.9%) | 3.45 |
| Single Male/Father | 66 (3.4%) | 2.32 |
| Single Female/Mother | 254 (13.1%) | 4.22 |
| Non-family | 614 (31.6%) | 1.21 |
| Total Households | 1,942 (100.0%) | 2.80 |
Household Size by Marriage Status in East Pasadena
Out of a total of 1,942 households in East Pasadena, 1,328 (68.4%) are family households, while 614 (31.6%) are nonfamily households. The most numerous type of family households are 3-person households, comprising 497, and the most common type of nonfamily households are 1-person households, comprising 504.
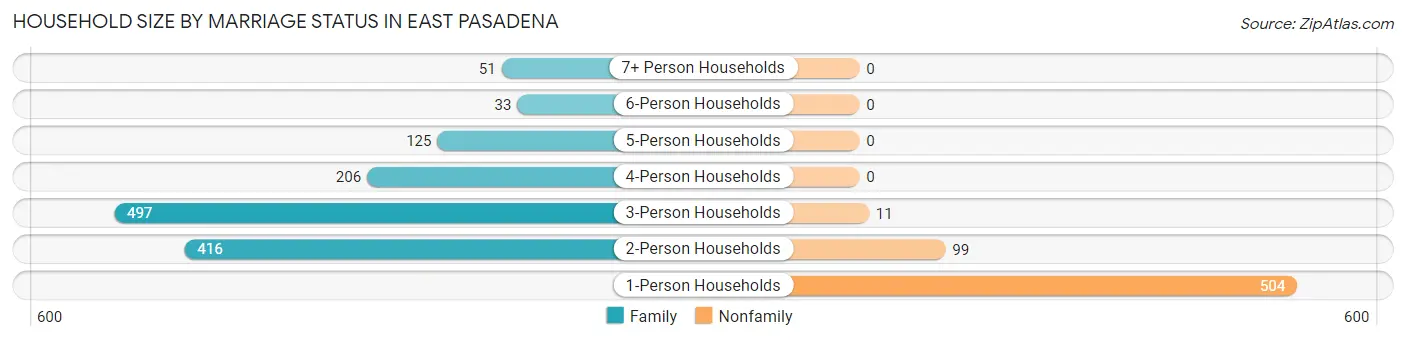
| Household Size | Family Households | Nonfamily Households |
| 1-Person Households | - | 504 (26.0%) |
| 2-Person Households | 416 (21.4%) | 99 (5.1%) |
| 3-Person Households | 497 (25.6%) | 11 (0.6%) |
| 4-Person Households | 206 (10.6%) | 0 (0.0%) |
| 5-Person Households | 125 (6.4%) | 0 (0.0%) |
| 6-Person Households | 33 (1.7%) | 0 (0.0%) |
| 7+ Person Households | 51 (2.6%) | 0 (0.0%) |
| Total | 1,328 (68.4%) | 614 (31.6%) |
Female Fertility in East Pasadena
Fertility by Age in East Pasadena
Average fertility rate in East Pasadena is 99.0 births per 1,000 women. Women in the age bracket of 20 to 34 years have the highest fertility rate with 174.0 births per 1,000 women. Women in the age bracket of 20 to 34 years acount for 57.7% of all women with births.
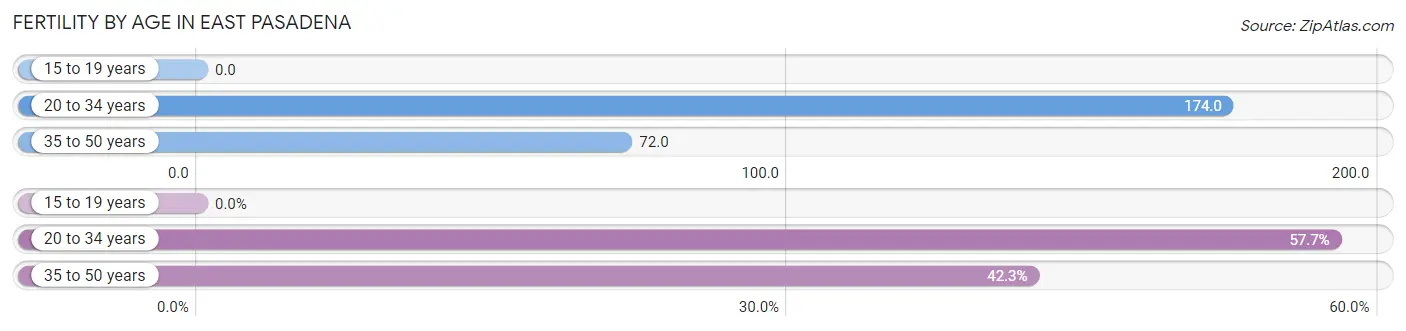
| Age Bracket | Women with Births | Births / 1,000 Women |
| 15 to 19 years | 0 (0.0%) | 0.0 |
| 20 to 34 years | 60 (57.7%) | 174.0 |
| 35 to 50 years | 44 (42.3%) | 72.0 |
| Total | 104 (100.0%) | 99.0 |
Fertility by Age by Marriage Status in East Pasadena
71.2% of women with births (104) in East Pasadena are married. The highest percentage of unmarried women with births falls into 20 to 34 years age bracket with 50.0% of them unmarried at the time of birth, while the lowest percentage of unmarried women with births belong to 35 to 50 years age bracket with 0.0% of them unmarried.
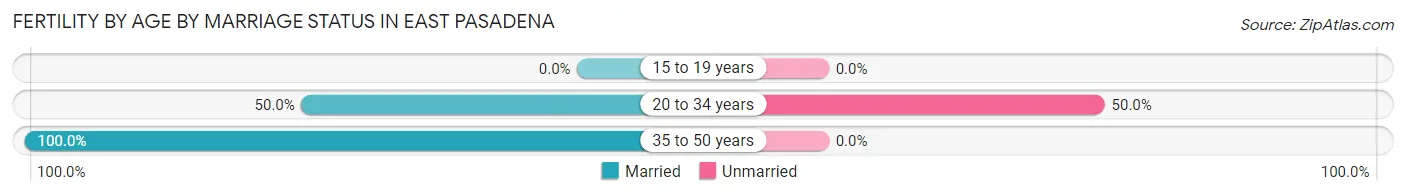
| Age Bracket | Married | Unmarried |
| 15 to 19 years | 0 (0.0%) | 0 (0.0%) |
| 20 to 34 years | 30 (50.0%) | 30 (50.0%) |
| 35 to 50 years | 44 (100.0%) | 0 (0.0%) |
| Total | 74 (71.2%) | 30 (28.8%) |
Fertility by Education in East Pasadena
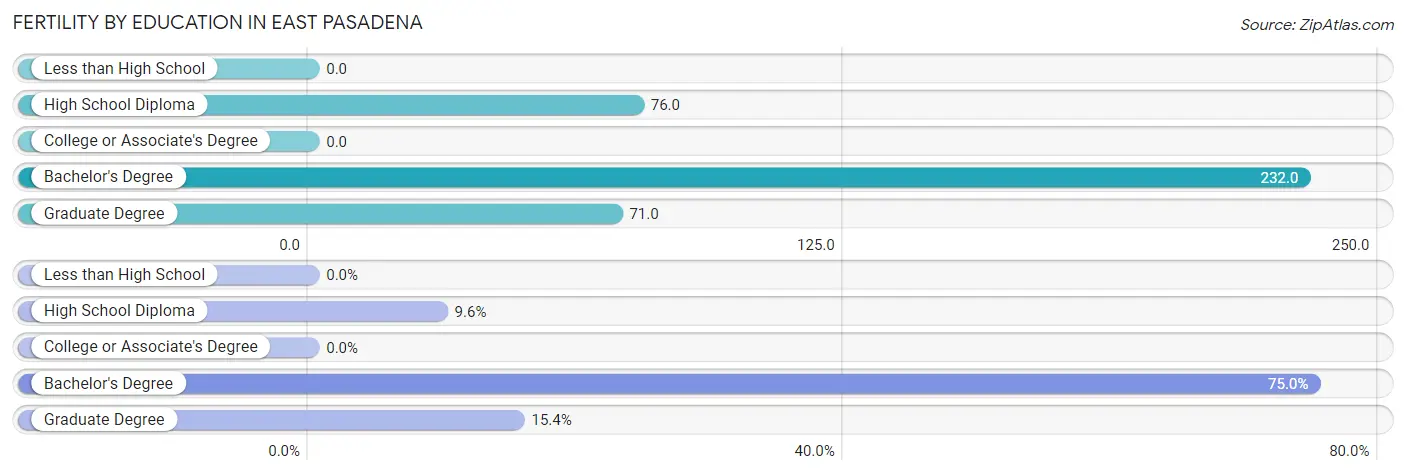
| Educational Attainment | Women with Births | Births / 1,000 Women |
| Less than High School | 0 (0.0%) | 0.0 |
| High School Diploma | 10 (9.6%) | 76.0 |
| College or Associate's Degree | 0 (0.0%) | 0.0 |
| Bachelor's Degree | 78 (75.0%) | 232.0 |
| Graduate Degree | 16 (15.4%) | 71.0 |
| Total | 104 (100.0%) | 99.0 |
Fertility by Education by Marriage Status in East Pasadena
28.8% of women with births in East Pasadena are unmarried. Women with the educational attainment of high school diploma are most likely to be married with 100.0% of them married at childbirth, while women with the educational attainment of bachelor's degree are least likely to be married with 38.5% of them unmarried at childbirth.
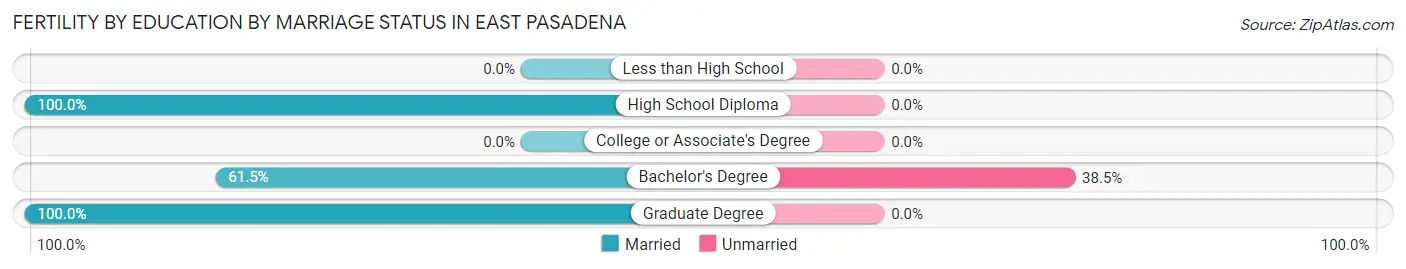
| Educational Attainment | Married | Unmarried |
| Less than High School | 0 (0.0%) | 0 (0.0%) |
| High School Diploma | 10 (100.0%) | 0 (0.0%) |
| College or Associate's Degree | 0 (0.0%) | 0 (0.0%) |
| Bachelor's Degree | 48 (61.5%) | 30 (38.5%) |
| Graduate Degree | 16 (100.0%) | 0 (0.0%) |
| Total | 74 (71.2%) | 30 (28.8%) |
Employment Characteristics in East Pasadena
Employment by Class of Employer in East Pasadena
Among the 2,621 employed individuals in East Pasadena, private company employees (1,423 | 54.3%), self-employed (not incorporated) (377 | 14.4%), and local government employees (292 | 11.1%) make up the most common classes of employment.
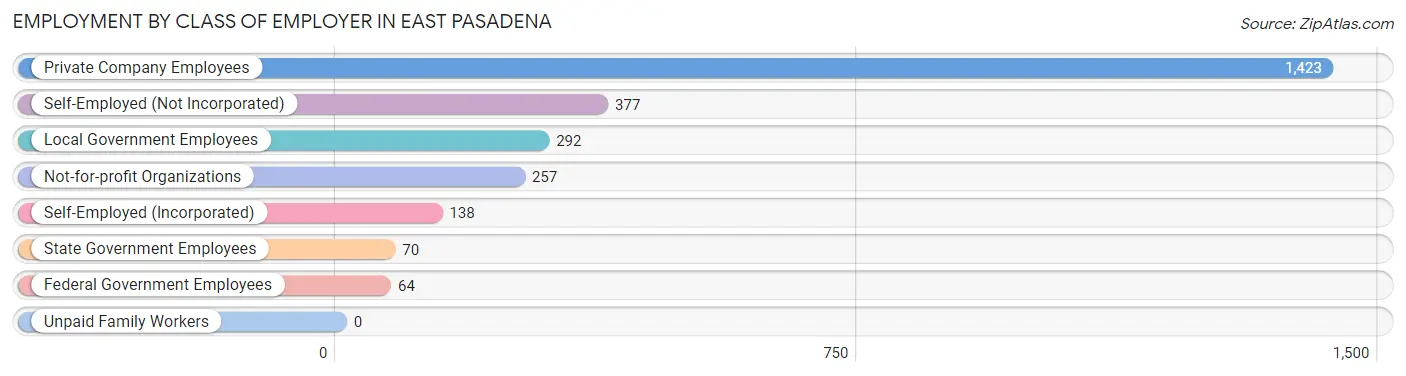
| Employer Class | # Employees | % Employees |
| Private Company Employees | 1,423 | 54.3% |
| Self-Employed (Incorporated) | 138 | 5.3% |
| Self-Employed (Not Incorporated) | 377 | 14.4% |
| Not-for-profit Organizations | 257 | 9.8% |
| Local Government Employees | 292 | 11.1% |
| State Government Employees | 70 | 2.7% |
| Federal Government Employees | 64 | 2.4% |
| Unpaid Family Workers | 0 | 0.0% |
| Total | 2,621 | 100.0% |
Employment Status by Age in East Pasadena
According to the labor force statistics for East Pasadena, out of the total population over 16 years of age (4,488), 60.6% or 2,720 individuals are in the labor force, with 2.2% or 60 of them unemployed. The age group with the highest labor force participation rate is 30 to 34 years, with 87.0% or 289 individuals in the labor force. Within the labor force, the 75 years and over age range has the highest percentage of unemployed individuals, with 32.0% or 8 of them being unemployed.
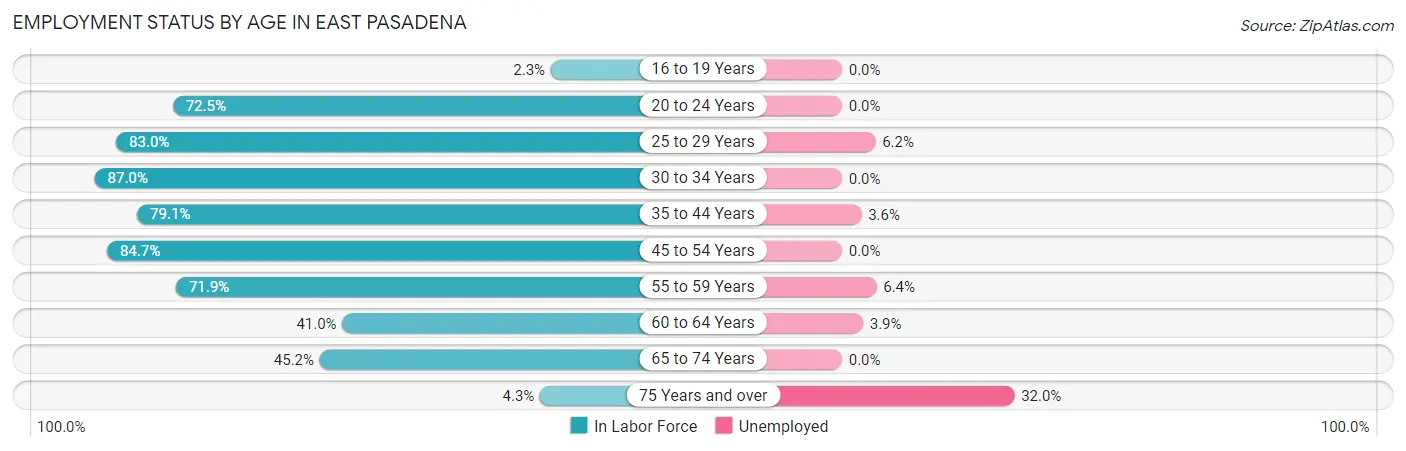
| Age Bracket | In Labor Force | Unemployed |
| 16 to 19 Years | 4 (2.3%) | 0 (0.0%) |
| 20 to 24 Years | 190 (72.5%) | 0 (0.0%) |
| 25 to 29 Years | 225 (83.0%) | 14 (6.2%) |
| 30 to 34 Years | 289 (87.0%) | 0 (0.0%) |
| 35 to 44 Years | 506 (79.1%) | 18 (3.6%) |
| 45 to 54 Years | 849 (84.7%) | 0 (0.0%) |
| 55 to 59 Years | 235 (71.9%) | 15 (6.4%) |
| 60 to 64 Years | 127 (41.0%) | 5 (3.9%) |
| 65 to 74 Years | 269 (45.2%) | 0 (0.0%) |
| 75 Years and over | 25 (4.3%) | 8 (32.0%) |
| Total | 2,720 (60.6%) | 60 (2.2%) |
Employment Status by Educational Attainment in East Pasadena
According to labor force statistics for East Pasadena, 77.4% of individuals (2,231) out of the total population between 25 and 64 years of age (2,882) are in the labor force, with 2.3% or 51 of them being unemployed. The group with the highest labor force participation rate are those with the educational attainment of college / associate degree, with 86.5% or 534 individuals in the labor force. Within the labor force, individuals with high school diploma education have the highest percentage of unemployment, with 3.3% or 8 of them being unemployed.
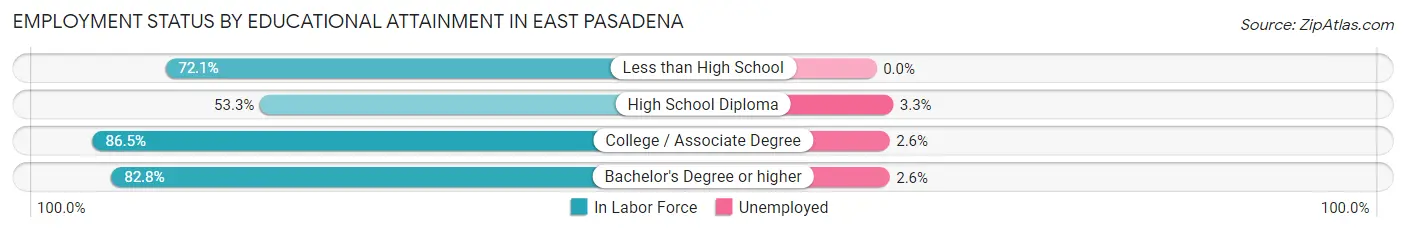
| Educational Attainment | In Labor Force | Unemployed |
| Less than High School | 302 (72.1%) | 0 (0.0%) |
| High School Diploma | 242 (53.3%) | 15 (3.3%) |
| College / Associate Degree | 534 (86.5%) | 16 (2.6%) |
| Bachelor's Degree or higher | 1,153 (82.8%) | 36 (2.6%) |
| Total | 2,231 (77.4%) | 66 (2.3%) |
Employment Occupations by Sex in East Pasadena
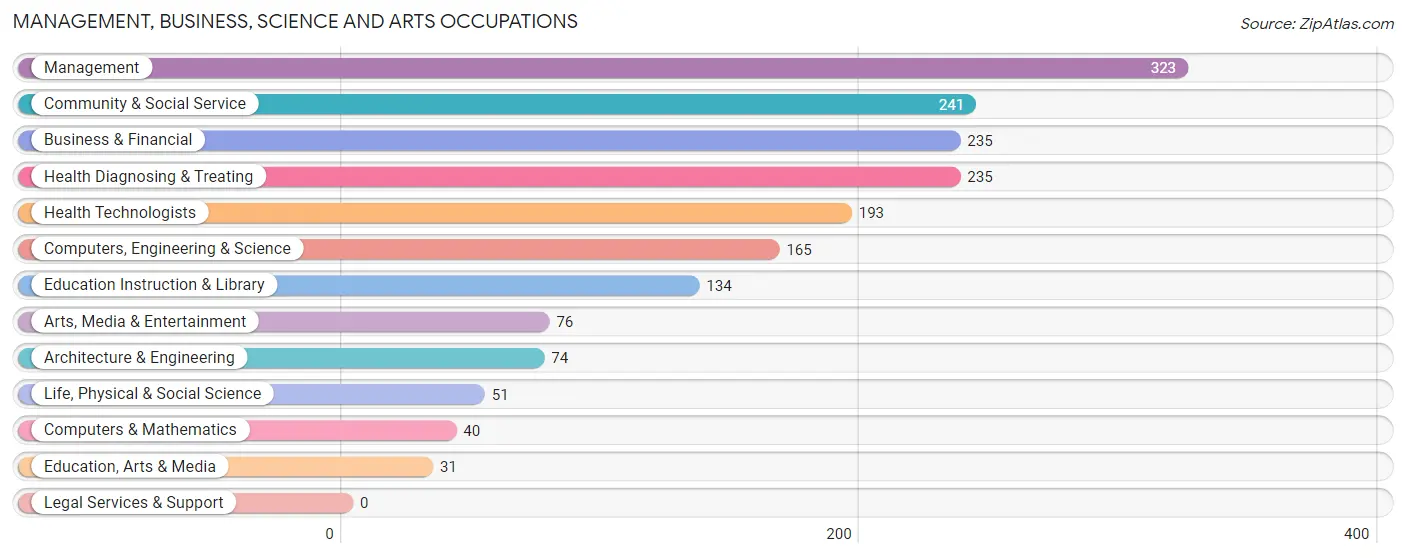
Management, Business, Science and Arts Occupations
The most common Management, Business, Science and Arts occupations in East Pasadena are Management (323 | 12.1%), Community & Social Service (241 | 9.1%), Business & Financial (235 | 8.8%), Health Diagnosing & Treating (235 | 8.8%), and Health Technologists (193 | 7.3%).
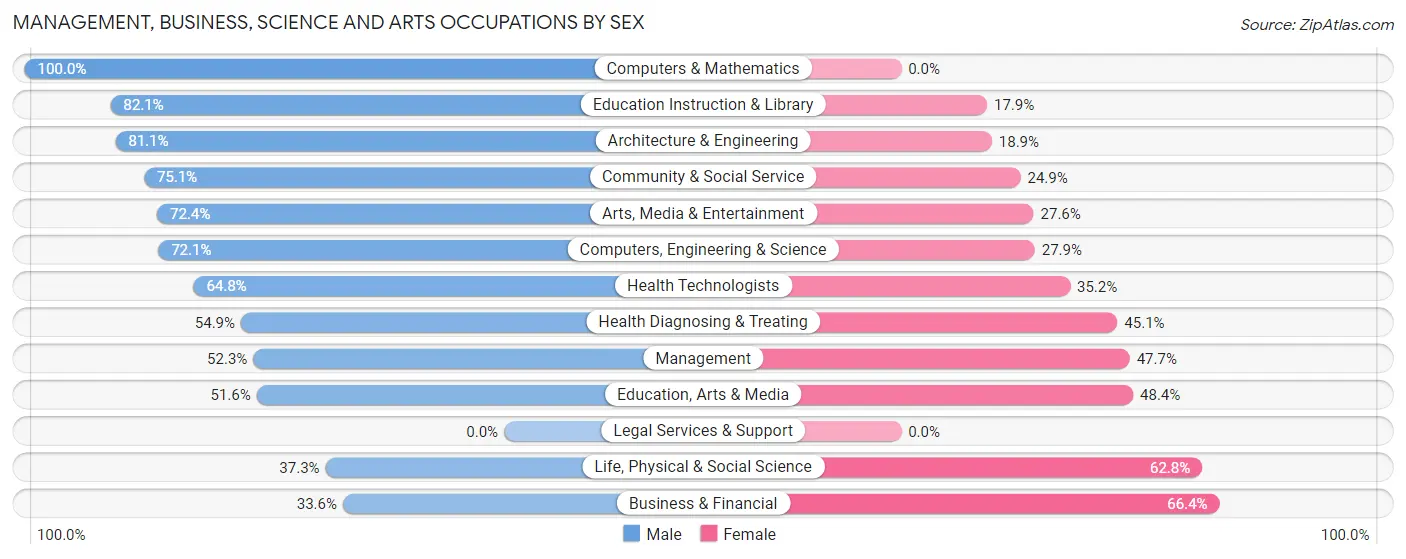
Management, Business, Science and Arts Occupations by Sex
Within the Management, Business, Science and Arts occupations in East Pasadena, the most male-oriented occupations are Computers & Mathematics (100.0%), Education Instruction & Library (82.1%), and Architecture & Engineering (81.1%), while the most female-oriented occupations are Business & Financial (66.4%), Life, Physical & Social Science (62.7%), and Education, Arts & Media (48.4%).
| Occupation | Male | Female |
| Management | 169 (52.3%) | 154 (47.7%) |
| Business & Financial | 79 (33.6%) | 156 (66.4%) |
| Computers, Engineering & Science | 119 (72.1%) | 46 (27.9%) |
| Computers & Mathematics | 40 (100.0%) | 0 (0.0%) |
| Architecture & Engineering | 60 (81.1%) | 14 (18.9%) |
| Life, Physical & Social Science | 19 (37.2%) | 32 (62.7%) |
| Community & Social Service | 181 (75.1%) | 60 (24.9%) |
| Education, Arts & Media | 16 (51.6%) | 15 (48.4%) |
| Legal Services & Support | 0 (0.0%) | 0 (0.0%) |
| Education Instruction & Library | 110 (82.1%) | 24 (17.9%) |
| Arts, Media & Entertainment | 55 (72.4%) | 21 (27.6%) |
| Health Diagnosing & Treating | 129 (54.9%) | 106 (45.1%) |
| Health Technologists | 125 (64.8%) | 68 (35.2%) |
| Total (Category) | 677 (56.5%) | 522 (43.5%) |
| Total (Overall) | 1,596 (60.0%) | 1,063 (40.0%) |
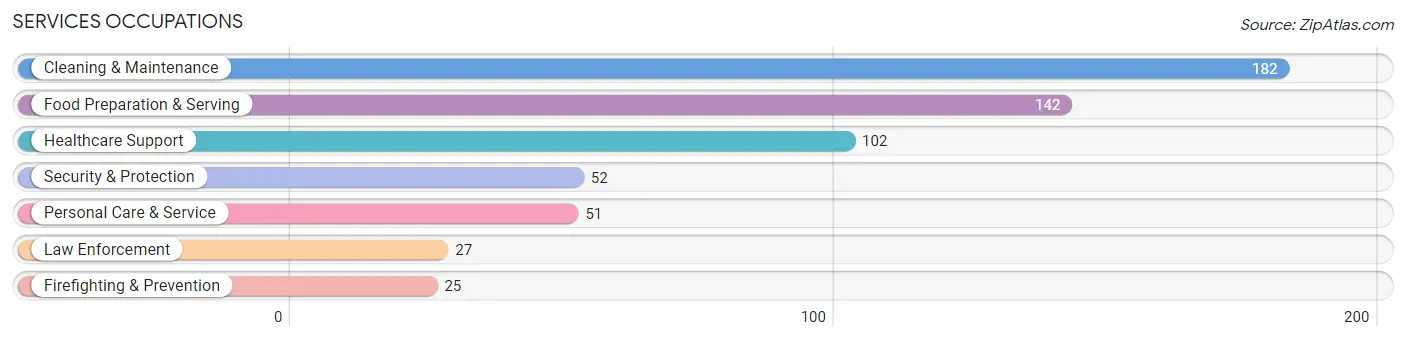
Services Occupations
The most common Services occupations in East Pasadena are Cleaning & Maintenance (182 | 6.8%), Food Preparation & Serving (142 | 5.3%), Healthcare Support (102 | 3.8%), Security & Protection (52 | 2.0%), and Personal Care & Service (51 | 1.9%).
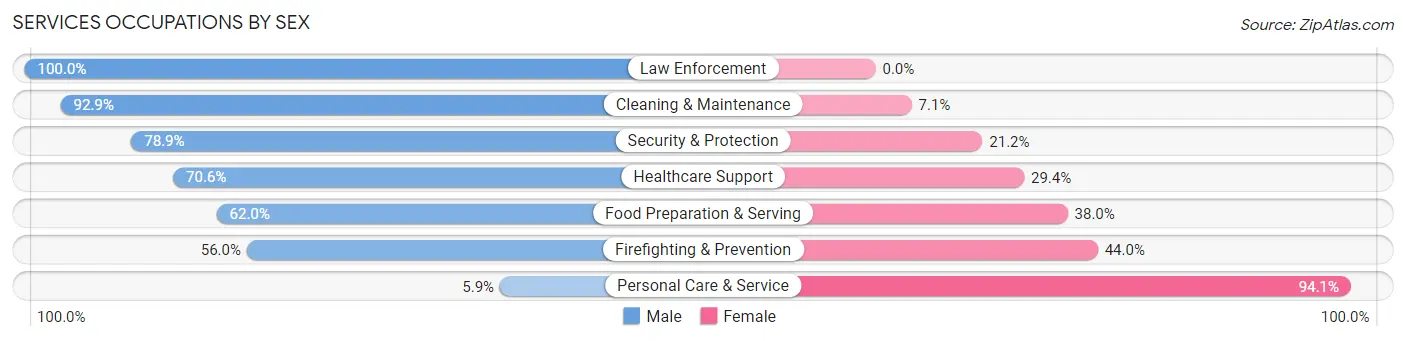
Services Occupations by Sex
Within the Services occupations in East Pasadena, the most male-oriented occupations are Law Enforcement (100.0%), Cleaning & Maintenance (92.9%), and Security & Protection (78.8%), while the most female-oriented occupations are Personal Care & Service (94.1%), Firefighting & Prevention (44.0%), and Food Preparation & Serving (38.0%).
| Occupation | Male | Female |
| Healthcare Support | 72 (70.6%) | 30 (29.4%) |
| Security & Protection | 41 (78.8%) | 11 (21.1%) |
| Firefighting & Prevention | 14 (56.0%) | 11 (44.0%) |
| Law Enforcement | 27 (100.0%) | 0 (0.0%) |
| Food Preparation & Serving | 88 (62.0%) | 54 (38.0%) |
| Cleaning & Maintenance | 169 (92.9%) | 13 (7.1%) |
| Personal Care & Service | 3 (5.9%) | 48 (94.1%) |
| Total (Category) | 373 (70.5%) | 156 (29.5%) |
| Total (Overall) | 1,596 (60.0%) | 1,063 (40.0%) |
Sales and Office Occupations
The most common Sales and Office occupations in East Pasadena are Sales & Related (308 | 11.6%), and Office & Administration (263 | 9.9%).
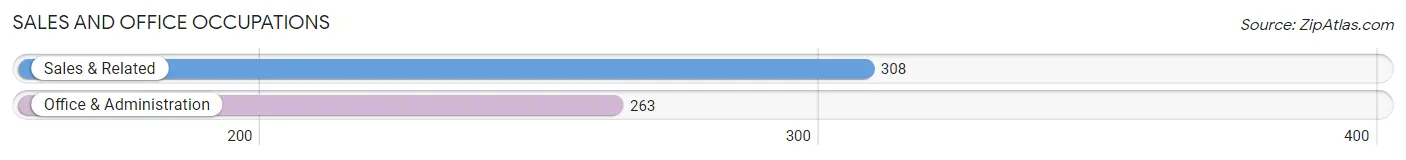
Sales and Office Occupations by Sex
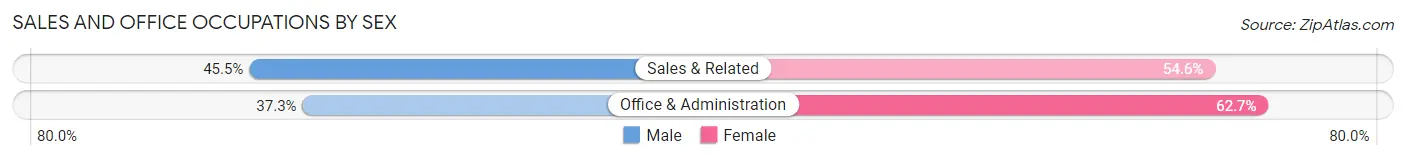
| Occupation | Male | Female |
| Sales & Related | 140 (45.5%) | 168 (54.5%) |
| Office & Administration | 98 (37.3%) | 165 (62.7%) |
| Total (Category) | 238 (41.7%) | 333 (58.3%) |
| Total (Overall) | 1,596 (60.0%) | 1,063 (40.0%) |
Natural Resources, Construction and Maintenance Occupations
The most common Natural Resources, Construction and Maintenance occupations in East Pasadena are Construction & Extraction (67 | 2.5%), and Installation, Maintenance & Repair (27 | 1.0%).
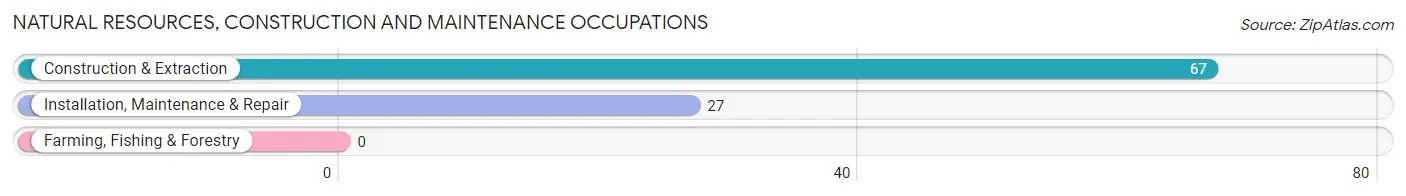
Natural Resources, Construction and Maintenance Occupations by Sex
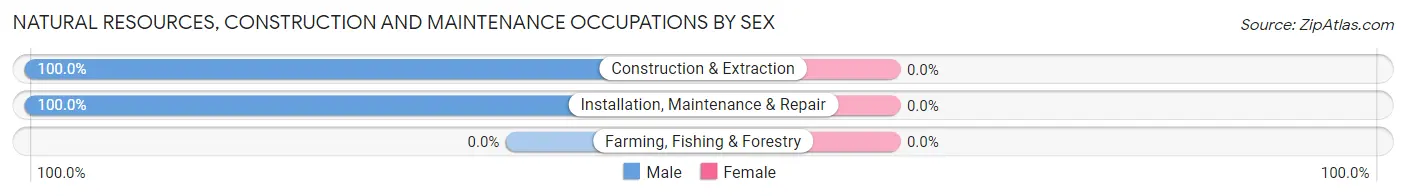
| Occupation | Male | Female |
| Farming, Fishing & Forestry | 0 (0.0%) | 0 (0.0%) |
| Construction & Extraction | 67 (100.0%) | 0 (0.0%) |
| Installation, Maintenance & Repair | 27 (100.0%) | 0 (0.0%) |
| Total (Category) | 94 (100.0%) | 0 (0.0%) |
| Total (Overall) | 1,596 (60.0%) | 1,063 (40.0%) |
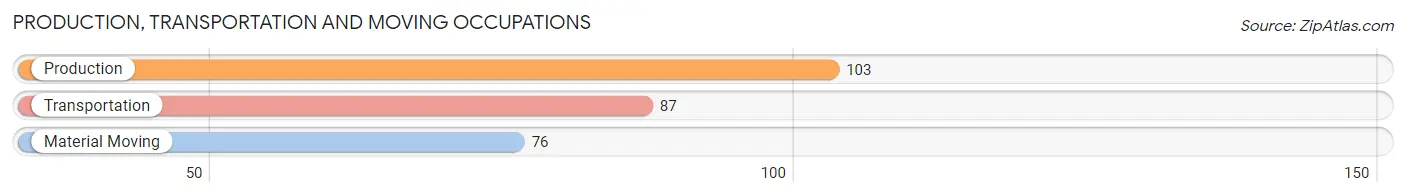
Production, Transportation and Moving Occupations
The most common Production, Transportation and Moving occupations in East Pasadena are Production (103 | 3.9%), Transportation (87 | 3.3%), and Material Moving (76 | 2.9%).
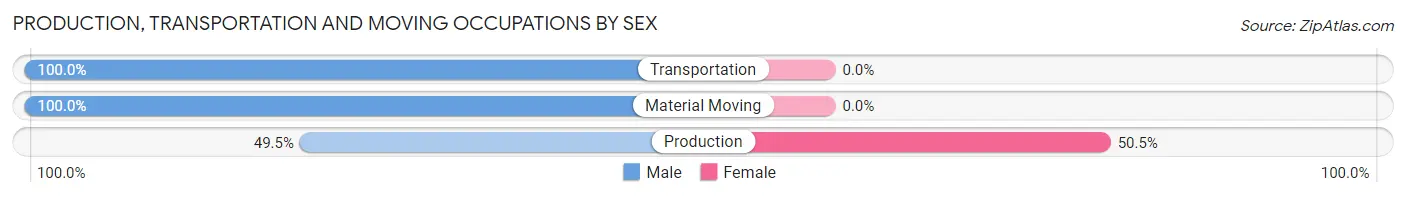
Production, Transportation and Moving Occupations by Sex
| Occupation | Male | Female |
| Production | 51 (49.5%) | 52 (50.5%) |
| Transportation | 87 (100.0%) | 0 (0.0%) |
| Material Moving | 76 (100.0%) | 0 (0.0%) |
| Total (Category) | 214 (80.4%) | 52 (19.6%) |
| Total (Overall) | 1,596 (60.0%) | 1,063 (40.0%) |
Employment Industries by Sex in East Pasadena
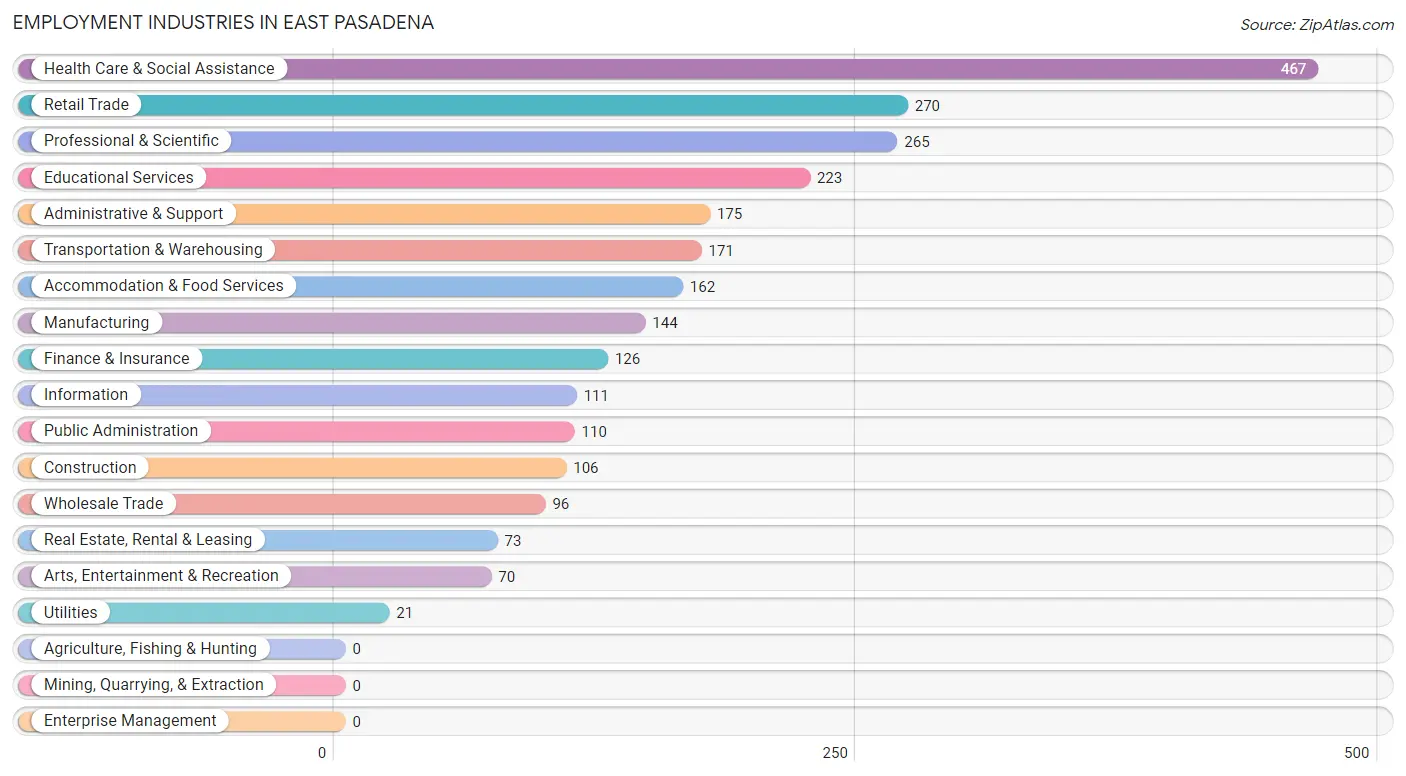
Employment Industries in East Pasadena
The major employment industries in East Pasadena include Health Care & Social Assistance (467 | 17.6%), Retail Trade (270 | 10.2%), Professional & Scientific (265 | 10.0%), Educational Services (223 | 8.4%), and Administrative & Support (175 | 6.6%).
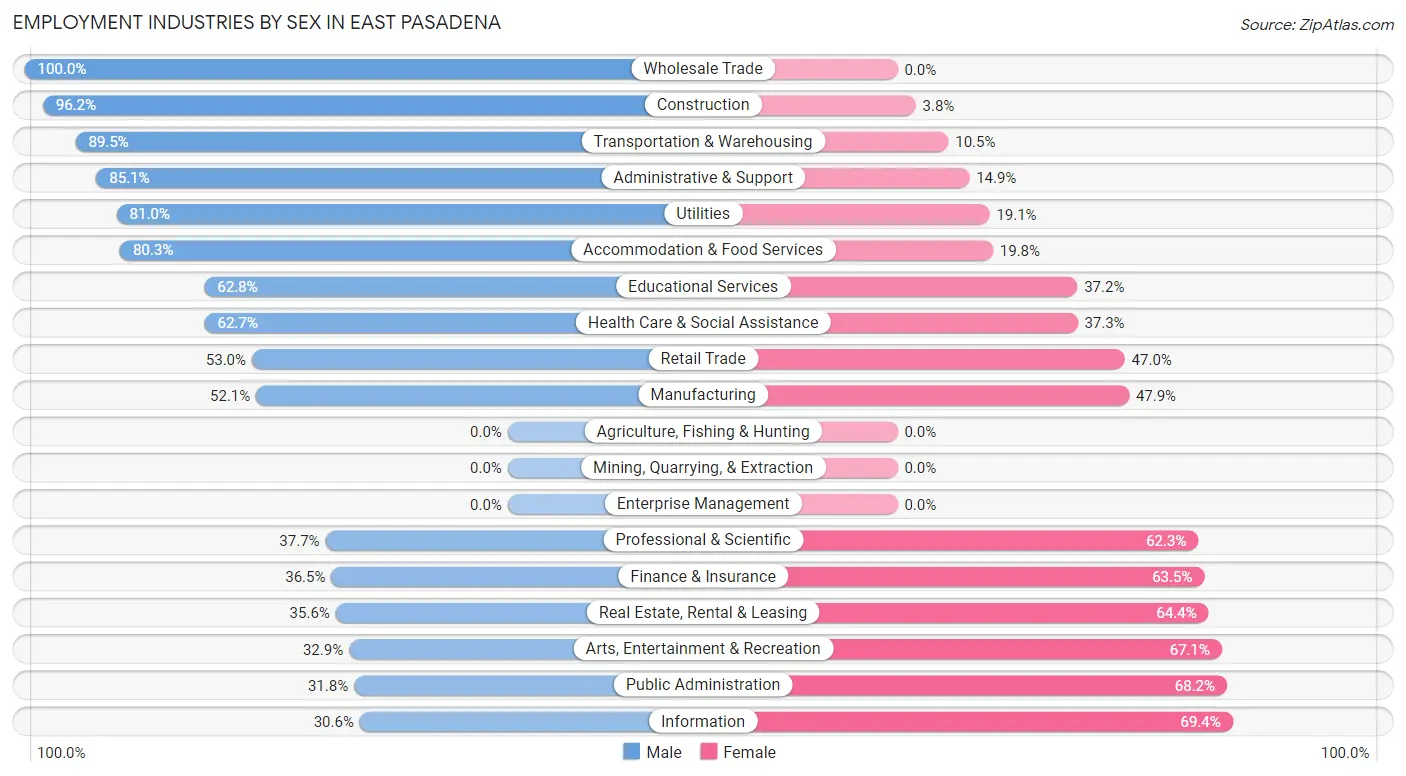
Employment Industries by Sex in East Pasadena
The East Pasadena industries that see more men than women are Wholesale Trade (100.0%), Construction (96.2%), and Transportation & Warehousing (89.5%), whereas the industries that tend to have a higher number of women are Information (69.4%), Public Administration (68.2%), and Arts, Entertainment & Recreation (67.1%).
| Industry | Male | Female |
| Agriculture, Fishing & Hunting | 0 (0.0%) | 0 (0.0%) |
| Mining, Quarrying, & Extraction | 0 (0.0%) | 0 (0.0%) |
| Construction | 102 (96.2%) | 4 (3.8%) |
| Manufacturing | 75 (52.1%) | 69 (47.9%) |
| Wholesale Trade | 96 (100.0%) | 0 (0.0%) |
| Retail Trade | 143 (53.0%) | 127 (47.0%) |
| Transportation & Warehousing | 153 (89.5%) | 18 (10.5%) |
| Utilities | 17 (80.9%) | 4 (19.1%) |
| Information | 34 (30.6%) | 77 (69.4%) |
| Finance & Insurance | 46 (36.5%) | 80 (63.5%) |
| Real Estate, Rental & Leasing | 26 (35.6%) | 47 (64.4%) |
| Professional & Scientific | 100 (37.7%) | 165 (62.3%) |
| Enterprise Management | 0 (0.0%) | 0 (0.0%) |
| Administrative & Support | 149 (85.1%) | 26 (14.9%) |
| Educational Services | 140 (62.8%) | 83 (37.2%) |
| Health Care & Social Assistance | 293 (62.7%) | 174 (37.3%) |
| Arts, Entertainment & Recreation | 23 (32.9%) | 47 (67.1%) |
| Accommodation & Food Services | 130 (80.2%) | 32 (19.8%) |
| Public Administration | 35 (31.8%) | 75 (68.2%) |
| Total | 1,596 (60.0%) | 1,063 (40.0%) |
Education in East Pasadena
School Enrollment in East Pasadena
The most common levels of schooling among the 1,086 students in East Pasadena are middle school (292 | 26.9%), elementary school (240 | 22.1%), and college / undergraduate (190 | 17.5%).
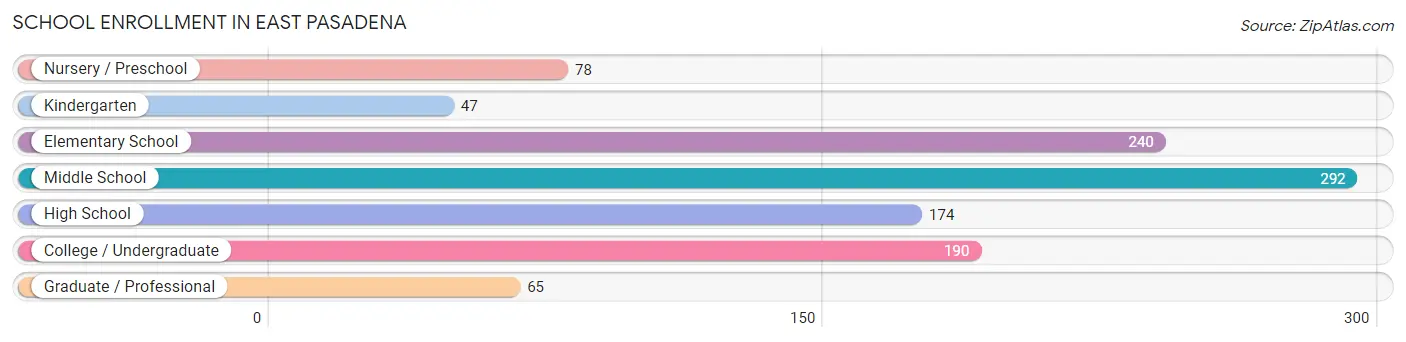
| School Level | # Students | % Students |
| Nursery / Preschool | 78 | 7.2% |
| Kindergarten | 47 | 4.3% |
| Elementary School | 240 | 22.1% |
| Middle School | 292 | 26.9% |
| High School | 174 | 16.0% |
| College / Undergraduate | 190 | 17.5% |
| Graduate / Professional | 65 | 6.0% |
| Total | 1,086 | 100.0% |
School Enrollment by Age by Funding Source in East Pasadena
Out of a total of 1,086 students who are enrolled in schools in East Pasadena, 279 (25.7%) attend a private institution, while the remaining 807 (74.3%) are enrolled in public schools. The age group of 3 to 4 year olds has the highest likelihood of being enrolled in private schools, with 36 (100.0% in the age bracket) enrolled. Conversely, the age group of 18 to 19 year olds has the lowest likelihood of being enrolled in a private school, with 79 (94.1% in the age bracket) attending a public institution.
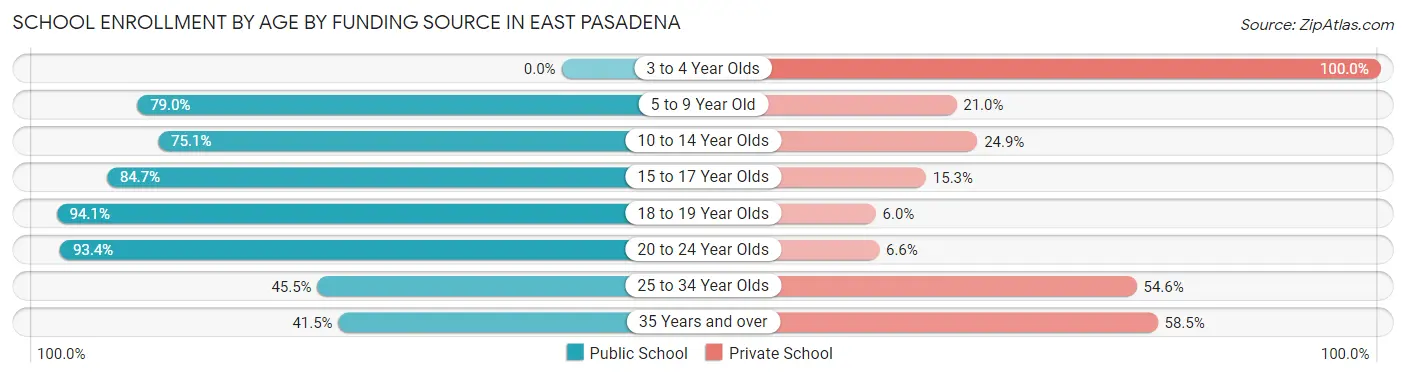
| Age Bracket | Public School | Private School |
| 3 to 4 Year Olds | 0 (0.0%) | 36 (100.0%) |
| 5 to 9 Year Old | 226 (79.0%) | 60 (21.0%) |
| 10 to 14 Year Olds | 287 (75.1%) | 95 (24.9%) |
| 15 to 17 Year Olds | 83 (84.7%) | 15 (15.3%) |
| 18 to 19 Year Olds | 79 (94.1%) | 5 (5.9%) |
| 20 to 24 Year Olds | 85 (93.4%) | 6 (6.6%) |
| 25 to 34 Year Olds | 20 (45.5%) | 24 (54.5%) |
| 35 Years and over | 27 (41.5%) | 38 (58.5%) |
| Total | 807 (74.3%) | 279 (25.7%) |
Educational Attainment by Field of Study in East Pasadena
Business (351 | 17.3%), science & technology (223 | 11.0%), social sciences (219 | 10.8%), visual & performing arts (175 | 8.6%), and bio, nature & agricultural (172 | 8.5%) are the most common fields of study among 2,030 individuals in East Pasadena who have obtained a bachelor's degree or higher.
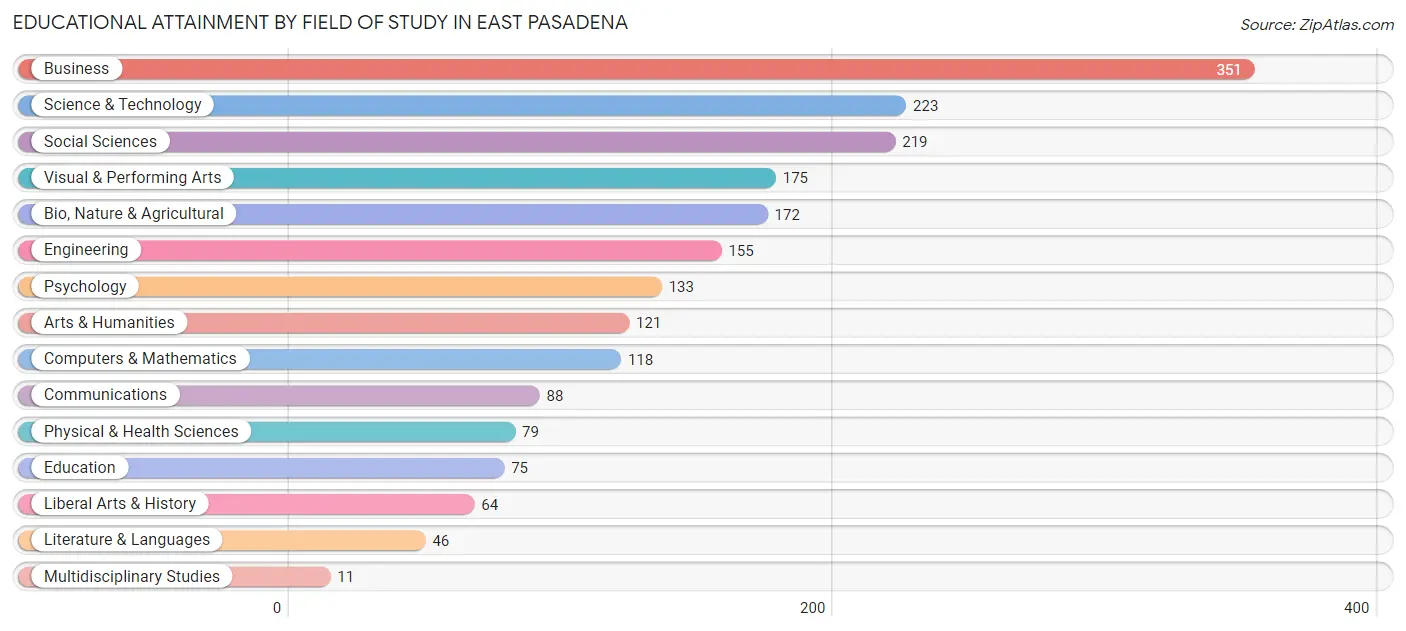
| Field of Study | # Graduates | % Graduates |
| Computers & Mathematics | 118 | 5.8% |
| Bio, Nature & Agricultural | 172 | 8.5% |
| Physical & Health Sciences | 79 | 3.9% |
| Psychology | 133 | 6.6% |
| Social Sciences | 219 | 10.8% |
| Engineering | 155 | 7.6% |
| Multidisciplinary Studies | 11 | 0.5% |
| Science & Technology | 223 | 11.0% |
| Business | 351 | 17.3% |
| Education | 75 | 3.7% |
| Literature & Languages | 46 | 2.3% |
| Liberal Arts & History | 64 | 3.2% |
| Visual & Performing Arts | 175 | 8.6% |
| Communications | 88 | 4.3% |
| Arts & Humanities | 121 | 6.0% |
| Total | 2,030 | 100.0% |
Transportation & Commute in East Pasadena
Vehicle Availability by Sex in East Pasadena
The most prevalent vehicle ownership categories in East Pasadena are males with 2 vehicles (624, accounting for 39.6%) and females with 2 vehicles (254, making up 60.2%).
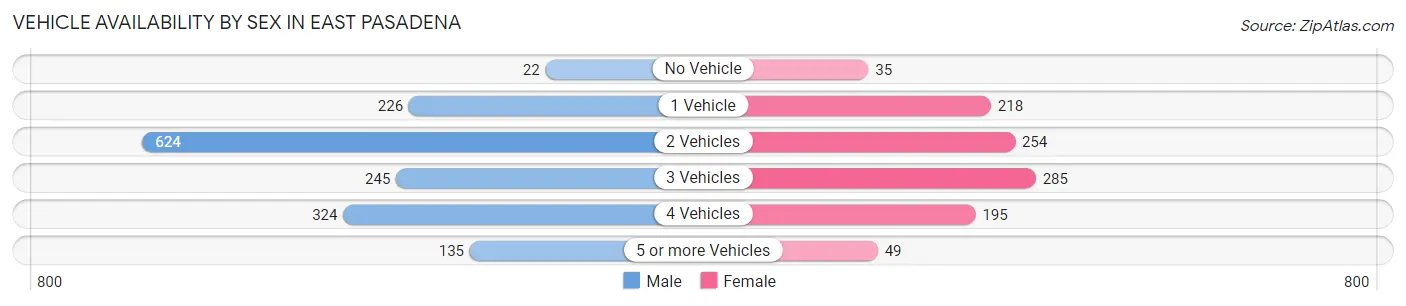
| Vehicles Available | Male | Female |
| No Vehicle | 22 (1.4%) | 35 (3.4%) |
| 1 Vehicle | 226 (14.3%) | 218 (21.0%) |
| 2 Vehicles | 624 (39.6%) | 254 (24.5%) |
| 3 Vehicles | 245 (15.5%) | 285 (27.5%) |
| 4 Vehicles | 324 (20.6%) | 195 (18.8%) |
| 5 or more Vehicles | 135 (8.6%) | 49 (4.7%) |
| Total | 1,576 (100.0%) | 1,036 (100.0%) |
Commute Time in East Pasadena
The most frequently occuring commute durations in East Pasadena are 20 to 24 minutes (451 commuters, 19.5%), 30 to 34 minutes (350 commuters, 15.2%), and 15 to 19 minutes (286 commuters, 12.4%).
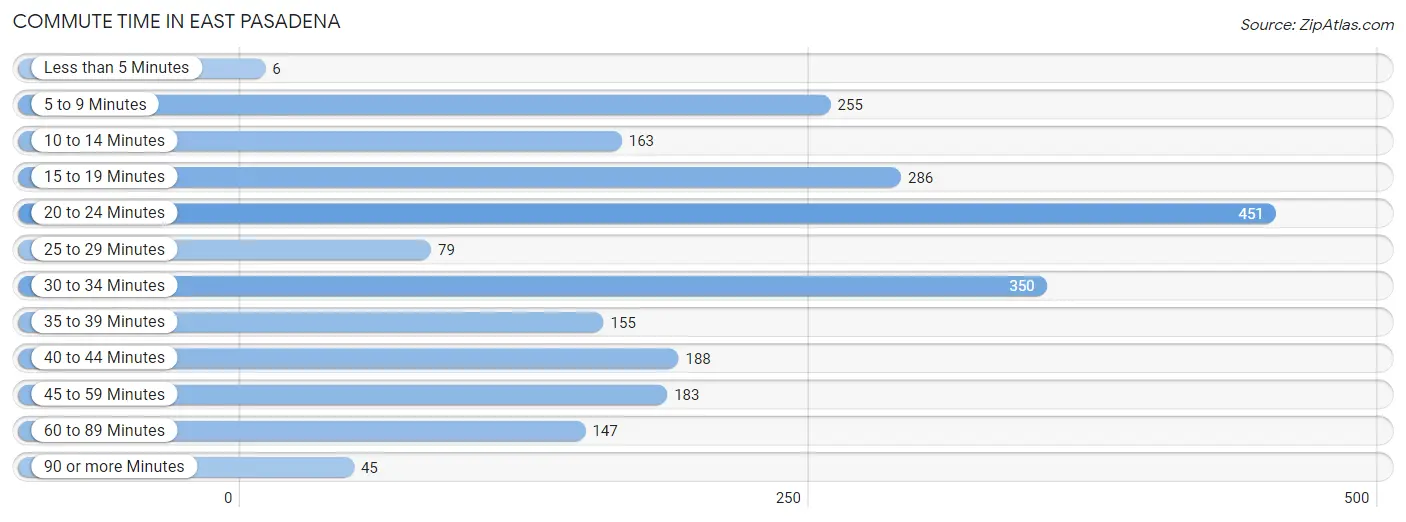
| Commute Time | # Commuters | % Commuters |
| Less than 5 Minutes | 6 | 0.3% |
| 5 to 9 Minutes | 255 | 11.1% |
| 10 to 14 Minutes | 163 | 7.1% |
| 15 to 19 Minutes | 286 | 12.4% |
| 20 to 24 Minutes | 451 | 19.5% |
| 25 to 29 Minutes | 79 | 3.4% |
| 30 to 34 Minutes | 350 | 15.2% |
| 35 to 39 Minutes | 155 | 6.7% |
| 40 to 44 Minutes | 188 | 8.2% |
| 45 to 59 Minutes | 183 | 7.9% |
| 60 to 89 Minutes | 147 | 6.4% |
| 90 or more Minutes | 45 | 1.9% |
Commute Time by Sex in East Pasadena
The most common commute times in East Pasadena are 20 to 24 minutes (357 commuters, 24.6%) for males and 30 to 34 minutes (170 commuters, 19.9%) for females.
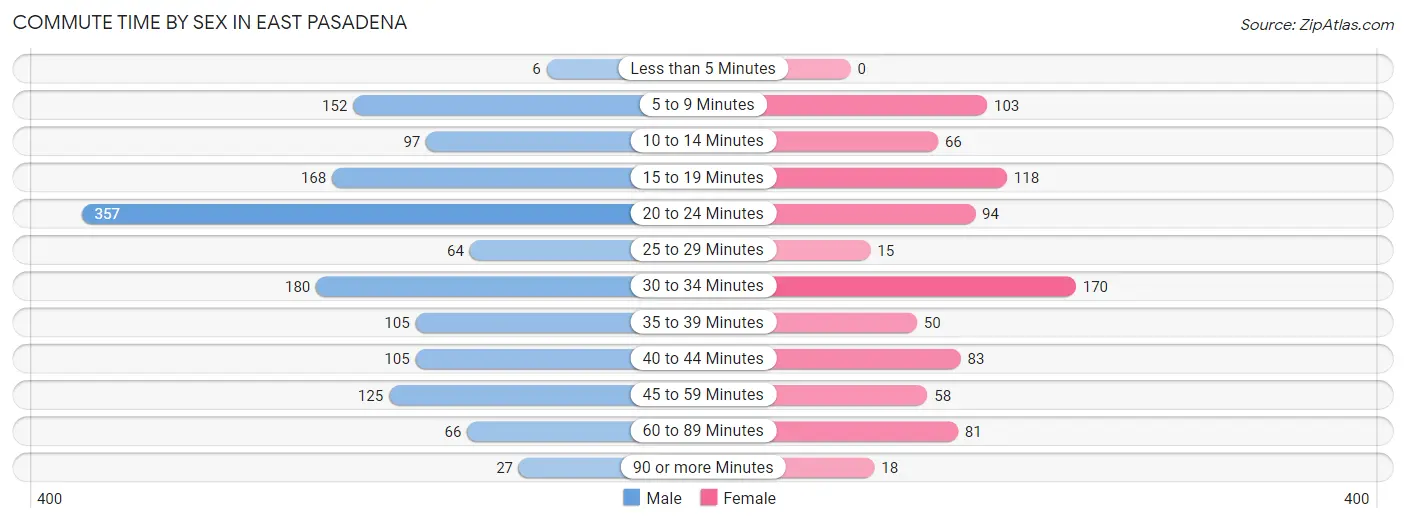
| Commute Time | Male | Female |
| Less than 5 Minutes | 6 (0.4%) | 0 (0.0%) |
| 5 to 9 Minutes | 152 (10.5%) | 103 (12.0%) |
| 10 to 14 Minutes | 97 (6.7%) | 66 (7.7%) |
| 15 to 19 Minutes | 168 (11.6%) | 118 (13.8%) |
| 20 to 24 Minutes | 357 (24.6%) | 94 (11.0%) |
| 25 to 29 Minutes | 64 (4.4%) | 15 (1.8%) |
| 30 to 34 Minutes | 180 (12.4%) | 170 (19.9%) |
| 35 to 39 Minutes | 105 (7.2%) | 50 (5.8%) |
| 40 to 44 Minutes | 105 (7.2%) | 83 (9.7%) |
| 45 to 59 Minutes | 125 (8.6%) | 58 (6.8%) |
| 60 to 89 Minutes | 66 (4.5%) | 81 (9.5%) |
| 90 or more Minutes | 27 (1.9%) | 18 (2.1%) |
Time of Departure to Work by Sex in East Pasadena
The most frequent times of departure to work in East Pasadena are 7:00 AM to 7:29 AM (250, 17.2%) for males and 8:00 AM to 8:29 AM (142, 16.6%) for females.
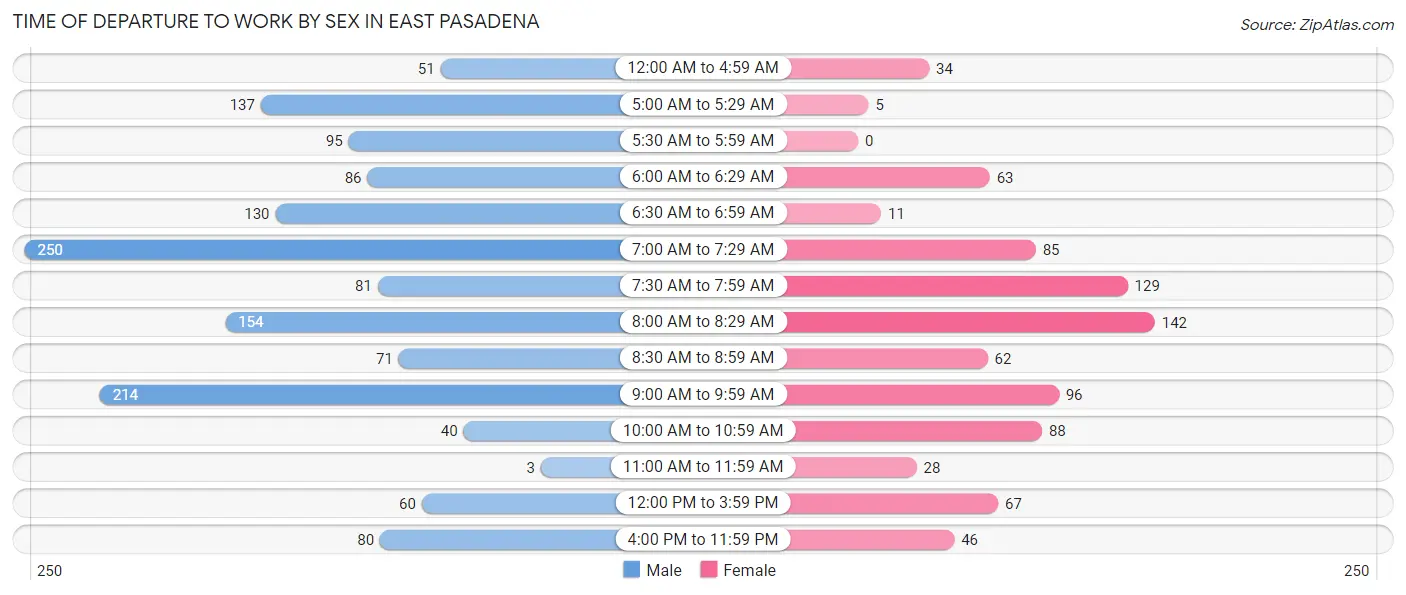
| Time of Departure | Male | Female |
| 12:00 AM to 4:59 AM | 51 (3.5%) | 34 (4.0%) |
| 5:00 AM to 5:29 AM | 137 (9.4%) | 5 (0.6%) |
| 5:30 AM to 5:59 AM | 95 (6.5%) | 0 (0.0%) |
| 6:00 AM to 6:29 AM | 86 (5.9%) | 63 (7.4%) |
| 6:30 AM to 6:59 AM | 130 (8.9%) | 11 (1.3%) |
| 7:00 AM to 7:29 AM | 250 (17.2%) | 85 (9.9%) |
| 7:30 AM to 7:59 AM | 81 (5.6%) | 129 (15.1%) |
| 8:00 AM to 8:29 AM | 154 (10.6%) | 142 (16.6%) |
| 8:30 AM to 8:59 AM | 71 (4.9%) | 62 (7.2%) |
| 9:00 AM to 9:59 AM | 214 (14.7%) | 96 (11.2%) |
| 10:00 AM to 10:59 AM | 40 (2.8%) | 88 (10.3%) |
| 11:00 AM to 11:59 AM | 3 (0.2%) | 28 (3.3%) |
| 12:00 PM to 3:59 PM | 60 (4.1%) | 67 (7.8%) |
| 4:00 PM to 11:59 PM | 80 (5.5%) | 46 (5.4%) |
| Total | 1,452 (100.0%) | 856 (100.0%) |
Housing Occupancy in East Pasadena
Occupancy by Ownership in East Pasadena
Of the total 1,942 dwellings in East Pasadena, owner-occupied units account for 1,376 (70.9%), while renter-occupied units make up 566 (29.1%).
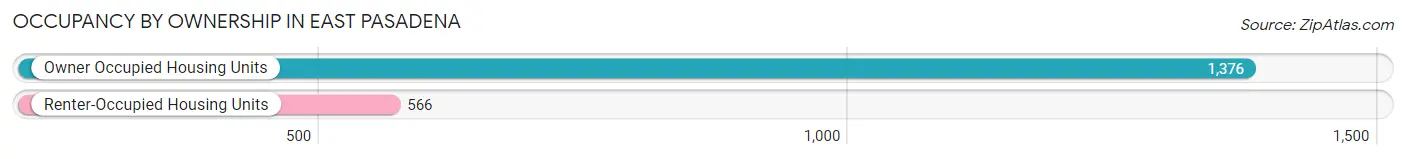
| Occupancy | # Housing Units | % Housing Units |
| Owner Occupied Housing Units | 1,376 | 70.9% |
| Renter-Occupied Housing Units | 566 | 29.1% |
| Total Occupied Housing Units | 1,942 | 100.0% |
Occupancy by Household Size in East Pasadena
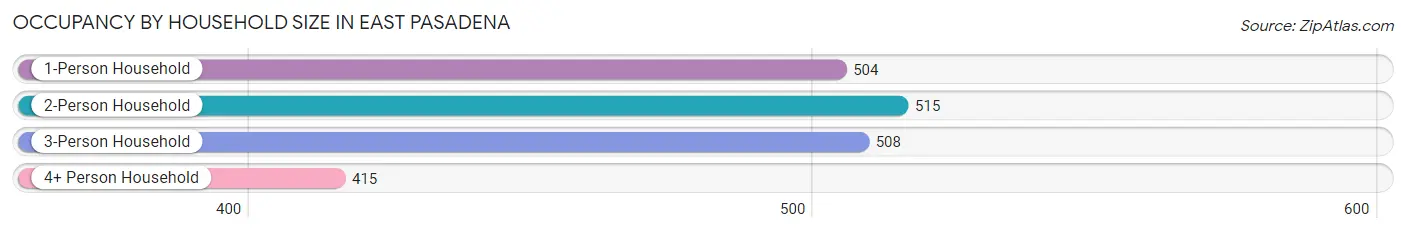
| Household Size | # Housing Units | % Housing Units |
| 1-Person Household | 504 | 26.0% |
| 2-Person Household | 515 | 26.5% |
| 3-Person Household | 508 | 26.2% |
| 4+ Person Household | 415 | 21.4% |
| Total Housing Units | 1,942 | 100.0% |
Occupancy by Ownership by Household Size in East Pasadena
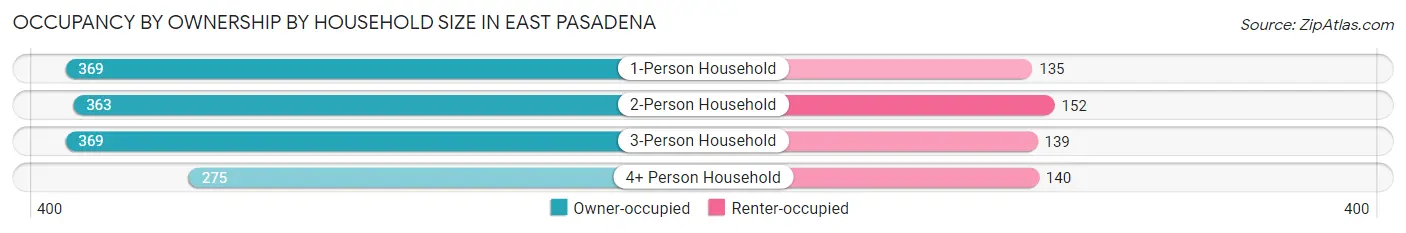
| Household Size | Owner-occupied | Renter-occupied |
| 1-Person Household | 369 (73.2%) | 135 (26.8%) |
| 2-Person Household | 363 (70.5%) | 152 (29.5%) |
| 3-Person Household | 369 (72.6%) | 139 (27.4%) |
| 4+ Person Household | 275 (66.3%) | 140 (33.7%) |
| Total Housing Units | 1,376 (70.9%) | 566 (29.1%) |
Occupancy by Educational Attainment in East Pasadena
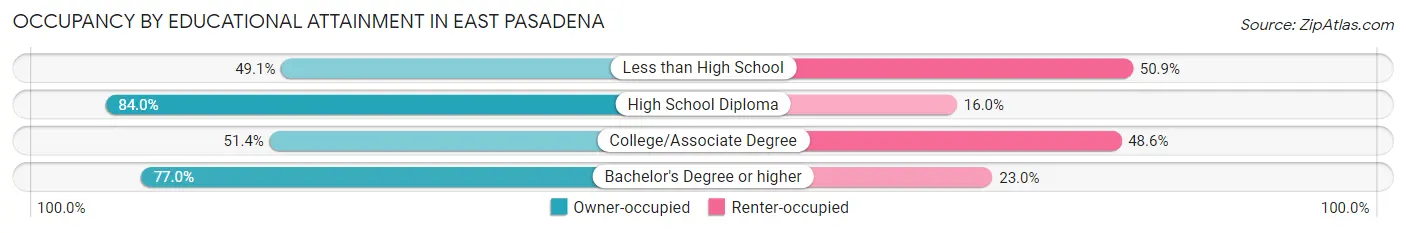
| Household Size | Owner-occupied | Renter-occupied |
| Less than High School | 84 (49.1%) | 87 (50.9%) |
| High School Diploma | 231 (84.0%) | 44 (16.0%) |
| College/Associate Degree | 182 (51.4%) | 172 (48.6%) |
| Bachelor's Degree or higher | 879 (77.0%) | 263 (23.0%) |
Occupancy by Age of Householder in East Pasadena
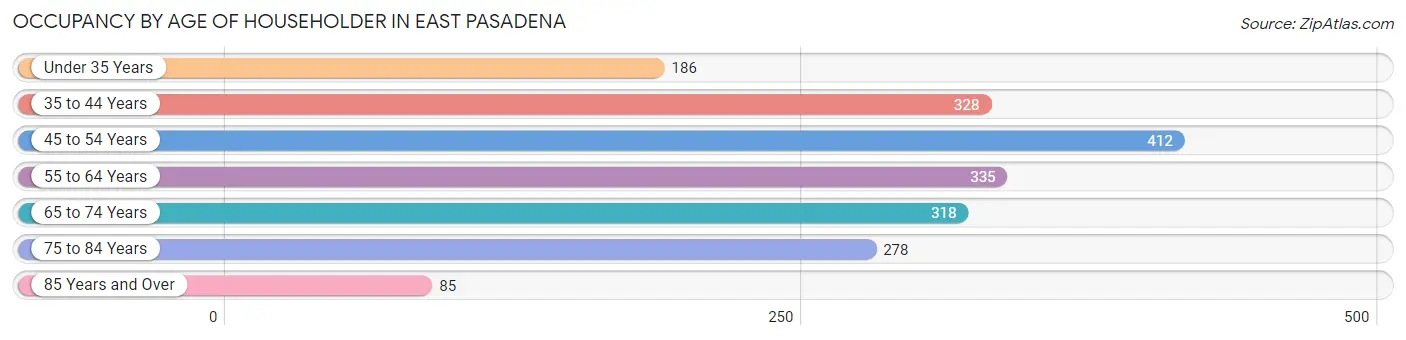
| Age Bracket | # Households | % Households |
| Under 35 Years | 186 | 9.6% |
| 35 to 44 Years | 328 | 16.9% |
| 45 to 54 Years | 412 | 21.2% |
| 55 to 64 Years | 335 | 17.2% |
| 65 to 74 Years | 318 | 16.4% |
| 75 to 84 Years | 278 | 14.3% |
| 85 Years and Over | 85 | 4.4% |
| Total | 1,942 | 100.0% |
Housing Finances in East Pasadena
Median Income by Occupancy in East Pasadena
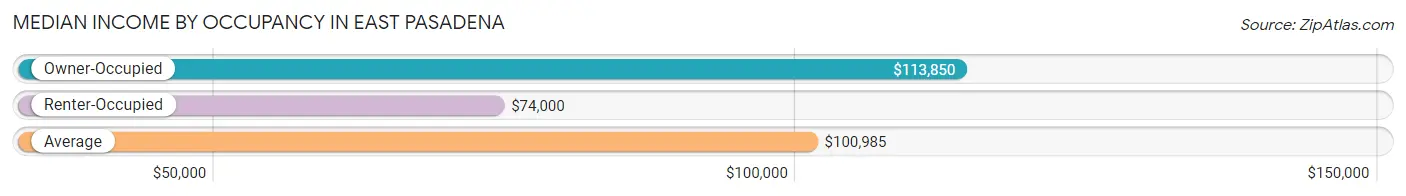
| Occupancy Type | # Households | Median Income |
| Owner-Occupied | 1,376 (70.9%) | $113,850 |
| Renter-Occupied | 566 (29.1%) | $74,000 |
| Average | 1,942 (100.0%) | $100,985 |
Occupancy by Householder Income Bracket in East Pasadena
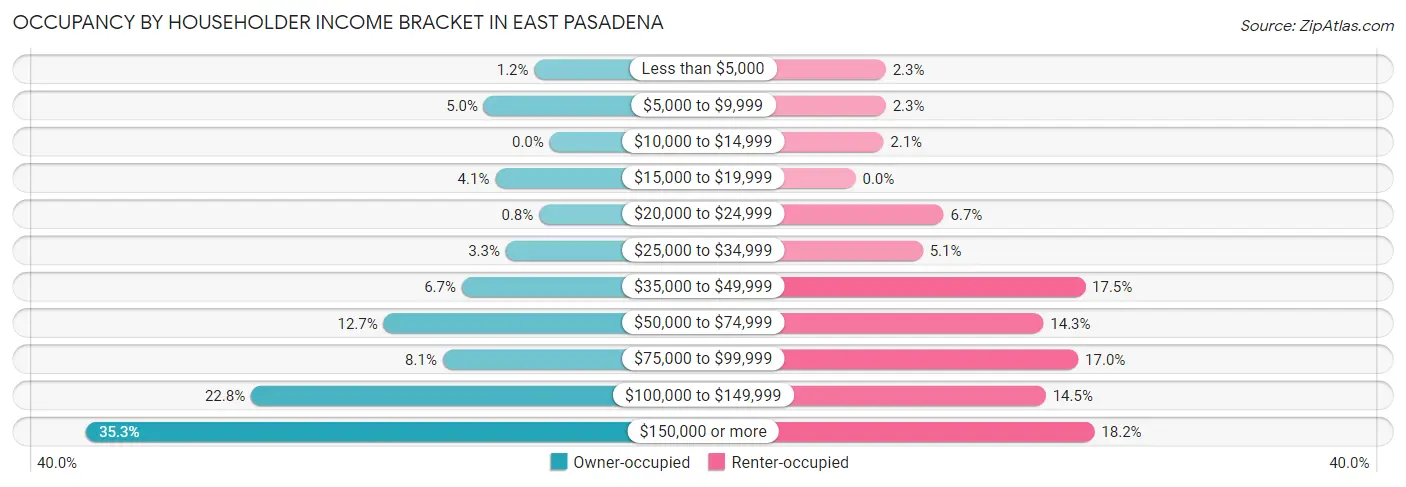
| Income Bracket | Owner-occupied | Renter-occupied |
| Less than $5,000 | 16 (1.2%) | 13 (2.3%) |
| $5,000 to $9,999 | 69 (5.0%) | 13 (2.3%) |
| $10,000 to $14,999 | 0 (0.0%) | 12 (2.1%) |
| $15,000 to $19,999 | 57 (4.1%) | 0 (0.0%) |
| $20,000 to $24,999 | 11 (0.8%) | 38 (6.7%) |
| $25,000 to $34,999 | 46 (3.3%) | 29 (5.1%) |
| $35,000 to $49,999 | 92 (6.7%) | 99 (17.5%) |
| $50,000 to $74,999 | 174 (12.7%) | 81 (14.3%) |
| $75,000 to $99,999 | 112 (8.1%) | 96 (17.0%) |
| $100,000 to $149,999 | 313 (22.8%) | 82 (14.5%) |
| $150,000 or more | 486 (35.3%) | 103 (18.2%) |
| Total | 1,376 (100.0%) | 566 (100.0%) |
Monthly Housing Cost Tiers in East Pasadena
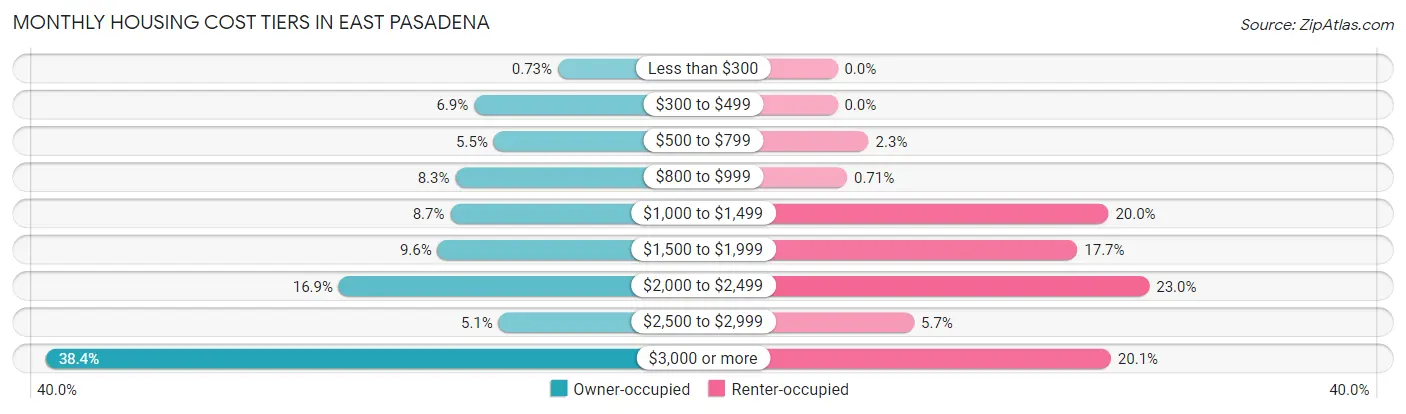
| Monthly Cost | Owner-occupied | Renter-occupied |
| Less than $300 | 10 (0.7%) | 0 (0.0%) |
| $300 to $499 | 95 (6.9%) | 0 (0.0%) |
| $500 to $799 | 75 (5.4%) | 13 (2.3%) |
| $800 to $999 | 114 (8.3%) | 4 (0.7%) |
| $1,000 to $1,499 | 119 (8.6%) | 113 (20.0%) |
| $1,500 to $1,999 | 132 (9.6%) | 100 (17.7%) |
| $2,000 to $2,499 | 232 (16.9%) | 130 (23.0%) |
| $2,500 to $2,999 | 70 (5.1%) | 32 (5.7%) |
| $3,000 or more | 529 (38.4%) | 114 (20.1%) |
| Total | 1,376 (100.0%) | 566 (100.0%) |
Physical Housing Characteristics in East Pasadena
Housing Structures in East Pasadena
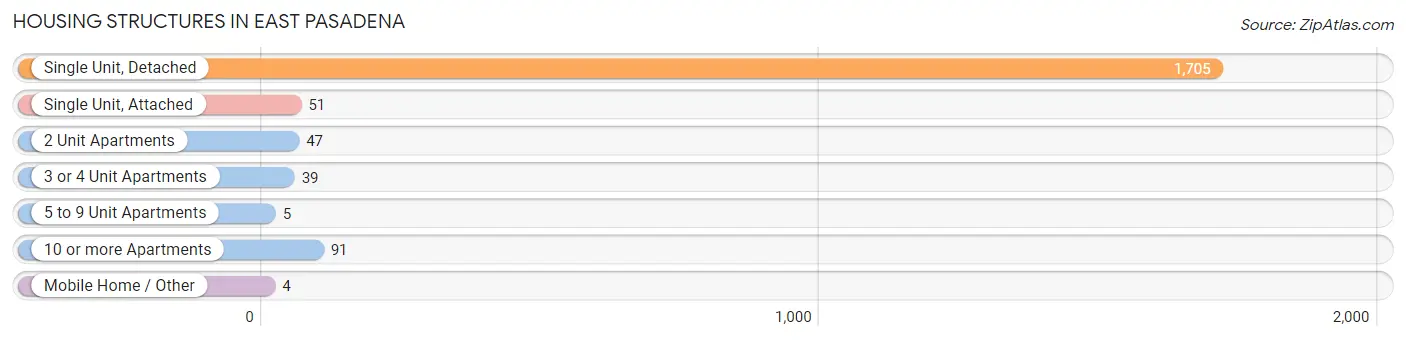
| Structure Type | # Housing Units | % Housing Units |
| Single Unit, Detached | 1,705 | 87.8% |
| Single Unit, Attached | 51 | 2.6% |
| 2 Unit Apartments | 47 | 2.4% |
| 3 or 4 Unit Apartments | 39 | 2.0% |
| 5 to 9 Unit Apartments | 5 | 0.3% |
| 10 or more Apartments | 91 | 4.7% |
| Mobile Home / Other | 4 | 0.2% |
| Total | 1,942 | 100.0% |
Housing Structures by Occupancy in East Pasadena
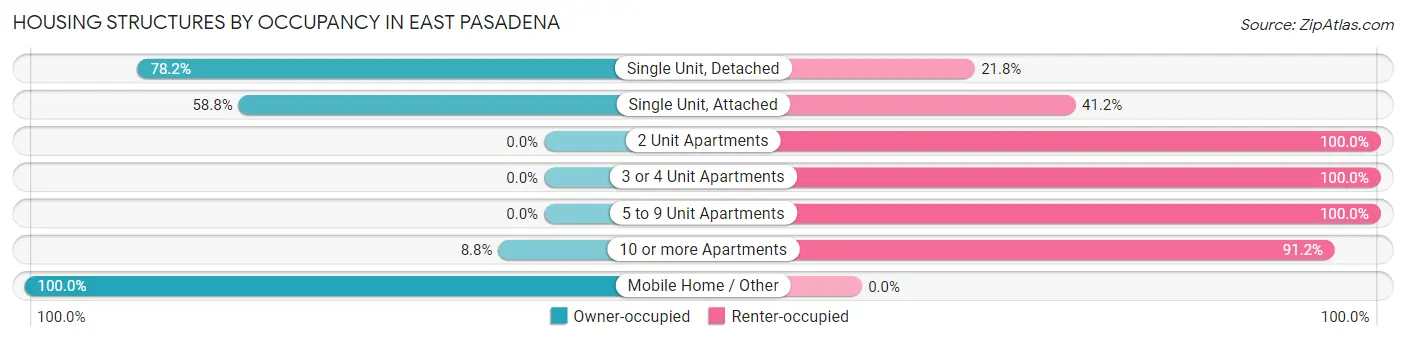
| Structure Type | Owner-occupied | Renter-occupied |
| Single Unit, Detached | 1,334 (78.2%) | 371 (21.8%) |
| Single Unit, Attached | 30 (58.8%) | 21 (41.2%) |
| 2 Unit Apartments | 0 (0.0%) | 47 (100.0%) |
| 3 or 4 Unit Apartments | 0 (0.0%) | 39 (100.0%) |
| 5 to 9 Unit Apartments | 0 (0.0%) | 5 (100.0%) |
| 10 or more Apartments | 8 (8.8%) | 83 (91.2%) |
| Mobile Home / Other | 4 (100.0%) | 0 (0.0%) |
| Total | 1,376 (70.9%) | 566 (29.1%) |
Housing Structures by Number of Rooms in East Pasadena
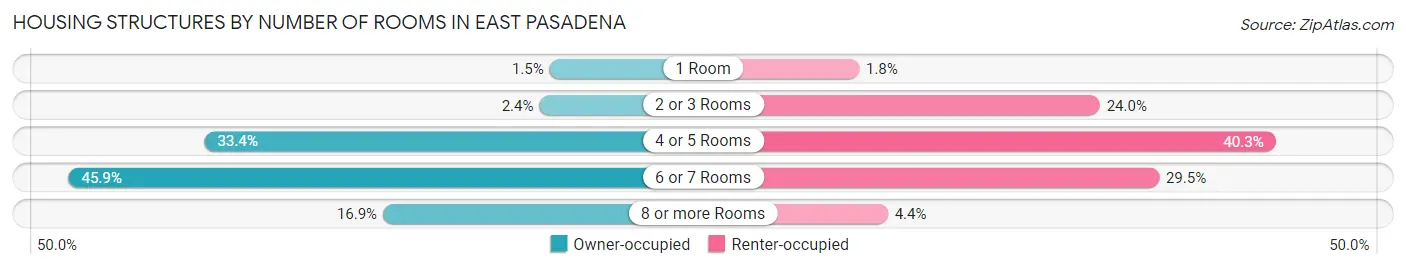
| Number of Rooms | Owner-occupied | Renter-occupied |
| 1 Room | 20 (1.5%) | 10 (1.8%) |
| 2 or 3 Rooms | 33 (2.4%) | 136 (24.0%) |
| 4 or 5 Rooms | 459 (33.4%) | 228 (40.3%) |
| 6 or 7 Rooms | 632 (45.9%) | 167 (29.5%) |
| 8 or more Rooms | 232 (16.9%) | 25 (4.4%) |
| Total | 1,376 (100.0%) | 566 (100.0%) |
Housing Structure by Heating Type in East Pasadena
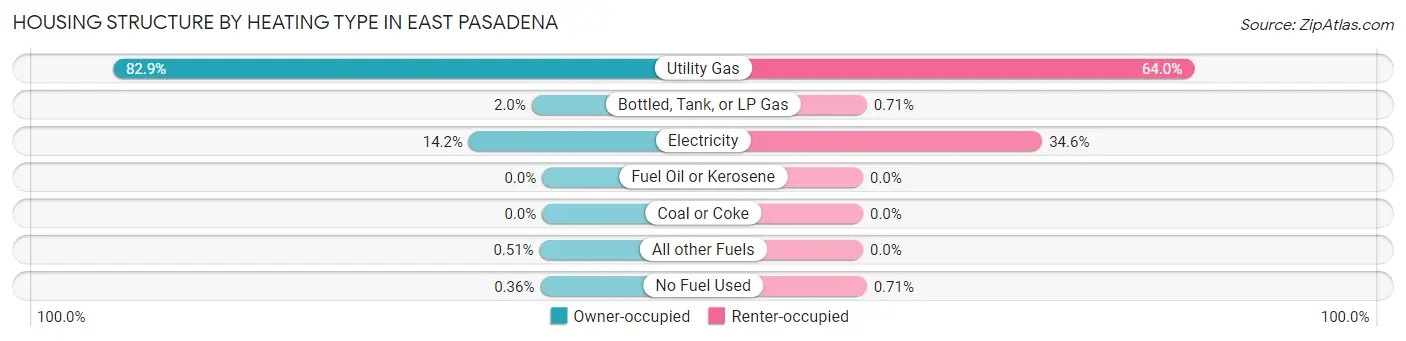
| Heating Type | Owner-occupied | Renter-occupied |
| Utility Gas | 1,141 (82.9%) | 362 (64.0%) |
| Bottled, Tank, or LP Gas | 28 (2.0%) | 4 (0.7%) |
| Electricity | 195 (14.2%) | 196 (34.6%) |
| Fuel Oil or Kerosene | 0 (0.0%) | 0 (0.0%) |
| Coal or Coke | 0 (0.0%) | 0 (0.0%) |
| All other Fuels | 7 (0.5%) | 0 (0.0%) |
| No Fuel Used | 5 (0.4%) | 4 (0.7%) |
| Total | 1,376 (100.0%) | 566 (100.0%) |
Household Vehicle Usage in East Pasadena
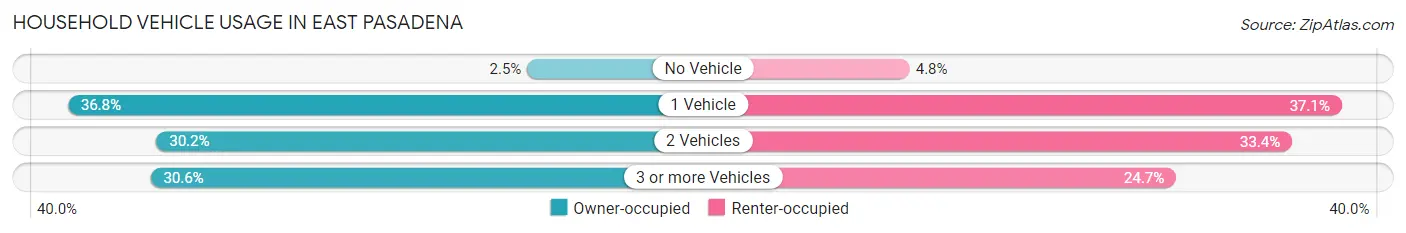
| Vehicles per Household | Owner-occupied | Renter-occupied |
| No Vehicle | 34 (2.5%) | 27 (4.8%) |
| 1 Vehicle | 506 (36.8%) | 210 (37.1%) |
| 2 Vehicles | 415 (30.2%) | 189 (33.4%) |
| 3 or more Vehicles | 421 (30.6%) | 140 (24.7%) |
| Total | 1,376 (100.0%) | 566 (100.0%) |
Real Estate & Mortgages in East Pasadena
Real Estate and Mortgage Overview in East Pasadena
| Characteristic | Without Mortgage | With Mortgage |
| Housing Units | 389 | 987 |
| Median Property Value | $907,600 | $977,800 |
| Median Household Income | $75,104 | $399 |
| Monthly Housing Costs | $839 | $529 |
| Real Estate Taxes | $5,711 | $0 |
Property Value by Mortgage Status in East Pasadena
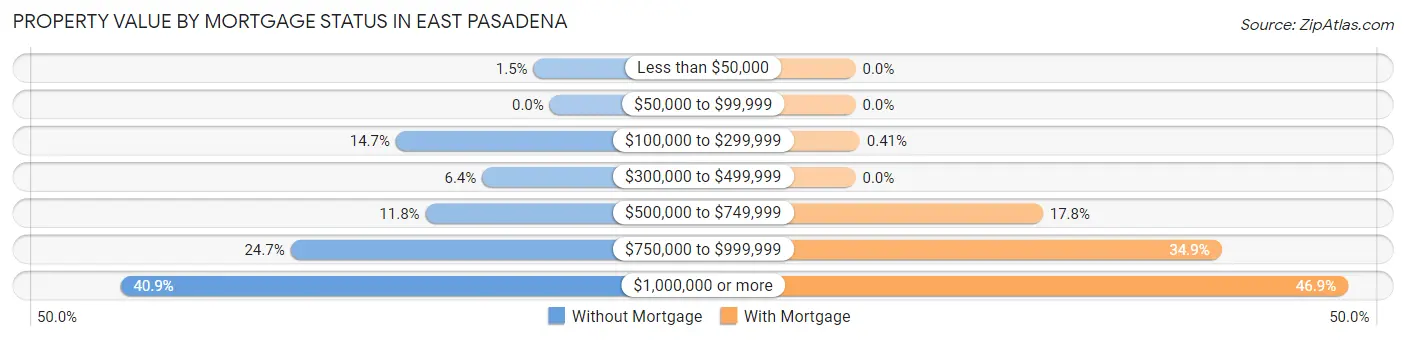
| Property Value | Without Mortgage | With Mortgage |
| Less than $50,000 | 6 (1.5%) | 0 (0.0%) |
| $50,000 to $99,999 | 0 (0.0%) | 0 (0.0%) |
| $100,000 to $299,999 | 57 (14.6%) | 4 (0.4%) |
| $300,000 to $499,999 | 25 (6.4%) | 0 (0.0%) |
| $500,000 to $749,999 | 46 (11.8%) | 176 (17.8%) |
| $750,000 to $999,999 | 96 (24.7%) | 344 (34.8%) |
| $1,000,000 or more | 159 (40.9%) | 463 (46.9%) |
| Total | 389 (100.0%) | 987 (100.0%) |
Household Income by Mortgage Status in East Pasadena
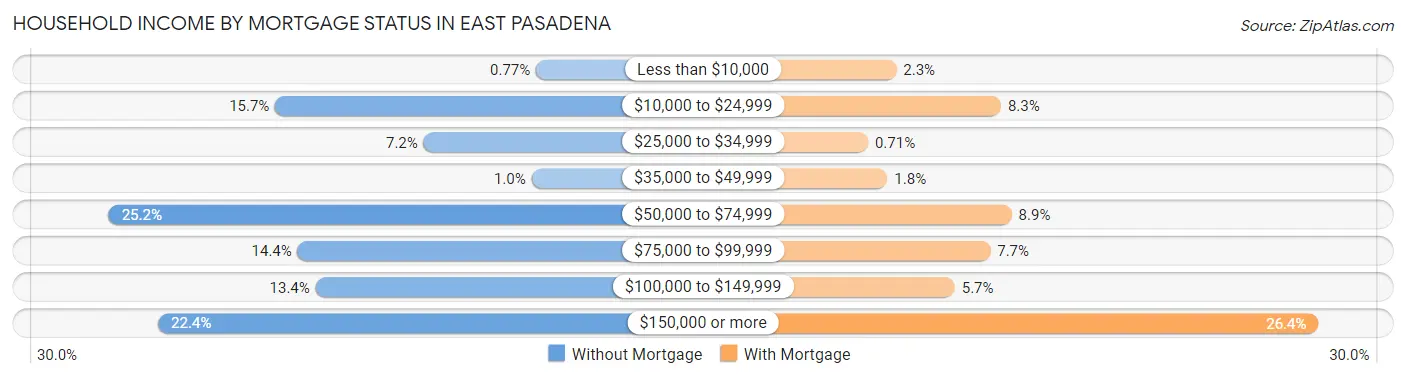
| Household Income | Without Mortgage | With Mortgage |
| Less than $10,000 | 3 (0.8%) | 23 (2.3%) |
| $10,000 to $24,999 | 61 (15.7%) | 82 (8.3%) |
| $25,000 to $34,999 | 28 (7.2%) | 7 (0.7%) |
| $35,000 to $49,999 | 4 (1.0%) | 18 (1.8%) |
| $50,000 to $74,999 | 98 (25.2%) | 88 (8.9%) |
| $75,000 to $99,999 | 56 (14.4%) | 76 (7.7%) |
| $100,000 to $149,999 | 52 (13.4%) | 56 (5.7%) |
| $150,000 or more | 87 (22.4%) | 261 (26.4%) |
| Total | 389 (100.0%) | 987 (100.0%) |
Property Value to Household Income Ratio in East Pasadena
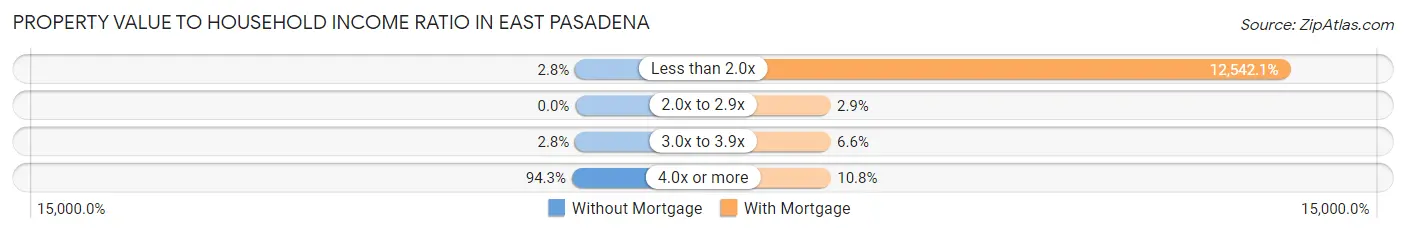
| Value-to-Income Ratio | Without Mortgage | With Mortgage |
| Less than 2.0x | 11 (2.8%) | 123,790 (12,542.1%) |
| 2.0x to 2.9x | 0 (0.0%) | 29 (2.9%) |
| 3.0x to 3.9x | 11 (2.8%) | 65 (6.6%) |
| 4.0x or more | 367 (94.3%) | 107 (10.8%) |
| Total | 389 (100.0%) | 987 (100.0%) |
Real Estate Taxes by Mortgage Status in East Pasadena
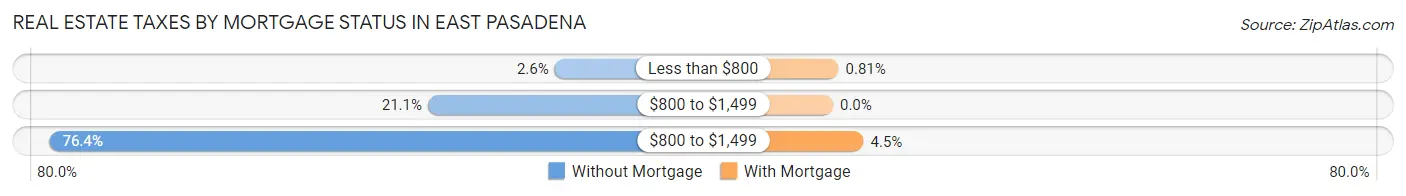
| Property Taxes | Without Mortgage | With Mortgage |
| Less than $800 | 10 (2.6%) | 8 (0.8%) |
| $800 to $1,499 | 82 (21.1%) | 0 (0.0%) |
| $800 to $1,499 | 297 (76.3%) | 44 (4.5%) |
| Total | 389 (100.0%) | 987 (100.0%) |
Health & Disability in East Pasadena
Health Insurance Coverage by Age in East Pasadena
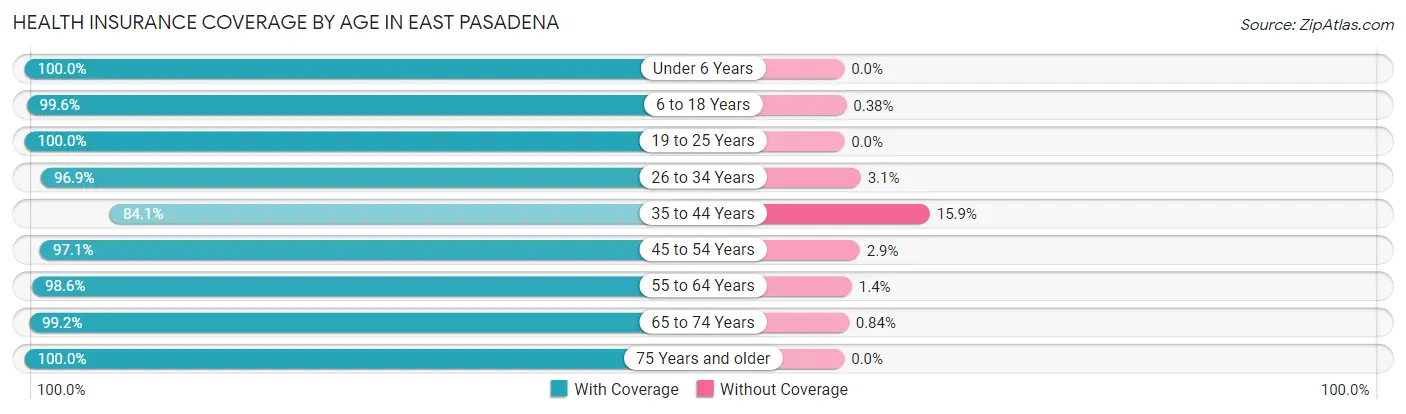
| Age Bracket | With Coverage | Without Coverage |
| Under 6 Years | 326 (100.0%) | 0 (0.0%) |
| 6 to 18 Years | 797 (99.6%) | 3 (0.4%) |
| 19 to 25 Years | 299 (100.0%) | 0 (0.0%) |
| 26 to 34 Years | 568 (96.9%) | 18 (3.1%) |
| 35 to 44 Years | 538 (84.1%) | 102 (15.9%) |
| 45 to 54 Years | 973 (97.1%) | 29 (2.9%) |
| 55 to 64 Years | 628 (98.6%) | 9 (1.4%) |
| 65 to 74 Years | 590 (99.2%) | 5 (0.8%) |
| 75 Years and older | 576 (100.0%) | 0 (0.0%) |
| Total | 5,295 (97.0%) | 166 (3.0%) |
Health Insurance Coverage by Citizenship Status in East Pasadena
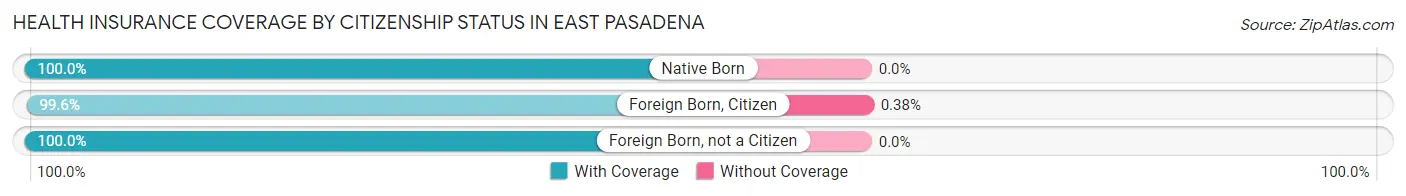
| Citizenship Status | With Coverage | Without Coverage |
| Native Born | 326 (100.0%) | 0 (0.0%) |
| Foreign Born, Citizen | 797 (99.6%) | 3 (0.4%) |
| Foreign Born, not a Citizen | 299 (100.0%) | 0 (0.0%) |
Health Insurance Coverage by Household Income in East Pasadena
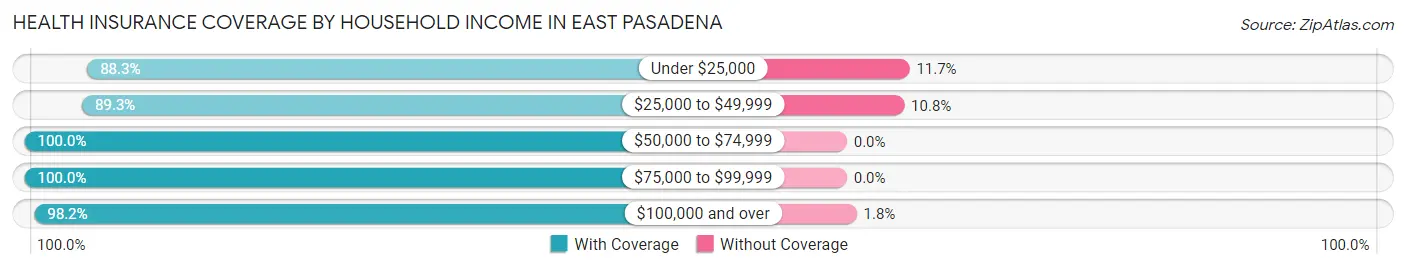
| Household Income | With Coverage | Without Coverage |
| Under $25,000 | 263 (88.3%) | 35 (11.7%) |
| $25,000 to $49,999 | 573 (89.2%) | 69 (10.7%) |
| $50,000 to $74,999 | 629 (100.0%) | 0 (0.0%) |
| $75,000 to $99,999 | 478 (100.0%) | 0 (0.0%) |
| $100,000 and over | 3,334 (98.2%) | 62 (1.8%) |
Public vs Private Health Insurance Coverage by Age in East Pasadena
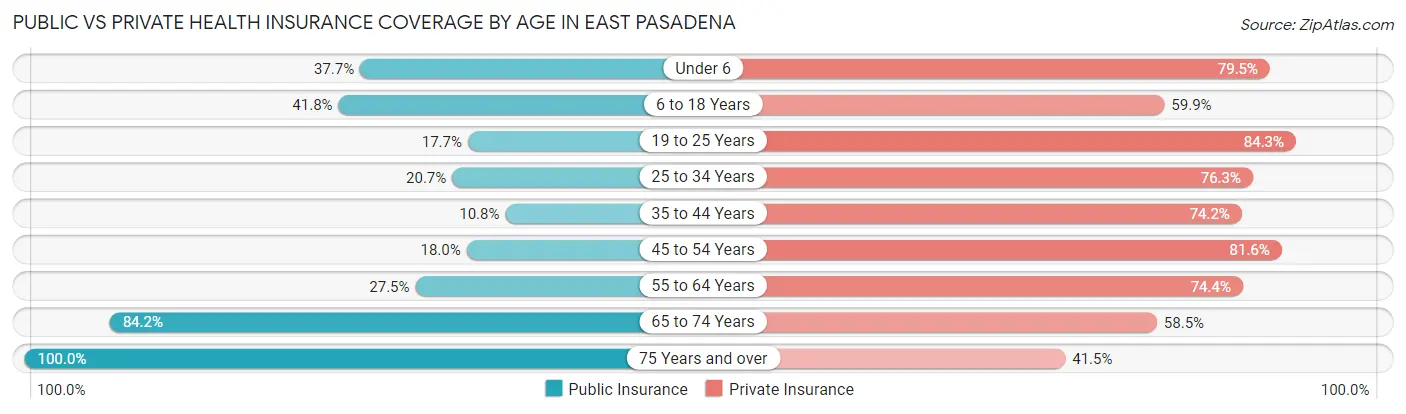
| Age Bracket | Public Insurance | Private Insurance |
| Under 6 | 123 (37.7%) | 259 (79.4%) |
| 6 to 18 Years | 334 (41.7%) | 479 (59.9%) |
| 19 to 25 Years | 53 (17.7%) | 252 (84.3%) |
| 25 to 34 Years | 121 (20.6%) | 447 (76.3%) |
| 35 to 44 Years | 69 (10.8%) | 475 (74.2%) |
| 45 to 54 Years | 180 (18.0%) | 818 (81.6%) |
| 55 to 64 Years | 175 (27.5%) | 474 (74.4%) |
| 65 to 74 Years | 501 (84.2%) | 348 (58.5%) |
| 75 Years and over | 576 (100.0%) | 239 (41.5%) |
| Total | 2,132 (39.0%) | 3,791 (69.4%) |
Disability Status by Sex by Age in East Pasadena
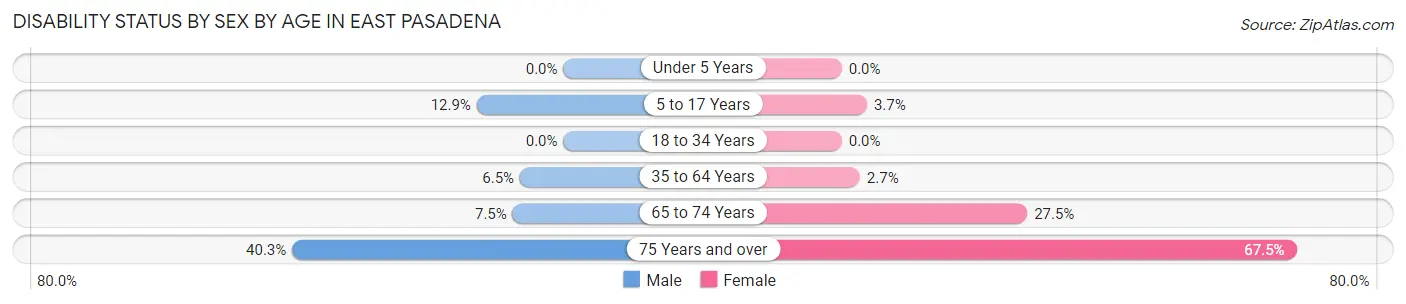
| Age Bracket | Male | Female |
| Under 5 Years | 0 (0.0%) | 0 (0.0%) |
| 5 to 17 Years | 57 (12.9%) | 12 (3.7%) |
| 18 to 34 Years | 0 (0.0%) | 0 (0.0%) |
| 35 to 64 Years | 75 (6.5%) | 30 (2.7%) |
| 65 to 74 Years | 21 (7.5%) | 87 (27.5%) |
| 75 Years and over | 87 (40.3%) | 243 (67.5%) |
Disability Class by Sex by Age in East Pasadena
Disability Class: Hearing Difficulty
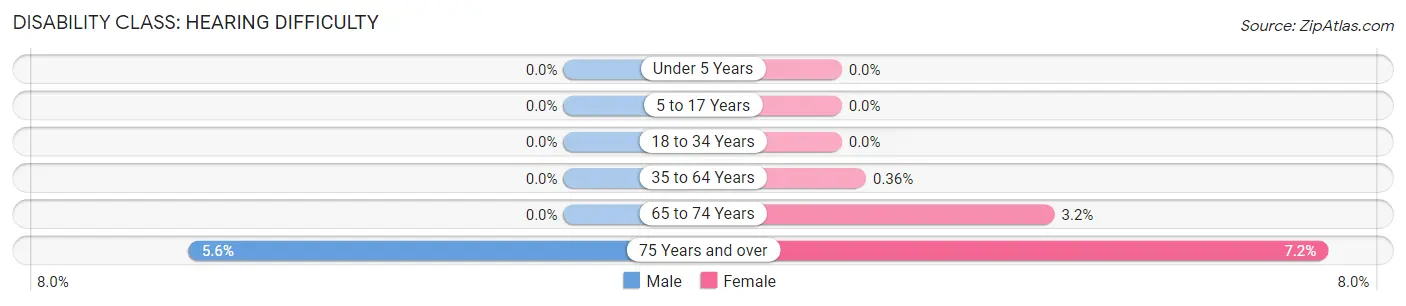
| Age Bracket | Male | Female |
| Under 5 Years | 0 (0.0%) | 0 (0.0%) |
| 5 to 17 Years | 0 (0.0%) | 0 (0.0%) |
| 18 to 34 Years | 0 (0.0%) | 0 (0.0%) |
| 35 to 64 Years | 0 (0.0%) | 4 (0.4%) |
| 65 to 74 Years | 0 (0.0%) | 10 (3.2%) |
| 75 Years and over | 12 (5.6%) | 26 (7.2%) |
Disability Class: Vision Difficulty
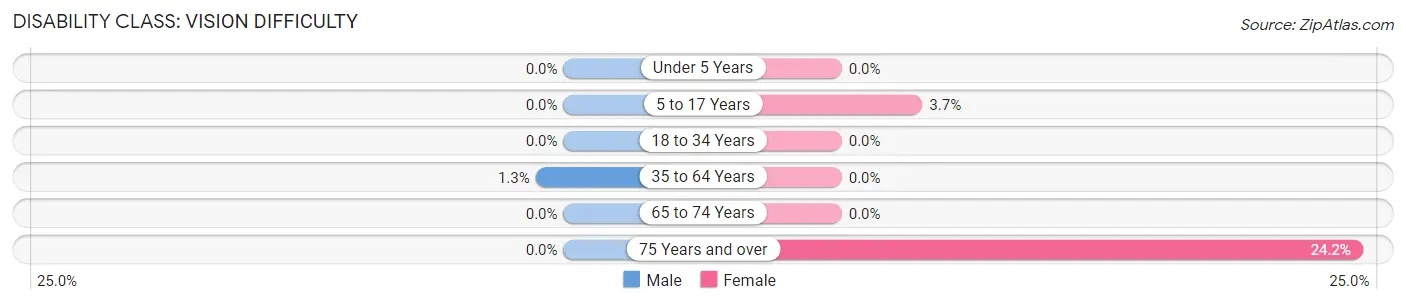
| Age Bracket | Male | Female |
| Under 5 Years | 0 (0.0%) | 0 (0.0%) |
| 5 to 17 Years | 0 (0.0%) | 12 (3.7%) |
| 18 to 34 Years | 0 (0.0%) | 0 (0.0%) |
| 35 to 64 Years | 15 (1.3%) | 0 (0.0%) |
| 65 to 74 Years | 0 (0.0%) | 0 (0.0%) |
| 75 Years and over | 0 (0.0%) | 87 (24.2%) |
Disability Class: Cognitive Difficulty
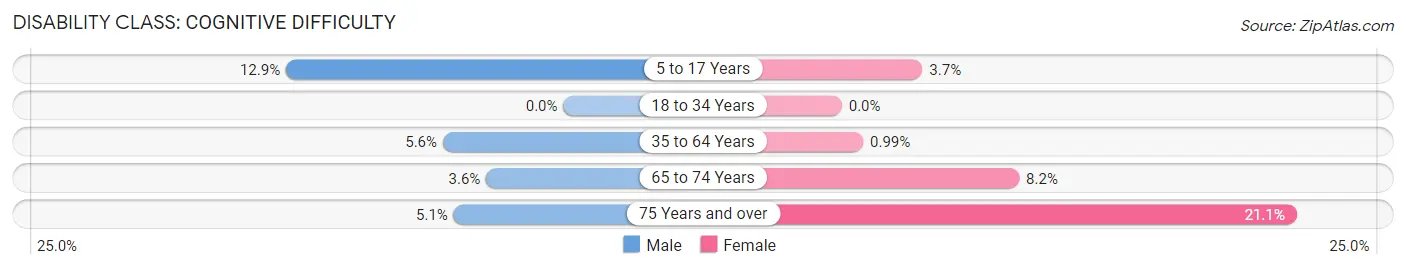
| Age Bracket | Male | Female |
| 5 to 17 Years | 57 (12.9%) | 12 (3.7%) |
| 18 to 34 Years | 0 (0.0%) | 0 (0.0%) |
| 35 to 64 Years | 65 (5.6%) | 11 (1.0%) |
| 65 to 74 Years | 10 (3.6%) | 26 (8.2%) |
| 75 Years and over | 11 (5.1%) | 76 (21.1%) |
Disability Class: Ambulatory Difficulty
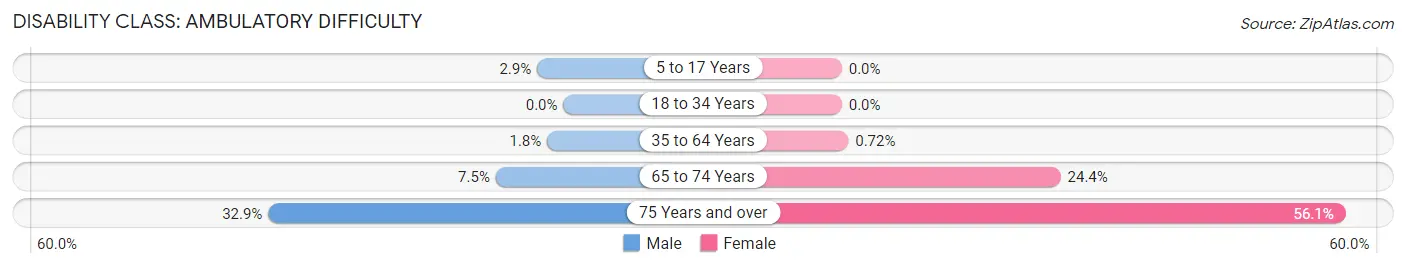
| Age Bracket | Male | Female |
| 5 to 17 Years | 13 (2.9%) | 0 (0.0%) |
| 18 to 34 Years | 0 (0.0%) | 0 (0.0%) |
| 35 to 64 Years | 21 (1.8%) | 8 (0.7%) |
| 65 to 74 Years | 21 (7.5%) | 77 (24.4%) |
| 75 Years and over | 71 (32.9%) | 202 (56.1%) |
Disability Class: Self-Care Difficulty
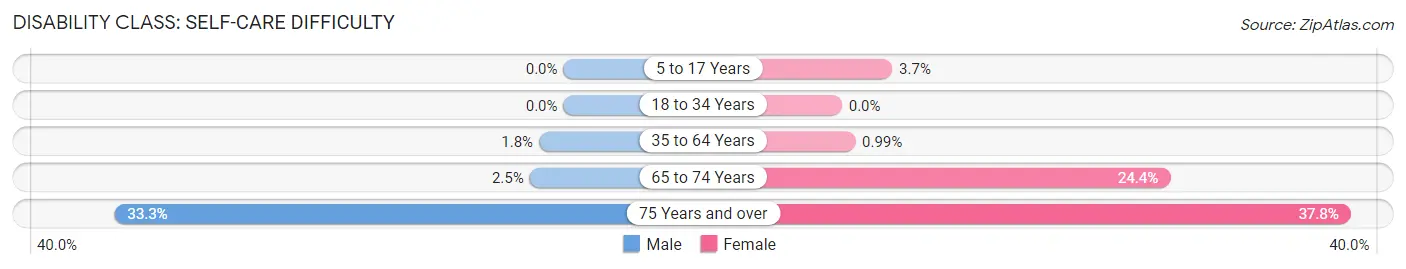
| Age Bracket | Male | Female |
| 5 to 17 Years | 0 (0.0%) | 12 (3.7%) |
| 18 to 34 Years | 0 (0.0%) | 0 (0.0%) |
| 35 to 64 Years | 21 (1.8%) | 11 (1.0%) |
| 65 to 74 Years | 7 (2.5%) | 77 (24.4%) |
| 75 Years and over | 72 (33.3%) | 136 (37.8%) |
Technology Access in East Pasadena
Computing Device Access in East Pasadena
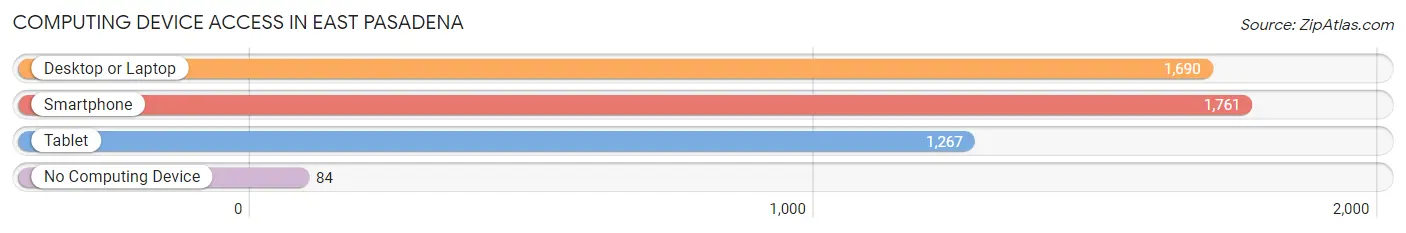
| Device Type | # Households | % Households |
| Desktop or Laptop | 1,690 | 87.0% |
| Smartphone | 1,761 | 90.7% |
| Tablet | 1,267 | 65.2% |
| No Computing Device | 84 | 4.3% |
| Total | 1,942 | 100.0% |
Internet Access in East Pasadena
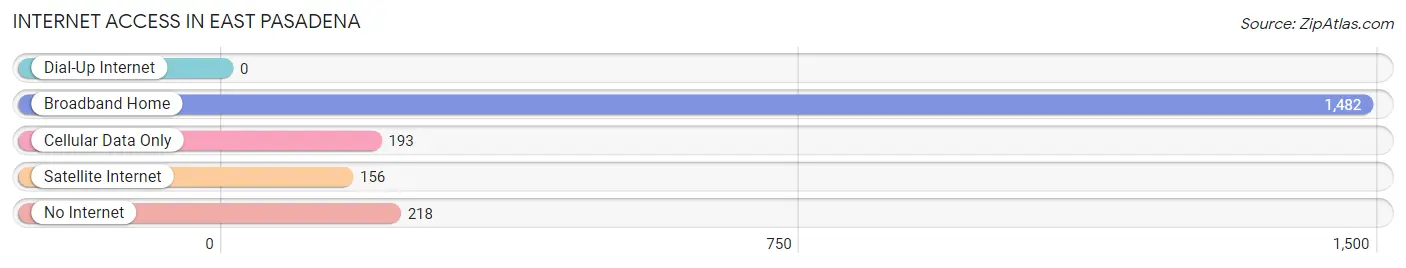
| Internet Type | # Households | % Households |
| Dial-Up Internet | 0 | 0.0% |
| Broadband Home | 1,482 | 76.3% |
| Cellular Data Only | 193 | 9.9% |
| Satellite Internet | 156 | 8.0% |
| No Internet | 218 | 11.2% |
| Total | 1,942 | 100.0% |
East Pasadena Summary
Pasadena is a city located in Los Angeles County, California, United States. It is located 11 miles northeast of downtown Los Angeles and is part of the San Gabriel Valley. The city is known for its history, culture, and architecture, and is home to the Rose Bowl, the annual Tournament of Roses Parade, and the California Institute of Technology. East Pasadena is a neighborhood located in the eastern part of the city of Pasadena, California. It is bordered by the San Gabriel Mountains to the north, the Arroyo Seco to the east, and the cities of South Pasadena and San Marino to the south and west, respectively.
History
The area now known as East Pasadena was originally inhabited by the Tongva people, who were later displaced by Spanish settlers in the late 18th century. The area was part of the Rancho San Pasqual, which was granted to the Lugo family in 1839. In 1874, the area was subdivided and sold to developers, who built the first homes in the area. The area was annexed by the city of Pasadena in 1895.
In the early 20th century, East Pasadena was a rural area with many farms and orchards. The area was also home to the East Pasadena Race Track, which opened in 1906 and closed in 1911. The area began to develop rapidly in the 1950s and 1960s, with the construction of many new homes and businesses.
Geography
East Pasadena is located in the eastern part of the city of Pasadena, California. It is bordered by the San Gabriel Mountains to the north, the Arroyo Seco to the east, and the cities of South Pasadena and San Marino to the south and west, respectively. The area is approximately 4.5 square miles in size and has a population of approximately 25,000 people.
The area is characterized by its hilly terrain and is home to several parks, including the Arroyo Seco Park, the East Pasadena Community Park, and the East Pasadena Recreation Center. The area is also home to several schools, including the East Pasadena Elementary School, the East Pasadena Middle School, and the East Pasadena High School.
Economy
East Pasadena is home to a variety of businesses, including retail stores, restaurants, and professional services. The area is also home to several industrial and manufacturing businesses, including the East Pasadena Industrial Park. The area is also home to several medical facilities, including the Huntington Memorial Hospital and the East Pasadena Medical Center.
Demographics
As of the 2010 census, East Pasadena had a population of 25,000 people. The racial makeup of the area was 57.3% White, 16.2% Asian, 15.2% Hispanic or Latino, 8.2% African American, and 3.1% other. The median household income was $60,000, and the median home value was $637,000.
East Pasadena is a diverse and vibrant community with a rich history and culture. The area is home to a variety of businesses, schools, and parks, and is a great place to live, work, and play.
Common Questions
What is Per Capita Income in East Pasadena?
Per Capita income in East Pasadena is $52,018.
What is the Median Family Income in East Pasadena?
Median Family Income in East Pasadena is $116,591.
What is the Median Household income in East Pasadena?
Median Household Income in East Pasadena is $100,985.
What is Income or Wage Gap in East Pasadena?
Income or Wage Gap in East Pasadena is 8.4%.
Women in East Pasadena earn 91.6 cents for every dollar earned by a man.
What is Family Income Deficit in East Pasadena?
Family Income Deficit in East Pasadena is $9,331.
Families that are below poverty line in East Pasadena earn $9,331 less on average than the poverty threshold level.
What is Inequality or Gini Index in East Pasadena?
Inequality or Gini Index in East Pasadena is 0.49.
What is the Total Population of East Pasadena?
Total Population of East Pasadena is 5,474.
What is the Total Male Population of East Pasadena?
Total Male Population of East Pasadena is 2,738.
What is the Total Female Population of East Pasadena?
Total Female Population of East Pasadena is 2,736.
What is the Ratio of Males per 100 Females in East Pasadena?
There are 100.07 Males per 100 Females in East Pasadena.
What is the Ratio of Females per 100 Males in East Pasadena?
There are 99.93 Females per 100 Males in East Pasadena.
What is the Median Population Age in East Pasadena?
Median Population Age in East Pasadena is 45.5 Years.
What is the Average Family Size in East Pasadena
Average Family Size in East Pasadena is 3.5 People.
What is the Average Household Size in East Pasadena
Average Household Size in East Pasadena is 2.8 People.
How Large is the Labor Force in East Pasadena?
There are 2,720 People in the Labor Forcein in East Pasadena.
What is the Percentage of People in the Labor Force in East Pasadena?
60.6% of People are in the Labor Force in East Pasadena.
What is the Unemployment Rate in East Pasadena?
Unemployment Rate in East Pasadena is 2.2%.