Cities with the Highest Percentage of Subsaharan African Population in Connecticut
RELATED REPORTS & OPTIONS
Subsaharan African
Connecticut
Compare Cities
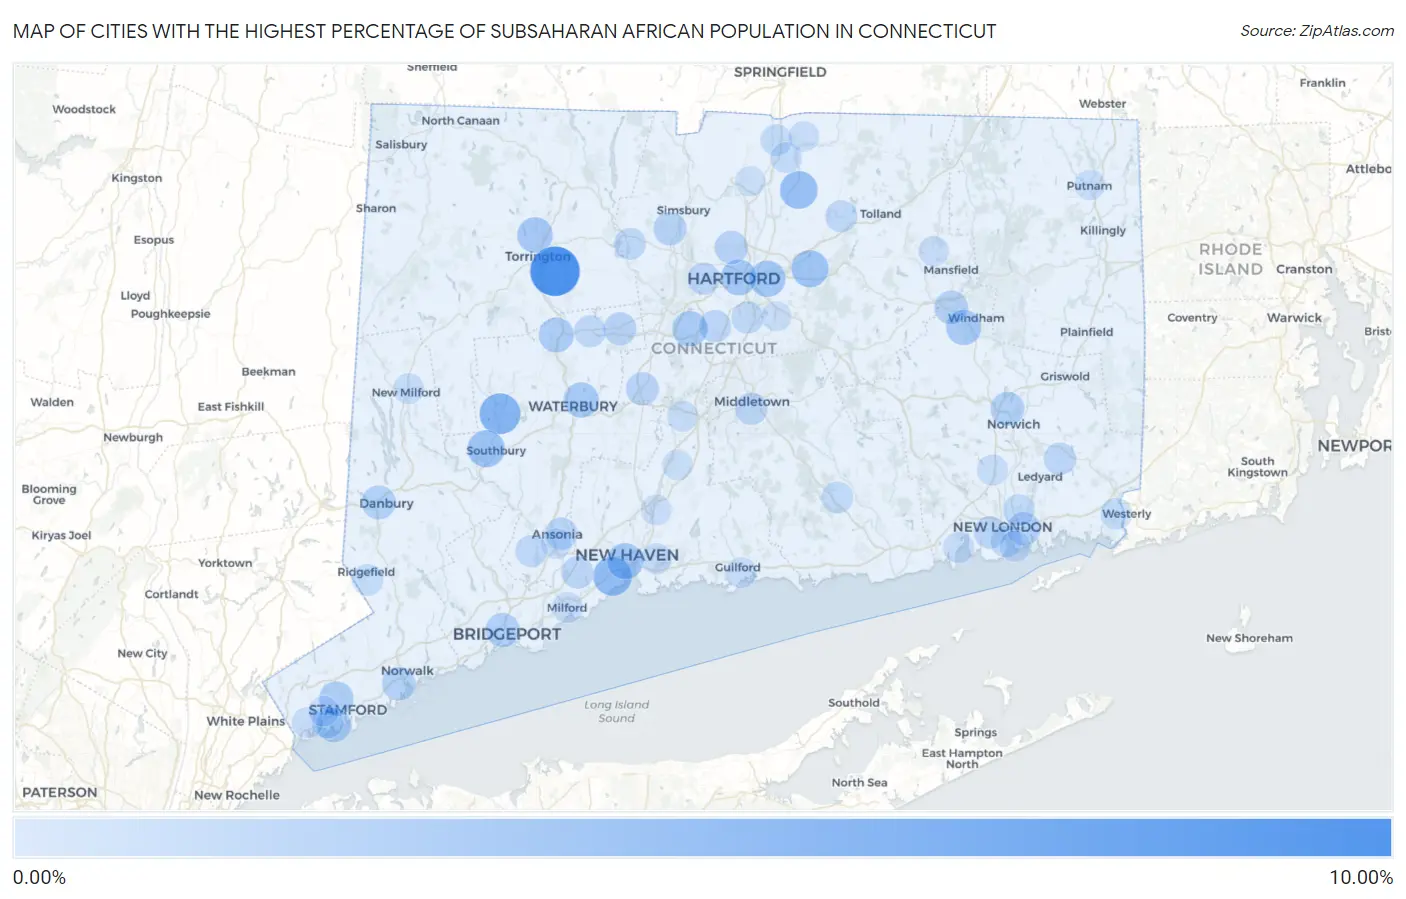
Map of Cities with the Highest Percentage of Subsaharan African Population in Connecticut
0.00%
10.00%
Cities with the Highest Percentage of Subsaharan African Population in Connecticut
| City | Subsaharan African | vs State | vs National | |
| 1. | Northwest Harwinton | 8.59% | 1.15%(+7.44)#1 | 1.22%(+7.37)#270 |
| 2. | Woodbury Center | 4.64% | 1.15%(+3.48)#2 | 1.22%(+3.42)#712 |
| 3. | West Haven | 3.76% | 1.15%(+2.61)#3 | 1.22%(+2.55)#936 |
| 4. | Compo | 3.46% | 1.15%(+2.31)#4 | 1.22%(+2.25)#1,031 |
| 5. | Broad Brook | 3.27% | 1.15%(+2.12)#5 | 1.22%(+2.05)#1,105 |
| 6. | Heritage Village | 2.99% | 1.15%(+1.84)#6 | 1.22%(+1.78)#1,248 |
| 7. | Naugatuck Borough | 2.95% | 1.15%(+1.80)#7 | 1.22%(+1.74)#1,269 |
| 8. | Manchester | 2.92% | 1.15%(+1.77)#8 | 1.22%(+1.70)#1,284 |
| 9. | New Haven | 2.58% | 1.15%(+1.43)#9 | 1.22%(+1.36)#1,471 |
| 10. | East Hartford | 2.56% | 1.15%(+1.41)#10 | 1.22%(+1.34)#1,484 |
| 11. | Hartford | 2.43% | 1.15%(+1.28)#11 | 1.22%(+1.21)#1,570 |
| 12. | Torrington | 2.34% | 1.15%(+1.19)#12 | 1.22%(+1.13)#1,637 |
| 13. | New Britain | 2.18% | 1.15%(+1.03)#13 | 1.22%(+0.962)#1,790 |
| 14. | Waterbury | 2.17% | 1.15%(+1.02)#14 | 1.22%(+0.959)#1,796 |
| 15. | South Windham | 2.12% | 1.15%(+0.972)#15 | 1.22%(+0.910)#1,843 |
| 16. | Thomaston | 2.11% | 1.15%(+0.956)#16 | 1.22%(+0.893)#1,864 |
| 17. | Trumbull Center | 1.89% | 1.15%(+0.734)#17 | 1.22%(+0.672)#2,097 |
| 18. | Stamford | 1.88% | 1.15%(+0.727)#18 | 1.22%(+0.664)#2,102 |
| 19. | Quinnipiac University | 1.83% | 1.15%(+0.675)#19 | 1.22%(+0.612)#2,182 |
| 20. | Old Greenwich | 1.77% | 1.15%(+0.618)#20 | 1.22%(+0.555)#2,253 |
| 21. | Bridgeport | 1.68% | 1.15%(+0.527)#21 | 1.22%(+0.464)#2,384 |
| 22. | Danbury | 1.63% | 1.15%(+0.474)#22 | 1.22%(+0.411)#2,467 |
| 23. | Norwich | 1.55% | 1.15%(+0.395)#23 | 1.22%(+0.333)#2,576 |
| 24. | Willimantic | 1.48% | 1.15%(+0.328)#24 | 1.22%(+0.266)#2,686 |
| 25. | Norwalk | 1.42% | 1.15%(+0.263)#25 | 1.22%(+0.201)#2,835 |
| 26. | Long Hill | 1.35% | 1.15%(+0.197)#26 | 1.22%(+0.134)#2,958 |
| 27. | Blue Hills | 1.35% | 1.15%(+0.196)#27 | 1.22%(+0.134)#2,961 |
| 28. | Weatogue | 1.31% | 1.15%(+0.158)#28 | 1.22%(+0.095)#3,032 |
| 29. | Litchfield Borough | 1.25% | 1.15%(+0.102)#29 | 1.22%(+0.040)#3,145 |
| 30. | Plantsville | 1.25% | 1.15%(+0.095)#30 | 1.22%(+0.032)#3,162 |
| 31. | Bristol | 1.22% | 1.15%(+0.066)#31 | 1.22%(+0.004)#3,215 |
| 32. | Stratford Downtown | 1.13% | 1.15%(-0.024)#32 | 1.22%(-0.086)#3,415 |
| 33. | Greens Farms | 1.11% | 1.15%(-0.038)#33 | 1.22%(-0.100)#3,445 |
| 34. | Ansonia | 0.98% | 1.15%(-0.176)#34 | 1.22%(-0.239)#3,792 |
| 35. | Mashantucket | 0.96% | 1.15%(-0.191)#35 | 1.22%(-0.254)#3,826 |
| 36. | Middletown | 0.95% | 1.15%(-0.203)#36 | 1.22%(-0.266)#3,867 |
| 37. | Orange | 0.93% | 1.15%(-0.225)#37 | 1.22%(-0.288)#3,947 |
| 38. | Waterford | 0.92% | 1.15%(-0.237)#38 | 1.22%(-0.299)#3,983 |
| 39. | Newington | 0.90% | 1.15%(-0.253)#39 | 1.22%(-0.316)#4,034 |
| 40. | West Hartford | 0.85% | 1.15%(-0.302)#40 | 1.22%(-0.365)#4,187 |
| 41. | Rockville | 0.82% | 1.15%(-0.332)#41 | 1.22%(-0.395)#4,301 |
| 42. | Wethersfield | 0.80% | 1.15%(-0.351)#42 | 1.22%(-0.413)#4,367 |
| 43. | Terryville | 0.80% | 1.15%(-0.352)#43 | 1.22%(-0.415)#4,369 |
| 44. | Fairfield University | 0.76% | 1.15%(-0.395)#44 | 1.22%(-0.458)#4,532 |
| 45. | New London | 0.73% | 1.15%(-0.420)#45 | 1.22%(-0.483)#4,616 |
| 46. | Tashua | 0.71% | 1.15%(-0.447)#46 | 1.22%(-0.510)#4,715 |
| 47. | Collinsville | 0.69% | 1.15%(-0.459)#47 | 1.22%(-0.522)#4,758 |
| 48. | Shelton | 0.69% | 1.15%(-0.461)#48 | 1.22%(-0.523)#4,770 |
| 49. | Oronoque | 0.66% | 1.15%(-0.488)#49 | 1.22%(-0.551)#4,907 |
| 50. | Sandy Hook | 0.65% | 1.15%(-0.507)#50 | 1.22%(-0.570)#4,999 |
| 51. | Chester Center | 0.64% | 1.15%(-0.516)#51 | 1.22%(-0.579)#5,044 |
| 52. | Riverside | 0.63% | 1.15%(-0.526)#52 | 1.22%(-0.588)#5,083 |
| 53. | Pawcatuck | 0.59% | 1.15%(-0.560)#53 | 1.22%(-0.623)#5,227 |
| 54. | Conning Towers Nautilus Park | 0.58% | 1.15%(-0.576)#54 | 1.22%(-0.639)#5,302 |
| 55. | Noroton | 0.57% | 1.15%(-0.582)#55 | 1.22%(-0.644)#5,328 |
| 56. | Sacred Heart University | 0.55% | 1.15%(-0.601)#56 | 1.22%(-0.663)#5,426 |
| 57. | Ridgefield | 0.54% | 1.15%(-0.617)#57 | 1.22%(-0.680)#5,504 |
| 58. | Thompsonville | 0.52% | 1.15%(-0.634)#58 | 1.22%(-0.696)#5,591 |
| 59. | Ridgebury | 0.50% | 1.15%(-0.649)#59 | 1.22%(-0.712)#5,680 |
| 60. | Southwood Acres | 0.43% | 1.15%(-0.724)#60 | 1.22%(-0.786)#6,114 |
| 61. | Tokeneke | 0.43% | 1.15%(-0.725)#61 | 1.22%(-0.788)#6,123 |
| 62. | Stonington Borough | 0.42% | 1.15%(-0.728)#62 | 1.22%(-0.790)#6,135 |
| 63. | Niantic | 0.37% | 1.15%(-0.781)#63 | 1.22%(-0.843)#6,476 |
| 64. | Oxoboxo River | 0.37% | 1.15%(-0.782)#64 | 1.22%(-0.845)#6,484 |
| 65. | Groton | 0.36% | 1.15%(-0.789)#65 | 1.22%(-0.852)#6,529 |
| 66. | Greenwich | 0.34% | 1.15%(-0.811)#66 | 1.22%(-0.873)#6,686 |
| 67. | Milford City Balance | 0.30% | 1.15%(-0.850)#67 | 1.22%(-0.913)#6,940 |
| 68. | East Haven | 0.29% | 1.15%(-0.865)#68 | 1.22%(-0.928)#7,045 |
| 69. | Meriden | 0.27% | 1.15%(-0.883)#69 | 1.22%(-0.946)#7,195 |
| 70. | New Milford | 0.27% | 1.15%(-0.885)#70 | 1.22%(-0.947)#7,211 |
| 71. | Saugatuck | 0.27% | 1.15%(-0.886)#71 | 1.22%(-0.948)#7,219 |
| 72. | North Haven | 0.24% | 1.15%(-0.913)#72 | 1.22%(-0.975)#7,431 |
| 73. | Guilford Center | 0.24% | 1.15%(-0.916)#73 | 1.22%(-0.979)#7,469 |
| 74. | Wallingford Center | 0.23% | 1.15%(-0.918)#74 | 1.22%(-0.980)#7,478 |
| 75. | Putnam | 0.19% | 1.15%(-0.958)#75 | 1.22%(-1.02)#7,833 |
| 76. | Hazardville | 0.18% | 1.15%(-0.973)#76 | 1.22%(-1.04)#7,959 |
| 77. | Cos Cob | 0.17% | 1.15%(-0.987)#77 | 1.22%(-1.05)#8,076 |
| 78. | Derby | 0.14% | 1.15%(-1.02)#78 | 1.22%(-1.08)#8,303 |
| 79. | Storrs | 0.14% | 1.15%(-1.02)#79 | 1.22%(-1.08)#8,309 |
| 80. | Daniels Farm | 0.12% | 1.15%(-1.04)#80 | 1.22%(-1.10)#8,497 |
| 81. | Windsor Locks | 0.088% | 1.15%(-1.06)#81 | 1.22%(-1.13)#8,741 |
| 82. | Lordship | 0.078% | 1.15%(-1.07)#82 | 1.22%(-1.14)#8,823 |
| 83. | Glastonbury Center | 0.050% | 1.15%(-1.10)#83 | 1.22%(-1.16)#9,028 |
Common Questions
What are the Top 10 Cities with the Highest Percentage of Subsaharan African Population in Connecticut?
Top 10 Cities with the Highest Percentage of Subsaharan African Population in Connecticut are:
#1
8.59%
#2
4.64%
#3
3.76%
#4
3.27%
#5
2.99%
#6
2.92%
#7
2.58%
#8
2.56%
#9
2.43%
#10
2.34%
What city has the Highest Percentage of Subsaharan African Population in Connecticut?
Northwest Harwinton has the Highest Percentage of Subsaharan African Population in Connecticut with 8.59%.
What is the Percentage of Subsaharan African Population in the State of Connecticut?
Percentage of Subsaharan African Population in Connecticut is 1.15%.
What is the Percentage of Subsaharan African Population in the United States?
Percentage of Subsaharan African Population in the United States is 1.22%.