Cities with the Highest Percentage of Subsaharan African Population in Michigan
RELATED REPORTS & OPTIONS
Subsaharan African
Michigan
Compare Cities
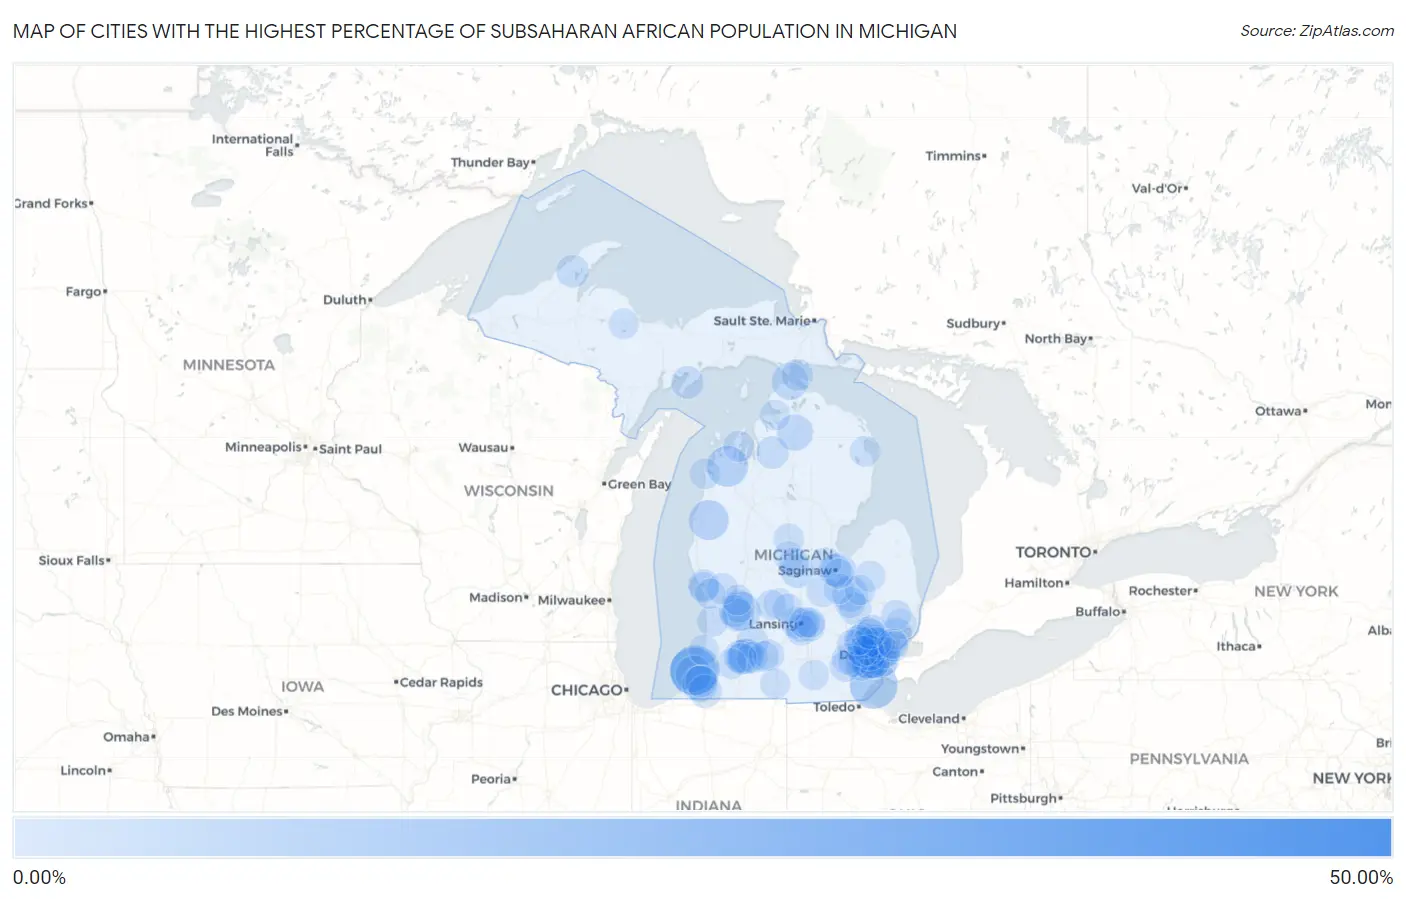
Map of Cities with the Highest Percentage of Subsaharan African Population in Michigan
0.00%
50.00%
Cities with the Highest Percentage of Subsaharan African Population in Michigan
| City | Subsaharan African | vs State | vs National | |
| 1. | Scotts | 49.45% | 0.82%(+48.6)#1 | 1.22%(+48.2)#9 |
| 2. | Benton Heights | 13.29% | 0.82%(+12.5)#2 | 1.22%(+12.1)#124 |
| 3. | Benton Harbor | 12.30% | 0.82%(+11.5)#3 | 1.22%(+11.1)#134 |
| 4. | Stony Point | 12.00% | 0.82%(+11.2)#4 | 1.22%(+10.8)#141 |
| 5. | Inkster | 8.42% | 0.82%(+7.59)#5 | 1.22%(+7.20)#280 |
| 6. | Lake Ann | 7.80% | 0.82%(+6.98)#6 | 1.22%(+6.59)#326 |
| 7. | Fountain | 7.01% | 0.82%(+6.19)#7 | 1.22%(+5.79)#386 |
| 8. | Wayne | 6.71% | 0.82%(+5.89)#8 | 1.22%(+5.50)#406 |
| 9. | Kentwood | 6.16% | 0.82%(+5.34)#9 | 1.22%(+4.94)#461 |
| 10. | Mackinaw City | 5.19% | 0.82%(+4.37)#10 | 1.22%(+3.98)#603 |
| 11. | Fair Plain | 4.84% | 0.82%(+4.02)#11 | 1.22%(+3.62)#669 |
| 12. | Vanderbilt | 4.65% | 0.82%(+3.82)#12 | 1.22%(+3.43)#708 |
| 13. | Berrien Springs | 4.45% | 0.82%(+3.63)#13 | 1.22%(+3.24)#750 |
| 14. | Westland | 4.44% | 0.82%(+3.62)#14 | 1.22%(+3.23)#751 |
| 15. | Highland Park | 4.36% | 0.82%(+3.54)#15 | 1.22%(+3.15)#768 |
| 16. | Orchard Lake Village | 4.31% | 0.82%(+3.49)#16 | 1.22%(+3.10)#781 |
| 17. | Mount Morris | 4.29% | 0.82%(+3.47)#17 | 1.22%(+3.07)#788 |
| 18. | Comstock Northwest | 4.15% | 0.82%(+3.33)#18 | 1.22%(+2.94)#822 |
| 19. | Buena Vista | 3.58% | 0.82%(+2.75)#19 | 1.22%(+2.36)#999 |
| 20. | River Rouge | 3.39% | 0.82%(+2.57)#20 | 1.22%(+2.17)#1,053 |
| 21. | Eastwood | 3.39% | 0.82%(+2.56)#21 | 1.22%(+2.17)#1,054 |
| 22. | Romulus | 3.20% | 0.82%(+2.38)#22 | 1.22%(+1.99)#1,144 |
| 23. | St Louis | 3.00% | 0.82%(+2.18)#23 | 1.22%(+1.79)#1,243 |
| 24. | Southfield | 2.76% | 0.82%(+1.94)#24 | 1.22%(+1.55)#1,368 |
| 25. | Lansing | 2.75% | 0.82%(+1.92)#25 | 1.22%(+1.53)#1,375 |
| 26. | Niles | 2.71% | 0.82%(+1.89)#26 | 1.22%(+1.50)#1,393 |
| 27. | Cutlerville | 2.63% | 0.82%(+1.81)#27 | 1.22%(+1.41)#1,441 |
| 28. | Ecorse | 2.52% | 0.82%(+1.69)#28 | 1.22%(+1.30)#1,509 |
| 29. | Grand Rapids | 2.41% | 0.82%(+1.59)#29 | 1.22%(+1.20)#1,579 |
| 30. | Garden | 2.37% | 0.82%(+1.54)#30 | 1.22%(+1.15)#1,611 |
| 31. | Houghton | 2.34% | 0.82%(+1.51)#31 | 1.22%(+1.12)#1,639 |
| 32. | Delton | 2.31% | 0.82%(+1.49)#32 | 1.22%(+1.10)#1,664 |
| 33. | Westwood | 2.29% | 0.82%(+1.47)#33 | 1.22%(+1.08)#1,679 |
| 34. | Saginaw | 2.29% | 0.82%(+1.47)#34 | 1.22%(+1.08)#1,681 |
| 35. | Mancelona | 2.22% | 0.82%(+1.40)#35 | 1.22%(+1.00)#1,742 |
| 36. | Grand Blanc | 2.19% | 0.82%(+1.37)#36 | 1.22%(+0.976)#1,774 |
| 37. | Wyoming | 2.13% | 0.82%(+1.30)#37 | 1.22%(+0.912)#1,840 |
| 38. | Oak Park | 2.08% | 0.82%(+1.25)#38 | 1.22%(+0.863)#1,897 |
| 39. | Franklin | 2.00% | 0.82%(+1.17)#39 | 1.22%(+0.783)#1,980 |
| 40. | Eau Claire | 1.99% | 0.82%(+1.16)#40 | 1.22%(+0.772)#1,993 |
| 41. | Mount Clemens | 1.93% | 0.82%(+1.11)#41 | 1.22%(+0.717)#2,047 |
| 42. | Oakley | 1.85% | 0.82%(+1.03)#42 | 1.22%(+0.637)#2,139 |
| 43. | Detroit | 1.81% | 0.82%(+0.988)#43 | 1.22%(+0.597)#2,199 |
| 44. | Walled Lake | 1.80% | 0.82%(+0.980)#44 | 1.22%(+0.589)#2,210 |
| 45. | Mackinac Island | 1.79% | 0.82%(+0.971)#45 | 1.22%(+0.579)#2,222 |
| 46. | Belleville | 1.73% | 0.82%(+0.910)#46 | 1.22%(+0.519)#2,304 |
| 47. | Taylor | 1.72% | 0.82%(+0.895)#47 | 1.22%(+0.504)#2,333 |
| 48. | Galesburg | 1.64% | 0.82%(+0.820)#48 | 1.22%(+0.428)#2,446 |
| 49. | Muskegon | 1.47% | 0.82%(+0.642)#49 | 1.22%(+0.250)#2,723 |
| 50. | Flint | 1.45% | 0.82%(+0.624)#50 | 1.22%(+0.232)#2,763 |
| 51. | Novi | 1.43% | 0.82%(+0.606)#51 | 1.22%(+0.215)#2,807 |
| 52. | Waverly | 1.42% | 0.82%(+0.597)#52 | 1.22%(+0.205)#2,823 |
| 53. | Garden City | 1.41% | 0.82%(+0.584)#53 | 1.22%(+0.193)#2,851 |
| 54. | Suttons Bay | 1.40% | 0.82%(+0.578)#54 | 1.22%(+0.187)#2,862 |
| 55. | Kalamazoo | 1.40% | 0.82%(+0.578)#55 | 1.22%(+0.187)#2,863 |
| 56. | South Lyon | 1.39% | 0.82%(+0.568)#56 | 1.22%(+0.176)#2,876 |
| 57. | Holt | 1.37% | 0.82%(+0.548)#57 | 1.22%(+0.156)#2,903 |
| 58. | Ann Arbor | 1.36% | 0.82%(+0.539)#58 | 1.22%(+0.148)#2,921 |
| 59. | Brownlee Park | 1.29% | 0.82%(+0.471)#59 | 1.22%(+0.080)#3,058 |
| 60. | Farmington Hills | 1.29% | 0.82%(+0.470)#60 | 1.22%(+0.079)#3,061 |
| 61. | Ypsilanti | 1.29% | 0.82%(+0.463)#61 | 1.22%(+0.072)#3,077 |
| 62. | Saline | 1.28% | 0.82%(+0.458)#62 | 1.22%(+0.067)#3,089 |
| 63. | Okemos | 1.28% | 0.82%(+0.452)#63 | 1.22%(+0.061)#3,103 |
| 64. | Holland | 1.27% | 0.82%(+0.443)#64 | 1.22%(+0.051)#3,130 |
| 65. | Ravenna | 1.25% | 0.82%(+0.429)#65 | 1.22%(+0.038)#3,150 |
| 66. | East Lansing | 1.22% | 0.82%(+0.401)#66 | 1.22%(+0.009)#3,209 |
| 67. | Mayville | 1.20% | 0.82%(+0.376)#67 | 1.22%(-0.015)#3,258 |
| 68. | Lyons | 1.19% | 0.82%(+0.366)#68 | 1.22%(-0.026)#3,278 |
| 69. | Lathrup Village | 1.18% | 0.82%(+0.354)#69 | 1.22%(-0.037)#3,305 |
| 70. | Ossineke | 1.17% | 0.82%(+0.350)#70 | 1.22%(-0.041)#3,313 |
| 71. | Pontiac | 1.13% | 0.82%(+0.309)#71 | 1.22%(-0.082)#3,402 |
| 72. | Livonia | 1.11% | 0.82%(+0.285)#72 | 1.22%(-0.107)#3,461 |
| 73. | Clare | 1.10% | 0.82%(+0.275)#73 | 1.22%(-0.116)#3,481 |
| 74. | Frankfort | 1.09% | 0.82%(+0.263)#74 | 1.22%(-0.128)#3,497 |
| 75. | Battle Creek | 1.08% | 0.82%(+0.261)#75 | 1.22%(-0.131)#3,503 |
| 76. | Plymouth | 1.08% | 0.82%(+0.252)#76 | 1.22%(-0.140)#3,513 |
| 77. | Freeland | 1.07% | 0.82%(+0.250)#77 | 1.22%(-0.141)#3,518 |
| 78. | Roosevelt Park | 1.06% | 0.82%(+0.239)#78 | 1.22%(-0.152)#3,539 |
| 79. | Comstock Park | 1.03% | 0.82%(+0.207)#79 | 1.22%(-0.184)#3,628 |
| 80. | South Haven | 1.03% | 0.82%(+0.202)#80 | 1.22%(-0.190)#3,647 |
| 81. | Montrose | 1.02% | 0.82%(+0.198)#81 | 1.22%(-0.194)#3,657 |
| 82. | New Haven | 0.98% | 0.82%(+0.160)#82 | 1.22%(-0.231)#3,765 |
| 83. | Armada | 0.98% | 0.82%(+0.157)#83 | 1.22%(-0.234)#3,776 |
| 84. | Mattawan | 0.97% | 0.82%(+0.151)#84 | 1.22%(-0.241)#3,798 |
| 85. | Ishpeming | 0.94% | 0.82%(+0.113)#85 | 1.22%(-0.278)#3,912 |
| 86. | Fruitport | 0.94% | 0.82%(+0.113)#86 | 1.22%(-0.279)#3,914 |
| 87. | Harper Woods | 0.93% | 0.82%(+0.111)#87 | 1.22%(-0.280)#3,922 |
| 88. | Wixom | 0.93% | 0.82%(+0.105)#88 | 1.22%(-0.286)#3,941 |
| 89. | Cement City | 0.91% | 0.82%(+0.084)#89 | 1.22%(-0.308)#4,013 |
| 90. | Petoskey | 0.90% | 0.82%(+0.081)#90 | 1.22%(-0.311)#4,021 |
| 91. | Haslett | 0.89% | 0.82%(+0.067)#91 | 1.22%(-0.325)#4,055 |
| 92. | Mount Pleasant | 0.88% | 0.82%(+0.061)#92 | 1.22%(-0.331)#4,070 |
| 93. | Otisville | 0.88% | 0.82%(+0.055)#93 | 1.22%(-0.336)#4,084 |
| 94. | Coldwater | 0.88% | 0.82%(+0.052)#94 | 1.22%(-0.339)#4,098 |
| 95. | Ionia | 0.87% | 0.82%(+0.048)#95 | 1.22%(-0.344)#4,114 |
| 96. | Shepherd | 0.85% | 0.82%(+0.024)#96 | 1.22%(-0.367)#4,191 |
| 97. | Westphalia | 0.84% | 0.82%(+0.017)#97 | 1.22%(-0.375)#4,222 |
| 98. | Eastpointe | 0.84% | 0.82%(+0.012)#98 | 1.22%(-0.379)#4,245 |
| 99. | Bridgeport | 0.82% | 0.82%(-0.008)#99 | 1.22%(-0.399)#4,319 |
| 100. | Keego Harbor | 0.79% | 0.82%(-0.030)#100 | 1.22%(-0.421)#4,387 |
Common Questions
What are the Top 10 Cities with the Highest Percentage of Subsaharan African Population in Michigan?
Top 10 Cities with the Highest Percentage of Subsaharan African Population in Michigan are:
#1
13.29%
#2
12.30%
#3
12.00%
#4
8.42%
#5
7.80%
#6
7.01%
#7
6.71%
#8
6.16%
#9
5.19%
#10
4.84%
What city has the Highest Percentage of Subsaharan African Population in Michigan?
Benton Heights has the Highest Percentage of Subsaharan African Population in Michigan with 13.29%.
What is the Percentage of Subsaharan African Population in the State of Michigan?
Percentage of Subsaharan African Population in Michigan is 0.82%.
What is the Percentage of Subsaharan African Population in the United States?
Percentage of Subsaharan African Population in the United States is 1.22%.