Cities with the Highest Percentage of Subsaharan African Population in Missouri
RELATED REPORTS & OPTIONS
Subsaharan African
Missouri
Compare Cities
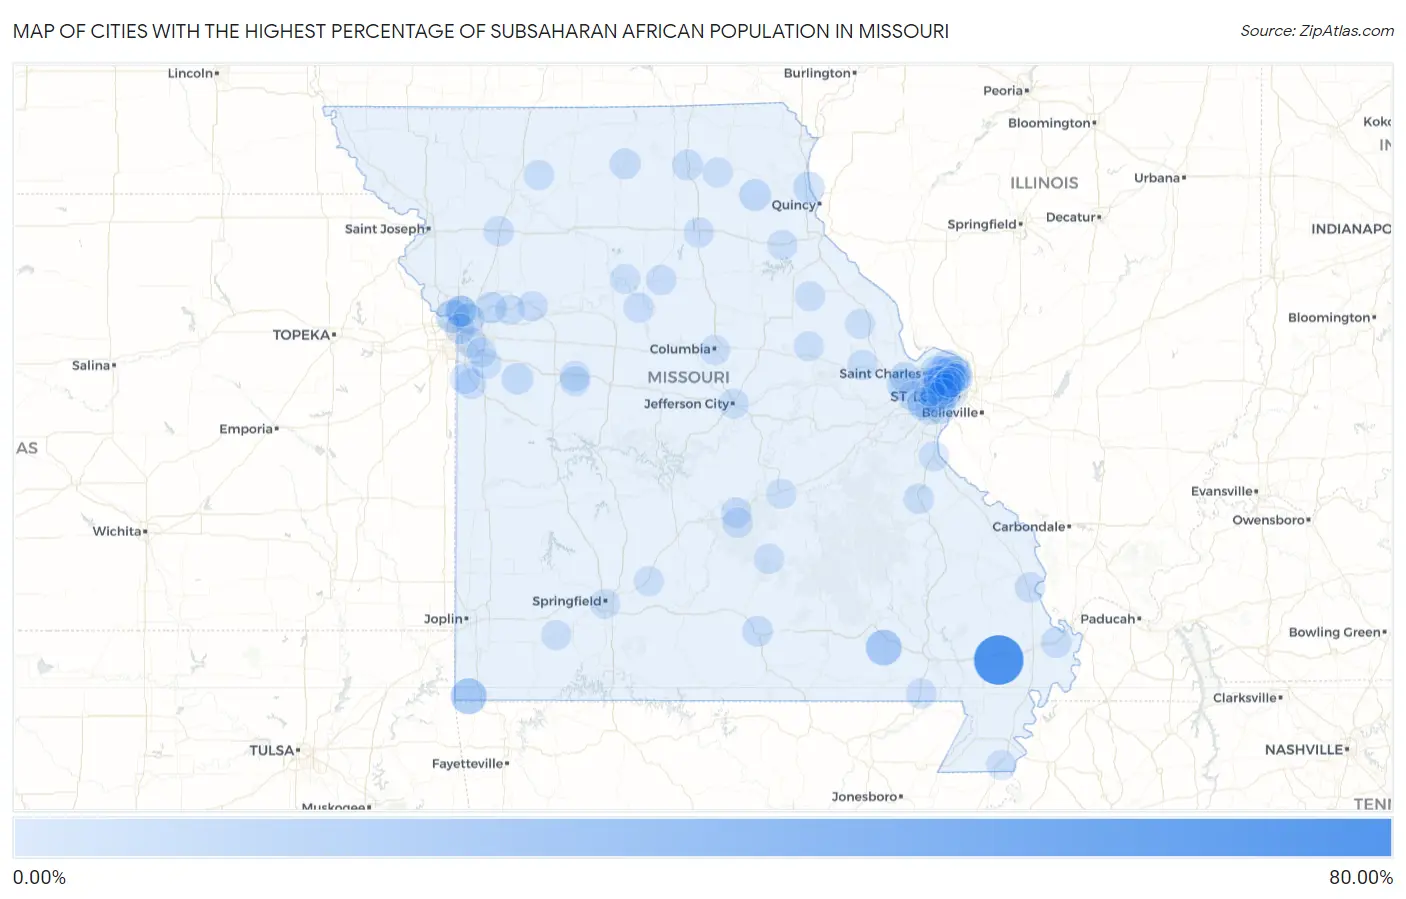
Map of Cities with the Highest Percentage of Subsaharan African Population in Missouri
0.00%
80.00%
Cities with the Highest Percentage of Subsaharan African Population in Missouri
| City | Subsaharan African | vs State | vs National | |
| 1. | Penermon | 68.60% | 0.77%(+67.8)#1 | 1.22%(+67.4)#3 |
| 2. | Noel | 20.21% | 0.77%(+19.4)#2 | 1.22%(+19.0)#51 |
| 3. | Hunter | 19.42% | 0.77%(+18.6)#3 | 1.22%(+18.2)#58 |
| 4. | Calverton Park | 13.59% | 0.77%(+12.8)#4 | 1.22%(+12.4)#119 |
| 5. | Riverside | 11.03% | 0.77%(+10.3)#5 | 1.22%(+9.81)#167 |
| 6. | Blue Summit | 10.49% | 0.77%(+9.71)#6 | 1.22%(+9.27)#195 |
| 7. | Rock Hill | 6.70% | 0.77%(+5.93)#7 | 1.22%(+5.49)#407 |
| 8. | Newark | 6.25% | 0.77%(+5.48)#8 | 1.22%(+5.03)#453 |
| 9. | Kingsville | 5.84% | 0.77%(+5.06)#9 | 1.22%(+4.62)#500 |
| 10. | La Grange | 5.63% | 0.77%(+4.85)#10 | 1.22%(+4.41)#532 |
| 11. | Dellwood | 5.49% | 0.77%(+4.72)#11 | 1.22%(+4.28)#554 |
| 12. | Missouri City | 5.35% | 0.77%(+4.58)#12 | 1.22%(+4.14)#574 |
| 13. | Oakwood Park | 5.18% | 0.77%(+4.41)#13 | 1.22%(+3.96)#607 |
| 14. | Randolph | 5.00% | 0.77%(+4.23)#14 | 1.22%(+3.78)#648 |
| 15. | Weldon Spring Heights | 4.83% | 0.77%(+4.05)#15 | 1.22%(+3.61)#671 |
| 16. | Hazelwood | 4.82% | 0.77%(+4.04)#16 | 1.22%(+3.60)#675 |
| 17. | Moline Acres | 4.19% | 0.77%(+3.42)#17 | 1.22%(+2.98)#804 |
| 18. | Berkeley | 3.74% | 0.77%(+2.97)#18 | 1.22%(+2.53)#944 |
| 19. | Cottleville | 3.72% | 0.77%(+2.95)#19 | 1.22%(+2.51)#950 |
| 20. | Kirksville | 3.58% | 0.77%(+2.81)#20 | 1.22%(+2.37)#996 |
| 21. | Milan | 3.42% | 0.77%(+2.65)#21 | 1.22%(+2.20)#1,038 |
| 22. | Willow Springs | 3.20% | 0.77%(+2.43)#22 | 1.22%(+1.98)#1,145 |
| 23. | Old Jamestown | 3.19% | 0.77%(+2.42)#23 | 1.22%(+1.98)#1,148 |
| 24. | Bellefontaine Neighbors | 3.14% | 0.77%(+2.37)#24 | 1.22%(+1.92)#1,179 |
| 25. | Spanish Lake | 3.00% | 0.77%(+2.22)#25 | 1.22%(+1.78)#1,245 |
| 26. | Overland | 2.95% | 0.77%(+2.17)#26 | 1.22%(+1.73)#1,272 |
| 27. | Gladstone | 2.91% | 0.77%(+2.13)#27 | 1.22%(+1.69)#1,288 |
| 28. | Ferguson | 2.91% | 0.77%(+2.13)#28 | 1.22%(+1.69)#1,289 |
| 29. | Charleston | 2.88% | 0.77%(+2.11)#29 | 1.22%(+1.67)#1,298 |
| 30. | Pasadena Hills | 2.83% | 0.77%(+2.06)#30 | 1.22%(+1.62)#1,322 |
| 31. | Normandy | 2.79% | 0.77%(+2.02)#31 | 1.22%(+1.57)#1,342 |
| 32. | Pasadena Park | 2.74% | 0.77%(+1.96)#32 | 1.22%(+1.52)#1,380 |
| 33. | Castle Point | 2.72% | 0.77%(+1.95)#33 | 1.22%(+1.51)#1,390 |
| 34. | Raytown | 2.67% | 0.77%(+1.90)#34 | 1.22%(+1.46)#1,416 |
| 35. | St Louis | 2.59% | 0.77%(+1.81)#35 | 1.22%(+1.37)#1,464 |
| 36. | Twin Oaks | 2.58% | 0.77%(+1.81)#36 | 1.22%(+1.37)#1,467 |
| 37. | Peculiar | 2.47% | 0.77%(+1.69)#37 | 1.22%(+1.25)#1,547 |
| 38. | Neelyville | 2.36% | 0.77%(+1.58)#38 | 1.22%(+1.14)#1,619 |
| 39. | St Robert | 2.35% | 0.77%(+1.57)#39 | 1.22%(+1.13)#1,632 |
| 40. | St John | 2.32% | 0.77%(+1.55)#40 | 1.22%(+1.11)#1,655 |
| 41. | Olivette | 2.28% | 0.77%(+1.50)#41 | 1.22%(+1.06)#1,690 |
| 42. | Riverview Estates | 2.25% | 0.77%(+1.47)#42 | 1.22%(+1.03)#1,714 |
| 43. | Richmond Heights | 2.23% | 0.77%(+1.46)#43 | 1.22%(+1.02)#1,729 |
| 44. | Edmundson | 2.21% | 0.77%(+1.43)#44 | 1.22%(+0.991)#1,755 |
| 45. | Norwood Court | 2.17% | 0.77%(+1.40)#45 | 1.22%(+0.954)#1,802 |
| 46. | Breckenridge Hills | 2.16% | 0.77%(+1.38)#46 | 1.22%(+0.941)#1,814 |
| 47. | St Ann | 2.09% | 0.77%(+1.32)#47 | 1.22%(+0.875)#1,886 |
| 48. | Cameron | 2.04% | 0.77%(+1.27)#48 | 1.22%(+0.829)#1,920 |
| 49. | Cool Valley | 2.04% | 0.77%(+1.27)#49 | 1.22%(+0.827)#1,922 |
| 50. | Knob Noster | 2.04% | 0.77%(+1.27)#50 | 1.22%(+0.826)#1,926 |
| 51. | Gilliam | 2.02% | 0.77%(+1.25)#51 | 1.22%(+0.805)#1,950 |
| 52. | Wright City | 1.99% | 0.77%(+1.21)#52 | 1.22%(+0.773)#1,989 |
| 53. | Maryland Heights | 1.85% | 0.77%(+1.08)#53 | 1.22%(+0.635)#2,142 |
| 54. | Fort Leonard Wood | 1.82% | 0.77%(+1.05)#54 | 1.22%(+0.604)#2,191 |
| 55. | Florissant | 1.82% | 0.77%(+1.04)#55 | 1.22%(+0.600)#2,196 |
| 56. | Licking | 1.80% | 0.77%(+1.02)#56 | 1.22%(+0.581)#2,217 |
| 57. | Kansas City | 1.78% | 0.77%(+1.01)#57 | 1.22%(+0.564)#2,239 |
| 58. | University City | 1.72% | 0.77%(+0.948)#58 | 1.22%(+0.507)#2,326 |
| 59. | Bonne Terre | 1.72% | 0.77%(+0.946)#59 | 1.22%(+0.504)#2,332 |
| 60. | Kinloch | 1.72% | 0.77%(+0.945)#60 | 1.22%(+0.503)#2,334 |
| 61. | Henrietta | 1.69% | 0.77%(+0.921)#61 | 1.22%(+0.480)#2,362 |
| 62. | Jennings | 1.69% | 0.77%(+0.919)#62 | 1.22%(+0.478)#2,368 |
| 63. | Salisbury | 1.68% | 0.77%(+0.905)#63 | 1.22%(+0.463)#2,386 |
| 64. | Cape Girardeau | 1.62% | 0.77%(+0.850)#64 | 1.22%(+0.408)#2,472 |
| 65. | Lakeshire | 1.62% | 0.77%(+0.844)#65 | 1.22%(+0.402)#2,485 |
| 66. | Macon | 1.49% | 0.77%(+0.712)#66 | 1.22%(+0.271)#2,671 |
| 67. | Gilman City | 1.46% | 0.77%(+0.683)#67 | 1.22%(+0.241)#2,742 |
| 68. | Velda City | 1.44% | 0.77%(+0.662)#68 | 1.22%(+0.220)#2,790 |
| 69. | Jefferson City | 1.44% | 0.77%(+0.661)#69 | 1.22%(+0.220)#2,793 |
| 70. | Columbia | 1.38% | 0.77%(+0.610)#70 | 1.22%(+0.169)#2,887 |
| 71. | Aurora | 1.37% | 0.77%(+0.598)#71 | 1.22%(+0.157)#2,902 |
| 72. | Festus | 1.36% | 0.77%(+0.589)#72 | 1.22%(+0.147)#2,925 |
| 73. | Black Jack | 1.33% | 0.77%(+0.553)#73 | 1.22%(+0.112)#3,000 |
| 74. | Fenton | 1.29% | 0.77%(+0.520)#74 | 1.22%(+0.079)#3,062 |
| 75. | Whiteman Afb | 1.29% | 0.77%(+0.513)#75 | 1.22%(+0.072)#3,079 |
| 76. | Vandalia | 1.24% | 0.77%(+0.468)#76 | 1.22%(+0.027)#3,174 |
| 77. | Vinita Park | 1.24% | 0.77%(+0.465)#77 | 1.22%(+0.023)#3,184 |
| 78. | Riverview | 1.24% | 0.77%(+0.463)#78 | 1.22%(+0.021)#3,190 |
| 79. | Monroe City | 1.23% | 0.77%(+0.454)#79 | 1.22%(+0.013)#3,206 |
| 80. | Woodson Terrace | 1.17% | 0.77%(+0.393)#80 | 1.22%(-0.048)#3,327 |
| 81. | Glasgow Village | 1.15% | 0.77%(+0.376)#81 | 1.22%(-0.066)#3,362 |
| 82. | Greenwood | 1.13% | 0.77%(+0.353)#82 | 1.22%(-0.089)#3,418 |
| 83. | Northwoods | 1.11% | 0.77%(+0.334)#83 | 1.22%(-0.107)#3,463 |
| 84. | Clarkson Valley | 1.07% | 0.77%(+0.300)#84 | 1.22%(-0.141)#3,519 |
| 85. | Brunswick | 1.05% | 0.77%(+0.278)#85 | 1.22%(-0.164)#3,570 |
| 86. | Montgomery City | 1.03% | 0.77%(+0.256)#86 | 1.22%(-0.186)#3,635 |
| 87. | Pagedale | 0.96% | 0.77%(+0.191)#87 | 1.22%(-0.251)#3,818 |
| 88. | Silex | 0.96% | 0.77%(+0.182)#88 | 1.22%(-0.260)#3,847 |
| 89. | Clayton | 0.95% | 0.77%(+0.179)#89 | 1.22%(-0.262)#3,853 |
| 90. | Huntleigh | 0.93% | 0.77%(+0.157)#90 | 1.22%(-0.285)#3,934 |
| 91. | Lee S Summit | 0.93% | 0.77%(+0.154)#91 | 1.22%(-0.287)#3,944 |
| 92. | Rolla | 0.92% | 0.77%(+0.150)#92 | 1.22%(-0.291)#3,953 |
| 93. | Manchester | 0.91% | 0.77%(+0.136)#93 | 1.22%(-0.305)#4,003 |
| 94. | Hurdland | 0.89% | 0.77%(+0.119)#94 | 1.22%(-0.322)#4,052 |
| 95. | Orrick | 0.89% | 0.77%(+0.115)#95 | 1.22%(-0.327)#4,059 |
| 96. | Marshfield | 0.88% | 0.77%(+0.106)#96 | 1.22%(-0.335)#4,081 |
| 97. | Cooter | 0.87% | 0.77%(+0.101)#97 | 1.22%(-0.340)#4,102 |
| 98. | Springfield | 0.84% | 0.77%(+0.068)#98 | 1.22%(-0.374)#4,215 |
| 99. | Creve Coeur | 0.84% | 0.77%(+0.067)#99 | 1.22%(-0.375)#4,218 |
| 100. | Flordell Hills | 0.83% | 0.77%(+0.055)#100 | 1.22%(-0.386)#4,268 |
Common Questions
What are the Top 10 Cities with the Highest Percentage of Subsaharan African Population in Missouri?
Top 10 Cities with the Highest Percentage of Subsaharan African Population in Missouri are:
#1
68.60%
#2
20.21%
#3
19.42%
#4
13.59%
#5
11.03%
#6
6.70%
#7
6.25%
#8
5.84%
#9
5.63%
#10
5.49%
What city has the Highest Percentage of Subsaharan African Population in Missouri?
Penermon has the Highest Percentage of Subsaharan African Population in Missouri with 68.60%.
What is the Percentage of Subsaharan African Population in the State of Missouri?
Percentage of Subsaharan African Population in Missouri is 0.77%.
What is the Percentage of Subsaharan African Population in the United States?
Percentage of Subsaharan African Population in the United States is 1.22%.