Cities with the Highest Percentage of Subsaharan African Population in Maryland
RELATED REPORTS & OPTIONS
Subsaharan African
Maryland
Compare Cities
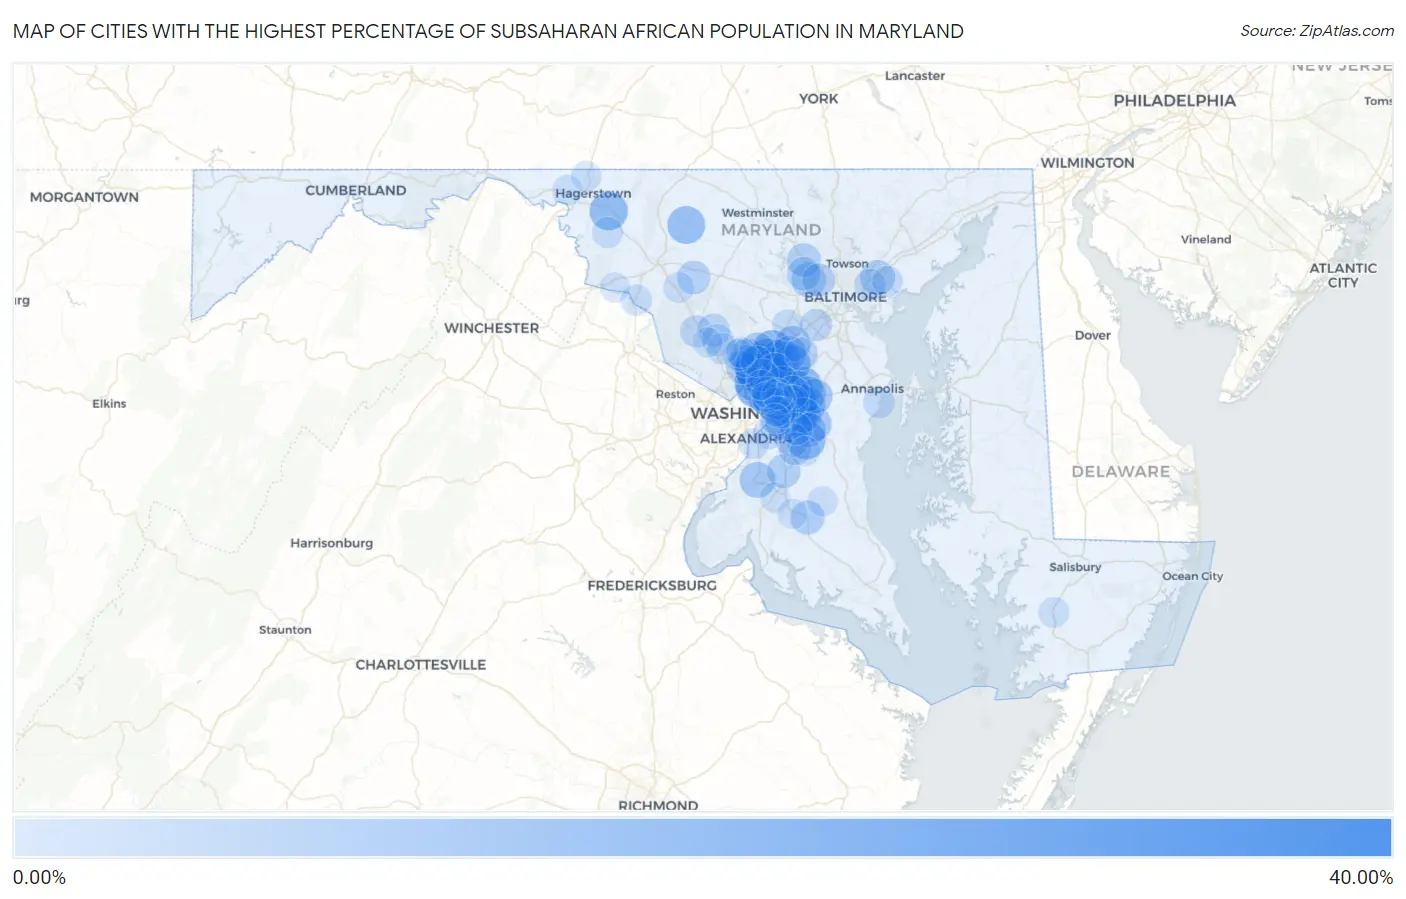
Map of Cities with the Highest Percentage of Subsaharan African Population in Maryland
0.00%
40.00%
Cities with the Highest Percentage of Subsaharan African Population in Maryland
| City | Subsaharan African | vs State | vs National | |
| 1. | White Oak | 30.74% | 4.20%(+26.5)#1 | 1.22%(+29.5)#17 |
| 2. | New Carrollton | 22.81% | 4.20%(+18.6)#2 | 1.22%(+21.6)#39 |
| 3. | Bladensburg | 21.64% | 4.20%(+17.4)#3 | 1.22%(+20.4)#45 |
| 4. | Fairland | 20.76% | 4.20%(+16.6)#4 | 1.22%(+19.5)#48 |
| 5. | Largo | 19.63% | 4.20%(+15.4)#5 | 1.22%(+18.4)#55 |
| 6. | Takoma Park | 18.73% | 4.20%(+14.5)#6 | 1.22%(+17.5)#61 |
| 7. | Seabrook | 17.89% | 4.20%(+13.7)#7 | 1.22%(+16.7)#67 |
| 8. | Burtonsville | 17.28% | 4.20%(+13.1)#8 | 1.22%(+16.1)#72 |
| 9. | Lake Arbor | 17.05% | 4.20%(+12.9)#9 | 1.22%(+15.8)#74 |
| 10. | Konterra | 16.91% | 4.20%(+12.7)#10 | 1.22%(+15.7)#75 |
| 11. | Glenn Dale | 16.37% | 4.20%(+12.2)#11 | 1.22%(+15.2)#82 |
| 12. | Queensland | 15.93% | 4.20%(+11.7)#12 | 1.22%(+14.7)#84 |
| 13. | Adelphi | 15.86% | 4.20%(+11.7)#13 | 1.22%(+14.6)#86 |
| 14. | South Laurel | 15.77% | 4.20%(+11.6)#14 | 1.22%(+14.6)#89 |
| 15. | Woodmore | 15.45% | 4.20%(+11.3)#15 | 1.22%(+14.2)#94 |
| 16. | Beaver Creek | 15.40% | 4.20%(+11.2)#16 | 1.22%(+14.2)#95 |
| 17. | Calverton | 15.37% | 4.20%(+11.2)#17 | 1.22%(+14.2)#96 |
| 18. | Mitchellville | 14.82% | 4.20%(+10.6)#18 | 1.22%(+13.6)#102 |
| 19. | Woodsboro | 14.68% | 4.20%(+10.5)#19 | 1.22%(+13.5)#105 |
| 20. | Landover | 14.54% | 4.20%(+10.3)#20 | 1.22%(+13.3)#109 |
| 21. | Summerfield | 14.37% | 4.20%(+10.2)#21 | 1.22%(+13.2)#111 |
| 22. | Chillum | 13.85% | 4.20%(+9.65)#22 | 1.22%(+12.6)#117 |
| 23. | Silver Spring | 13.14% | 4.20%(+8.94)#23 | 1.22%(+11.9)#126 |
| 24. | Accokeek | 12.04% | 4.20%(+7.84)#24 | 1.22%(+10.8)#139 |
| 25. | Brock Hall | 11.92% | 4.20%(+7.72)#25 | 1.22%(+10.7)#143 |
| 26. | North Laurel | 11.79% | 4.20%(+7.59)#26 | 1.22%(+10.6)#146 |
| 27. | Laurel | 11.71% | 4.20%(+7.51)#27 | 1.22%(+10.5)#147 |
| 28. | Kemp Mill | 11.31% | 4.20%(+7.11)#28 | 1.22%(+10.1)#157 |
| 29. | Layhill | 11.19% | 4.20%(+6.99)#29 | 1.22%(+9.97)#160 |
| 30. | Bowie | 10.97% | 4.20%(+6.77)#30 | 1.22%(+9.76)#169 |
| 31. | Greenbelt | 10.87% | 4.20%(+6.67)#31 | 1.22%(+9.66)#173 |
| 32. | Burnt Mills | 10.76% | 4.20%(+6.56)#32 | 1.22%(+9.54)#179 |
| 33. | Fairwood | 10.74% | 4.20%(+6.54)#33 | 1.22%(+9.53)#181 |
| 34. | District Heights | 10.72% | 4.20%(+6.52)#34 | 1.22%(+9.50)#182 |
| 35. | Rossville | 10.56% | 4.20%(+6.36)#35 | 1.22%(+9.34)#189 |
| 36. | Cloverly | 10.54% | 4.20%(+6.34)#36 | 1.22%(+9.33)#190 |
| 37. | Glenarden | 10.45% | 4.20%(+6.25)#37 | 1.22%(+9.23)#197 |
| 38. | Milford Mill | 10.42% | 4.20%(+6.22)#38 | 1.22%(+9.21)#199 |
| 39. | Kettering | 10.38% | 4.20%(+6.18)#39 | 1.22%(+9.16)#204 |
| 40. | Marlboro Village | 10.25% | 4.20%(+6.05)#40 | 1.22%(+9.03)#206 |
| 41. | Hughesville | 9.83% | 4.20%(+5.63)#41 | 1.22%(+8.62)#220 |
| 42. | Beltsville | 9.71% | 4.20%(+5.51)#42 | 1.22%(+8.50)#223 |
| 43. | Brandywine | 9.48% | 4.20%(+5.28)#43 | 1.22%(+8.26)#229 |
| 44. | Owings Mills | 9.45% | 4.20%(+5.25)#44 | 1.22%(+8.23)#231 |
| 45. | Woodlawn Cdp Prince George S County | 9.37% | 4.20%(+5.17)#45 | 1.22%(+8.15)#234 |
| 46. | Lanham | 9.17% | 4.20%(+4.97)#46 | 1.22%(+7.95)#240 |
| 47. | Monrovia | 9.06% | 4.20%(+4.86)#47 | 1.22%(+7.85)#244 |
| 48. | Randallstown | 9.06% | 4.20%(+4.85)#48 | 1.22%(+7.84)#245 |
| 49. | Edmonston | 8.62% | 4.20%(+4.42)#49 | 1.22%(+7.41)#268 |
| 50. | Melwood | 8.58% | 4.20%(+4.38)#50 | 1.22%(+7.37)#271 |
| 51. | Maryland City | 8.57% | 4.20%(+4.37)#51 | 1.22%(+7.35)#273 |
| 52. | Wheaton | 8.56% | 4.20%(+4.35)#52 | 1.22%(+7.34)#274 |
| 53. | Lochearn | 8.43% | 4.20%(+4.23)#53 | 1.22%(+7.22)#279 |
| 54. | Rosaryville | 7.99% | 4.20%(+3.79)#54 | 1.22%(+6.78)#310 |
| 55. | Springdale | 7.82% | 4.20%(+3.62)#55 | 1.22%(+6.60)#324 |
| 56. | Cottage City | 7.80% | 4.20%(+3.60)#56 | 1.22%(+6.59)#325 |
| 57. | Montgomery Village | 7.68% | 4.20%(+3.48)#57 | 1.22%(+6.47)#333 |
| 58. | Cheverly | 7.58% | 4.20%(+3.38)#58 | 1.22%(+6.37)#340 |
| 59. | Westphalia | 7.55% | 4.20%(+3.35)#59 | 1.22%(+6.33)#342 |
| 60. | Glenmont | 7.41% | 4.20%(+3.21)#60 | 1.22%(+6.20)#353 |
| 61. | Germantown | 7.38% | 4.20%(+3.18)#61 | 1.22%(+6.17)#356 |
| 62. | Elkridge | 7.33% | 4.20%(+3.13)#62 | 1.22%(+6.12)#361 |
| 63. | Mount Rainier | 7.29% | 4.20%(+3.09)#63 | 1.22%(+6.07)#365 |
| 64. | Hillandale | 7.24% | 4.20%(+3.04)#64 | 1.22%(+6.02)#373 |
| 65. | Peppermill Village | 7.03% | 4.20%(+2.83)#65 | 1.22%(+5.81)#384 |
| 66. | Washington Grove | 6.95% | 4.20%(+2.75)#66 | 1.22%(+5.74)#389 |
| 67. | Brentwood | 6.80% | 4.20%(+2.59)#67 | 1.22%(+5.58)#399 |
| 68. | Aspen Hill | 6.72% | 4.20%(+2.51)#68 | 1.22%(+5.50)#404 |
| 69. | Rosedale | 6.63% | 4.20%(+2.43)#69 | 1.22%(+5.42)#412 |
| 70. | Seat Pleasant | 6.49% | 4.20%(+2.29)#70 | 1.22%(+5.28)#425 |
| 71. | Highland Beach | 6.45% | 4.20%(+2.25)#71 | 1.22%(+5.24)#431 |
| 72. | Derwood | 6.38% | 4.20%(+2.18)#72 | 1.22%(+5.16)#440 |
| 73. | Landover Hills | 6.19% | 4.20%(+1.98)#73 | 1.22%(+4.97)#459 |
| 74. | Hyattsville | 6.12% | 4.20%(+1.92)#74 | 1.22%(+4.91)#468 |
| 75. | Point Of Rocks | 5.93% | 4.20%(+1.73)#75 | 1.22%(+4.72)#483 |
| 76. | Boonsboro | 5.92% | 4.20%(+1.72)#76 | 1.22%(+4.70)#486 |
| 77. | Columbia | 5.91% | 4.20%(+1.71)#77 | 1.22%(+4.70)#488 |
| 78. | East Riverdale | 5.88% | 4.20%(+1.68)#78 | 1.22%(+4.67)#491 |
| 79. | Colesville | 5.79% | 4.20%(+1.59)#79 | 1.22%(+4.58)#505 |
| 80. | Brown Station | 5.67% | 4.20%(+1.47)#80 | 1.22%(+4.46)#522 |
| 81. | Marlow Heights | 5.58% | 4.20%(+1.38)#81 | 1.22%(+4.37)#539 |
| 82. | Middle River | 5.58% | 4.20%(+1.38)#82 | 1.22%(+4.36)#541 |
| 83. | Urbana | 5.53% | 4.20%(+1.33)#83 | 1.22%(+4.31)#551 |
| 84. | Princess Anne | 5.32% | 4.20%(+1.12)#84 | 1.22%(+4.10)#577 |
| 85. | National Harbor | 5.30% | 4.20%(+1.09)#85 | 1.22%(+4.08)#580 |
| 86. | Leisure World | 5.29% | 4.20%(+1.09)#86 | 1.22%(+4.08)#582 |
| 87. | Suitland | 5.20% | 4.20%(+0.997)#87 | 1.22%(+3.98)#601 |
| 88. | Honeygo | 5.13% | 4.20%(+0.930)#88 | 1.22%(+3.92)#619 |
| 89. | Fairmount Heights | 5.03% | 4.20%(+0.833)#89 | 1.22%(+3.82)#636 |
| 90. | Wilson Conococheague | 5.02% | 4.20%(+0.817)#90 | 1.22%(+3.80)#642 |
| 91. | Aquasco | 4.99% | 4.20%(+0.792)#91 | 1.22%(+3.78)#651 |
| 92. | Abingdon | 4.95% | 4.20%(+0.749)#92 | 1.22%(+3.73)#658 |
| 93. | Maugansville | 4.87% | 4.20%(+0.673)#93 | 1.22%(+3.66)#665 |
| 94. | Coral Hills | 4.82% | 4.20%(+0.621)#94 | 1.22%(+3.61)#673 |
| 95. | Gaithersburg | 4.78% | 4.20%(+0.579)#95 | 1.22%(+3.56)#680 |
| 96. | Marlton | 4.78% | 4.20%(+0.579)#96 | 1.22%(+3.56)#681 |
| 97. | Waldorf | 4.74% | 4.20%(+0.536)#97 | 1.22%(+3.52)#689 |
| 98. | Bryantown | 4.68% | 4.20%(+0.476)#98 | 1.22%(+3.46)#701 |
| 99. | Brunswick | 4.59% | 4.20%(+0.387)#99 | 1.22%(+3.37)#718 |
| 100. | Langley Park | 4.56% | 4.20%(+0.363)#100 | 1.22%(+3.35)#724 |
Common Questions
What are the Top 10 Cities with the Highest Percentage of Subsaharan African Population in Maryland?
Top 10 Cities with the Highest Percentage of Subsaharan African Population in Maryland are:
#1
30.74%
#2
22.81%
#3
21.64%
#4
20.76%
#5
19.63%
#6
18.73%
#7
17.89%
#8
17.28%
#9
17.05%
#10
16.91%
What city has the Highest Percentage of Subsaharan African Population in Maryland?
White Oak has the Highest Percentage of Subsaharan African Population in Maryland with 30.74%.
What is the Percentage of Subsaharan African Population in the State of Maryland?
Percentage of Subsaharan African Population in Maryland is 4.20%.
What is the Percentage of Subsaharan African Population in the United States?
Percentage of Subsaharan African Population in the United States is 1.22%.