Cities with the Highest Percentage of Subsaharan African Population in Indiana
RELATED REPORTS & OPTIONS
Subsaharan African
Indiana
Compare Cities
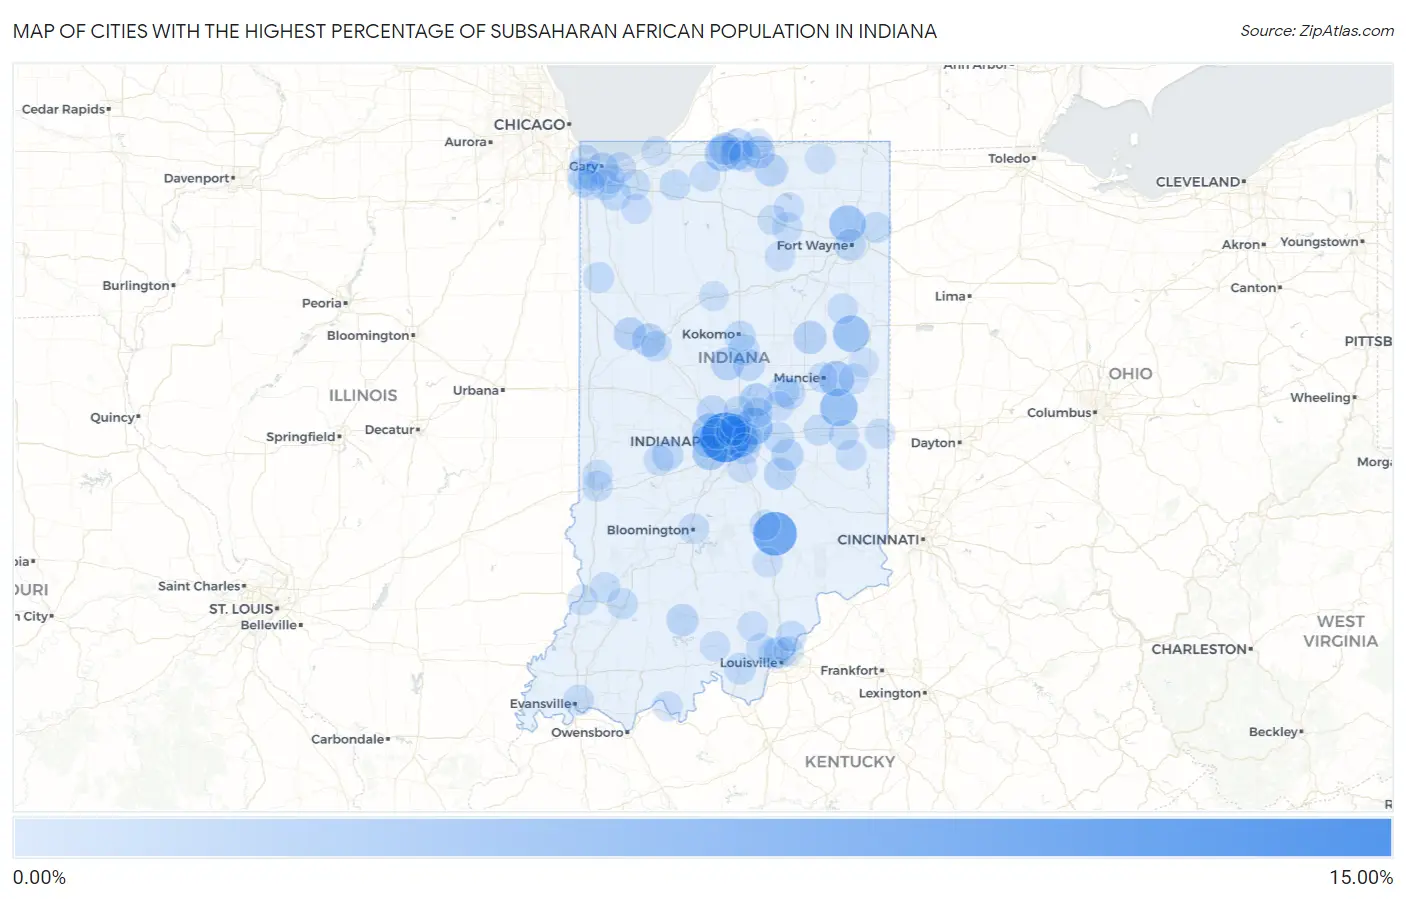
Map of Cities with the Highest Percentage of Subsaharan African Population in Indiana
0.00%
15.00%
Cities with the Highest Percentage of Subsaharan African Population in Indiana
| City | Subsaharan African | vs State | vs National | |
| 1. | Speedway | 10.13% | 1.06%(+9.08)#1 | 1.22%(+8.92)#210 |
| 2. | Elizabethtown | 7.10% | 1.06%(+6.04)#2 | 1.22%(+5.88)#380 |
| 3. | Putnamville | 4.40% | 1.06%(+3.35)#3 | 1.22%(+3.19)#758 |
| 4. | Indianapolis | 4.23% | 1.06%(+3.17)#4 | 1.22%(+3.02)#798 |
| 5. | Mooreland | 3.98% | 1.06%(+2.92)#5 | 1.22%(+2.76)#869 |
| 6. | Lawrence | 3.86% | 1.06%(+2.81)#6 | 1.22%(+2.65)#903 |
| 7. | Huntertown | 3.52% | 1.06%(+2.46)#7 | 1.22%(+2.31)#1,013 |
| 8. | Pennville | 3.51% | 1.06%(+2.46)#8 | 1.22%(+2.30)#1,016 |
| 9. | Selma | 3.03% | 1.06%(+1.97)#9 | 1.22%(+1.81)#1,229 |
| 10. | Brownsburg | 3.02% | 1.06%(+1.96)#10 | 1.22%(+1.80)#1,237 |
| 11. | South Bend | 2.94% | 1.06%(+1.88)#11 | 1.22%(+1.72)#1,278 |
| 12. | Plainfield | 2.86% | 1.06%(+1.80)#12 | 1.22%(+1.64)#1,307 |
| 13. | Spring Hill | 2.78% | 1.06%(+1.72)#13 | 1.22%(+1.56)#1,356 |
| 14. | Noblesville | 1.94% | 1.06%(+0.885)#14 | 1.22%(+0.727)#2,031 |
| 15. | Avon | 1.90% | 1.06%(+0.843)#15 | 1.22%(+0.685)#2,082 |
| 16. | Upland | 1.87% | 1.06%(+0.810)#16 | 1.22%(+0.652)#2,122 |
| 17. | West Lafayette | 1.85% | 1.06%(+0.797)#17 | 1.22%(+0.640)#2,137 |
| 18. | Granger | 1.83% | 1.06%(+0.768)#18 | 1.22%(+0.610)#2,184 |
| 19. | Kempton | 1.79% | 1.06%(+0.729)#19 | 1.22%(+0.571)#2,229 |
| 20. | Mishawaka | 1.69% | 1.06%(+0.629)#20 | 1.22%(+0.471)#2,378 |
| 21. | Goshen | 1.68% | 1.06%(+0.620)#21 | 1.22%(+0.462)#2,390 |
| 22. | Otterbein | 1.59% | 1.06%(+0.533)#22 | 1.22%(+0.375)#2,522 |
| 23. | Gary | 1.53% | 1.06%(+0.469)#23 | 1.22%(+0.311)#2,611 |
| 24. | Roseland | 1.51% | 1.06%(+0.454)#24 | 1.22%(+0.296)#2,634 |
| 25. | Elkhart | 1.49% | 1.06%(+0.436)#25 | 1.22%(+0.278)#2,660 |
| 26. | Ardmore | 1.44% | 1.06%(+0.379)#26 | 1.22%(+0.221)#2,788 |
| 27. | Shelbyville | 1.42% | 1.06%(+0.366)#27 | 1.22%(+0.208)#2,818 |
| 28. | French Lick | 1.37% | 1.06%(+0.313)#28 | 1.22%(+0.155)#2,904 |
| 29. | Morristown | 1.29% | 1.06%(+0.236)#29 | 1.22%(+0.078)#3,064 |
| 30. | Tipton | 1.20% | 1.06%(+0.142)#30 | 1.22%(-0.016)#3,262 |
| 31. | Osceola | 1.20% | 1.06%(+0.140)#31 | 1.22%(-0.018)#3,267 |
| 32. | Fort Wayne | 1.19% | 1.06%(+0.133)#32 | 1.22%(-0.025)#3,275 |
| 33. | Fillmore | 1.17% | 1.06%(+0.116)#33 | 1.22%(-0.042)#3,314 |
| 34. | Whitestown | 1.14% | 1.06%(+0.084)#34 | 1.22%(-0.074)#3,378 |
| 35. | Clarksville | 1.05% | 1.06%(-0.007)#35 | 1.22%(-0.165)#3,571 |
| 36. | Corydon | 1.05% | 1.06%(-0.011)#36 | 1.22%(-0.168)#3,579 |
| 37. | Sharpsville | 1.00% | 1.06%(-0.061)#37 | 1.22%(-0.219)#3,730 |
| 38. | Clermont | 0.99% | 1.06%(-0.072)#38 | 1.22%(-0.230)#3,762 |
| 39. | Rocky Ripple | 0.98% | 1.06%(-0.080)#39 | 1.22%(-0.238)#3,786 |
| 40. | Edgewood | 0.96% | 1.06%(-0.092)#40 | 1.22%(-0.250)#3,817 |
| 41. | Kokomo | 0.96% | 1.06%(-0.093)#41 | 1.22%(-0.251)#3,820 |
| 42. | Munster | 0.95% | 1.06%(-0.105)#42 | 1.22%(-0.263)#3,858 |
| 43. | Warren Park | 0.95% | 1.06%(-0.108)#43 | 1.22%(-0.266)#3,866 |
| 44. | New Albany | 0.95% | 1.06%(-0.110)#44 | 1.22%(-0.268)#3,873 |
| 45. | Greenfield | 0.95% | 1.06%(-0.111)#45 | 1.22%(-0.269)#3,876 |
| 46. | Lakes Of The Four Seasons | 0.94% | 1.06%(-0.122)#46 | 1.22%(-0.280)#3,920 |
| 47. | Harlan | 0.93% | 1.06%(-0.127)#47 | 1.22%(-0.285)#3,936 |
| 48. | Anderson | 0.89% | 1.06%(-0.163)#48 | 1.22%(-0.321)#4,046 |
| 49. | Brook | 0.83% | 1.06%(-0.224)#49 | 1.22%(-0.382)#4,255 |
| 50. | Washington | 0.82% | 1.06%(-0.237)#50 | 1.22%(-0.395)#4,302 |
| 51. | Kingsford Heights | 0.79% | 1.06%(-0.266)#51 | 1.22%(-0.424)#4,400 |
| 52. | Carmel | 0.79% | 1.06%(-0.270)#52 | 1.22%(-0.428)#4,407 |
| 53. | Lafayette | 0.78% | 1.06%(-0.272)#53 | 1.22%(-0.430)#4,418 |
| 54. | Spiceland | 0.78% | 1.06%(-0.278)#54 | 1.22%(-0.436)#4,438 |
| 55. | Charlestown | 0.78% | 1.06%(-0.281)#55 | 1.22%(-0.439)#4,449 |
| 56. | Merrillville | 0.73% | 1.06%(-0.323)#56 | 1.22%(-0.481)#4,607 |
| 57. | Bicknell | 0.71% | 1.06%(-0.347)#57 | 1.22%(-0.505)#4,697 |
| 58. | Bloomington | 0.70% | 1.06%(-0.353)#58 | 1.22%(-0.511)#4,717 |
| 59. | Meridian Hills | 0.69% | 1.06%(-0.369)#59 | 1.22%(-0.527)#4,787 |
| 60. | Pierceton | 0.67% | 1.06%(-0.388)#60 | 1.22%(-0.545)#4,876 |
| 61. | Columbus | 0.67% | 1.06%(-0.389)#61 | 1.22%(-0.547)#4,881 |
| 62. | Hammond | 0.66% | 1.06%(-0.398)#62 | 1.22%(-0.556)#4,931 |
| 63. | Galena | 0.66% | 1.06%(-0.402)#63 | 1.22%(-0.560)#4,950 |
| 64. | Beech Grove | 0.65% | 1.06%(-0.405)#64 | 1.22%(-0.563)#4,963 |
| 65. | Terre Haute | 0.65% | 1.06%(-0.409)#65 | 1.22%(-0.567)#4,985 |
| 66. | Valparaiso | 0.64% | 1.06%(-0.413)#66 | 1.22%(-0.571)#5,004 |
| 67. | North Liberty | 0.64% | 1.06%(-0.420)#67 | 1.22%(-0.578)#5,036 |
| 68. | Hobart | 0.63% | 1.06%(-0.428)#68 | 1.22%(-0.586)#5,079 |
| 69. | Connersville | 0.63% | 1.06%(-0.430)#69 | 1.22%(-0.588)#5,081 |
| 70. | Dublin | 0.62% | 1.06%(-0.433)#70 | 1.22%(-0.591)#5,095 |
| 71. | Greencastle | 0.62% | 1.06%(-0.439)#71 | 1.22%(-0.597)#5,121 |
| 72. | Evansville | 0.62% | 1.06%(-0.440)#72 | 1.22%(-0.598)#5,124 |
| 73. | Poneto | 0.60% | 1.06%(-0.455)#73 | 1.22%(-0.613)#5,190 |
| 74. | Vincennes | 0.59% | 1.06%(-0.471)#74 | 1.22%(-0.629)#5,257 |
| 75. | Muncie | 0.55% | 1.06%(-0.505)#75 | 1.22%(-0.663)#5,421 |
| 76. | Richmond | 0.55% | 1.06%(-0.507)#76 | 1.22%(-0.665)#5,437 |
| 77. | Farmland | 0.54% | 1.06%(-0.518)#77 | 1.22%(-0.676)#5,480 |
| 78. | Simonton Lake | 0.53% | 1.06%(-0.527)#78 | 1.22%(-0.685)#5,536 |
| 79. | Greenwood | 0.53% | 1.06%(-0.532)#79 | 1.22%(-0.690)#5,556 |
| 80. | North Manchester | 0.52% | 1.06%(-0.539)#80 | 1.22%(-0.697)#5,594 |
| 81. | North Terre Haute | 0.52% | 1.06%(-0.540)#81 | 1.22%(-0.698)#5,602 |
| 82. | Portage | 0.51% | 1.06%(-0.543)#82 | 1.22%(-0.701)#5,626 |
| 83. | Marengo | 0.50% | 1.06%(-0.555)#83 | 1.22%(-0.713)#5,690 |
| 84. | Kouts | 0.50% | 1.06%(-0.561)#84 | 1.22%(-0.719)#5,731 |
| 85. | Warsaw | 0.49% | 1.06%(-0.565)#85 | 1.22%(-0.723)#5,756 |
| 86. | New Pekin | 0.49% | 1.06%(-0.567)#86 | 1.22%(-0.725)#5,765 |
| 87. | Pendleton | 0.49% | 1.06%(-0.571)#87 | 1.22%(-0.729)#5,788 |
| 88. | Tell City | 0.48% | 1.06%(-0.575)#88 | 1.22%(-0.733)#5,819 |
| 89. | Fishers | 0.46% | 1.06%(-0.595)#89 | 1.22%(-0.753)#5,930 |
| 90. | Wynnedale | 0.46% | 1.06%(-0.598)#90 | 1.22%(-0.756)#5,940 |
| 91. | Jeffersonville | 0.45% | 1.06%(-0.609)#91 | 1.22%(-0.767)#5,995 |
| 92. | North Webster | 0.42% | 1.06%(-0.641)#92 | 1.22%(-0.799)#6,189 |
| 93. | Schererville | 0.41% | 1.06%(-0.648)#93 | 1.22%(-0.806)#6,225 |
| 94. | Dyer | 0.38% | 1.06%(-0.673)#94 | 1.22%(-0.831)#6,396 |
| 95. | Logansport | 0.38% | 1.06%(-0.677)#95 | 1.22%(-0.835)#6,430 |
| 96. | Lagrange | 0.36% | 1.06%(-0.698)#96 | 1.22%(-0.856)#6,557 |
| 97. | Seymour | 0.36% | 1.06%(-0.702)#97 | 1.22%(-0.860)#6,579 |
| 98. | Ridgeville | 0.35% | 1.06%(-0.708)#98 | 1.22%(-0.866)#6,627 |
| 99. | Trail Creek | 0.35% | 1.06%(-0.710)#99 | 1.22%(-0.868)#6,639 |
| 100. | Griffith | 0.35% | 1.06%(-0.711)#100 | 1.22%(-0.869)#6,650 |
Common Questions
What are the Top 10 Cities with the Highest Percentage of Subsaharan African Population in Indiana?
Top 10 Cities with the Highest Percentage of Subsaharan African Population in Indiana are:
#1
10.13%
#2
7.10%
#3
4.23%
#4
3.98%
#5
3.86%
#6
3.52%
#7
3.51%
#8
3.03%
#9
3.02%
#10
2.94%
What city has the Highest Percentage of Subsaharan African Population in Indiana?
Speedway has the Highest Percentage of Subsaharan African Population in Indiana with 10.13%.
What is the Percentage of Subsaharan African Population in the State of Indiana?
Percentage of Subsaharan African Population in Indiana is 1.06%.
What is the Percentage of Subsaharan African Population in the United States?
Percentage of Subsaharan African Population in the United States is 1.22%.