Cities with the Highest Percentage of Subsaharan African Population in New Mexico
RELATED REPORTS & OPTIONS
Subsaharan African
New Mexico
Compare Cities
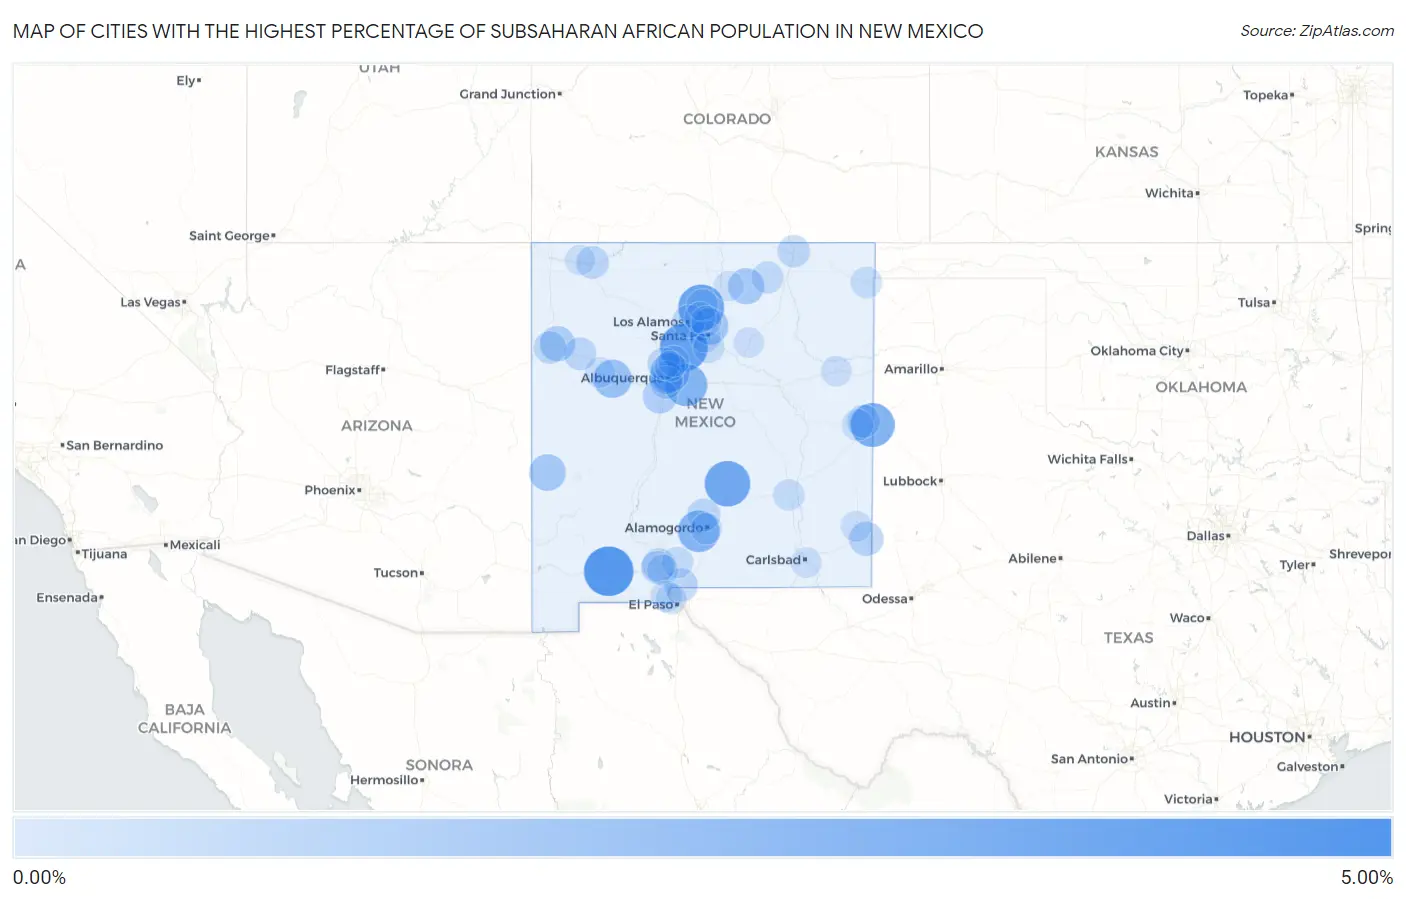
Map of Cities with the Highest Percentage of Subsaharan African Population in New Mexico
0.00%
5.00%
Cities with the Highest Percentage of Subsaharan African Population in New Mexico
| City | Subsaharan African | vs State | vs National | |
| 1. | Rio Rancho Estates | 4.62% | 0.38%(+4.24)#1 | 1.22%(+3.40)#715 |
| 2. | Ventura | 4.21% | 0.38%(+3.83)#2 | 1.22%(+2.99)#800 |
| 3. | Santo Domingo Pueblo | 3.81% | 0.38%(+3.43)#3 | 1.22%(+2.59)#919 |
| 4. | Alcalde | 3.40% | 0.38%(+3.02)#4 | 1.22%(+2.19)#1,043 |
| 5. | Capitan | 3.33% | 0.38%(+2.95)#5 | 1.22%(+2.12)#1,080 |
| 6. | Texico | 2.98% | 0.38%(+2.60)#6 | 1.22%(+1.76)#1,253 |
| 7. | Ponderosa Pine | 2.57% | 0.38%(+2.19)#7 | 1.22%(+1.35)#1,477 |
| 8. | Holloman Afb | 2.44% | 0.38%(+2.06)#8 | 1.22%(+1.22)#1,565 |
| 9. | North Valley | 1.94% | 0.38%(+1.56)#9 | 1.22%(+0.722)#2,038 |
| 10. | Acomita Lake | 1.79% | 0.38%(+1.40)#10 | 1.22%(+0.571)#2,228 |
| 11. | Chupadero | 1.40% | 0.38%(+1.02)#11 | 1.22%(+0.188)#2,861 |
| 12. | Reserve | 1.36% | 0.38%(+0.974)#12 | 1.22%(+0.140)#2,941 |
| 13. | Angel Fire | 1.25% | 0.38%(+0.865)#13 | 1.22%(+0.031)#3,166 |
| 14. | Center Point | 1.16% | 0.38%(+0.784)#14 | 1.22%(-0.051)#3,331 |
| 15. | Church Rock | 1.08% | 0.38%(+0.694)#15 | 1.22%(-0.140)#3,514 |
| 16. | Los Lunas | 0.93% | 0.38%(+0.547)#16 | 1.22%(-0.287)#3,943 |
| 17. | Hobbs | 0.86% | 0.38%(+0.479)#17 | 1.22%(-0.355)#4,152 |
| 18. | Albuquerque | 0.67% | 0.38%(+0.291)#18 | 1.22%(-0.543)#4,864 |
| 19. | Chaparral | 0.63% | 0.38%(+0.253)#19 | 1.22%(-0.581)#5,053 |
| 20. | Las Cruces | 0.63% | 0.38%(+0.252)#20 | 1.22%(-0.582)#5,058 |
| 21. | Tularosa | 0.58% | 0.38%(+0.198)#21 | 1.22%(-0.636)#5,285 |
| 22. | Clovis | 0.58% | 0.38%(+0.196)#22 | 1.22%(-0.638)#5,295 |
| 23. | South Valley | 0.56% | 0.38%(+0.180)#23 | 1.22%(-0.654)#5,376 |
| 24. | Los Alamos | 0.56% | 0.38%(+0.176)#24 | 1.22%(-0.658)#5,397 |
| 25. | Thoreau | 0.55% | 0.38%(+0.170)#25 | 1.22%(-0.664)#5,432 |
| 26. | Bloomfield | 0.54% | 0.38%(+0.157)#26 | 1.22%(-0.677)#5,490 |
| 27. | Fairacres | 0.53% | 0.38%(+0.153)#27 | 1.22%(-0.681)#5,515 |
| 28. | Rio Rancho | 0.51% | 0.38%(+0.130)#28 | 1.22%(-0.704)#5,643 |
| 29. | Cañoncito | 0.51% | 0.38%(+0.127)#29 | 1.22%(-0.707)#5,658 |
| 30. | Gallup | 0.48% | 0.38%(+0.099)#30 | 1.22%(-0.735)#5,835 |
| 31. | Raton | 0.46% | 0.38%(+0.082)#31 | 1.22%(-0.752)#5,924 |
| 32. | Cimarron | 0.37% | 0.38%(-0.013)#32 | 1.22%(-0.847)#6,503 |
| 33. | Santa Fe | 0.35% | 0.38%(-0.031)#33 | 1.22%(-0.865)#6,615 |
| 34. | Kirtland Afb | 0.34% | 0.38%(-0.042)#34 | 1.22%(-0.876)#6,708 |
| 35. | Clayton | 0.28% | 0.38%(-0.098)#35 | 1.22%(-0.932)#7,073 |
| 36. | Penasco | 0.28% | 0.38%(-0.099)#36 | 1.22%(-0.933)#7,078 |
| 37. | White Sands | 0.28% | 0.38%(-0.105)#37 | 1.22%(-0.939)#7,130 |
| 38. | Los Luceros | 0.27% | 0.38%(-0.107)#38 | 1.22%(-0.942)#7,145 |
| 39. | Roswell | 0.26% | 0.38%(-0.117)#39 | 1.22%(-0.951)#7,240 |
| 40. | Cannon Afb | 0.26% | 0.38%(-0.120)#40 | 1.22%(-0.954)#7,273 |
| 41. | Alamogordo | 0.25% | 0.38%(-0.133)#41 | 1.22%(-0.967)#7,360 |
| 42. | Eldorado At Santa Fe | 0.24% | 0.38%(-0.143)#42 | 1.22%(-0.977)#7,453 |
| 43. | University Park | 0.22% | 0.38%(-0.162)#43 | 1.22%(-0.996)#7,619 |
| 44. | Santa Teresa | 0.20% | 0.38%(-0.178)#44 | 1.22%(-1.01)#7,758 |
| 45. | Sunland Park | 0.18% | 0.38%(-0.202)#45 | 1.22%(-1.04)#7,970 |
| 46. | La Mesilla | 0.16% | 0.38%(-0.218)#46 | 1.22%(-1.05)#8,100 |
| 47. | Lovington | 0.16% | 0.38%(-0.224)#47 | 1.22%(-1.06)#8,142 |
| 48. | Espanola | 0.15% | 0.38%(-0.228)#48 | 1.22%(-1.06)#8,179 |
| 49. | Bernalillo | 0.14% | 0.38%(-0.241)#49 | 1.22%(-1.08)#8,289 |
| 50. | Tucumcari | 0.096% | 0.38%(-0.285)#50 | 1.22%(-1.12)#8,673 |
| 51. | Nambe | 0.092% | 0.38%(-0.289)#51 | 1.22%(-1.12)#8,707 |
| 52. | Las Vegas | 0.083% | 0.38%(-0.298)#52 | 1.22%(-1.13)#8,774 |
| 53. | Carlsbad | 0.082% | 0.38%(-0.299)#53 | 1.22%(-1.13)#8,790 |
| 54. | Grants | 0.065% | 0.38%(-0.316)#54 | 1.22%(-1.15)#8,914 |
| 55. | Corrales | 0.047% | 0.38%(-0.334)#55 | 1.22%(-1.17)#9,058 |
| 56. | Farmington | 0.034% | 0.38%(-0.347)#56 | 1.22%(-1.18)#9,136 |
| 57. | Taos | 0.015% | 0.38%(-0.366)#57 | 1.22%(-1.20)#9,247 |
Common Questions
What are the Top 10 Cities with the Highest Percentage of Subsaharan African Population in New Mexico?
Top 10 Cities with the Highest Percentage of Subsaharan African Population in New Mexico are:
#1
4.21%
#2
3.81%
#3
3.40%
#4
3.33%
#5
2.98%
#6
2.57%
#7
2.44%
#8
1.94%
#9
1.79%
#10
1.40%
What city has the Highest Percentage of Subsaharan African Population in New Mexico?
Ventura has the Highest Percentage of Subsaharan African Population in New Mexico with 4.21%.
What is the Percentage of Subsaharan African Population in the State of New Mexico?
Percentage of Subsaharan African Population in New Mexico is 0.38%.
What is the Percentage of Subsaharan African Population in the United States?
Percentage of Subsaharan African Population in the United States is 1.22%.