Cities with the Highest Percentage of Subsaharan African Population in Utah
RELATED REPORTS & OPTIONS
Subsaharan African
Utah
Compare Cities
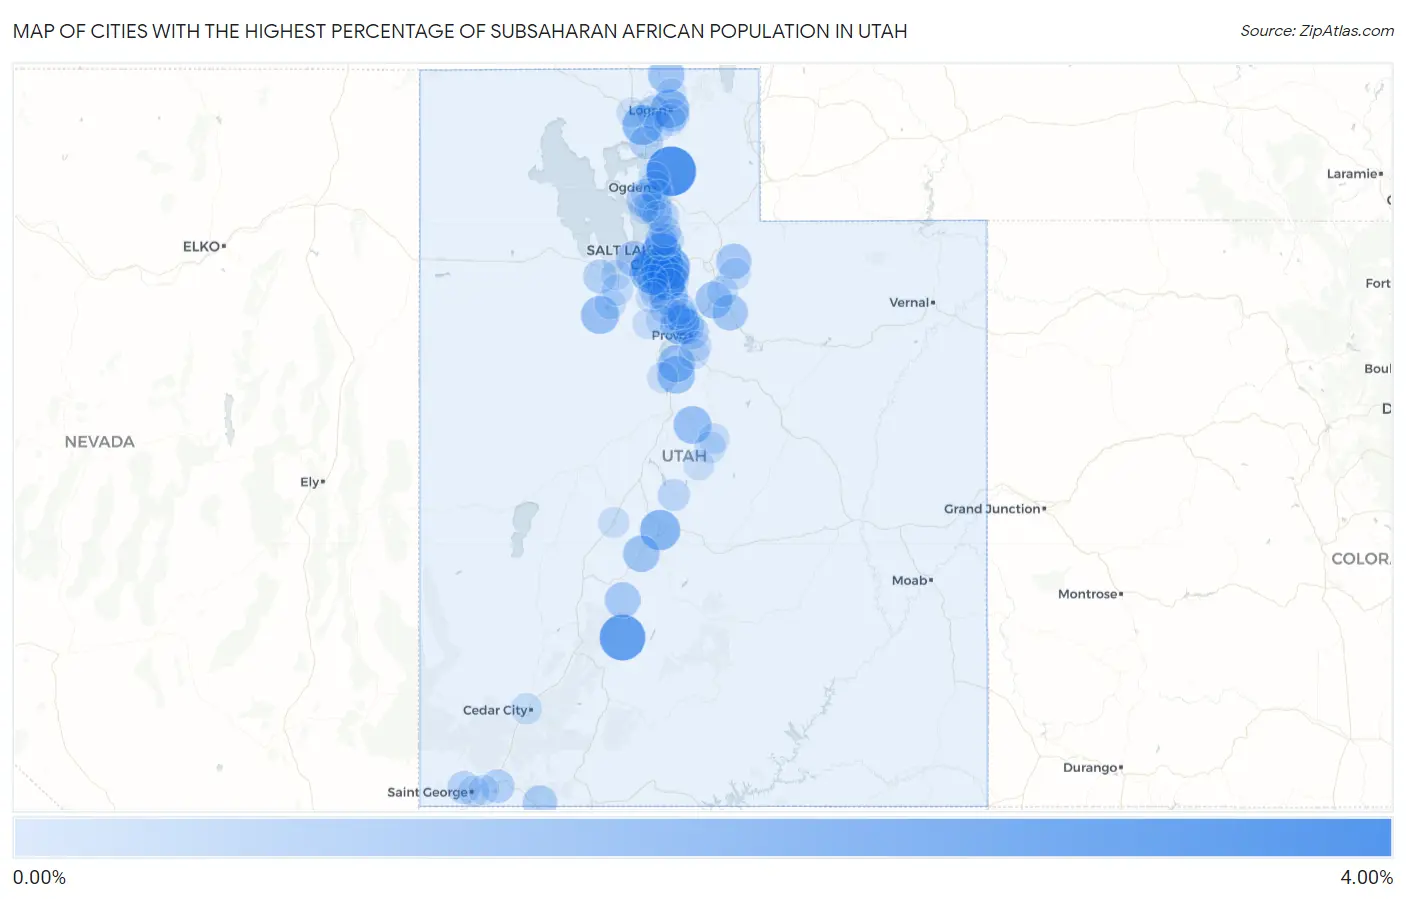
Map of Cities with the Highest Percentage of Subsaharan African Population in Utah
0.00%
4.00%
Cities with the Highest Percentage of Subsaharan African Population in Utah
| City | Subsaharan African | vs State | vs National | |
| 1. | Wolf Creek | 3.47% | 0.57%(+2.90)#1 | 1.22%(+2.26)#1,030 |
| 2. | Circleville | 2.78% | 0.57%(+2.21)#2 | 1.22%(+1.57)#1,350 |
| 3. | Millcreek | 2.19% | 0.57%(+1.62)#3 | 1.22%(+0.978)#1,771 |
| 4. | Midvale | 2.10% | 0.57%(+1.53)#4 | 1.22%(+0.888)#1,874 |
| 5. | Salt Lake City | 1.93% | 0.57%(+1.36)#5 | 1.22%(+0.719)#2,042 |
| 6. | Kearns | 1.82% | 0.57%(+1.24)#6 | 1.22%(+0.602)#2,192 |
| 7. | West Valley City | 1.78% | 0.57%(+1.21)#7 | 1.22%(+0.569)#2,233 |
| 8. | Aurora | 1.78% | 0.57%(+1.21)#8 | 1.22%(+0.567)#2,237 |
| 9. | Honeyville | 1.75% | 0.57%(+1.18)#9 | 1.22%(+0.534)#2,283 |
| 10. | South Salt Lake | 1.69% | 0.57%(+1.12)#10 | 1.22%(+0.480)#2,365 |
| 11. | Vineyard | 1.55% | 0.57%(+0.974)#11 | 1.22%(+0.333)#2,577 |
| 12. | Logan | 1.47% | 0.57%(+0.899)#12 | 1.22%(+0.257)#2,703 |
| 13. | Draper | 1.47% | 0.57%(+0.897)#13 | 1.22%(+0.256)#2,707 |
| 14. | Rush Valley | 1.37% | 0.57%(+0.799)#14 | 1.22%(+0.158)#2,901 |
| 15. | Fountain Green | 1.35% | 0.57%(+0.775)#15 | 1.22%(+0.134)#2,959 |
| 16. | Santaquin | 1.27% | 0.57%(+0.691)#16 | 1.22%(+0.050)#3,133 |
| 17. | West Mountain | 1.26% | 0.57%(+0.689)#17 | 1.22%(+0.048)#3,135 |
| 18. | Charleston | 1.14% | 0.57%(+0.568)#18 | 1.22%(-0.074)#3,375 |
| 19. | Richfield | 1.12% | 0.57%(+0.546)#19 | 1.22%(-0.095)#3,429 |
| 20. | Lewiston | 1.10% | 0.57%(+0.525)#20 | 1.22%(-0.117)#3,483 |
| 21. | Independence | 1.00% | 0.57%(+0.426)#21 | 1.22%(-0.215)#3,718 |
| 22. | Marysvale | 0.95% | 0.57%(+0.380)#22 | 1.22%(-0.261)#3,849 |
| 23. | Magna | 0.94% | 0.57%(+0.365)#23 | 1.22%(-0.276)#3,904 |
| 24. | Oakley | 0.92% | 0.57%(+0.344)#24 | 1.22%(-0.298)#3,980 |
| 25. | Orem | 0.91% | 0.57%(+0.334)#25 | 1.22%(-0.307)#4,007 |
| 26. | Clinton | 0.83% | 0.57%(+0.256)#26 | 1.22%(-0.386)#4,263 |
| 27. | Hildale | 0.74% | 0.57%(+0.170)#27 | 1.22%(-0.472)#4,579 |
| 28. | Mendon | 0.68% | 0.57%(+0.104)#28 | 1.22%(-0.537)#4,838 |
| 29. | Murray | 0.68% | 0.57%(+0.102)#29 | 1.22%(-0.540)#4,847 |
| 30. | Hurricane | 0.63% | 0.57%(+0.057)#30 | 1.22%(-0.584)#5,069 |
| 31. | Grantsville | 0.63% | 0.57%(+0.052)#31 | 1.22%(-0.589)#5,090 |
| 32. | Layton | 0.62% | 0.57%(+0.050)#32 | 1.22%(-0.591)#5,096 |
| 33. | Holladay | 0.61% | 0.57%(+0.038)#33 | 1.22%(-0.604)#5,151 |
| 34. | Brigham City | 0.57% | 0.57%(-0.008)#34 | 1.22%(-0.649)#5,345 |
| 35. | Woods Cross | 0.53% | 0.57%(-0.040)#35 | 1.22%(-0.682)#5,516 |
| 36. | Providence | 0.52% | 0.57%(-0.051)#36 | 1.22%(-0.692)#5,569 |
| 37. | White | 0.52% | 0.57%(-0.052)#37 | 1.22%(-0.694)#5,578 |
| 38. | Taylorsville | 0.52% | 0.57%(-0.053)#38 | 1.22%(-0.694)#5,583 |
| 39. | Provo | 0.51% | 0.57%(-0.060)#39 | 1.22%(-0.701)#5,628 |
| 40. | Santa Clara | 0.50% | 0.57%(-0.076)#40 | 1.22%(-0.717)#5,710 |
| 41. | Cottonwood Heights | 0.48% | 0.57%(-0.093)#41 | 1.22%(-0.734)#5,825 |
| 42. | Sandy | 0.47% | 0.57%(-0.103)#42 | 1.22%(-0.745)#5,881 |
| 43. | Fruit Heights | 0.47% | 0.57%(-0.109)#43 | 1.22%(-0.750)#5,915 |
| 44. | Ogden | 0.45% | 0.57%(-0.124)#44 | 1.22%(-0.766)#5,989 |
| 45. | Bountiful | 0.43% | 0.57%(-0.142)#45 | 1.22%(-0.783)#6,095 |
| 46. | North Salt Lake | 0.39% | 0.57%(-0.185)#46 | 1.22%(-0.827)#6,370 |
| 47. | Lindon | 0.38% | 0.57%(-0.191)#47 | 1.22%(-0.832)#6,401 |
| 48. | Gunnison | 0.34% | 0.57%(-0.233)#48 | 1.22%(-0.874)#6,690 |
| 49. | Centerville | 0.32% | 0.57%(-0.251)#49 | 1.22%(-0.893)#6,811 |
| 50. | Cedar Hills | 0.31% | 0.57%(-0.263)#50 | 1.22%(-0.904)#6,886 |
| 51. | Nibley | 0.27% | 0.57%(-0.303)#51 | 1.22%(-0.944)#7,175 |
| 52. | Spring City | 0.27% | 0.57%(-0.303)#52 | 1.22%(-0.944)#7,178 |
| 53. | Kamas | 0.25% | 0.57%(-0.325)#53 | 1.22%(-0.966)#7,355 |
| 54. | Clearfield | 0.24% | 0.57%(-0.336)#54 | 1.22%(-0.977)#7,452 |
| 55. | Stockton | 0.22% | 0.57%(-0.355)#55 | 1.22%(-0.997)#7,621 |
| 56. | Heber | 0.21% | 0.57%(-0.361)#56 | 1.22%(-1.00)#7,680 |
| 57. | South Jordan | 0.20% | 0.57%(-0.369)#57 | 1.22%(-1.01)#7,744 |
| 58. | Cedar City | 0.20% | 0.57%(-0.373)#58 | 1.22%(-1.01)#7,776 |
| 59. | St George | 0.20% | 0.57%(-0.377)#59 | 1.22%(-1.02)#7,807 |
| 60. | Tooele | 0.20% | 0.57%(-0.378)#60 | 1.22%(-1.02)#7,817 |
| 61. | Mount Pleasant | 0.19% | 0.57%(-0.383)#61 | 1.22%(-1.02)#7,865 |
| 62. | Harrisville | 0.19% | 0.57%(-0.386)#62 | 1.22%(-1.03)#7,885 |
| 63. | Herriman | 0.16% | 0.57%(-0.415)#63 | 1.22%(-1.06)#8,132 |
| 64. | West Jordan | 0.16% | 0.57%(-0.415)#64 | 1.22%(-1.06)#8,135 |
| 65. | Fillmore | 0.16% | 0.57%(-0.418)#65 | 1.22%(-1.06)#8,151 |
| 66. | Ephraim | 0.14% | 0.57%(-0.434)#66 | 1.22%(-1.08)#8,295 |
| 67. | Roy | 0.14% | 0.57%(-0.438)#67 | 1.22%(-1.08)#8,314 |
| 68. | Spanish Fork | 0.13% | 0.57%(-0.445)#68 | 1.22%(-1.09)#8,374 |
| 69. | Springville | 0.13% | 0.57%(-0.449)#69 | 1.22%(-1.09)#8,406 |
| 70. | Goshen | 0.12% | 0.57%(-0.458)#70 | 1.22%(-1.10)#8,496 |
| 71. | South Ogden | 0.11% | 0.57%(-0.459)#71 | 1.22%(-1.10)#8,505 |
| 72. | American Fork | 0.11% | 0.57%(-0.462)#72 | 1.22%(-1.10)#8,526 |
| 73. | Kaysville | 0.11% | 0.57%(-0.467)#73 | 1.22%(-1.11)#8,573 |
| 74. | Saratoga Springs | 0.092% | 0.57%(-0.482)#74 | 1.22%(-1.12)#8,713 |
| 75. | Eagle Mountain | 0.085% | 0.57%(-0.489)#75 | 1.22%(-1.13)#8,765 |
| 76. | Smithfield | 0.081% | 0.57%(-0.493)#76 | 1.22%(-1.13)#8,801 |
| 77. | Wellsville | 0.074% | 0.57%(-0.500)#77 | 1.22%(-1.14)#8,850 |
| 78. | Lehi | 0.073% | 0.57%(-0.501)#78 | 1.22%(-1.14)#8,863 |
| 79. | Washington | 0.062% | 0.57%(-0.512)#79 | 1.22%(-1.15)#8,936 |
| 80. | Stansbury Park | 0.057% | 0.57%(-0.517)#80 | 1.22%(-1.16)#8,977 |
| 81. | Pleasant Grove | 0.048% | 0.57%(-0.526)#81 | 1.22%(-1.17)#9,049 |
| 82. | Riverton | 0.031% | 0.57%(-0.543)#82 | 1.22%(-1.18)#9,159 |
| 83. | Syracuse | 0.027% | 0.57%(-0.546)#83 | 1.22%(-1.19)#9,180 |
| 84. | Tremonton | 0.019% | 0.57%(-0.554)#84 | 1.22%(-1.20)#9,226 |
Common Questions
What are the Top 10 Cities with the Highest Percentage of Subsaharan African Population in Utah?
Top 10 Cities with the Highest Percentage of Subsaharan African Population in Utah are:
#1
3.47%
#2
2.78%
#3
2.19%
#4
2.10%
#5
1.93%
#6
1.82%
#7
1.78%
#8
1.78%
#9
1.75%
#10
1.69%
What city has the Highest Percentage of Subsaharan African Population in Utah?
Wolf Creek has the Highest Percentage of Subsaharan African Population in Utah with 3.47%.
What is the Percentage of Subsaharan African Population in the State of Utah?
Percentage of Subsaharan African Population in Utah is 0.57%.
What is the Percentage of Subsaharan African Population in the United States?
Percentage of Subsaharan African Population in the United States is 1.22%.