Lathrop, CA Map & Demographics
Lathrop Map
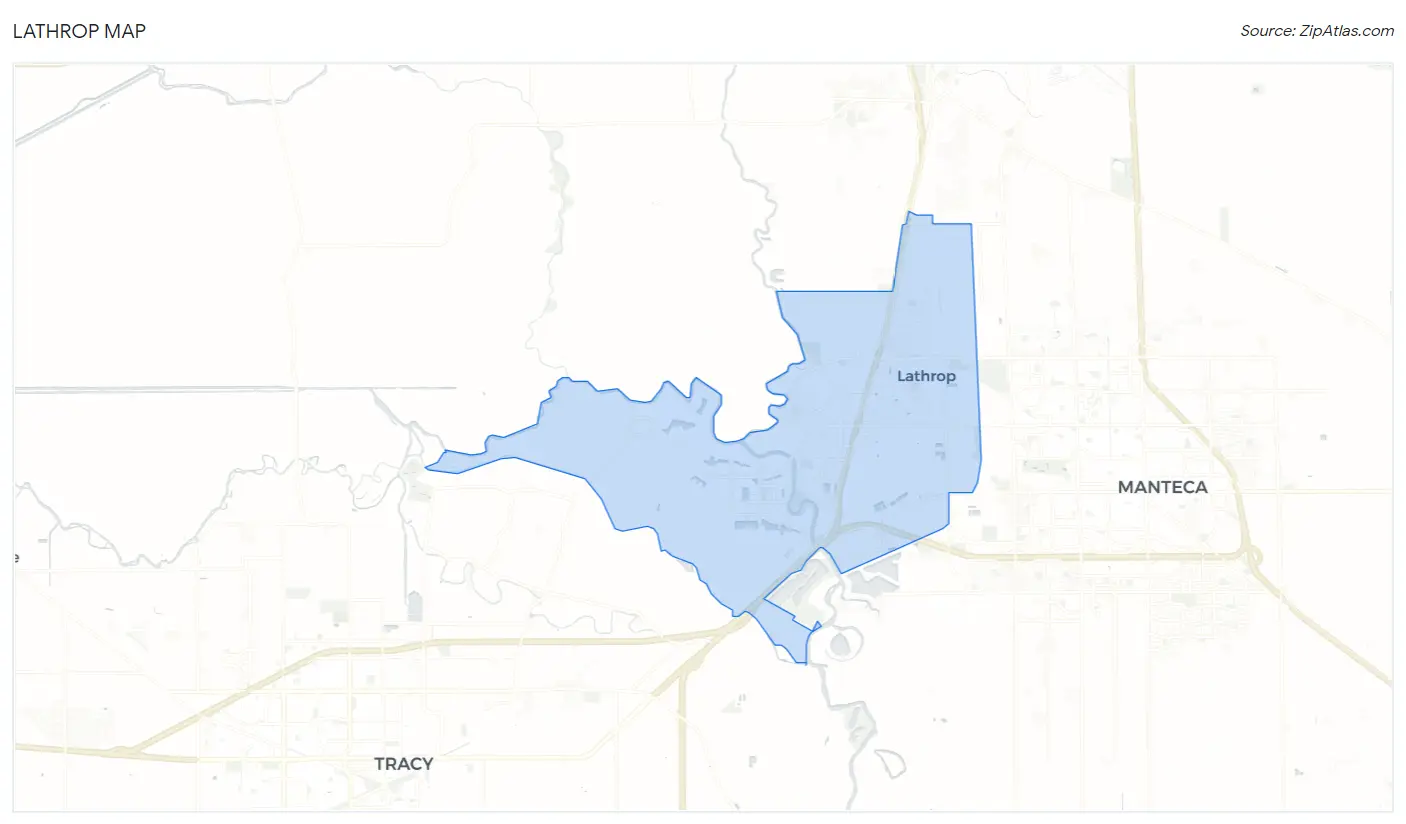
Lathrop Overview
$33,980
PER CAPITA INCOME
$112,971
AVG FAMILY INCOME
$108,732
AVG HOUSEHOLD INCOME
39.4%
WAGE / INCOME GAP [ % ]
60.6¢/ $1
WAGE / INCOME GAP [ $ ]
$14,739
FAMILY INCOME DEFICIT
0.41
INEQUALITY / GINI INDEX
29,633
TOTAL POPULATION
14,812
MALE POPULATION
14,821
FEMALE POPULATION
99.94
MALES / 100 FEMALES
100.06
FEMALES / 100 MALES
33.5
MEDIAN AGE
4.2
AVG FAMILY SIZE
4.0
AVG HOUSEHOLD SIZE
14,088
LABOR FORCE [ PEOPLE ]
64.7%
PERCENT IN LABOR FORCE
8.9%
UNEMPLOYMENT RATE
Lathrop Zip Codes
Lathrop Area Codes
Income in Lathrop
Income Overview in Lathrop
Per Capita Income in Lathrop is $33,980, while median incomes of families and households are $112,971 and $108,732 respectively.
| Characteristic | Number | Measure |
| Per Capita Income | 29,633 | $33,980 |
| Median Family Income | 6,322 | $112,971 |
| Mean Family Income | 6,322 | $133,019 |
| Median Household Income | 7,359 | $108,732 |
| Mean Household Income | 7,359 | $129,578 |
| Income Deficit | 6,322 | $14,739 |
| Wage / Income Gap (%) | 29,633 | 39.42% |
| Wage / Income Gap ($) | 29,633 | 60.58¢ per $1 |
| Gini / Inequality Index | 29,633 | 0.41 |
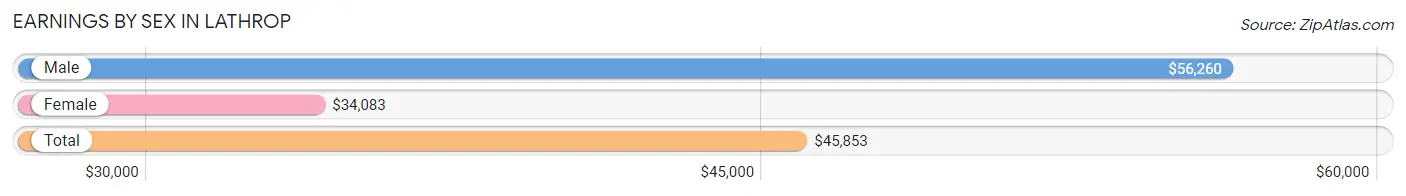
Earnings by Sex in Lathrop
Average Earnings in Lathrop are $45,853, $56,260 for men and $34,083 for women, a difference of 39.4%.
| Sex | Number | Average Earnings |
| Male | 8,114 (56.8%) | $56,260 |
| Female | 6,175 (43.2%) | $34,083 |
| Total | 14,289 (100.0%) | $45,853 |
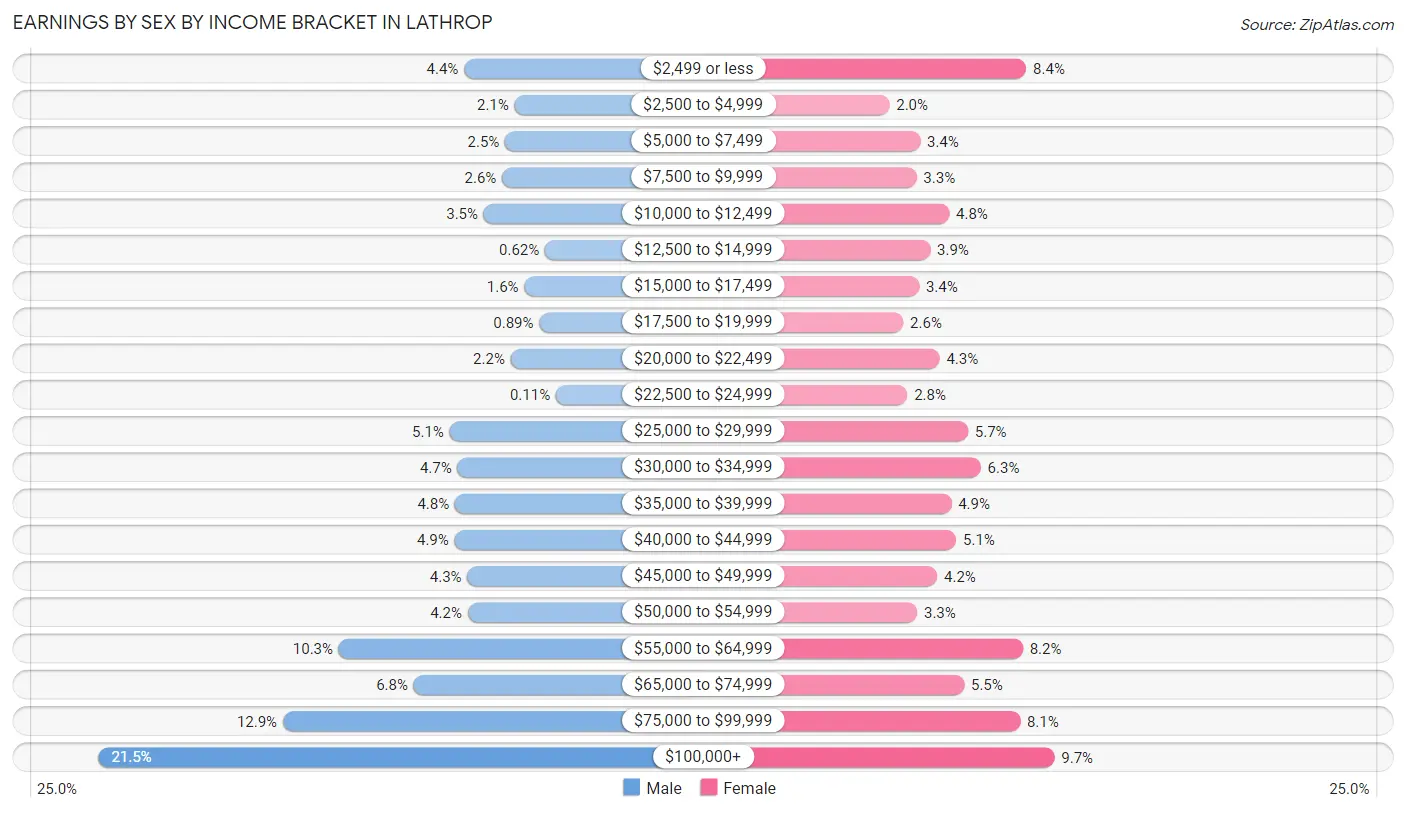
Earnings by Sex by Income Bracket in Lathrop
The most common earnings brackets in Lathrop are $100,000+ for men (1,748 | 21.5%) and $100,000+ for women (600 | 9.7%).
| Income | Male | Female |
| $2,499 or less | 358 (4.4%) | 519 (8.4%) |
| $2,500 to $4,999 | 166 (2.1%) | 123 (2.0%) |
| $5,000 to $7,499 | 202 (2.5%) | 212 (3.4%) |
| $7,500 to $9,999 | 213 (2.6%) | 201 (3.3%) |
| $10,000 to $12,499 | 283 (3.5%) | 296 (4.8%) |
| $12,500 to $14,999 | 50 (0.6%) | 241 (3.9%) |
| $15,000 to $17,499 | 129 (1.6%) | 209 (3.4%) |
| $17,500 to $19,999 | 72 (0.9%) | 163 (2.6%) |
| $20,000 to $22,499 | 181 (2.2%) | 268 (4.3%) |
| $22,500 to $24,999 | 9 (0.1%) | 175 (2.8%) |
| $25,000 to $29,999 | 413 (5.1%) | 350 (5.7%) |
| $30,000 to $34,999 | 383 (4.7%) | 387 (6.3%) |
| $35,000 to $39,999 | 393 (4.8%) | 302 (4.9%) |
| $40,000 to $44,999 | 394 (4.9%) | 316 (5.1%) |
| $45,000 to $49,999 | 346 (4.3%) | 261 (4.2%) |
| $50,000 to $54,999 | 344 (4.2%) | 203 (3.3%) |
| $55,000 to $64,999 | 834 (10.3%) | 509 (8.2%) |
| $65,000 to $74,999 | 549 (6.8%) | 339 (5.5%) |
| $75,000 to $99,999 | 1,047 (12.9%) | 501 (8.1%) |
| $100,000+ | 1,748 (21.5%) | 600 (9.7%) |
| Total | 8,114 (100.0%) | 6,175 (100.0%) |
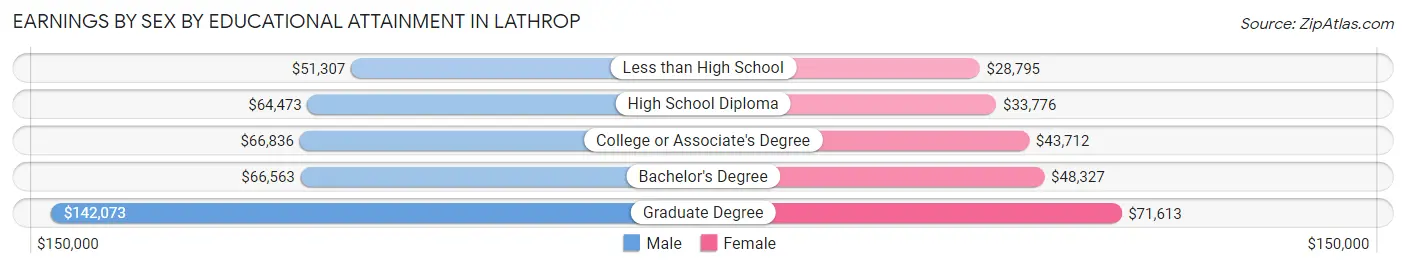
Earnings by Sex by Educational Attainment in Lathrop
Average earnings in Lathrop are $62,616 for men and $40,653 for women, a difference of 35.1%. Men with an educational attainment of graduate degree enjoy the highest average annual earnings of $142,073, while those with less than high school education earn the least with $51,307. Women with an educational attainment of graduate degree earn the most with the average annual earnings of $71,613, while those with less than high school education have the smallest earnings of $28,795.
| Educational Attainment | Male Income | Female Income |
| Less than High School | $51,307 | $28,795 |
| High School Diploma | $64,473 | $33,776 |
| College or Associate's Degree | $66,836 | $43,712 |
| Bachelor's Degree | $66,563 | $48,327 |
| Graduate Degree | $142,073 | $71,613 |
| Total | $62,616 | $40,653 |
Family Income in Lathrop
Family Income Brackets in Lathrop
According to the Lathrop family income data, there are 1,593 families falling into the $100,000 to $149,999 income range, which is the most common income bracket and makes up 25.2% of all families. Conversely, the $10,000 to $14,999 income bracket is the least frequent group with only 38 families (0.6%) belonging to this category.
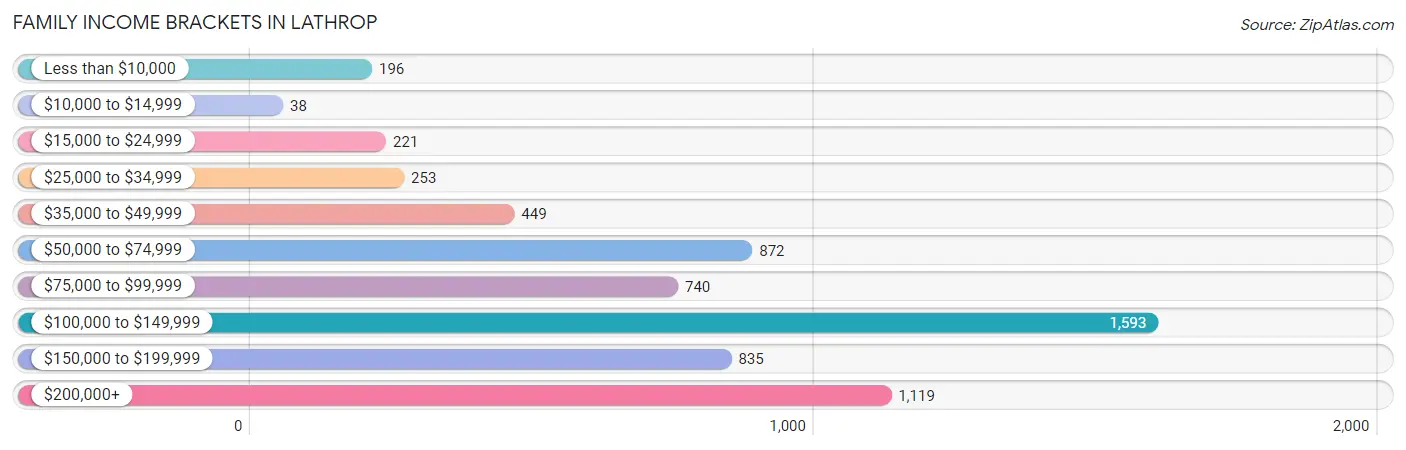
| Income Bracket | # Families | % Families |
| Less than $10,000 | 196 | 3.1% |
| $10,000 to $14,999 | 38 | 0.6% |
| $15,000 to $24,999 | 221 | 3.5% |
| $25,000 to $34,999 | 253 | 4.0% |
| $35,000 to $49,999 | 449 | 7.1% |
| $50,000 to $74,999 | 872 | 13.8% |
| $75,000 to $99,999 | 740 | 11.7% |
| $100,000 to $149,999 | 1,593 | 25.2% |
| $150,000 to $199,999 | 835 | 13.2% |
| $200,000+ | 1,119 | 17.7% |
Family Income by Famaliy Size in Lathrop
6-person families (635 | 10.0%) account for the highest median family income in Lathrop with $160,703 per family, while 2-person families (1,443 | 22.8%) have the highest median income of $34,487 per family member.
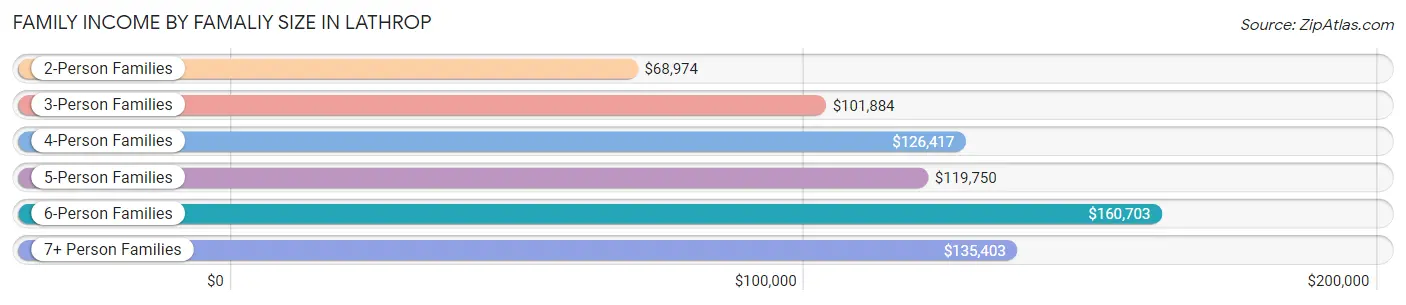
| Income Bracket | # Families | Median Income |
| 2-Person Families | 1,443 (22.8%) | $68,974 |
| 3-Person Families | 1,291 (20.4%) | $101,884 |
| 4-Person Families | 1,577 (24.9%) | $126,417 |
| 5-Person Families | 1,048 (16.6%) | $119,750 |
| 6-Person Families | 635 (10.0%) | $160,703 |
| 7+ Person Families | 328 (5.2%) | $135,403 |
| Total | 6,322 (100.0%) | $112,971 |
Family Income by Number of Earners in Lathrop
The median family income in Lathrop is $112,971, with families comprising 3+ earners (1,452) having the highest median family income of $170,385, while families with no earners (343) have the lowest median family income of $35,795, accounting for 23.0% and 5.4% of families, respectively.
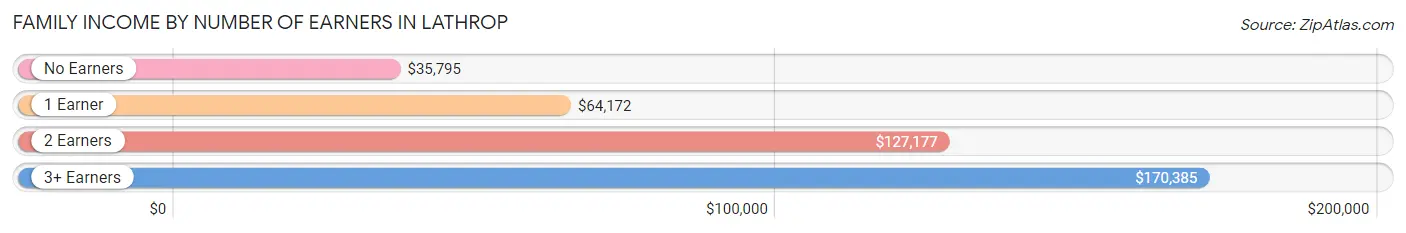
| Number of Earners | # Families | Median Income |
| No Earners | 343 (5.4%) | $35,795 |
| 1 Earner | 2,269 (35.9%) | $64,172 |
| 2 Earners | 2,258 (35.7%) | $127,177 |
| 3+ Earners | 1,452 (23.0%) | $170,385 |
| Total | 6,322 (100.0%) | $112,971 |
Household Income in Lathrop
Household Income Brackets in Lathrop
With 1,818 households falling in the category, the $100,000 to $149,999 income range is the most frequent in Lathrop, accounting for 24.7% of all households. In contrast, only 81 households (1.1%) fall into the $10,000 to $14,999 income bracket, making it the least populous group.
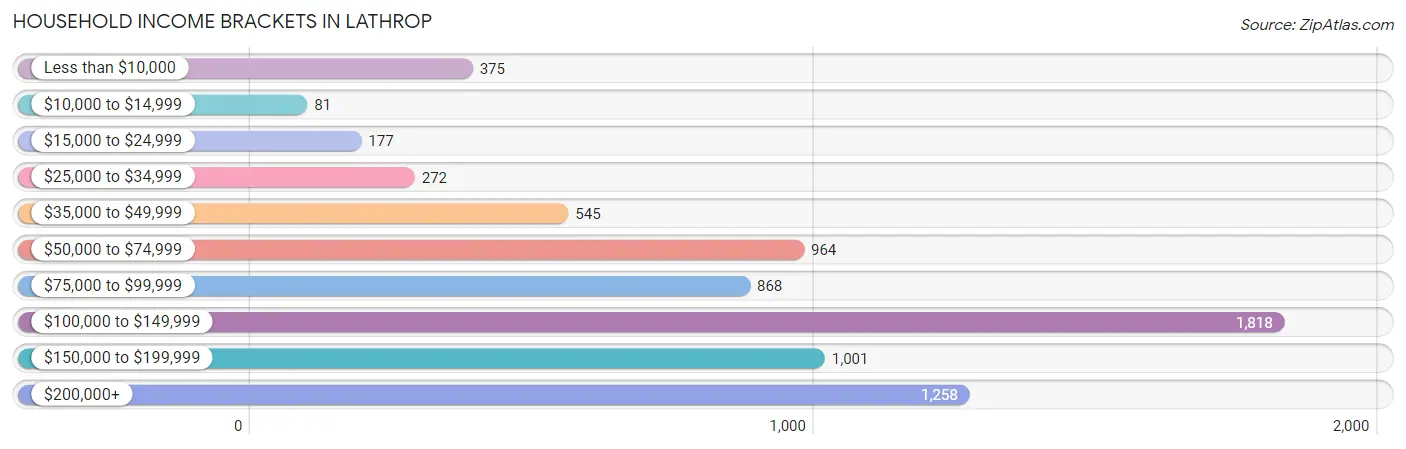
| Income Bracket | # Households | % Households |
| Less than $10,000 | 375 | 5.1% |
| $10,000 to $14,999 | 81 | 1.1% |
| $15,000 to $24,999 | 177 | 2.4% |
| $25,000 to $34,999 | 272 | 3.7% |
| $35,000 to $49,999 | 545 | 7.4% |
| $50,000 to $74,999 | 964 | 13.1% |
| $75,000 to $99,999 | 868 | 11.8% |
| $100,000 to $149,999 | 1,818 | 24.7% |
| $150,000 to $199,999 | 1,001 | 13.6% |
| $200,000+ | 1,258 | 17.1% |
Household Income by Householder Age in Lathrop
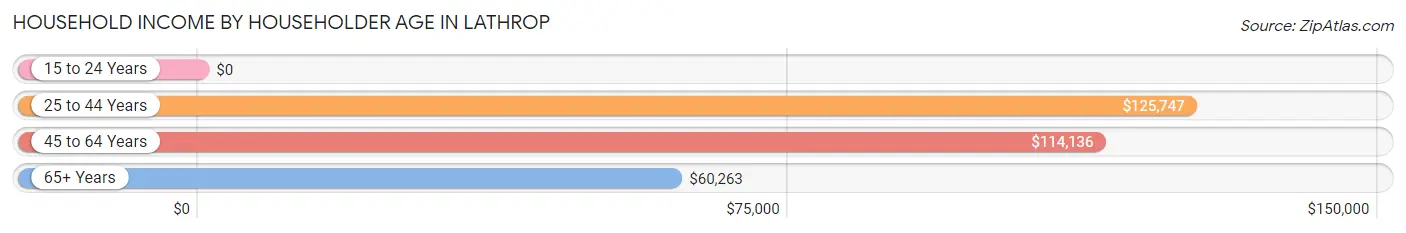
The median household income in Lathrop is $108,732, with the highest median household income of $125,747 found in the 25 to 44 years age bracket for the primary householder. A total of 2,957 households (40.2%) fall into this category. Meanwhile, the 15 to 24 years age bracket for the primary householder has the lowest median household income of $0, with 20 households (0.3%) in this group.
| Income Bracket | # Households | Median Income |
| 15 to 24 Years | 20 (0.3%) | $0 |
| 25 to 44 Years | 2,957 (40.2%) | $125,747 |
| 45 to 64 Years | 3,256 (44.3%) | $114,136 |
| 65+ Years | 1,126 (15.3%) | $60,263 |
| Total | 7,359 (100.0%) | $108,732 |
Poverty in Lathrop
Income Below Poverty by Sex and Age in Lathrop
With 6.9% poverty level for males and 10.2% for females among the residents of Lathrop, 15 year old males and 25 to 34 year old females are the most vulnerable to poverty, with 48 males (19.3%) and 335 females (17.4%) in their respective age groups living below the poverty level.
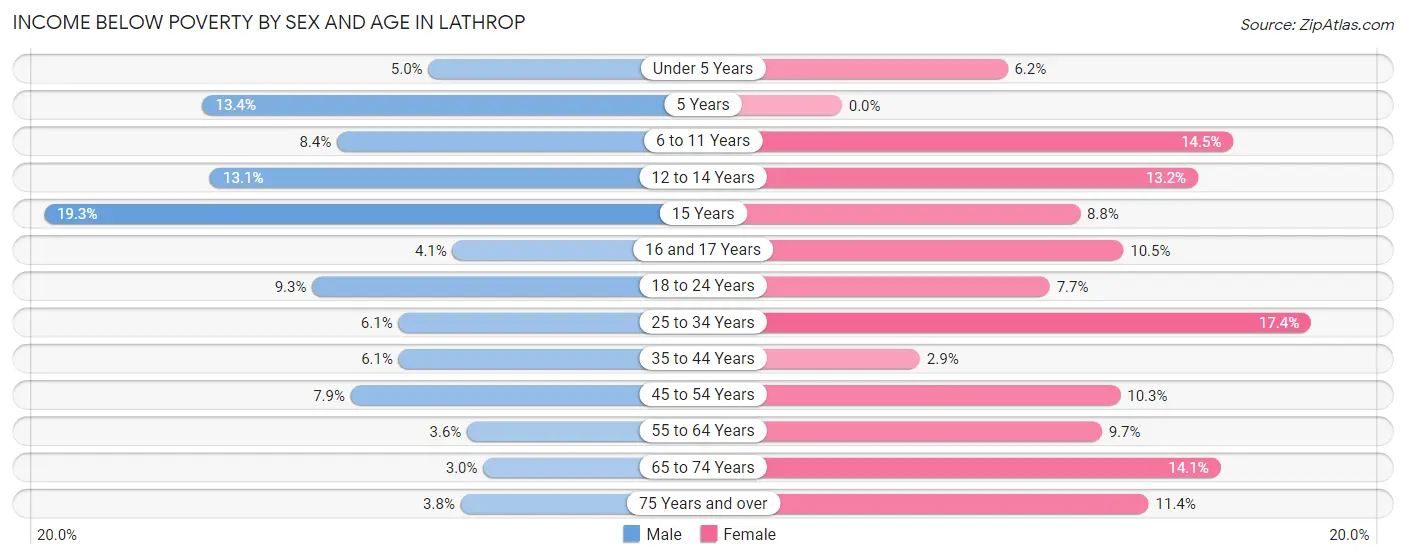
| Age Bracket | Male | Female |
| Under 5 Years | 63 (5.0%) | 57 (6.1%) |
| 5 Years | 30 (13.4%) | 0 (0.0%) |
| 6 to 11 Years | 93 (8.4%) | 179 (14.5%) |
| 12 to 14 Years | 119 (13.1%) | 89 (13.2%) |
| 15 Years | 48 (19.3%) | 26 (8.8%) |
| 16 and 17 Years | 24 (4.1%) | 30 (10.4%) |
| 18 to 24 Years | 120 (9.3%) | 110 (7.7%) |
| 25 to 34 Years | 116 (6.1%) | 335 (17.4%) |
| 35 to 44 Years | 132 (6.1%) | 64 (2.9%) |
| 45 to 54 Years | 156 (7.9%) | 193 (10.3%) |
| 55 to 64 Years | 60 (3.6%) | 144 (9.7%) |
| 65 to 74 Years | 28 (3.0%) | 157 (14.1%) |
| 75 Years and over | 11 (3.8%) | 72 (11.4%) |
| Total | 1,000 (6.9%) | 1,456 (10.2%) |
Income Above Poverty by Sex and Age in Lathrop
According to the poverty statistics in Lathrop, males aged 65 to 74 years and females aged 5 years are the age groups that are most secure financially, with 97.0% of males and 100.0% of females in these age groups living above the poverty line.
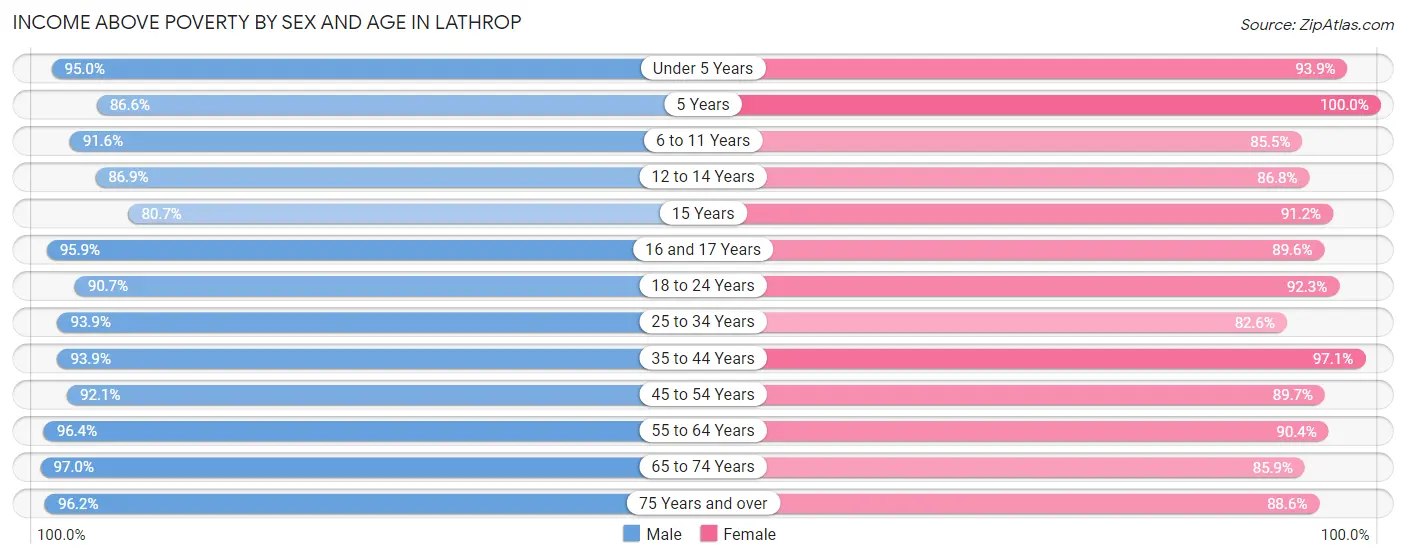
| Age Bracket | Male | Female |
| Under 5 Years | 1,195 (95.0%) | 870 (93.9%) |
| 5 Years | 194 (86.6%) | 246 (100.0%) |
| 6 to 11 Years | 1,014 (91.6%) | 1,053 (85.5%) |
| 12 to 14 Years | 789 (86.9%) | 584 (86.8%) |
| 15 Years | 201 (80.7%) | 268 (91.2%) |
| 16 and 17 Years | 560 (95.9%) | 257 (89.5%) |
| 18 to 24 Years | 1,168 (90.7%) | 1,314 (92.3%) |
| 25 to 34 Years | 1,778 (93.9%) | 1,588 (82.6%) |
| 35 to 44 Years | 2,029 (93.9%) | 2,140 (97.1%) |
| 45 to 54 Years | 1,821 (92.1%) | 1,674 (89.7%) |
| 55 to 64 Years | 1,623 (96.4%) | 1,348 (90.3%) |
| 65 to 74 Years | 916 (97.0%) | 960 (85.9%) |
| 75 Years and over | 278 (96.2%) | 560 (88.6%) |
| Total | 13,566 (93.1%) | 12,862 (89.8%) |
Income Below Poverty Among Married-Couple Families in Lathrop
The poverty statistics for married-couple families in Lathrop show that 5.5% or 265 of the total 4,792 families live below the poverty line. Families with 3 or 4 children have the highest poverty rate of 8.6%, comprising of 52 families. On the other hand, families with 5 or more children have the lowest poverty rate of 0.0%, which includes 0 families.
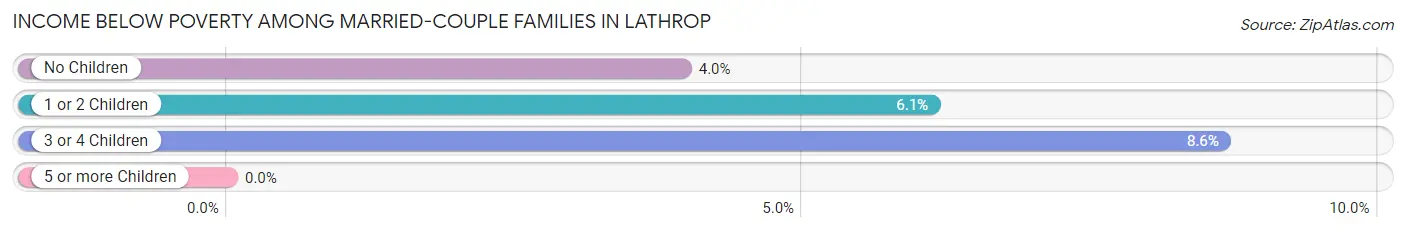
| Children | Above Poverty | Below Poverty |
| No Children | 1,728 (96.1%) | 71 (4.0%) |
| 1 or 2 Children | 2,183 (93.9%) | 142 (6.1%) |
| 3 or 4 Children | 550 (91.4%) | 52 (8.6%) |
| 5 or more Children | 66 (100.0%) | 0 (0.0%) |
| Total | 4,527 (94.5%) | 265 (5.5%) |
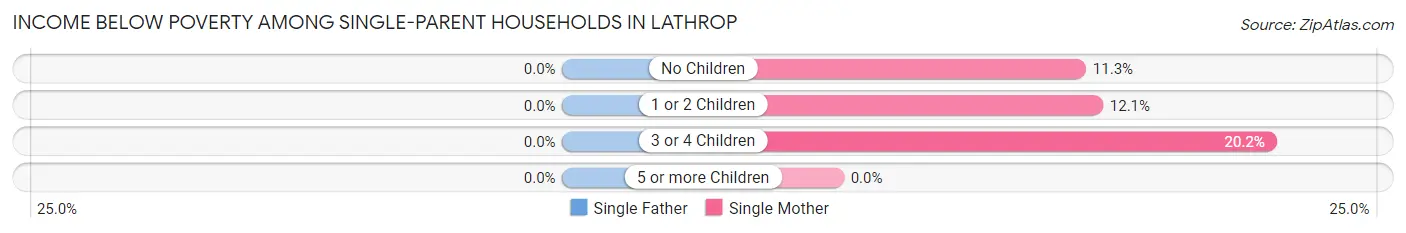
Income Below Poverty Among Single-Parent Households in Lathrop
| Children | Single Father | Single Mother |
| No Children | 0 (0.0%) | 29 (11.3%) |
| 1 or 2 Children | 0 (0.0%) | 63 (12.1%) |
| 3 or 4 Children | 0 (0.0%) | 25 (20.2%) |
| 5 or more Children | 0 (0.0%) | 0 (0.0%) |
| Total | 0 (0.0%) | 117 (12.8%) |
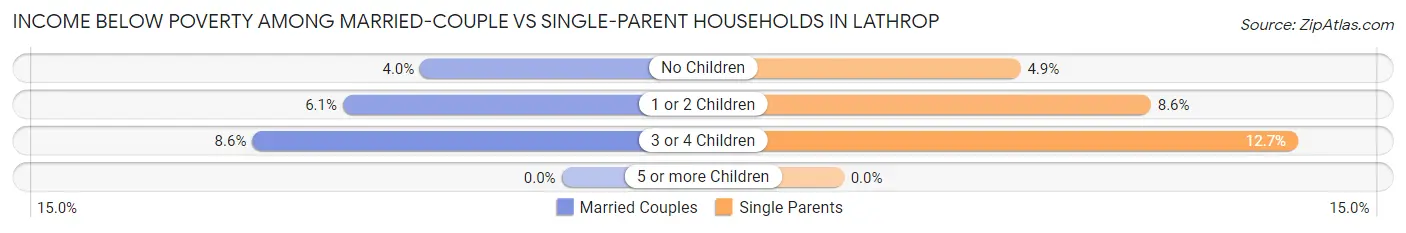
Income Below Poverty Among Married-Couple vs Single-Parent Households in Lathrop
The poverty data for Lathrop shows that 265 of the married-couple family households (5.5%) and 117 of the single-parent households (7.6%) are living below the poverty level. Within the married-couple family households, those with 3 or 4 children have the highest poverty rate, with 52 households (8.6%) falling below the poverty line. Among the single-parent households, those with 3 or 4 children have the highest poverty rate, with 25 household (12.7%) living below poverty.
| Children | Married-Couple Families | Single-Parent Households |
| No Children | 71 (4.0%) | 29 (4.9%) |
| 1 or 2 Children | 142 (6.1%) | 63 (8.6%) |
| 3 or 4 Children | 52 (8.6%) | 25 (12.7%) |
| 5 or more Children | 0 (0.0%) | 0 (0.0%) |
| Total | 265 (5.5%) | 117 (7.6%) |
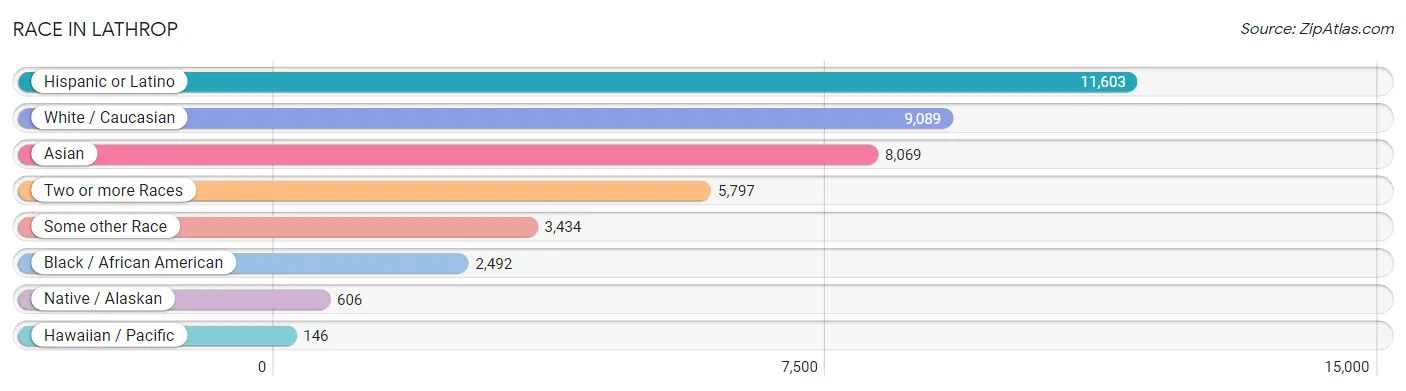
Race in Lathrop
The most populous races in Lathrop are Hispanic or Latino (11,603 | 39.2%), White / Caucasian (9,089 | 30.7%), and Asian (8,069 | 27.2%).
| Race | # Population | % Population |
| Asian | 8,069 | 27.2% |
| Black / African American | 2,492 | 8.4% |
| Hawaiian / Pacific | 146 | 0.5% |
| Hispanic or Latino | 11,603 | 39.2% |
| Native / Alaskan | 606 | 2.1% |
| White / Caucasian | 9,089 | 30.7% |
| Two or more Races | 5,797 | 19.6% |
| Some other Race | 3,434 | 11.6% |
| Total | 29,633 | 100.0% |
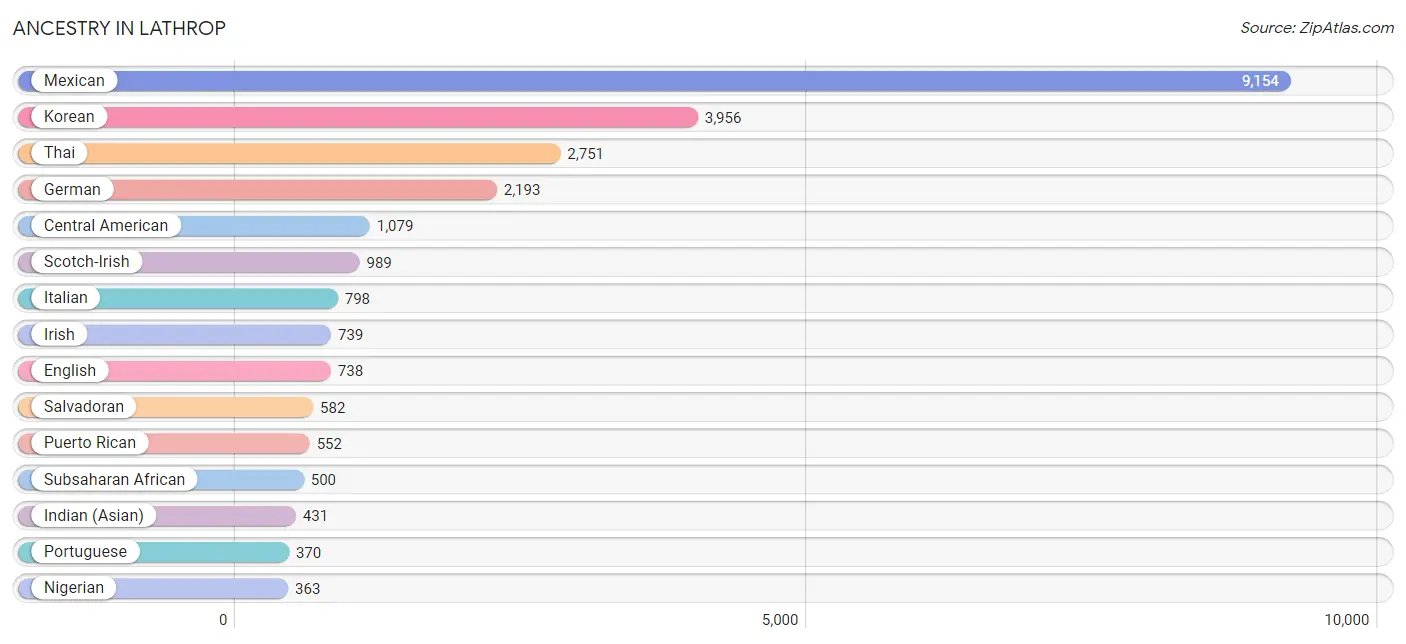
Ancestry in Lathrop
The most populous ancestries reported in Lathrop are Mexican (9,154 | 30.9%), Korean (3,956 | 13.4%), Thai (2,751 | 9.3%), German (2,193 | 7.4%), and Central American (1,079 | 3.6%), together accounting for 64.6% of all Lathrop residents.
| Ancestry | # Population | % Population |
| Afghan | 50 | 0.2% |
| African | 126 | 0.4% |
| American | 349 | 1.2% |
| Apache | 246 | 0.8% |
| Arab | 203 | 0.7% |
| Australian | 23 | 0.1% |
| Bangladeshi | 31 | 0.1% |
| Basque | 19 | 0.1% |
| Bhutanese | 152 | 0.5% |
| Brazilian | 25 | 0.1% |
| British | 205 | 0.7% |
| Burmese | 47 | 0.2% |
| Central American | 1,079 | 3.6% |
| Central American Indian | 82 | 0.3% |
| Cherokee | 195 | 0.7% |
| Colombian | 67 | 0.2% |
| Cuban | 26 | 0.1% |
| Czech | 35 | 0.1% |
| Danish | 253 | 0.9% |
| Dutch | 173 | 0.6% |
| Eastern European | 29 | 0.1% |
| Ecuadorian | 11 | 0.0% |
| English | 738 | 2.5% |
| European | 158 | 0.5% |
| French | 151 | 0.5% |
| German | 2,193 | 7.4% |
| German Russian | 19 | 0.1% |
| Greek | 28 | 0.1% |
| Guamanian / Chamorro | 5 | 0.0% |
| Guatemalan | 191 | 0.6% |
| Honduran | 89 | 0.3% |
| Hungarian | 36 | 0.1% |
| Indian (Asian) | 431 | 1.5% |
| Indonesian | 186 | 0.6% |
| Iranian | 14 | 0.1% |
| Irish | 739 | 2.5% |
| Italian | 798 | 2.7% |
| Jamaican | 21 | 0.1% |
| Japanese | 67 | 0.2% |
| Korean | 3,956 | 13.4% |
| Laotian | 19 | 0.1% |
| Malaysian | 253 | 0.9% |
| Mexican | 9,154 | 30.9% |
| Mexican American Indian | 44 | 0.2% |
| Native Hawaiian | 57 | 0.2% |
| Nicaraguan | 186 | 0.6% |
| Nigerian | 363 | 1.2% |
| Norwegian | 131 | 0.4% |
| Pakistani | 90 | 0.3% |
| Palestinian | 70 | 0.2% |
| Panamanian | 31 | 0.1% |
| Peruvian | 187 | 0.6% |
| Polish | 277 | 0.9% |
| Portuguese | 370 | 1.3% |
| Puerto Rican | 552 | 1.9% |
| Russian | 55 | 0.2% |
| Salvadoran | 582 | 2.0% |
| Samoan | 49 | 0.2% |
| Scandinavian | 114 | 0.4% |
| Scotch-Irish | 989 | 3.3% |
| Scottish | 246 | 0.8% |
| Sioux | 194 | 0.6% |
| Slovak | 11 | 0.0% |
| South American | 265 | 0.9% |
| Spaniard | 153 | 0.5% |
| Spanish | 162 | 0.5% |
| Sri Lankan | 288 | 1.0% |
| Subsaharan African | 500 | 1.7% |
| Swedish | 134 | 0.4% |
| Swiss | 11 | 0.0% |
| Thai | 2,751 | 9.3% |
| Tongan | 81 | 0.3% |
| Welsh | 65 | 0.2% | View All 73 Rows |
Immigrants in Lathrop
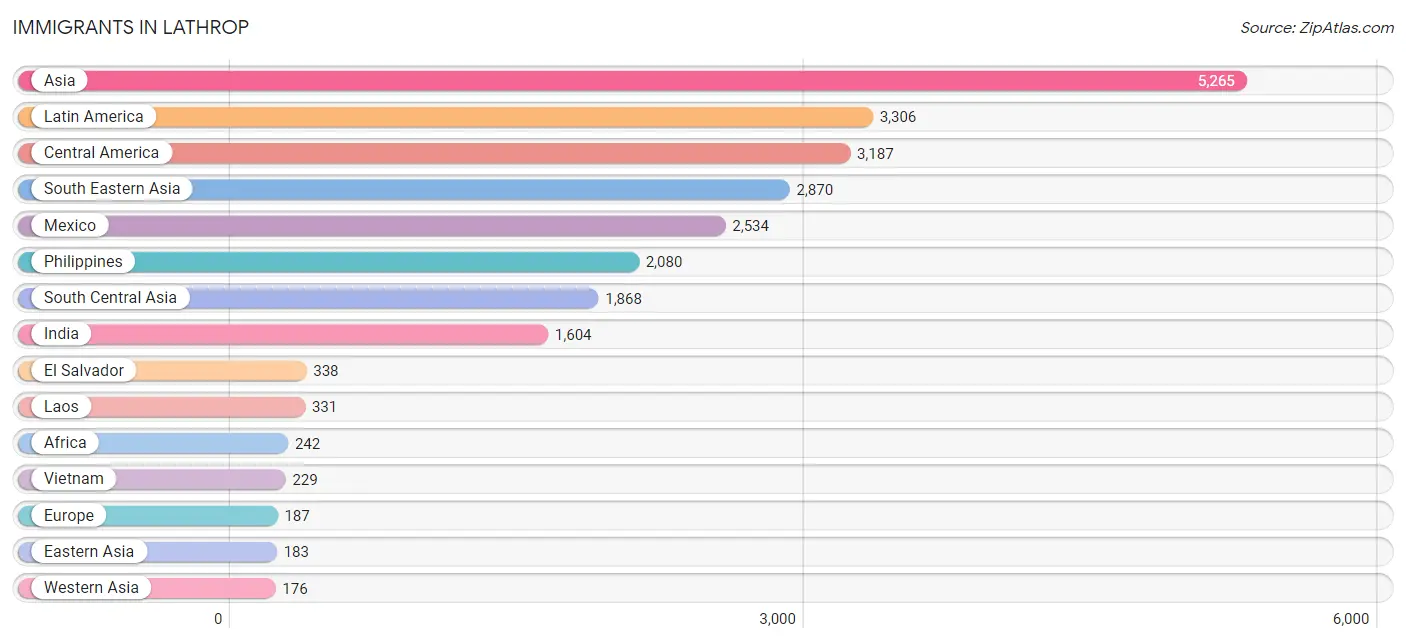
The most numerous immigrant groups reported in Lathrop came from Asia (5,265 | 17.8%), Latin America (3,306 | 11.2%), Central America (3,187 | 10.7%), South Eastern Asia (2,870 | 9.7%), and Mexico (2,534 | 8.6%), together accounting for 57.9% of all Lathrop residents.
| Immigration Origin | # Population | % Population |
| Afghanistan | 154 | 0.5% |
| Africa | 242 | 0.8% |
| Asia | 5,265 | 17.8% |
| Brazil | 16 | 0.1% |
| Cambodia | 10 | 0.0% |
| Cameroon | 28 | 0.1% |
| Canada | 44 | 0.2% |
| Caribbean | 18 | 0.1% |
| Central America | 3,187 | 10.7% |
| China | 156 | 0.5% |
| Colombia | 34 | 0.1% |
| Cuba | 18 | 0.1% |
| Eastern Africa | 36 | 0.1% |
| Eastern Asia | 183 | 0.6% |
| Eastern Europe | 20 | 0.1% |
| El Salvador | 338 | 1.1% |
| England | 46 | 0.2% |
| Ethiopia | 16 | 0.1% |
| Europe | 187 | 0.6% |
| Fiji | 112 | 0.4% |
| Germany | 8 | 0.0% |
| Guatemala | 138 | 0.5% |
| Honduras | 70 | 0.2% |
| Hong Kong | 20 | 0.1% |
| India | 1,604 | 5.4% |
| Jordan | 23 | 0.1% |
| Kenya | 20 | 0.1% |
| Korea | 27 | 0.1% |
| Laos | 331 | 1.1% |
| Latin America | 3,306 | 11.2% |
| Mexico | 2,534 | 8.6% |
| Middle Africa | 52 | 0.2% |
| Nicaragua | 84 | 0.3% |
| Nigeria | 154 | 0.5% |
| Northern Europe | 65 | 0.2% |
| Oceania | 112 | 0.4% |
| Pakistan | 110 | 0.4% |
| Panama | 23 | 0.1% |
| Peru | 51 | 0.2% |
| Philippines | 2,080 | 7.0% |
| Poland | 20 | 0.1% |
| Portugal | 63 | 0.2% |
| Singapore | 20 | 0.1% |
| South America | 101 | 0.3% |
| South Central Asia | 1,868 | 6.3% |
| South Eastern Asia | 2,870 | 9.7% |
| Southern Europe | 83 | 0.3% |
| Spain | 20 | 0.1% |
| Switzerland | 11 | 0.0% |
| Taiwan | 23 | 0.1% |
| Thailand | 44 | 0.2% |
| Vietnam | 229 | 0.8% |
| Western Africa | 154 | 0.5% |
| Western Asia | 176 | 0.6% |
| Western Europe | 19 | 0.1% |
| Yemen | 153 | 0.5% |
| Zaire | 24 | 0.1% | View All 57 Rows |
Sex and Age in Lathrop
Sex and Age in Lathrop
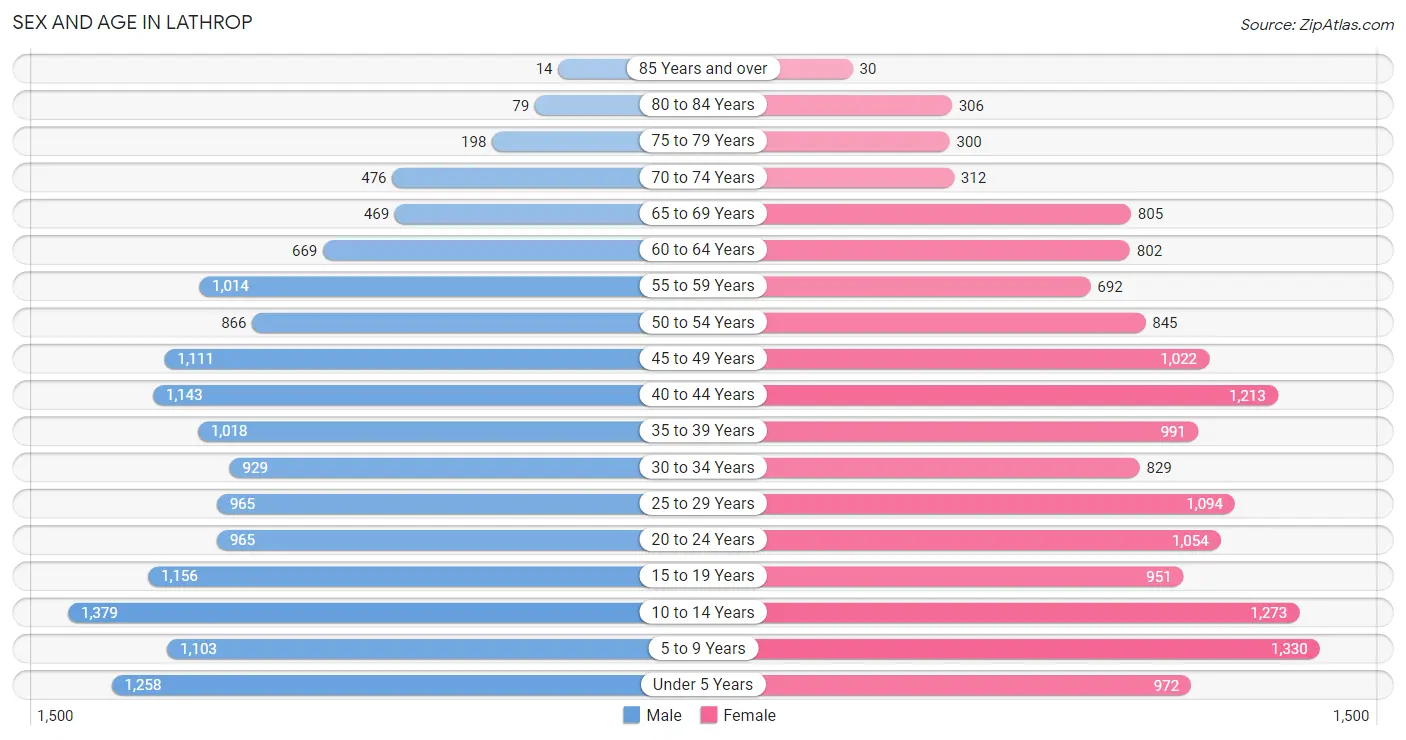
The most populous age groups in Lathrop are 10 to 14 Years (1,379 | 9.3%) for men and 5 to 9 Years (1,330 | 9.0%) for women.
| Age Bracket | Male | Female |
| Under 5 Years | 1,258 (8.5%) | 972 (6.6%) |
| 5 to 9 Years | 1,103 (7.4%) | 1,330 (9.0%) |
| 10 to 14 Years | 1,379 (9.3%) | 1,273 (8.6%) |
| 15 to 19 Years | 1,156 (7.8%) | 951 (6.4%) |
| 20 to 24 Years | 965 (6.5%) | 1,054 (7.1%) |
| 25 to 29 Years | 965 (6.5%) | 1,094 (7.4%) |
| 30 to 34 Years | 929 (6.3%) | 829 (5.6%) |
| 35 to 39 Years | 1,018 (6.9%) | 991 (6.7%) |
| 40 to 44 Years | 1,143 (7.7%) | 1,213 (8.2%) |
| 45 to 49 Years | 1,111 (7.5%) | 1,022 (6.9%) |
| 50 to 54 Years | 866 (5.9%) | 845 (5.7%) |
| 55 to 59 Years | 1,014 (6.9%) | 692 (4.7%) |
| 60 to 64 Years | 669 (4.5%) | 802 (5.4%) |
| 65 to 69 Years | 469 (3.2%) | 805 (5.4%) |
| 70 to 74 Years | 476 (3.2%) | 312 (2.1%) |
| 75 to 79 Years | 198 (1.3%) | 300 (2.0%) |
| 80 to 84 Years | 79 (0.5%) | 306 (2.1%) |
| 85 Years and over | 14 (0.1%) | 30 (0.2%) |
| Total | 14,812 (100.0%) | 14,821 (100.0%) |
Families and Households in Lathrop
Median Family Size in Lathrop
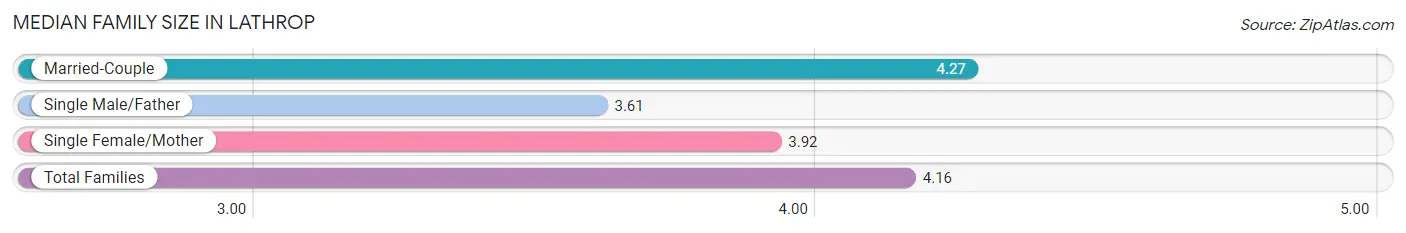
The median family size in Lathrop is 4.16 persons per family, with married-couple families (4,792 | 75.8%) accounting for the largest median family size of 4.27 persons per family. On the other hand, single male/father families (615 | 9.7%) represent the smallest median family size with 3.61 persons per family.
| Family Type | # Families | Family Size |
| Married-Couple | 4,792 (75.8%) | 4.27 |
| Single Male/Father | 615 (9.7%) | 3.61 |
| Single Female/Mother | 915 (14.5%) | 3.92 |
| Total Families | 6,322 (100.0%) | 4.16 |
Median Household Size in Lathrop
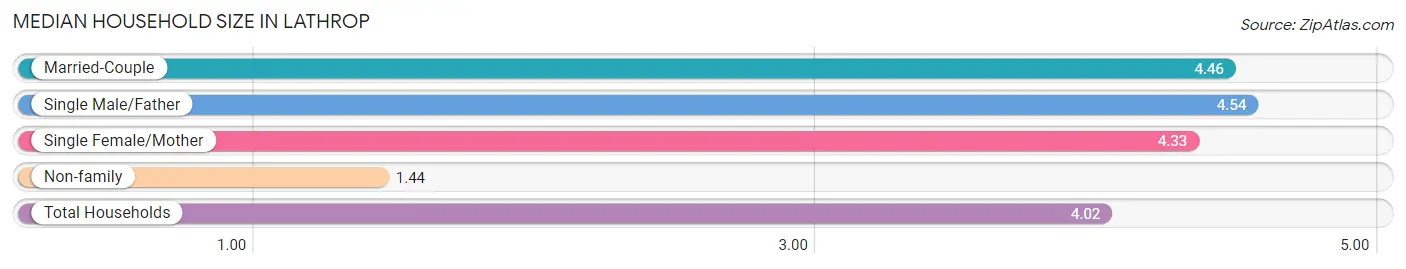
The median household size in Lathrop is 4.02 persons per household, with single male/father households (615 | 8.4%) accounting for the largest median household size of 4.54 persons per household. non-family households (1,037 | 14.1%) represent the smallest median household size with 1.44 persons per household.
| Household Type | # Households | Household Size |
| Married-Couple | 4,792 (65.1%) | 4.46 |
| Single Male/Father | 615 (8.4%) | 4.54 |
| Single Female/Mother | 915 (12.4%) | 4.33 |
| Non-family | 1,037 (14.1%) | 1.44 |
| Total Households | 7,359 (100.0%) | 4.02 |
Household Size by Marriage Status in Lathrop
Out of a total of 7,359 households in Lathrop, 6,322 (85.9%) are family households, while 1,037 (14.1%) are nonfamily households. The most numerous type of family households are 4-person households, comprising 1,508, and the most common type of nonfamily households are 1-person households, comprising 786.
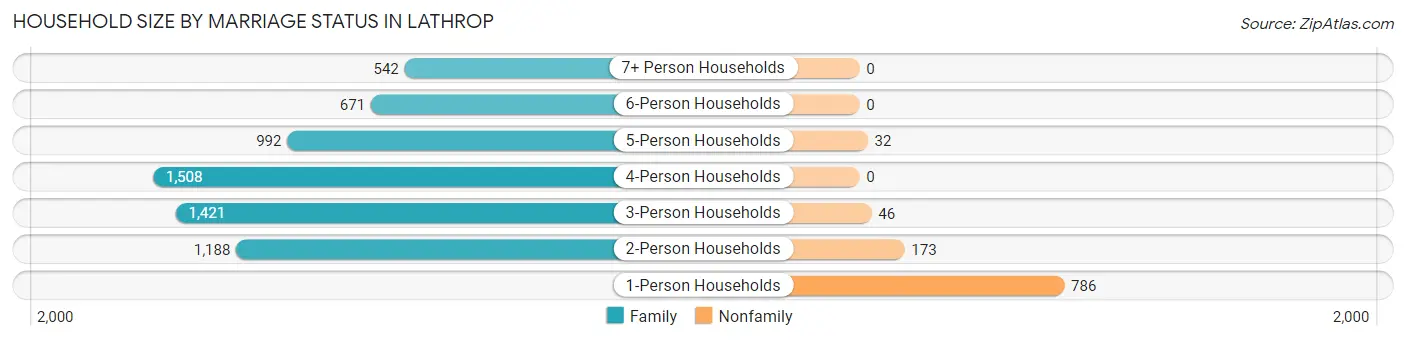
| Household Size | Family Households | Nonfamily Households |
| 1-Person Households | - | 786 (10.7%) |
| 2-Person Households | 1,188 (16.1%) | 173 (2.4%) |
| 3-Person Households | 1,421 (19.3%) | 46 (0.6%) |
| 4-Person Households | 1,508 (20.5%) | 0 (0.0%) |
| 5-Person Households | 992 (13.5%) | 32 (0.4%) |
| 6-Person Households | 671 (9.1%) | 0 (0.0%) |
| 7+ Person Households | 542 (7.4%) | 0 (0.0%) |
| Total | 6,322 (85.9%) | 1,037 (14.1%) |
Female Fertility in Lathrop
Fertility by Age in Lathrop
Average fertility rate in Lathrop is 62.0 births per 1,000 women. Women in the age bracket of 20 to 34 years have the highest fertility rate with 90.0 births per 1,000 women. Women in the age bracket of 20 to 34 years acount for 58.3% of all women with births.
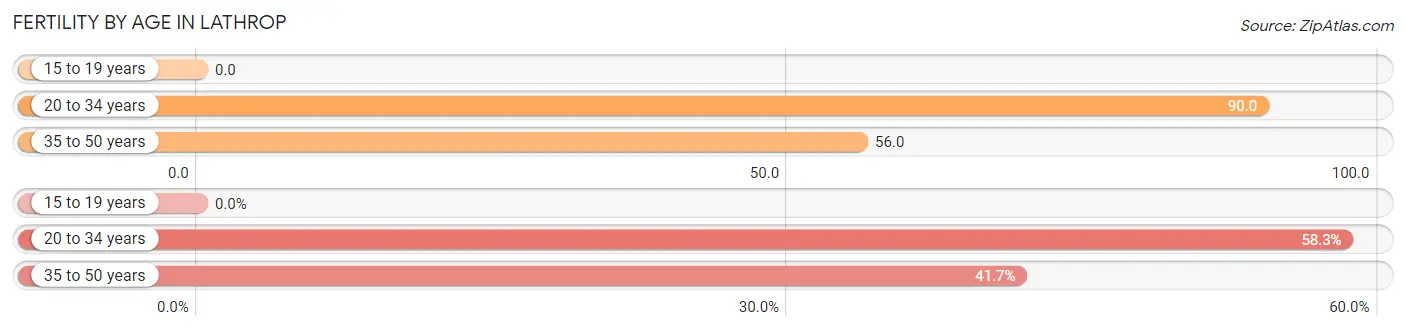
| Age Bracket | Women with Births | Births / 1,000 Women |
| 15 to 19 years | 0 (0.0%) | 0.0 |
| 20 to 34 years | 267 (58.3%) | 90.0 |
| 35 to 50 years | 191 (41.7%) | 56.0 |
| Total | 458 (100.0%) | 62.0 |
Fertility by Age by Marriage Status in Lathrop
56.1% of women with births (458) in Lathrop are married. The highest percentage of unmarried women with births falls into 35 to 50 years age bracket with 44.0% of them unmarried at the time of birth, while the lowest percentage of unmarried women with births belong to 20 to 34 years age bracket with 43.8% of them unmarried.
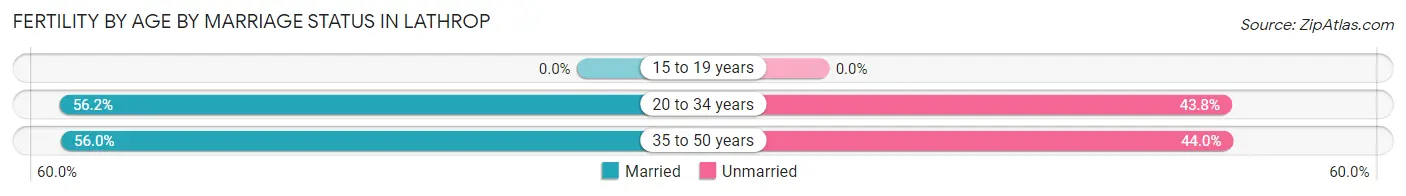
| Age Bracket | Married | Unmarried |
| 15 to 19 years | 0 (0.0%) | 0 (0.0%) |
| 20 to 34 years | 150 (56.2%) | 117 (43.8%) |
| 35 to 50 years | 107 (56.0%) | 84 (44.0%) |
| Total | 257 (56.1%) | 201 (43.9%) |
Fertility by Education in Lathrop
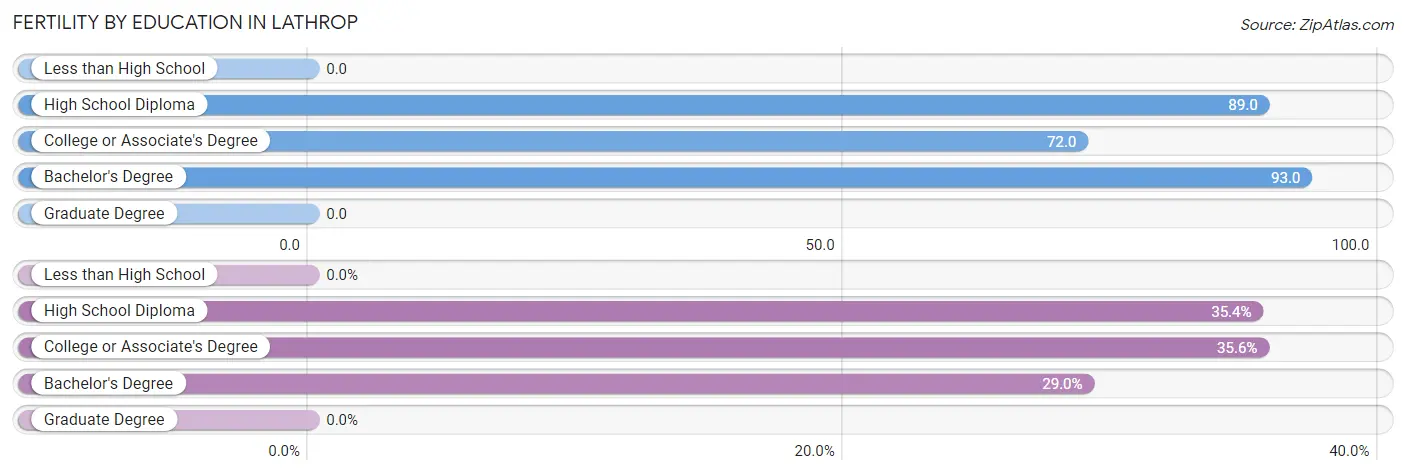
| Educational Attainment | Women with Births | Births / 1,000 Women |
| Less than High School | 0 (0.0%) | 0.0 |
| High School Diploma | 162 (35.4%) | 89.0 |
| College or Associate's Degree | 163 (35.6%) | 72.0 |
| Bachelor's Degree | 133 (29.0%) | 93.0 |
| Graduate Degree | 0 (0.0%) | 0.0 |
| Total | 458 (100.0%) | 62.0 |
Fertility by Education by Marriage Status in Lathrop
43.9% of women with births in Lathrop are unmarried. Women with the educational attainment of high school diploma are most likely to be married with 62.4% of them married at childbirth, while women with the educational attainment of bachelor's degree are least likely to be married with 54.1% of them unmarried at childbirth.

| Educational Attainment | Married | Unmarried |
| Less than High School | 0 (0.0%) | 0 (0.0%) |
| High School Diploma | 101 (62.4%) | 61 (37.7%) |
| College or Associate's Degree | 95 (58.3%) | 68 (41.7%) |
| Bachelor's Degree | 61 (45.9%) | 72 (54.1%) |
| Graduate Degree | 0 (0.0%) | 0 (0.0%) |
| Total | 257 (56.1%) | 201 (43.9%) |
Employment Characteristics in Lathrop
Employment by Class of Employer in Lathrop
Among the 12,488 employed individuals in Lathrop, private company employees (8,692 | 69.6%), local government employees (991 | 7.9%), and not-for-profit organizations (867 | 6.9%) make up the most common classes of employment.
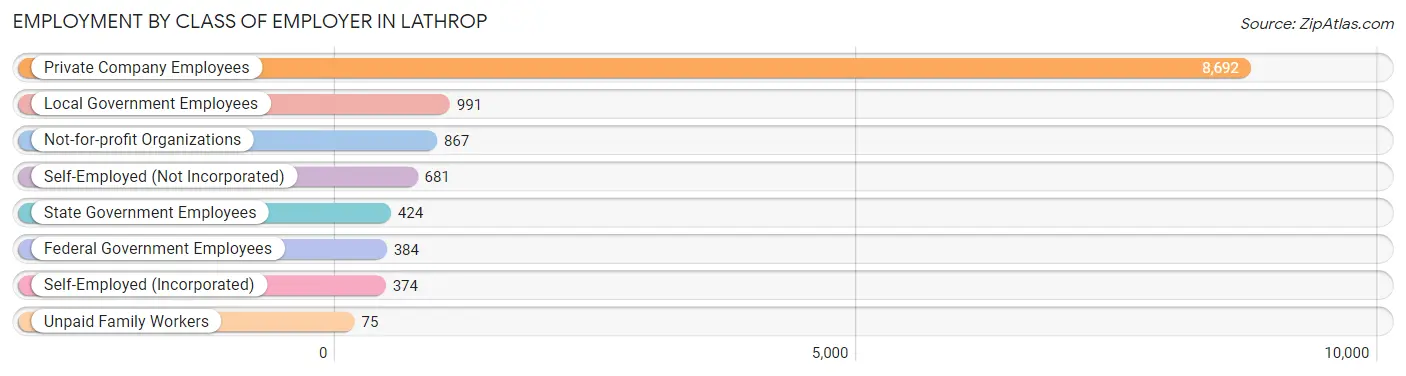
| Employer Class | # Employees | % Employees |
| Private Company Employees | 8,692 | 69.6% |
| Self-Employed (Incorporated) | 374 | 3.0% |
| Self-Employed (Not Incorporated) | 681 | 5.4% |
| Not-for-profit Organizations | 867 | 6.9% |
| Local Government Employees | 991 | 7.9% |
| State Government Employees | 424 | 3.4% |
| Federal Government Employees | 384 | 3.1% |
| Unpaid Family Workers | 75 | 0.6% |
| Total | 12,488 | 100.0% |
Employment Status by Age in Lathrop
According to the labor force statistics for Lathrop, out of the total population over 16 years of age (21,775), 64.7% or 14,088 individuals are in the labor force, with 8.9% or 1,254 of them unemployed. The age group with the highest labor force participation rate is 45 to 54 years, with 83.3% or 3,202 individuals in the labor force. Within the labor force, the 20 to 24 years age range has the highest percentage of unemployed individuals, with 19.6% or 314 of them being unemployed.
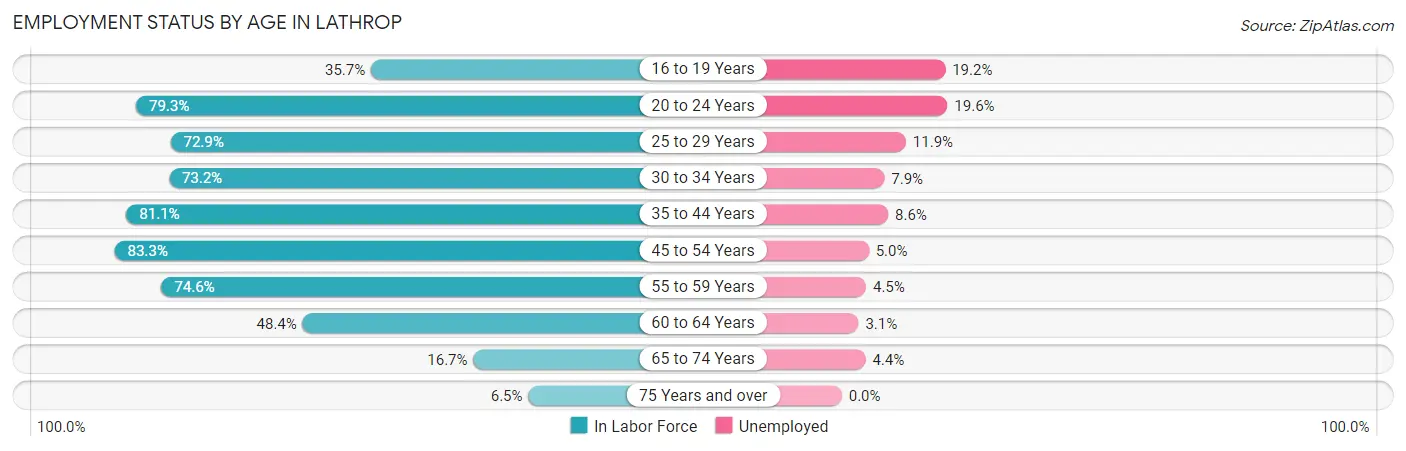
| Age Bracket | In Labor Force | Unemployed |
| 16 to 19 Years | 558 (35.7%) | 107 (19.2%) |
| 20 to 24 Years | 1,601 (79.3%) | 314 (19.6%) |
| 25 to 29 Years | 1,501 (72.9%) | 179 (11.9%) |
| 30 to 34 Years | 1,287 (73.2%) | 102 (7.9%) |
| 35 to 44 Years | 3,540 (81.1%) | 304 (8.6%) |
| 45 to 54 Years | 3,202 (83.3%) | 160 (5.0%) |
| 55 to 59 Years | 1,273 (74.6%) | 57 (4.5%) |
| 60 to 64 Years | 712 (48.4%) | 22 (3.1%) |
| 65 to 74 Years | 344 (16.7%) | 15 (4.4%) |
| 75 Years and over | 60 (6.5%) | 0 (0.0%) |
| Total | 14,088 (64.7%) | 1,254 (8.9%) |
Employment Status by Educational Attainment in Lathrop
According to labor force statistics for Lathrop, 75.7% of individuals (11,509) out of the total population between 25 and 64 years of age (15,203) are in the labor force, with 7.1% or 817 of them being unemployed. The group with the highest labor force participation rate are those with the educational attainment of bachelor's degree or higher, with 83.2% or 2,910 individuals in the labor force. Within the labor force, individuals with less than high school education have the highest percentage of unemployment, with 9.9% or 180 of them being unemployed.
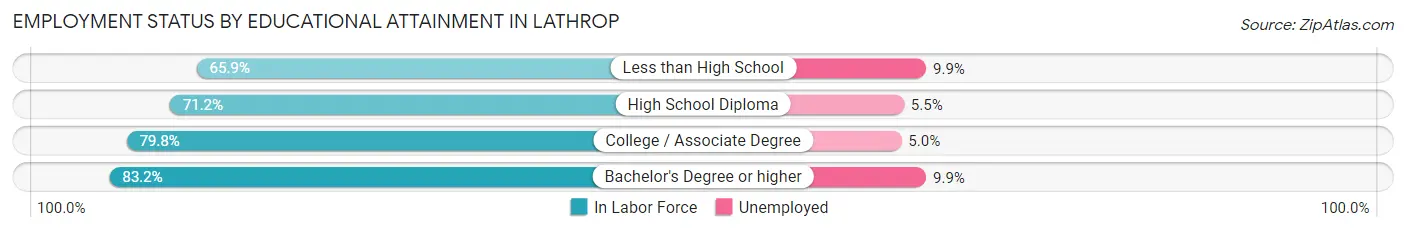
| Educational Attainment | In Labor Force | Unemployed |
| Less than High School | 1,815 (65.9%) | 273 (9.9%) |
| High School Diploma | 2,922 (71.2%) | 226 (5.5%) |
| College / Associate Degree | 3,869 (79.8%) | 242 (5.0%) |
| Bachelor's Degree or higher | 2,910 (83.2%) | 346 (9.9%) |
| Total | 11,509 (75.7%) | 1,079 (7.1%) |
Employment Occupations by Sex in Lathrop
Management, Business, Science and Arts Occupations
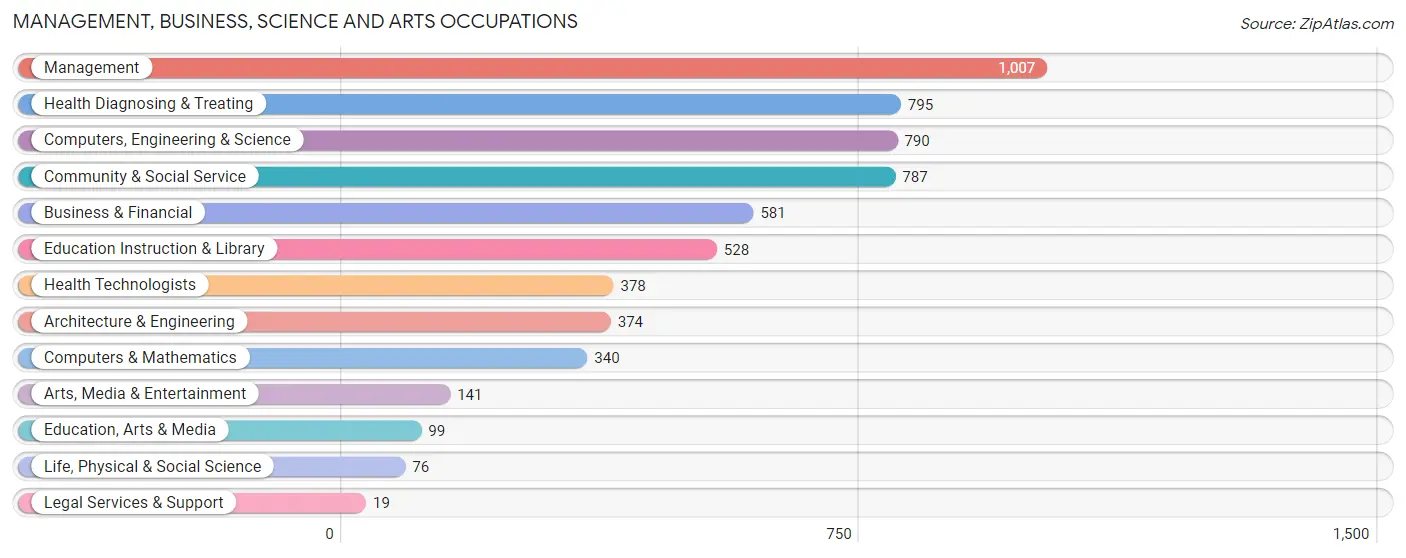
The most common Management, Business, Science and Arts occupations in Lathrop are Management (1,007 | 7.9%), Health Diagnosing & Treating (795 | 6.2%), Computers, Engineering & Science (790 | 6.2%), Community & Social Service (787 | 6.1%), and Business & Financial (581 | 4.5%).
Management, Business, Science and Arts Occupations by Sex
Within the Management, Business, Science and Arts occupations in Lathrop, the most male-oriented occupations are Computers & Mathematics (97.7%), Architecture & Engineering (88.8%), and Computers, Engineering & Science (86.5%), while the most female-oriented occupations are Legal Services & Support (100.0%), Health Technologists (86.0%), and Health Diagnosing & Treating (79.5%).
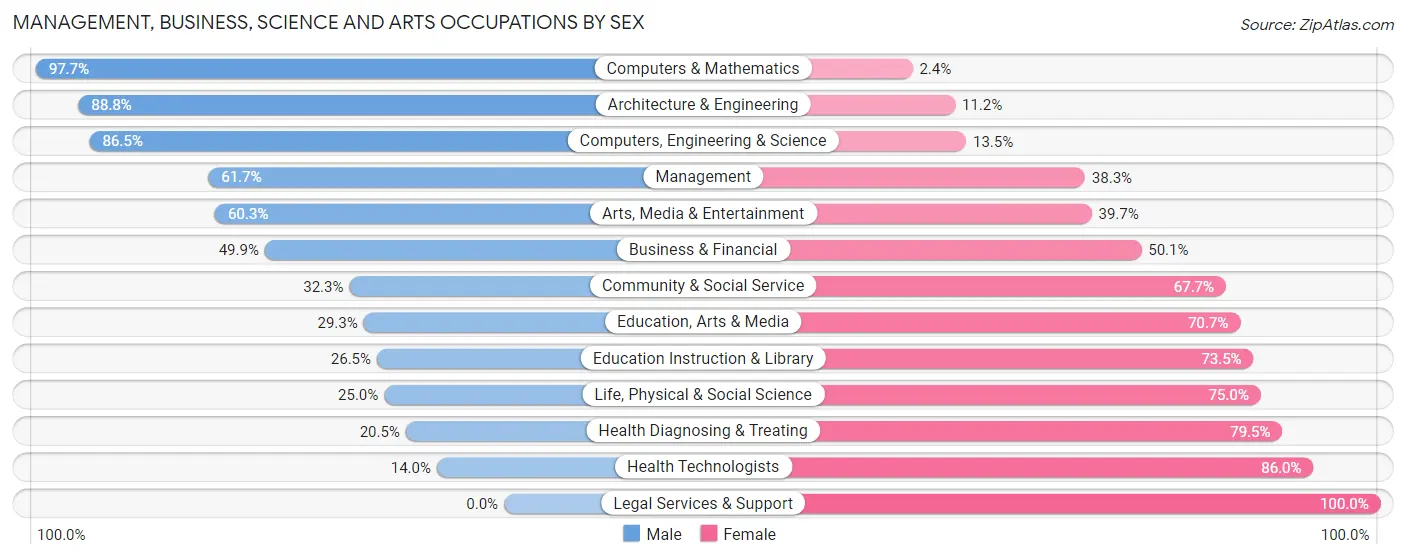
| Occupation | Male | Female |
| Management | 621 (61.7%) | 386 (38.3%) |
| Business & Financial | 290 (49.9%) | 291 (50.1%) |
| Computers, Engineering & Science | 683 (86.5%) | 107 (13.5%) |
| Computers & Mathematics | 332 (97.7%) | 8 (2.4%) |
| Architecture & Engineering | 332 (88.8%) | 42 (11.2%) |
| Life, Physical & Social Science | 19 (25.0%) | 57 (75.0%) |
| Community & Social Service | 254 (32.3%) | 533 (67.7%) |
| Education, Arts & Media | 29 (29.3%) | 70 (70.7%) |
| Legal Services & Support | 0 (0.0%) | 19 (100.0%) |
| Education Instruction & Library | 140 (26.5%) | 388 (73.5%) |
| Arts, Media & Entertainment | 85 (60.3%) | 56 (39.7%) |
| Health Diagnosing & Treating | 163 (20.5%) | 632 (79.5%) |
| Health Technologists | 53 (14.0%) | 325 (86.0%) |
| Total (Category) | 2,011 (50.8%) | 1,949 (49.2%) |
| Total (Overall) | 7,456 (58.2%) | 5,349 (41.8%) |
Services Occupations
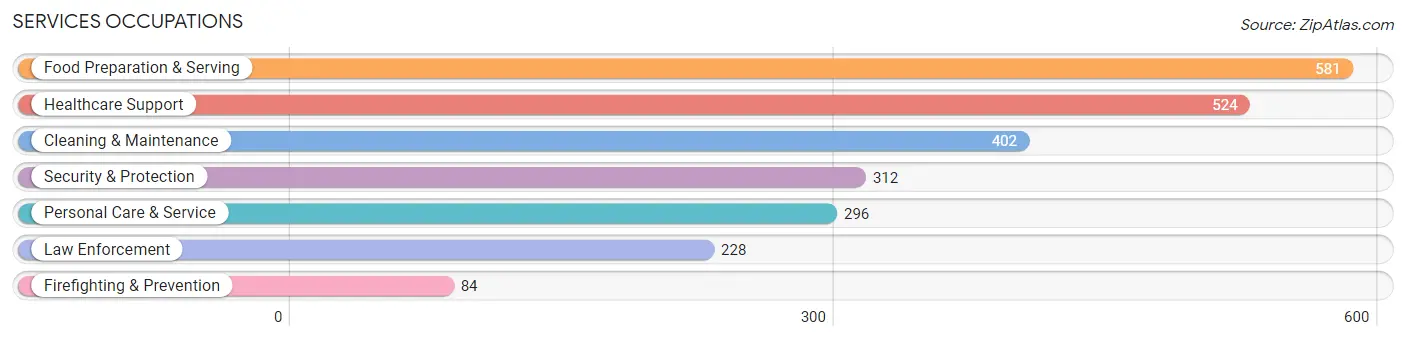
The most common Services occupations in Lathrop are Food Preparation & Serving (581 | 4.5%), Healthcare Support (524 | 4.1%), Cleaning & Maintenance (402 | 3.1%), Security & Protection (312 | 2.4%), and Personal Care & Service (296 | 2.3%).
Services Occupations by Sex
Within the Services occupations in Lathrop, the most male-oriented occupations are Law Enforcement (83.8%), Security & Protection (81.1%), and Firefighting & Prevention (73.8%), while the most female-oriented occupations are Healthcare Support (80.5%), Personal Care & Service (78.4%), and Food Preparation & Serving (55.2%).
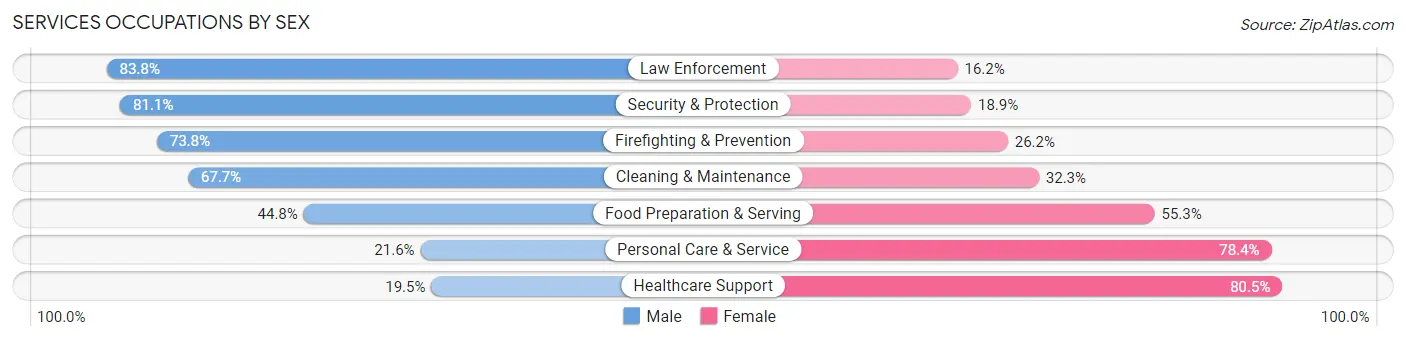
| Occupation | Male | Female |
| Healthcare Support | 102 (19.5%) | 422 (80.5%) |
| Security & Protection | 253 (81.1%) | 59 (18.9%) |
| Firefighting & Prevention | 62 (73.8%) | 22 (26.2%) |
| Law Enforcement | 191 (83.8%) | 37 (16.2%) |
| Food Preparation & Serving | 260 (44.8%) | 321 (55.2%) |
| Cleaning & Maintenance | 272 (67.7%) | 130 (32.3%) |
| Personal Care & Service | 64 (21.6%) | 232 (78.4%) |
| Total (Category) | 951 (45.0%) | 1,164 (55.0%) |
| Total (Overall) | 7,456 (58.2%) | 5,349 (41.8%) |
Sales and Office Occupations
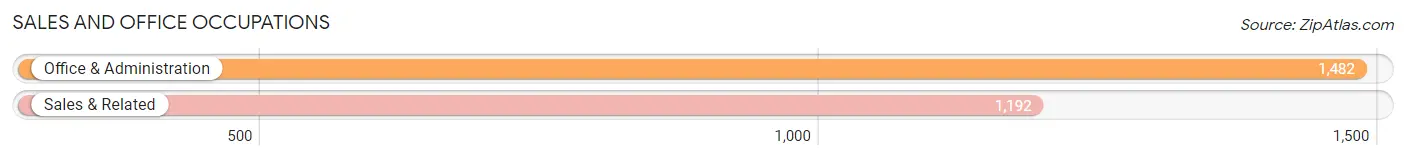
The most common Sales and Office occupations in Lathrop are Office & Administration (1,482 | 11.6%), and Sales & Related (1,192 | 9.3%).
Sales and Office Occupations by Sex
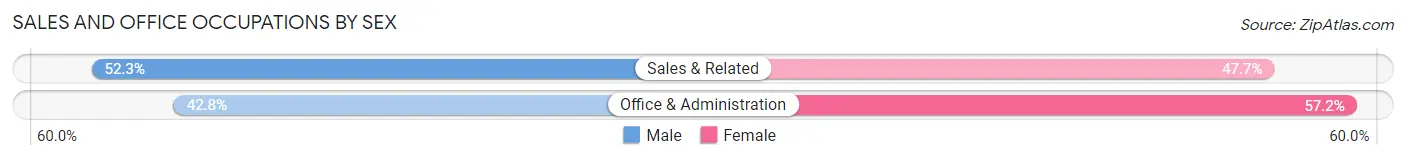
| Occupation | Male | Female |
| Sales & Related | 623 (52.3%) | 569 (47.7%) |
| Office & Administration | 634 (42.8%) | 848 (57.2%) |
| Total (Category) | 1,257 (47.0%) | 1,417 (53.0%) |
| Total (Overall) | 7,456 (58.2%) | 5,349 (41.8%) |
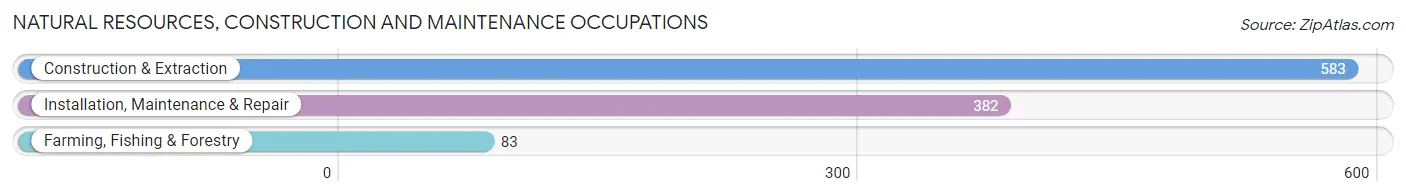
Natural Resources, Construction and Maintenance Occupations
The most common Natural Resources, Construction and Maintenance occupations in Lathrop are Construction & Extraction (583 | 4.5%), Installation, Maintenance & Repair (382 | 3.0%), and Farming, Fishing & Forestry (83 | 0.6%).
Natural Resources, Construction and Maintenance Occupations by Sex
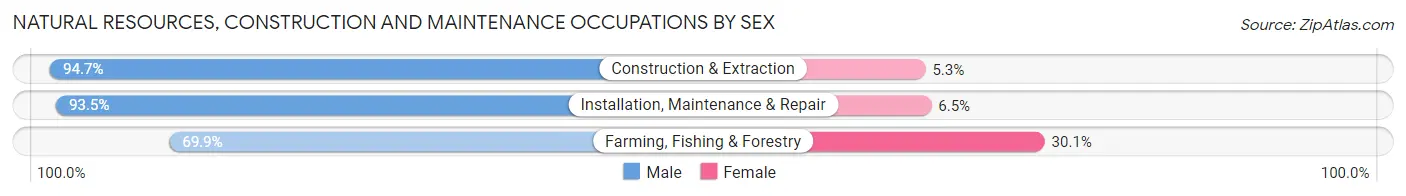
| Occupation | Male | Female |
| Farming, Fishing & Forestry | 58 (69.9%) | 25 (30.1%) |
| Construction & Extraction | 552 (94.7%) | 31 (5.3%) |
| Installation, Maintenance & Repair | 357 (93.5%) | 25 (6.5%) |
| Total (Category) | 967 (92.3%) | 81 (7.7%) |
| Total (Overall) | 7,456 (58.2%) | 5,349 (41.8%) |
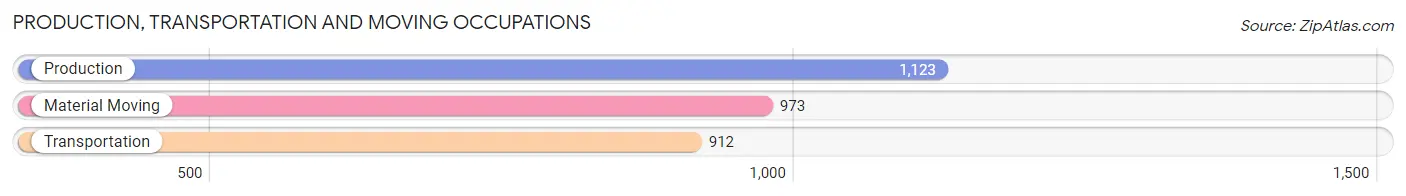
Production, Transportation and Moving Occupations
The most common Production, Transportation and Moving occupations in Lathrop are Production (1,123 | 8.8%), Material Moving (973 | 7.6%), and Transportation (912 | 7.1%).
Production, Transportation and Moving Occupations by Sex
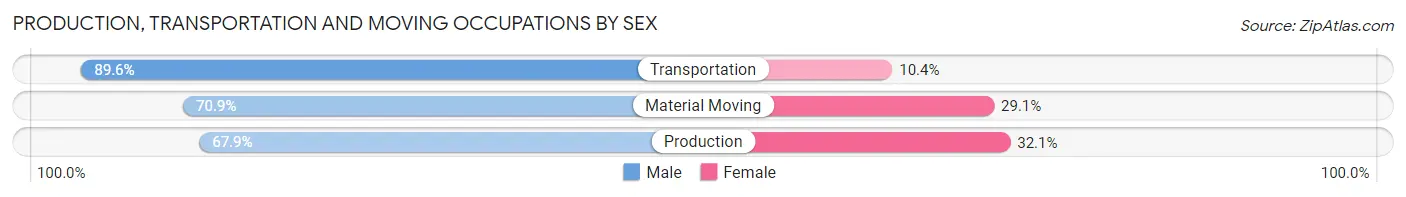
| Occupation | Male | Female |
| Production | 763 (67.9%) | 360 (32.1%) |
| Transportation | 817 (89.6%) | 95 (10.4%) |
| Material Moving | 690 (70.9%) | 283 (29.1%) |
| Total (Category) | 2,270 (75.5%) | 738 (24.5%) |
| Total (Overall) | 7,456 (58.2%) | 5,349 (41.8%) |
Employment Industries by Sex in Lathrop
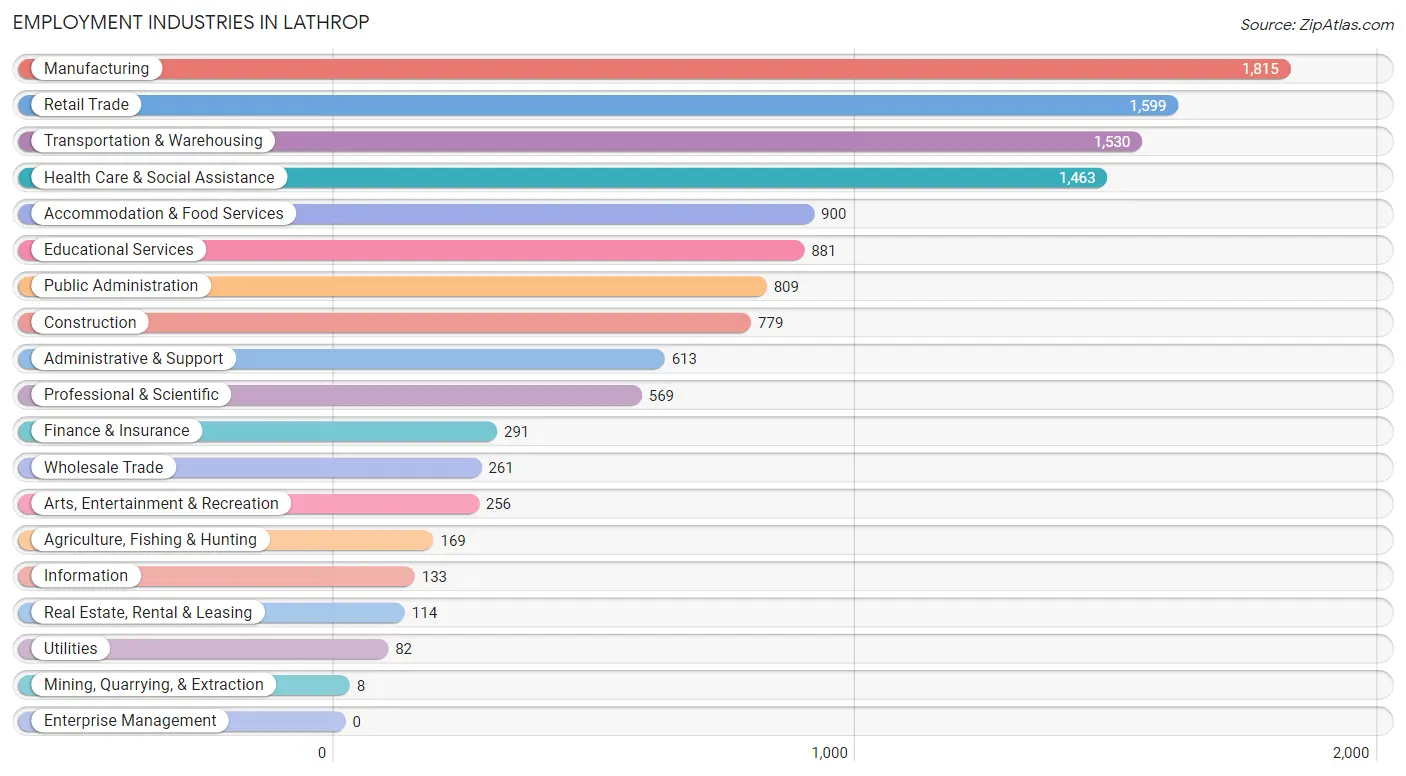
Employment Industries in Lathrop
The major employment industries in Lathrop include Manufacturing (1,815 | 14.2%), Retail Trade (1,599 | 12.5%), Transportation & Warehousing (1,530 | 11.9%), Health Care & Social Assistance (1,463 | 11.4%), and Accommodation & Food Services (900 | 7.0%).
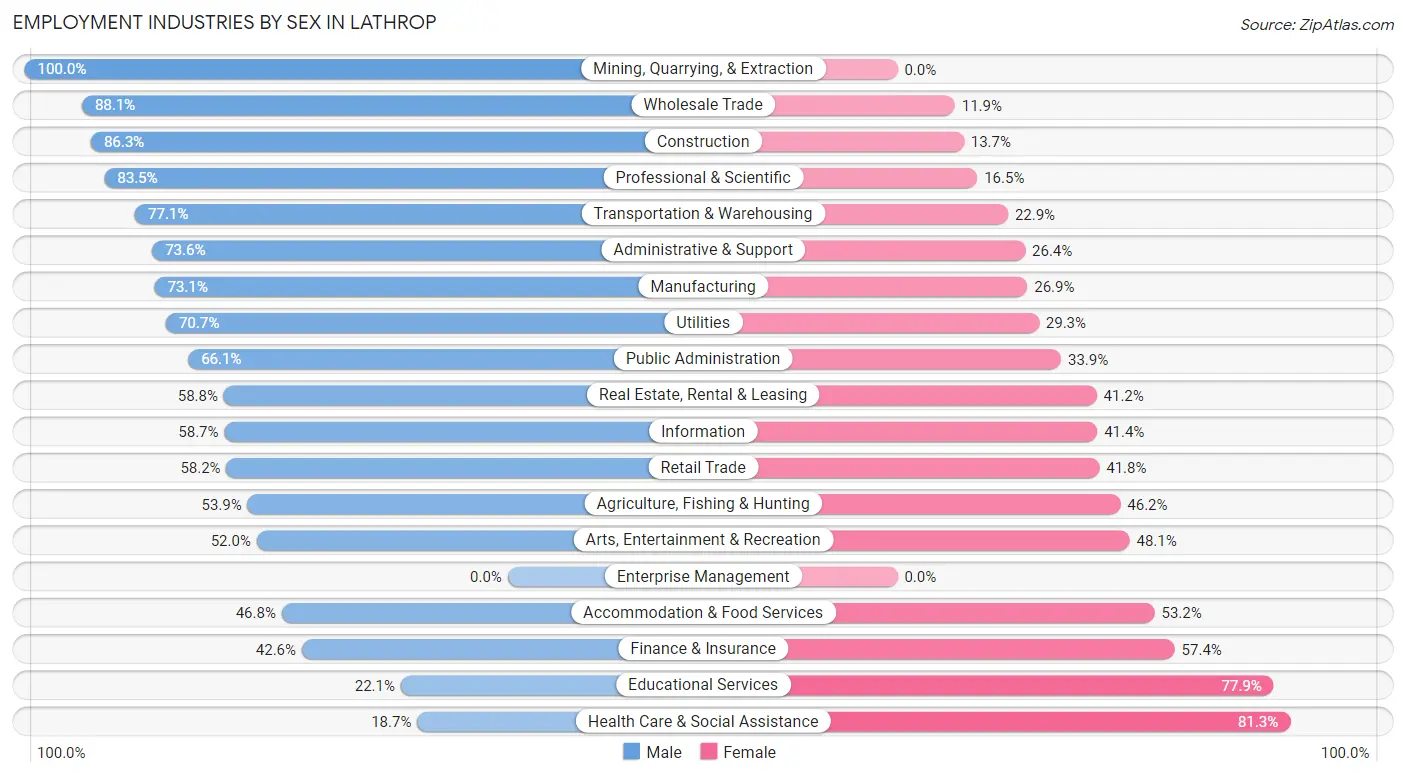
Employment Industries by Sex in Lathrop
The Lathrop industries that see more men than women are Mining, Quarrying, & Extraction (100.0%), Wholesale Trade (88.1%), and Construction (86.3%), whereas the industries that tend to have a higher number of women are Health Care & Social Assistance (81.3%), Educational Services (77.9%), and Finance & Insurance (57.4%).
| Industry | Male | Female |
| Agriculture, Fishing & Hunting | 91 (53.8%) | 78 (46.2%) |
| Mining, Quarrying, & Extraction | 8 (100.0%) | 0 (0.0%) |
| Construction | 672 (86.3%) | 107 (13.7%) |
| Manufacturing | 1,327 (73.1%) | 488 (26.9%) |
| Wholesale Trade | 230 (88.1%) | 31 (11.9%) |
| Retail Trade | 931 (58.2%) | 668 (41.8%) |
| Transportation & Warehousing | 1,180 (77.1%) | 350 (22.9%) |
| Utilities | 58 (70.7%) | 24 (29.3%) |
| Information | 78 (58.7%) | 55 (41.3%) |
| Finance & Insurance | 124 (42.6%) | 167 (57.4%) |
| Real Estate, Rental & Leasing | 67 (58.8%) | 47 (41.2%) |
| Professional & Scientific | 475 (83.5%) | 94 (16.5%) |
| Enterprise Management | 0 (0.0%) | 0 (0.0%) |
| Administrative & Support | 451 (73.6%) | 162 (26.4%) |
| Educational Services | 195 (22.1%) | 686 (77.9%) |
| Health Care & Social Assistance | 274 (18.7%) | 1,189 (81.3%) |
| Arts, Entertainment & Recreation | 133 (51.9%) | 123 (48.0%) |
| Accommodation & Food Services | 421 (46.8%) | 479 (53.2%) |
| Public Administration | 535 (66.1%) | 274 (33.9%) |
| Total | 7,456 (58.2%) | 5,349 (41.8%) |
Education in Lathrop
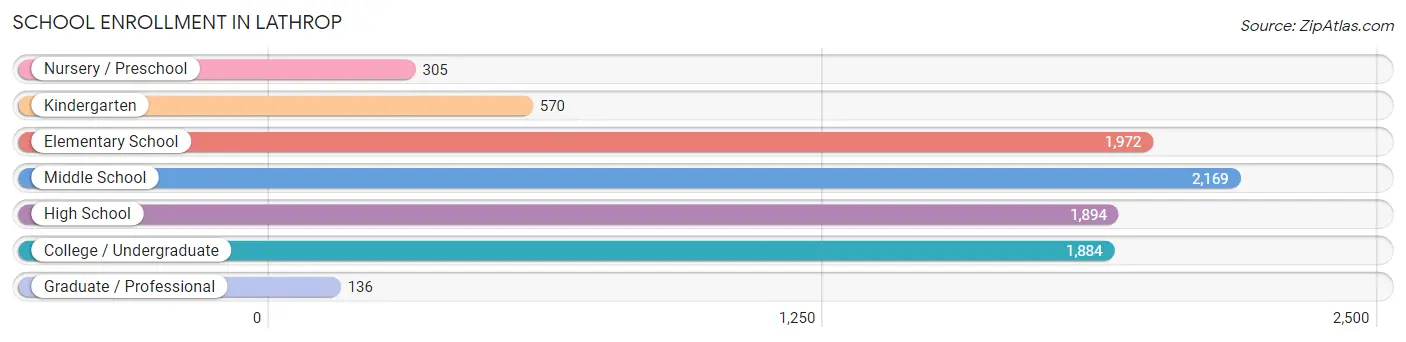
School Enrollment in Lathrop
The most common levels of schooling among the 8,930 students in Lathrop are middle school (2,169 | 24.3%), elementary school (1,972 | 22.1%), and high school (1,894 | 21.2%).
| School Level | # Students | % Students |
| Nursery / Preschool | 305 | 3.4% |
| Kindergarten | 570 | 6.4% |
| Elementary School | 1,972 | 22.1% |
| Middle School | 2,169 | 24.3% |
| High School | 1,894 | 21.2% |
| College / Undergraduate | 1,884 | 21.1% |
| Graduate / Professional | 136 | 1.5% |
| Total | 8,930 | 100.0% |
School Enrollment by Age by Funding Source in Lathrop
Out of a total of 8,930 students who are enrolled in schools in Lathrop, 705 (7.9%) attend a private institution, while the remaining 8,225 (92.1%) are enrolled in public schools. The age group of 35 years and over has the highest likelihood of being enrolled in private schools, with 177 (31.6% in the age bracket) enrolled. Conversely, the age group of 3 to 4 year olds has the lowest likelihood of being enrolled in a private school, with 272 (100.0% in the age bracket) attending a public institution.
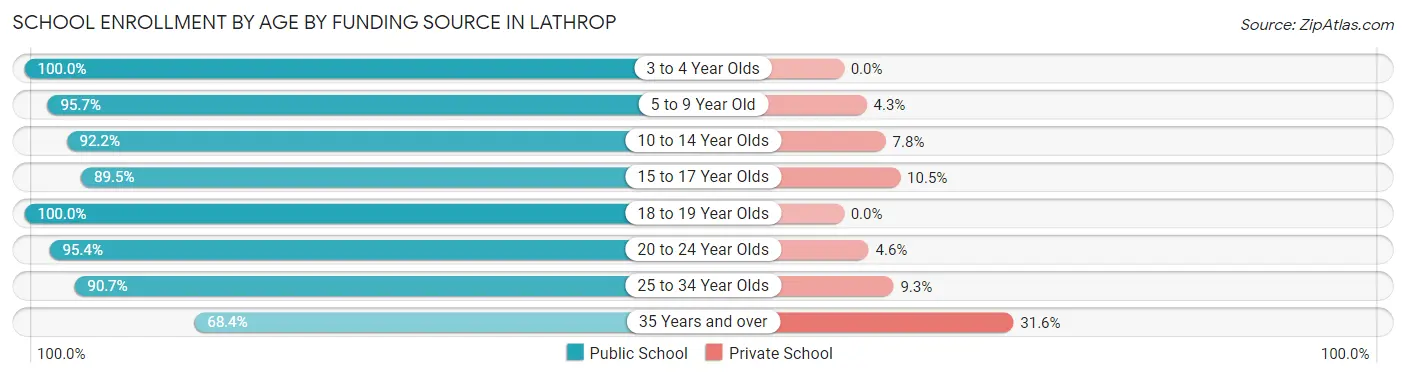
| Age Bracket | Public School | Private School |
| 3 to 4 Year Olds | 272 (100.0%) | 0 (0.0%) |
| 5 to 9 Year Old | 2,284 (95.7%) | 102 (4.3%) |
| 10 to 14 Year Olds | 2,429 (92.2%) | 206 (7.8%) |
| 15 to 17 Year Olds | 1,182 (89.5%) | 139 (10.5%) |
| 18 to 19 Year Olds | 451 (100.0%) | 0 (0.0%) |
| 20 to 24 Year Olds | 802 (95.4%) | 39 (4.6%) |
| 25 to 34 Year Olds | 421 (90.7%) | 43 (9.3%) |
| 35 Years and over | 383 (68.4%) | 177 (31.6%) |
| Total | 8,225 (92.1%) | 705 (7.9%) |
Educational Attainment by Field of Study in Lathrop
Business (650 | 15.7%), science & technology (430 | 10.4%), social sciences (403 | 9.7%), computers & mathematics (344 | 8.3%), and engineering (343 | 8.3%) are the most common fields of study among 4,151 individuals in Lathrop who have obtained a bachelor's degree or higher.
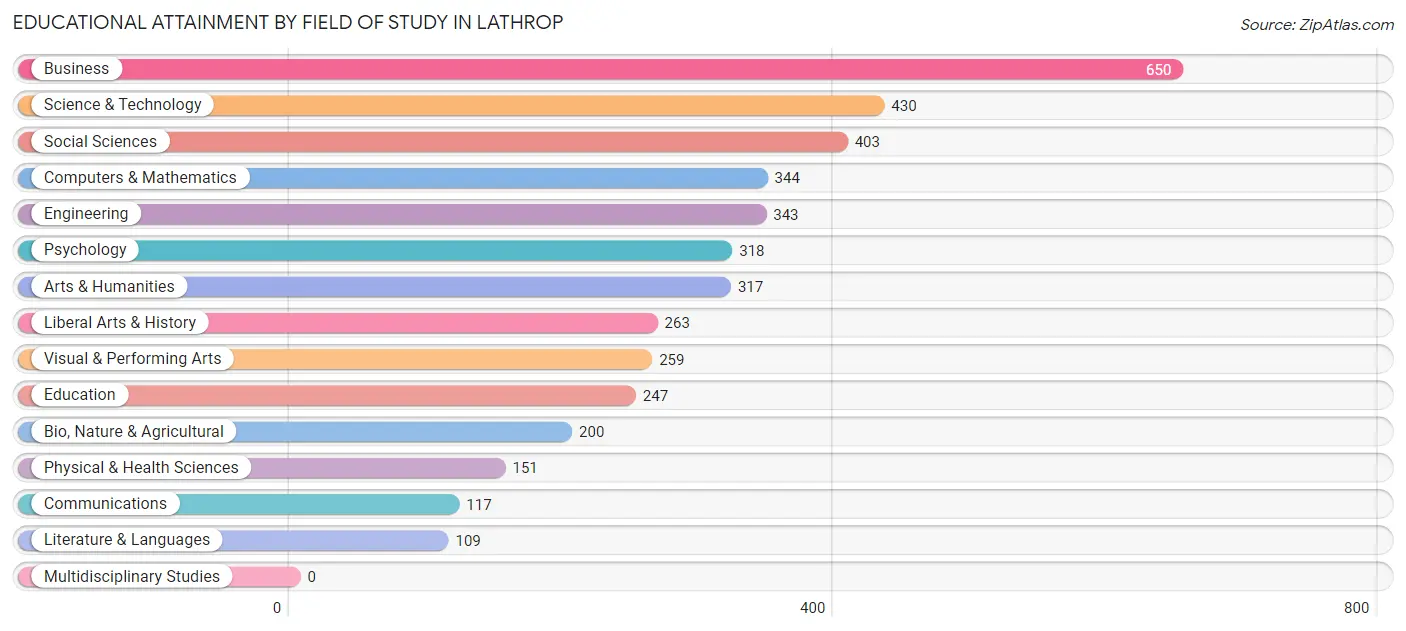
| Field of Study | # Graduates | % Graduates |
| Computers & Mathematics | 344 | 8.3% |
| Bio, Nature & Agricultural | 200 | 4.8% |
| Physical & Health Sciences | 151 | 3.6% |
| Psychology | 318 | 7.7% |
| Social Sciences | 403 | 9.7% |
| Engineering | 343 | 8.3% |
| Multidisciplinary Studies | 0 | 0.0% |
| Science & Technology | 430 | 10.4% |
| Business | 650 | 15.7% |
| Education | 247 | 5.9% |
| Literature & Languages | 109 | 2.6% |
| Liberal Arts & History | 263 | 6.3% |
| Visual & Performing Arts | 259 | 6.2% |
| Communications | 117 | 2.8% |
| Arts & Humanities | 317 | 7.6% |
| Total | 4,151 | 100.0% |
Transportation & Commute in Lathrop
Vehicle Availability by Sex in Lathrop
The most prevalent vehicle ownership categories in Lathrop are males with 3 vehicles (2,437, accounting for 33.6%) and females with 3 vehicles (1,738, making up 46.6%).
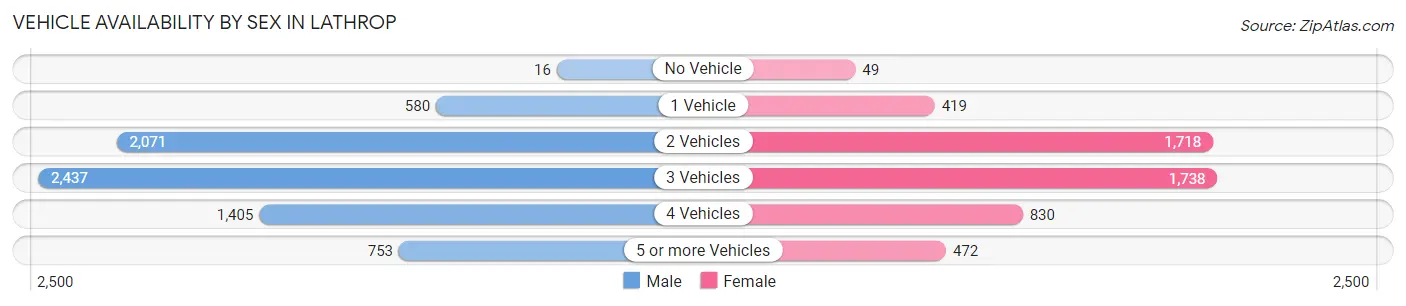
| Vehicles Available | Male | Female |
| No Vehicle | 16 (0.2%) | 49 (0.9%) |
| 1 Vehicle | 580 (8.0%) | 419 (8.0%) |
| 2 Vehicles | 2,071 (28.5%) | 1,718 (32.9%) |
| 3 Vehicles | 2,437 (33.6%) | 1,738 (33.3%) |
| 4 Vehicles | 1,405 (19.4%) | 830 (15.9%) |
| 5 or more Vehicles | 753 (10.4%) | 472 (9.0%) |
| Total | 7,262 (100.0%) | 5,226 (100.0%) |
Commute Time in Lathrop
The most frequently occuring commute durations in Lathrop are 60 to 89 minutes (1,983 commuters, 17.1%), 90 or more minutes (1,738 commuters, 15.0%), and 15 to 19 minutes (1,665 commuters, 14.4%).
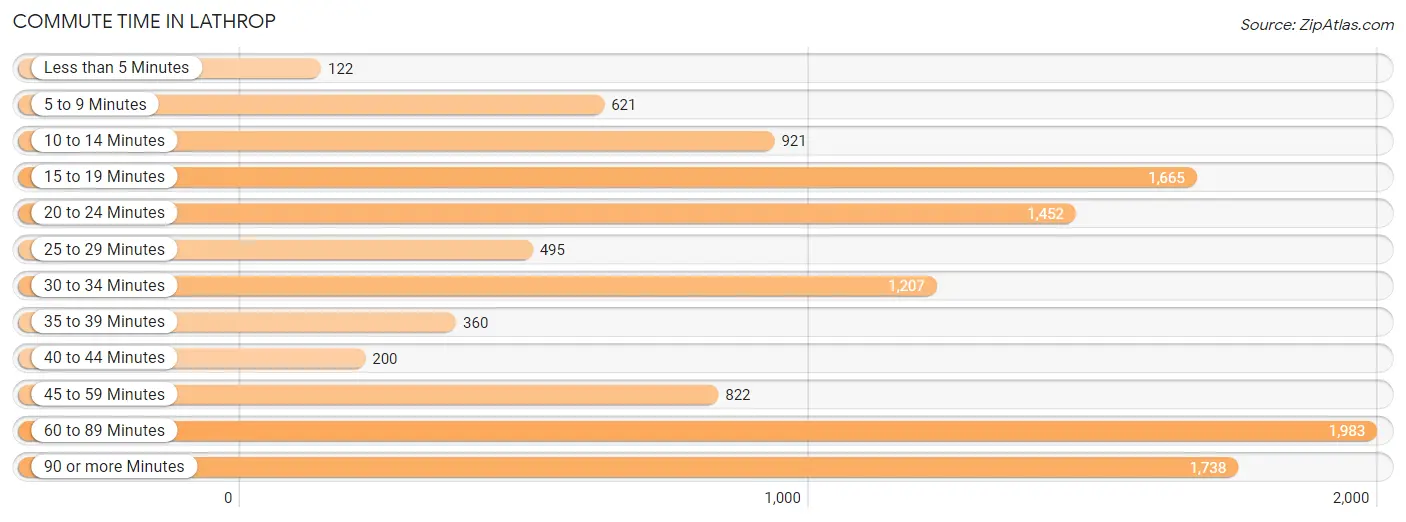
| Commute Time | # Commuters | % Commuters |
| Less than 5 Minutes | 122 | 1.1% |
| 5 to 9 Minutes | 621 | 5.4% |
| 10 to 14 Minutes | 921 | 8.0% |
| 15 to 19 Minutes | 1,665 | 14.4% |
| 20 to 24 Minutes | 1,452 | 12.5% |
| 25 to 29 Minutes | 495 | 4.3% |
| 30 to 34 Minutes | 1,207 | 10.4% |
| 35 to 39 Minutes | 360 | 3.1% |
| 40 to 44 Minutes | 200 | 1.7% |
| 45 to 59 Minutes | 822 | 7.1% |
| 60 to 89 Minutes | 1,983 | 17.1% |
| 90 or more Minutes | 1,738 | 15.0% |
Commute Time by Sex in Lathrop
The most common commute times in Lathrop are 90 or more minutes (1,376 commuters, 20.5%) for males and 15 to 19 minutes (1,001 commuters, 20.6%) for females.
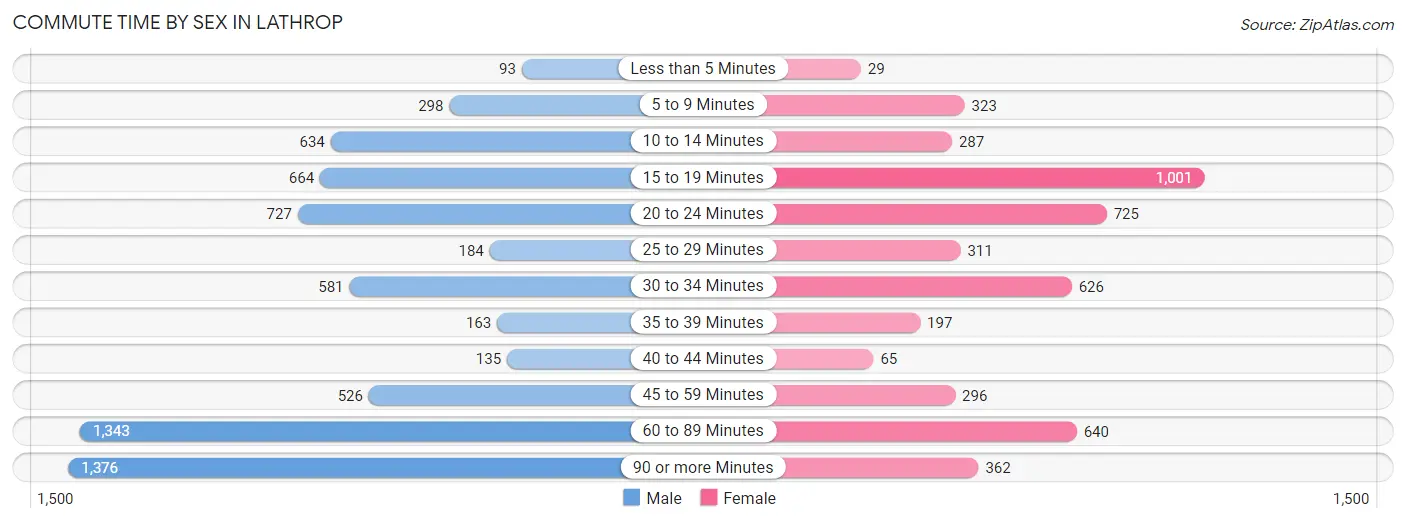
| Commute Time | Male | Female |
| Less than 5 Minutes | 93 (1.4%) | 29 (0.6%) |
| 5 to 9 Minutes | 298 (4.4%) | 323 (6.6%) |
| 10 to 14 Minutes | 634 (9.4%) | 287 (5.9%) |
| 15 to 19 Minutes | 664 (9.9%) | 1,001 (20.6%) |
| 20 to 24 Minutes | 727 (10.8%) | 725 (14.9%) |
| 25 to 29 Minutes | 184 (2.7%) | 311 (6.4%) |
| 30 to 34 Minutes | 581 (8.6%) | 626 (12.9%) |
| 35 to 39 Minutes | 163 (2.4%) | 197 (4.1%) |
| 40 to 44 Minutes | 135 (2.0%) | 65 (1.3%) |
| 45 to 59 Minutes | 526 (7.8%) | 296 (6.1%) |
| 60 to 89 Minutes | 1,343 (20.0%) | 640 (13.2%) |
| 90 or more Minutes | 1,376 (20.5%) | 362 (7.4%) |
Time of Departure to Work by Sex in Lathrop
The most frequent times of departure to work in Lathrop are 12:00 AM to 4:59 AM (999, 14.9%) for males and 4:00 PM to 11:59 PM (648, 13.3%) for females.
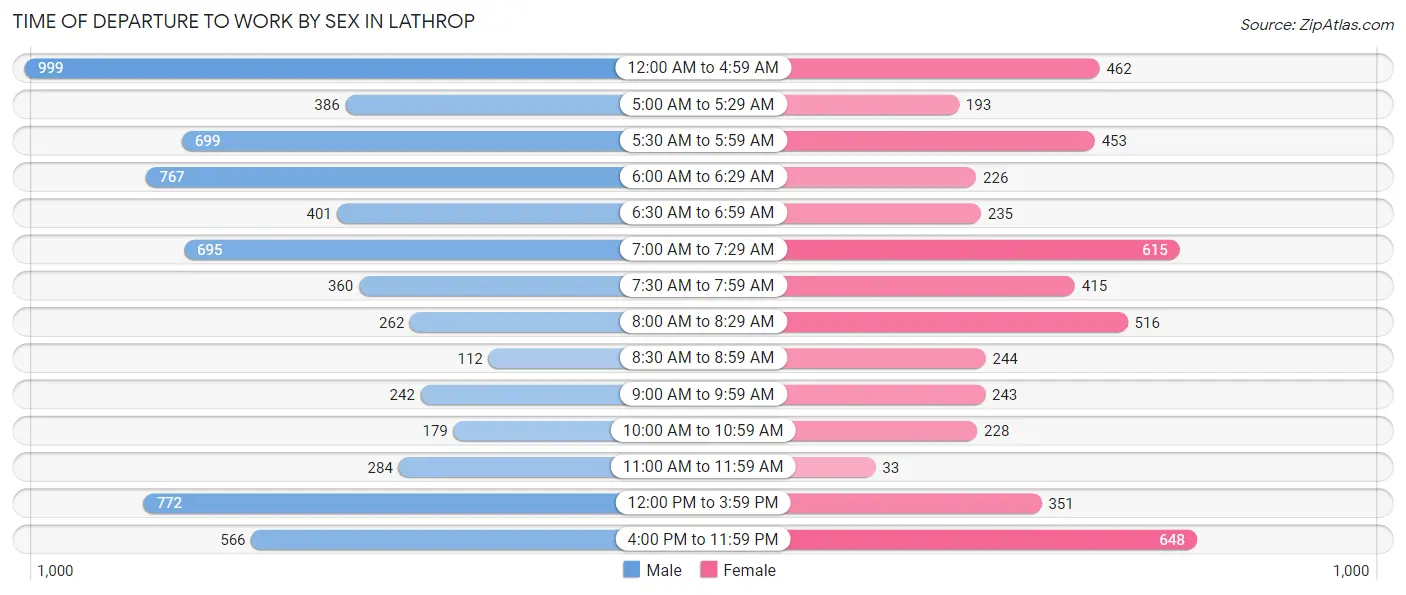
| Time of Departure | Male | Female |
| 12:00 AM to 4:59 AM | 999 (14.9%) | 462 (9.5%) |
| 5:00 AM to 5:29 AM | 386 (5.7%) | 193 (4.0%) |
| 5:30 AM to 5:59 AM | 699 (10.4%) | 453 (9.3%) |
| 6:00 AM to 6:29 AM | 767 (11.4%) | 226 (4.6%) |
| 6:30 AM to 6:59 AM | 401 (6.0%) | 235 (4.8%) |
| 7:00 AM to 7:29 AM | 695 (10.3%) | 615 (12.7%) |
| 7:30 AM to 7:59 AM | 360 (5.3%) | 415 (8.5%) |
| 8:00 AM to 8:29 AM | 262 (3.9%) | 516 (10.6%) |
| 8:30 AM to 8:59 AM | 112 (1.7%) | 244 (5.0%) |
| 9:00 AM to 9:59 AM | 242 (3.6%) | 243 (5.0%) |
| 10:00 AM to 10:59 AM | 179 (2.7%) | 228 (4.7%) |
| 11:00 AM to 11:59 AM | 284 (4.2%) | 33 (0.7%) |
| 12:00 PM to 3:59 PM | 772 (11.5%) | 351 (7.2%) |
| 4:00 PM to 11:59 PM | 566 (8.4%) | 648 (13.3%) |
| Total | 6,724 (100.0%) | 4,862 (100.0%) |
Housing Occupancy in Lathrop
Occupancy by Ownership in Lathrop
Of the total 7,359 dwellings in Lathrop, owner-occupied units account for 6,156 (83.7%), while renter-occupied units make up 1,203 (16.4%).
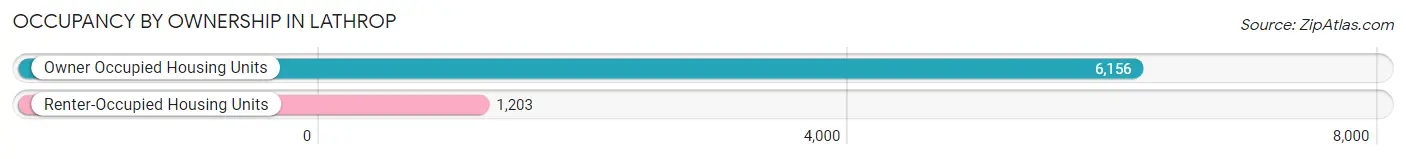
| Occupancy | # Housing Units | % Housing Units |
| Owner Occupied Housing Units | 6,156 | 83.7% |
| Renter-Occupied Housing Units | 1,203 | 16.4% |
| Total Occupied Housing Units | 7,359 | 100.0% |
Occupancy by Household Size in Lathrop
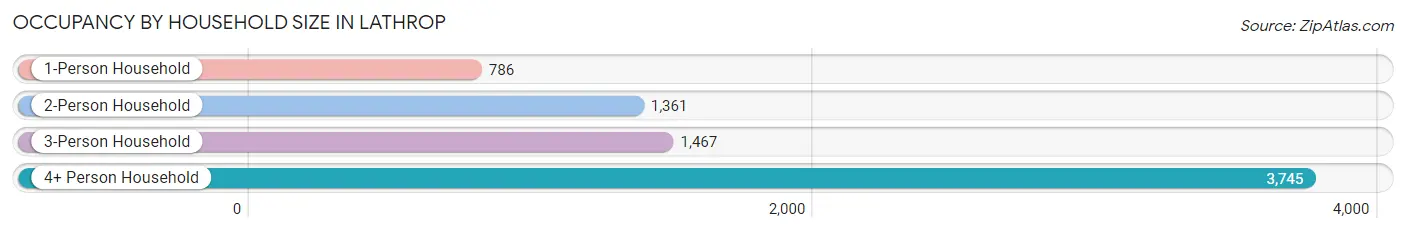
| Household Size | # Housing Units | % Housing Units |
| 1-Person Household | 786 | 10.7% |
| 2-Person Household | 1,361 | 18.5% |
| 3-Person Household | 1,467 | 19.9% |
| 4+ Person Household | 3,745 | 50.9% |
| Total Housing Units | 7,359 | 100.0% |
Occupancy by Ownership by Household Size in Lathrop
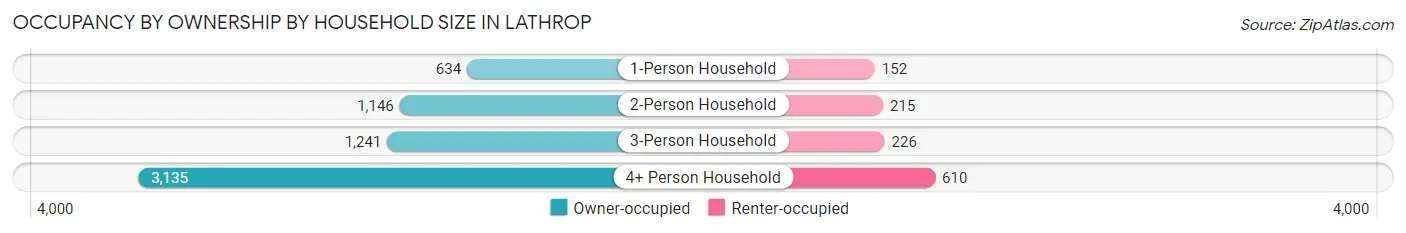
| Household Size | Owner-occupied | Renter-occupied |
| 1-Person Household | 634 (80.7%) | 152 (19.3%) |
| 2-Person Household | 1,146 (84.2%) | 215 (15.8%) |
| 3-Person Household | 1,241 (84.6%) | 226 (15.4%) |
| 4+ Person Household | 3,135 (83.7%) | 610 (16.3%) |
| Total Housing Units | 6,156 (83.7%) | 1,203 (16.4%) |
Occupancy by Educational Attainment in Lathrop
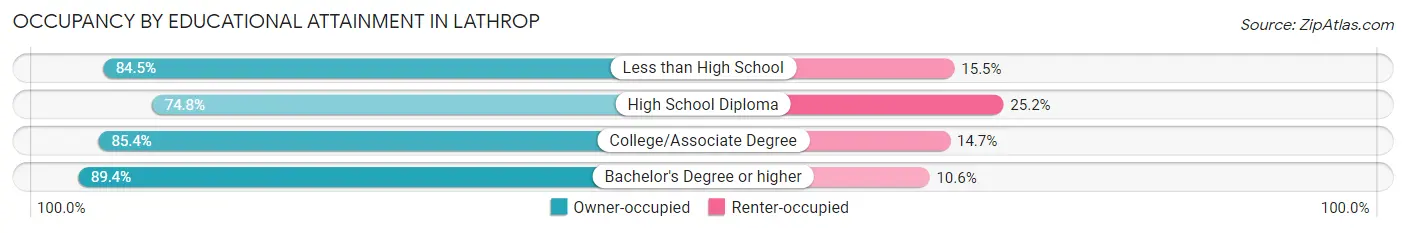
| Household Size | Owner-occupied | Renter-occupied |
| Less than High School | 1,172 (84.5%) | 215 (15.5%) |
| High School Diploma | 1,277 (74.8%) | 431 (25.2%) |
| College/Associate Degree | 2,226 (85.4%) | 382 (14.6%) |
| Bachelor's Degree or higher | 1,481 (89.4%) | 175 (10.6%) |
Occupancy by Age of Householder in Lathrop
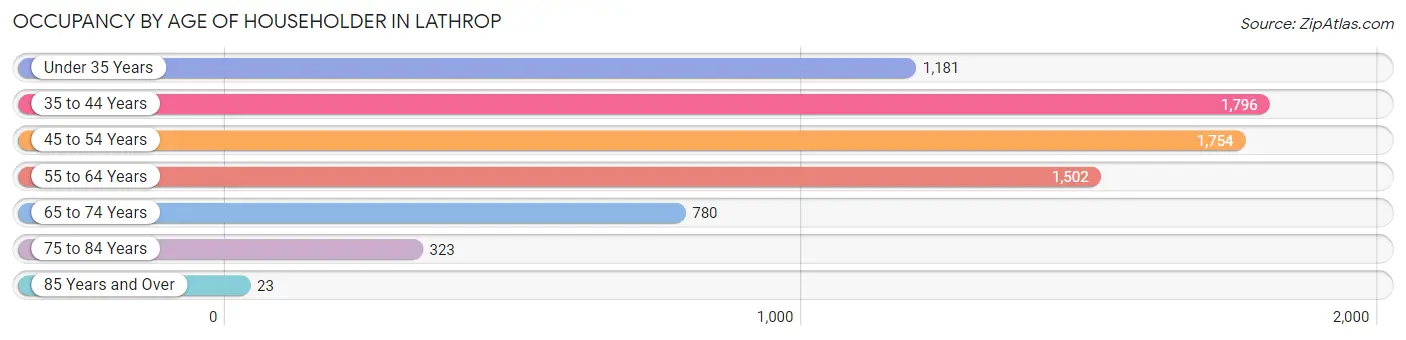
| Age Bracket | # Households | % Households |
| Under 35 Years | 1,181 | 16.1% |
| 35 to 44 Years | 1,796 | 24.4% |
| 45 to 54 Years | 1,754 | 23.8% |
| 55 to 64 Years | 1,502 | 20.4% |
| 65 to 74 Years | 780 | 10.6% |
| 75 to 84 Years | 323 | 4.4% |
| 85 Years and Over | 23 | 0.3% |
| Total | 7,359 | 100.0% |
Housing Finances in Lathrop
Median Income by Occupancy in Lathrop
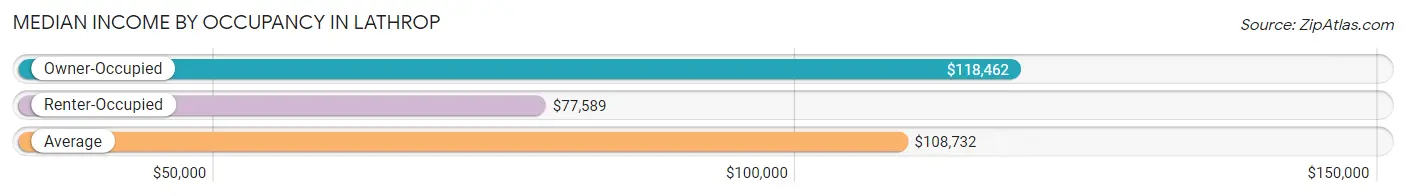
| Occupancy Type | # Households | Median Income |
| Owner-Occupied | 6,156 (83.7%) | $118,462 |
| Renter-Occupied | 1,203 (16.4%) | $77,589 |
| Average | 7,359 (100.0%) | $108,732 |
Occupancy by Householder Income Bracket in Lathrop
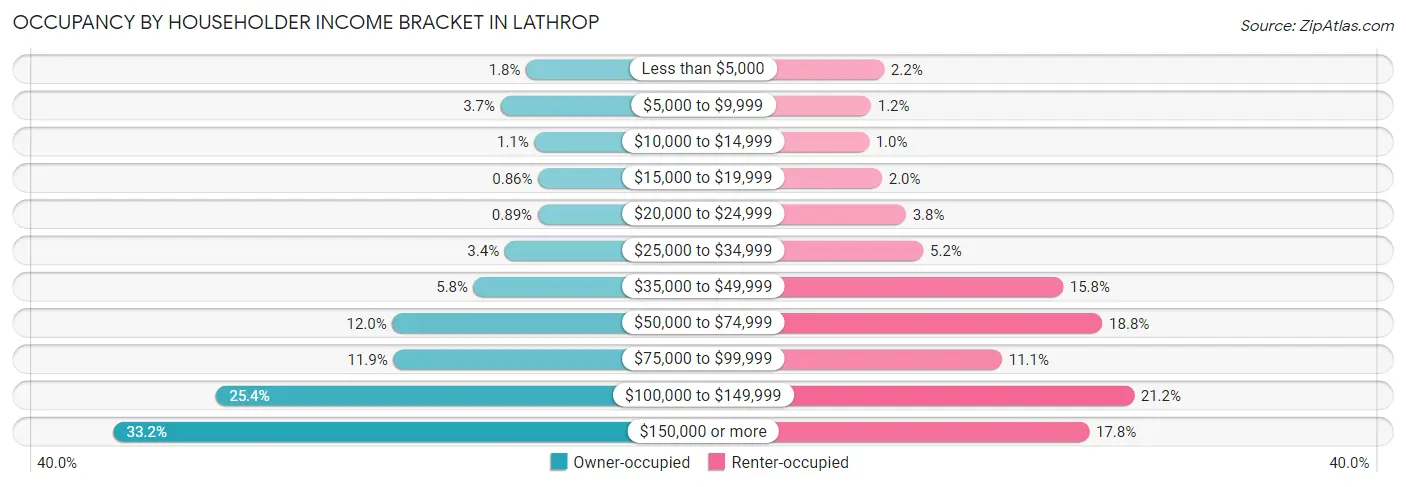
| Income Bracket | Owner-occupied | Renter-occupied |
| Less than $5,000 | 109 (1.8%) | 26 (2.2%) |
| $5,000 to $9,999 | 229 (3.7%) | 14 (1.2%) |
| $10,000 to $14,999 | 70 (1.1%) | 12 (1.0%) |
| $15,000 to $19,999 | 53 (0.9%) | 24 (2.0%) |
| $20,000 to $24,999 | 55 (0.9%) | 46 (3.8%) |
| $25,000 to $34,999 | 209 (3.4%) | 62 (5.1%) |
| $35,000 to $49,999 | 355 (5.8%) | 190 (15.8%) |
| $50,000 to $74,999 | 736 (12.0%) | 226 (18.8%) |
| $75,000 to $99,999 | 732 (11.9%) | 134 (11.1%) |
| $100,000 to $149,999 | 1,563 (25.4%) | 255 (21.2%) |
| $150,000 or more | 2,045 (33.2%) | 214 (17.8%) |
| Total | 6,156 (100.0%) | 1,203 (100.0%) |
Monthly Housing Cost Tiers in Lathrop
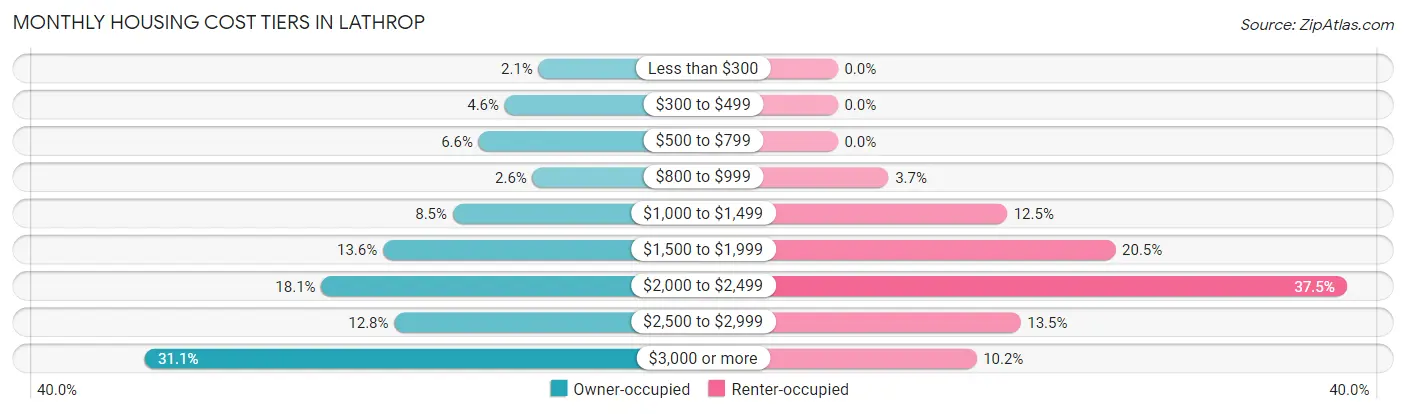
| Monthly Cost | Owner-occupied | Renter-occupied |
| Less than $300 | 132 (2.1%) | 0 (0.0%) |
| $300 to $499 | 285 (4.6%) | 0 (0.0%) |
| $500 to $799 | 403 (6.6%) | 0 (0.0%) |
| $800 to $999 | 159 (2.6%) | 45 (3.7%) |
| $1,000 to $1,499 | 521 (8.5%) | 150 (12.5%) |
| $1,500 to $1,999 | 837 (13.6%) | 246 (20.4%) |
| $2,000 to $2,499 | 1,117 (18.1%) | 451 (37.5%) |
| $2,500 to $2,999 | 786 (12.8%) | 162 (13.5%) |
| $3,000 or more | 1,916 (31.1%) | 123 (10.2%) |
| Total | 6,156 (100.0%) | 1,203 (100.0%) |
Physical Housing Characteristics in Lathrop
Housing Structures in Lathrop
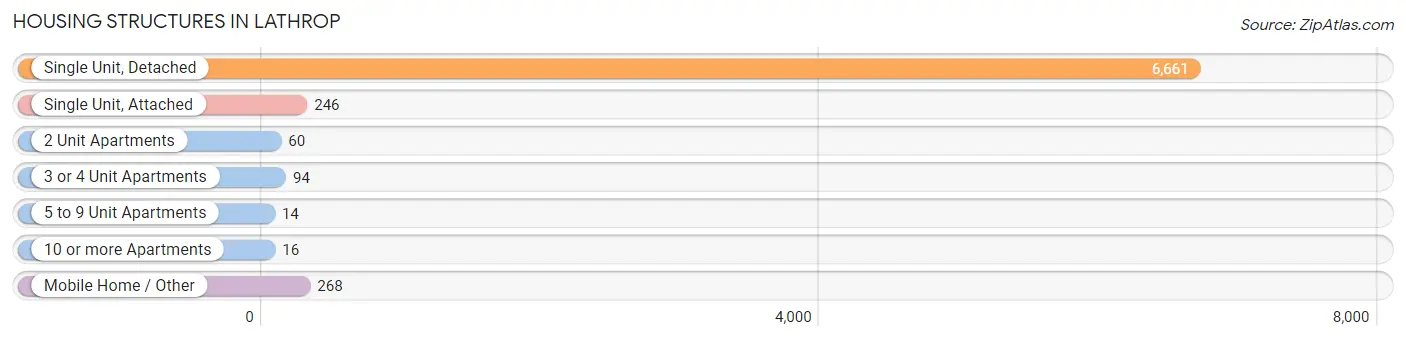
| Structure Type | # Housing Units | % Housing Units |
| Single Unit, Detached | 6,661 | 90.5% |
| Single Unit, Attached | 246 | 3.3% |
| 2 Unit Apartments | 60 | 0.8% |
| 3 or 4 Unit Apartments | 94 | 1.3% |
| 5 to 9 Unit Apartments | 14 | 0.2% |
| 10 or more Apartments | 16 | 0.2% |
| Mobile Home / Other | 268 | 3.6% |
| Total | 7,359 | 100.0% |
Housing Structures by Occupancy in Lathrop
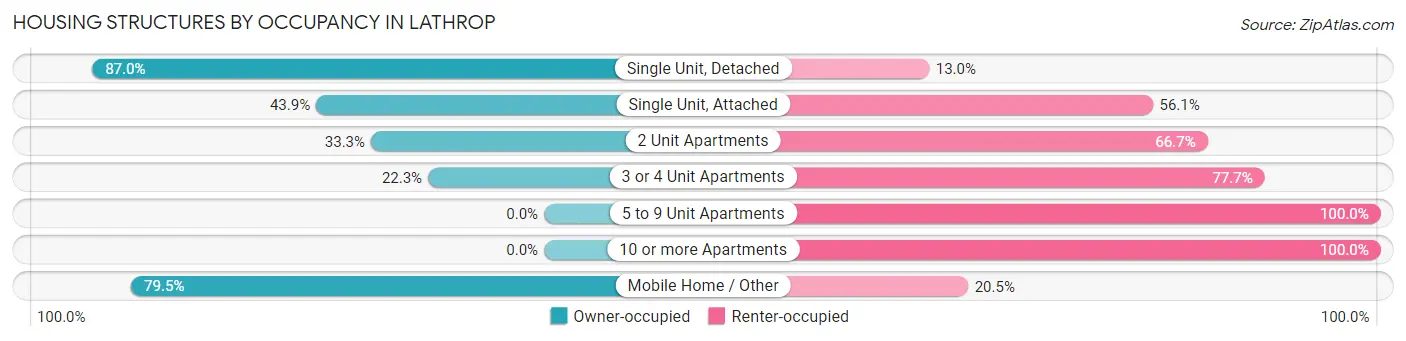
| Structure Type | Owner-occupied | Renter-occupied |
| Single Unit, Detached | 5,794 (87.0%) | 867 (13.0%) |
| Single Unit, Attached | 108 (43.9%) | 138 (56.1%) |
| 2 Unit Apartments | 20 (33.3%) | 40 (66.7%) |
| 3 or 4 Unit Apartments | 21 (22.3%) | 73 (77.7%) |
| 5 to 9 Unit Apartments | 0 (0.0%) | 14 (100.0%) |
| 10 or more Apartments | 0 (0.0%) | 16 (100.0%) |
| Mobile Home / Other | 213 (79.5%) | 55 (20.5%) |
| Total | 6,156 (83.7%) | 1,203 (16.4%) |
Housing Structures by Number of Rooms in Lathrop
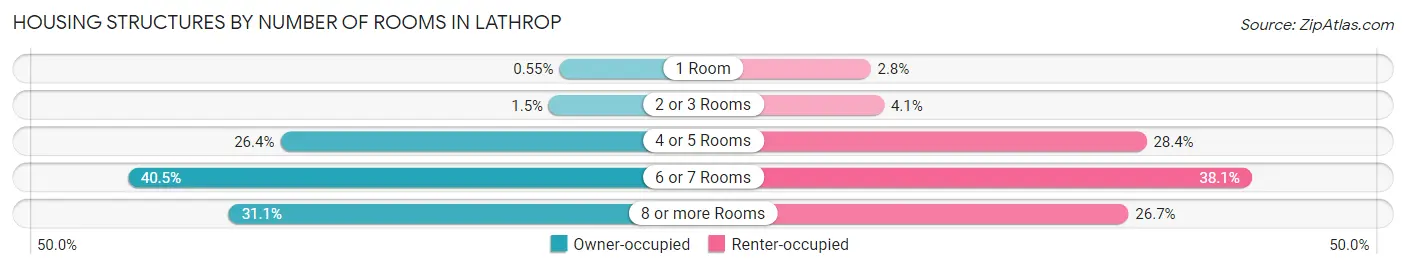
| Number of Rooms | Owner-occupied | Renter-occupied |
| 1 Room | 34 (0.5%) | 34 (2.8%) |
| 2 or 3 Rooms | 93 (1.5%) | 49 (4.1%) |
| 4 or 5 Rooms | 1,623 (26.4%) | 341 (28.3%) |
| 6 or 7 Rooms | 2,490 (40.5%) | 458 (38.1%) |
| 8 or more Rooms | 1,916 (31.1%) | 321 (26.7%) |
| Total | 6,156 (100.0%) | 1,203 (100.0%) |
Housing Structure by Heating Type in Lathrop
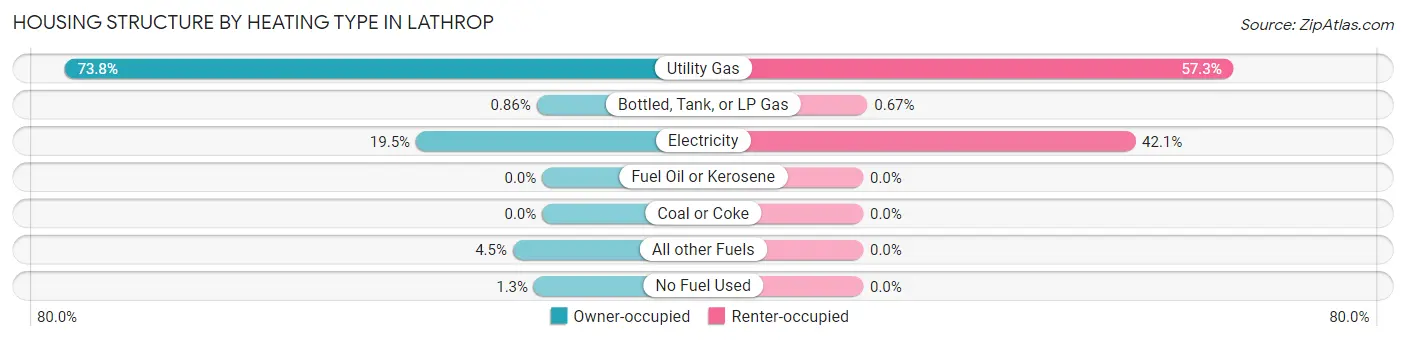
| Heating Type | Owner-occupied | Renter-occupied |
| Utility Gas | 4,545 (73.8%) | 689 (57.3%) |
| Bottled, Tank, or LP Gas | 53 (0.9%) | 8 (0.7%) |
| Electricity | 1,201 (19.5%) | 506 (42.1%) |
| Fuel Oil or Kerosene | 0 (0.0%) | 0 (0.0%) |
| Coal or Coke | 0 (0.0%) | 0 (0.0%) |
| All other Fuels | 279 (4.5%) | 0 (0.0%) |
| No Fuel Used | 78 (1.3%) | 0 (0.0%) |
| Total | 6,156 (100.0%) | 1,203 (100.0%) |
Household Vehicle Usage in Lathrop
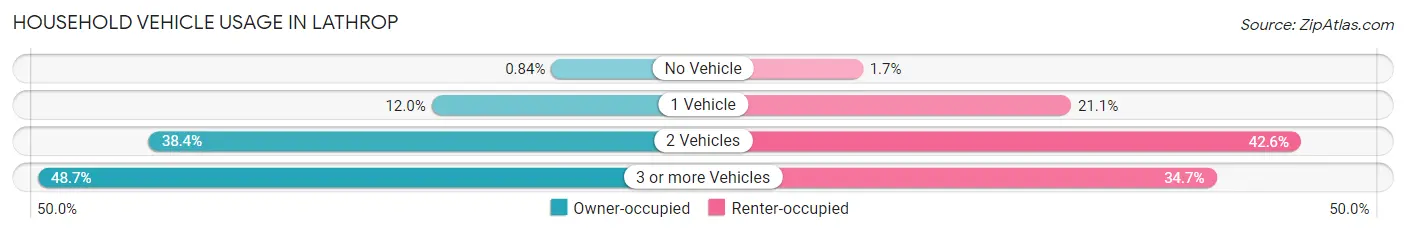
| Vehicles per Household | Owner-occupied | Renter-occupied |
| No Vehicle | 52 (0.8%) | 20 (1.7%) |
| 1 Vehicle | 740 (12.0%) | 254 (21.1%) |
| 2 Vehicles | 2,364 (38.4%) | 512 (42.6%) |
| 3 or more Vehicles | 3,000 (48.7%) | 417 (34.7%) |
| Total | 6,156 (100.0%) | 1,203 (100.0%) |
Real Estate & Mortgages in Lathrop
Real Estate and Mortgage Overview in Lathrop
| Characteristic | Without Mortgage | With Mortgage |
| Housing Units | 1,337 | 4,819 |
| Median Property Value | $461,800 | $564,800 |
| Median Household Income | $69,973 | $1,750 |
| Monthly Housing Costs | $710 | $1,841 |
| Real Estate Taxes | $3,046 | $48 |
Property Value by Mortgage Status in Lathrop
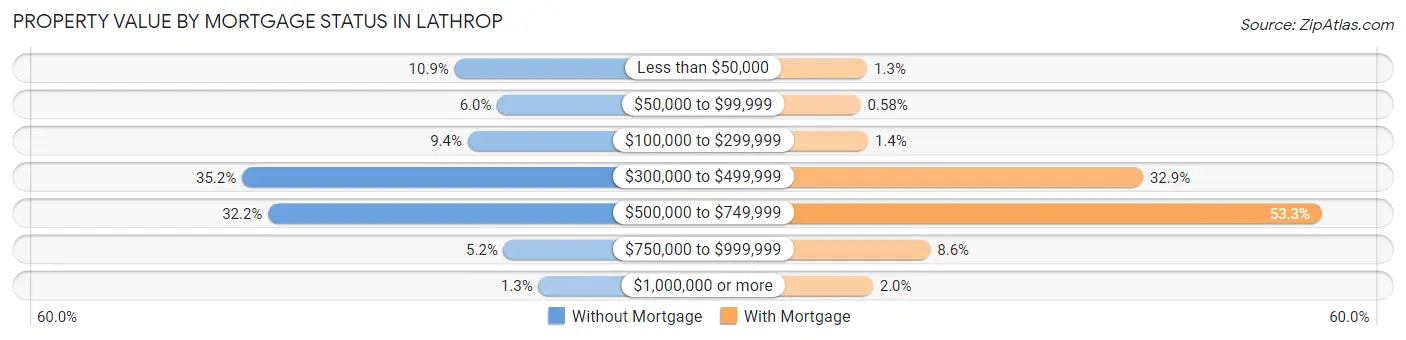
| Property Value | Without Mortgage | With Mortgage |
| Less than $50,000 | 145 (10.8%) | 64 (1.3%) |
| $50,000 to $99,999 | 80 (6.0%) | 28 (0.6%) |
| $100,000 to $299,999 | 125 (9.3%) | 69 (1.4%) |
| $300,000 to $499,999 | 470 (35.1%) | 1,583 (32.9%) |
| $500,000 to $749,999 | 430 (32.2%) | 2,568 (53.3%) |
| $750,000 to $999,999 | 70 (5.2%) | 412 (8.6%) |
| $1,000,000 or more | 17 (1.3%) | 95 (2.0%) |
| Total | 1,337 (100.0%) | 4,819 (100.0%) |
Household Income by Mortgage Status in Lathrop
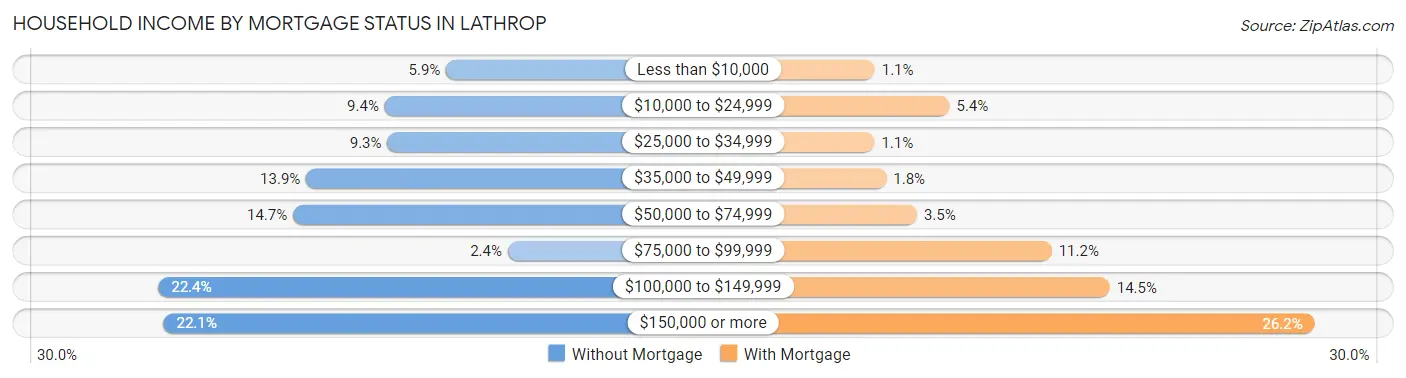
| Household Income | Without Mortgage | With Mortgage |
| Less than $10,000 | 79 (5.9%) | 53 (1.1%) |
| $10,000 to $24,999 | 126 (9.4%) | 259 (5.4%) |
| $25,000 to $34,999 | 124 (9.3%) | 52 (1.1%) |
| $35,000 to $49,999 | 186 (13.9%) | 85 (1.8%) |
| $50,000 to $74,999 | 196 (14.7%) | 169 (3.5%) |
| $75,000 to $99,999 | 32 (2.4%) | 540 (11.2%) |
| $100,000 to $149,999 | 299 (22.4%) | 700 (14.5%) |
| $150,000 or more | 295 (22.1%) | 1,264 (26.2%) |
| Total | 1,337 (100.0%) | 4,819 (100.0%) |
Property Value to Household Income Ratio in Lathrop
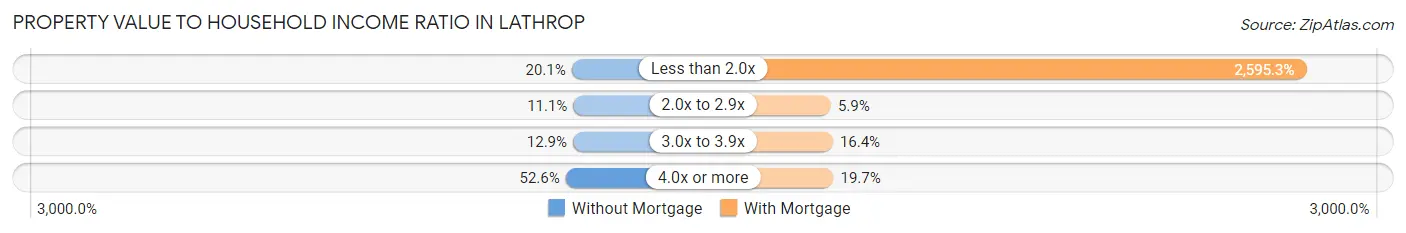
| Value-to-Income Ratio | Without Mortgage | With Mortgage |
| Less than 2.0x | 269 (20.1%) | 125,066 (2,595.3%) |
| 2.0x to 2.9x | 149 (11.1%) | 282 (5.9%) |
| 3.0x to 3.9x | 172 (12.9%) | 790 (16.4%) |
| 4.0x or more | 703 (52.6%) | 951 (19.7%) |
| Total | 1,337 (100.0%) | 4,819 (100.0%) |
Real Estate Taxes by Mortgage Status in Lathrop
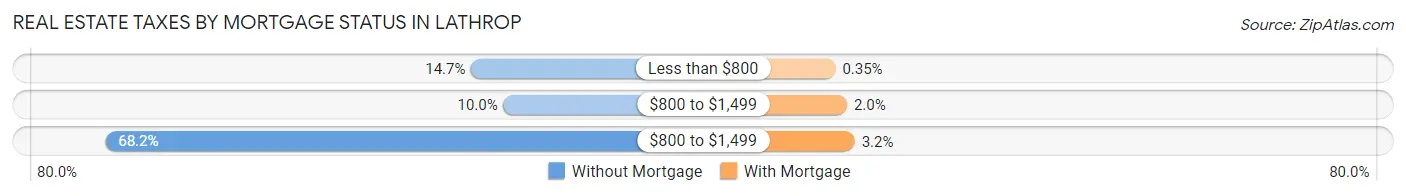
| Property Taxes | Without Mortgage | With Mortgage |
| Less than $800 | 197 (14.7%) | 17 (0.4%) |
| $800 to $1,499 | 134 (10.0%) | 98 (2.0%) |
| $800 to $1,499 | 912 (68.2%) | 153 (3.2%) |
| Total | 1,337 (100.0%) | 4,819 (100.0%) |
Health & Disability in Lathrop
Health Insurance Coverage by Age in Lathrop
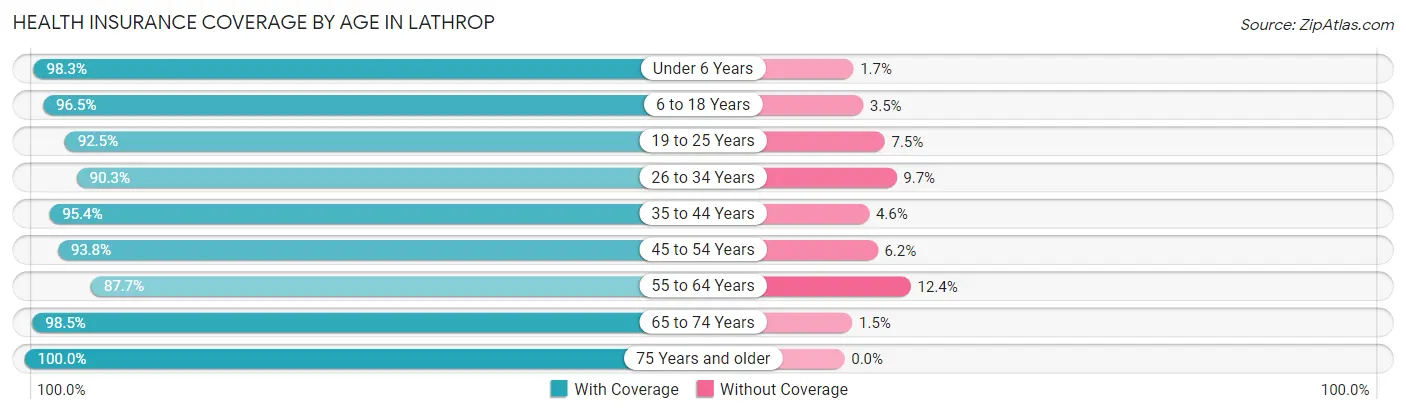
| Age Bracket | With Coverage | Without Coverage |
| Under 6 Years | 2,655 (98.3%) | 45 (1.7%) |
| 6 to 18 Years | 6,162 (96.5%) | 221 (3.5%) |
| 19 to 25 Years | 2,490 (92.5%) | 202 (7.5%) |
| 26 to 34 Years | 3,145 (90.3%) | 338 (9.7%) |
| 35 to 44 Years | 4,150 (95.4%) | 200 (4.6%) |
| 45 to 54 Years | 3,606 (93.8%) | 238 (6.2%) |
| 55 to 64 Years | 2,783 (87.6%) | 392 (12.3%) |
| 65 to 74 Years | 2,031 (98.5%) | 30 (1.5%) |
| 75 Years and older | 921 (100.0%) | 0 (0.0%) |
| Total | 27,943 (94.4%) | 1,666 (5.6%) |
Health Insurance Coverage by Citizenship Status in Lathrop
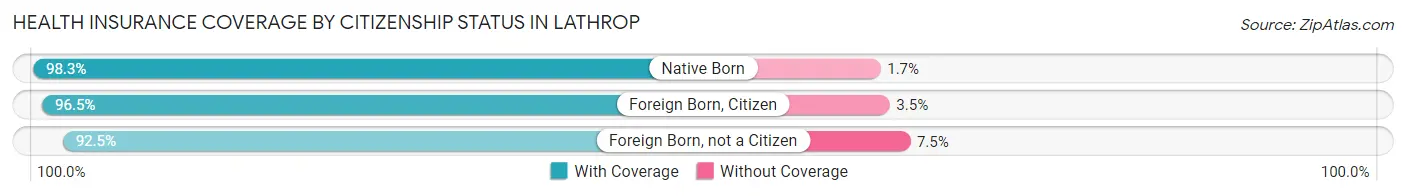
| Citizenship Status | With Coverage | Without Coverage |
| Native Born | 2,655 (98.3%) | 45 (1.7%) |
| Foreign Born, Citizen | 6,162 (96.5%) | 221 (3.5%) |
| Foreign Born, not a Citizen | 2,490 (92.5%) | 202 (7.5%) |
Health Insurance Coverage by Household Income in Lathrop
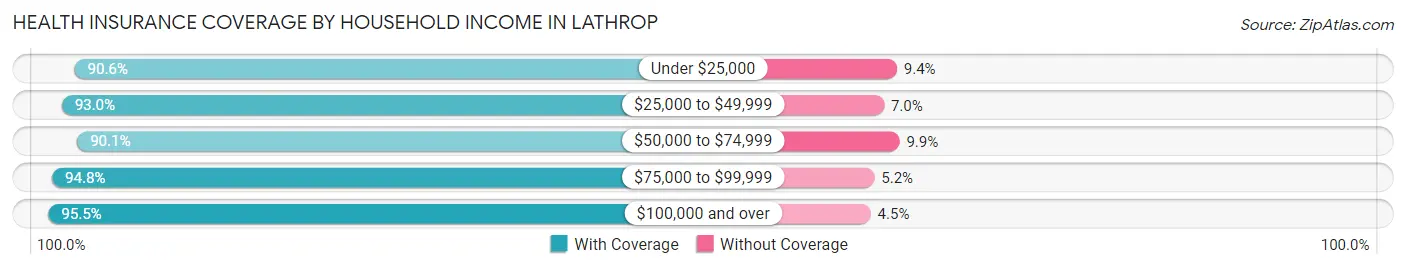
| Household Income | With Coverage | Without Coverage |
| Under $25,000 | 1,643 (90.6%) | 170 (9.4%) |
| $25,000 to $49,999 | 2,194 (93.0%) | 164 (7.0%) |
| $50,000 to $74,999 | 2,867 (90.1%) | 314 (9.9%) |
| $75,000 to $99,999 | 3,267 (94.8%) | 178 (5.2%) |
| $100,000 and over | 17,958 (95.5%) | 840 (4.5%) |
Public vs Private Health Insurance Coverage by Age in Lathrop
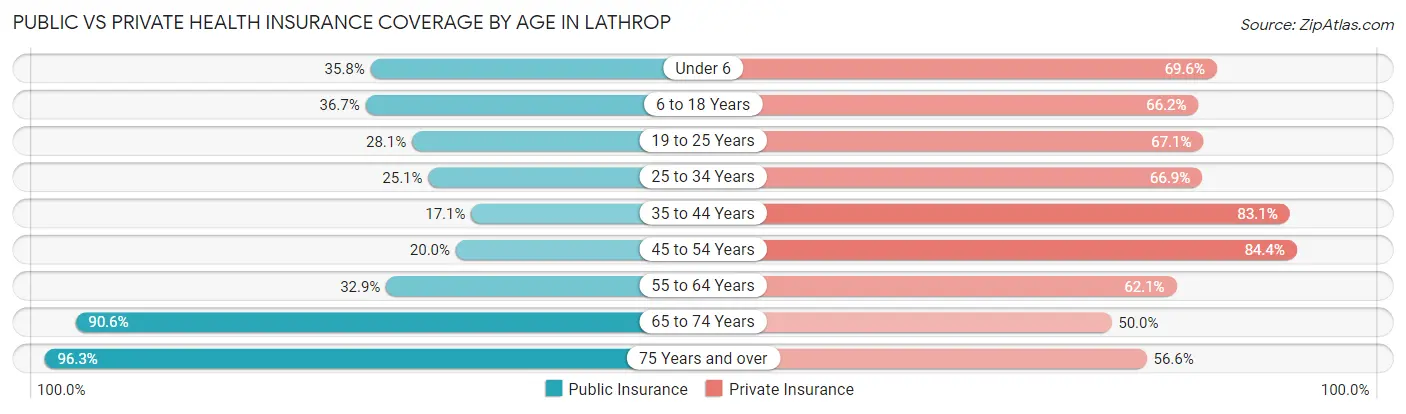
| Age Bracket | Public Insurance | Private Insurance |
| Under 6 | 966 (35.8%) | 1,879 (69.6%) |
| 6 to 18 Years | 2,343 (36.7%) | 4,224 (66.2%) |
| 19 to 25 Years | 756 (28.1%) | 1,806 (67.1%) |
| 25 to 34 Years | 873 (25.1%) | 2,329 (66.9%) |
| 35 to 44 Years | 743 (17.1%) | 3,615 (83.1%) |
| 45 to 54 Years | 767 (20.0%) | 3,246 (84.4%) |
| 55 to 64 Years | 1,044 (32.9%) | 1,972 (62.1%) |
| 65 to 74 Years | 1,867 (90.6%) | 1,031 (50.0%) |
| 75 Years and over | 887 (96.3%) | 521 (56.6%) |
| Total | 10,246 (34.6%) | 20,623 (69.7%) |
Disability Status by Sex by Age in Lathrop
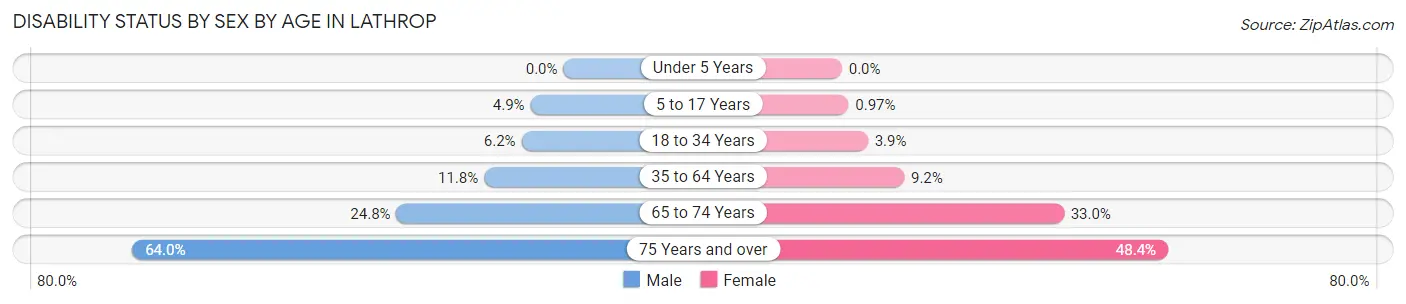
| Age Bracket | Male | Female |
| Under 5 Years | 0 (0.0%) | 0 (0.0%) |
| 5 to 17 Years | 162 (4.9%) | 31 (1.0%) |
| 18 to 34 Years | 198 (6.2%) | 129 (3.8%) |
| 35 to 64 Years | 685 (11.8%) | 513 (9.2%) |
| 65 to 74 Years | 234 (24.8%) | 368 (33.0%) |
| 75 Years and over | 185 (64.0%) | 306 (48.4%) |
Disability Class by Sex by Age in Lathrop
Disability Class: Hearing Difficulty
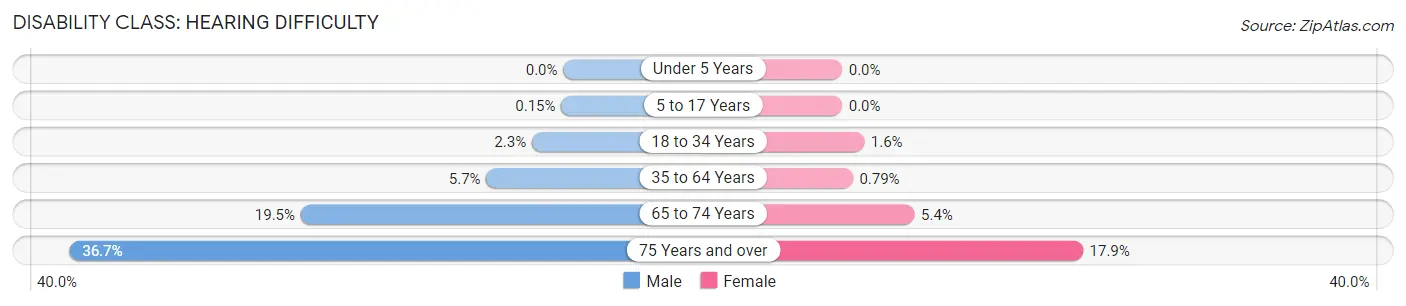
| Age Bracket | Male | Female |
| Under 5 Years | 0 (0.0%) | 0 (0.0%) |
| 5 to 17 Years | 5 (0.2%) | 0 (0.0%) |
| 18 to 34 Years | 74 (2.3%) | 55 (1.6%) |
| 35 to 64 Years | 332 (5.7%) | 44 (0.8%) |
| 65 to 74 Years | 184 (19.5%) | 60 (5.4%) |
| 75 Years and over | 106 (36.7%) | 113 (17.9%) |
Disability Class: Vision Difficulty
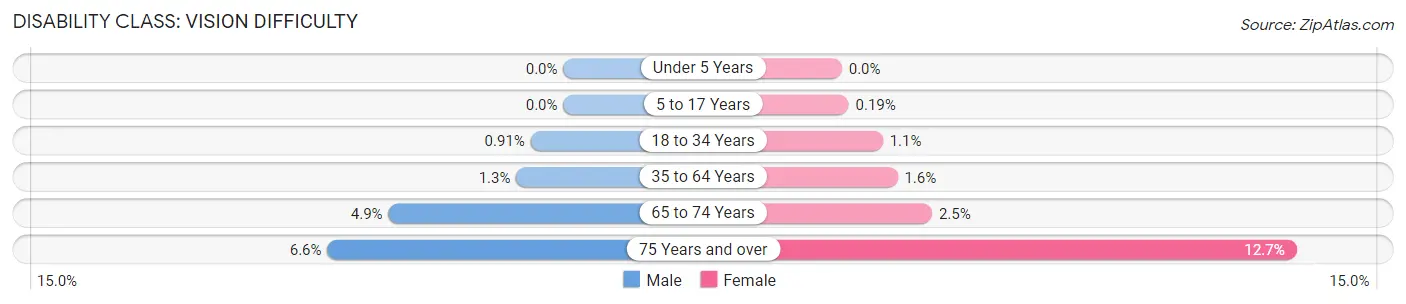
| Age Bracket | Male | Female |
| Under 5 Years | 0 (0.0%) | 0 (0.0%) |
| 5 to 17 Years | 0 (0.0%) | 6 (0.2%) |
| 18 to 34 Years | 29 (0.9%) | 38 (1.1%) |
| 35 to 64 Years | 76 (1.3%) | 86 (1.5%) |
| 65 to 74 Years | 46 (4.9%) | 28 (2.5%) |
| 75 Years and over | 19 (6.6%) | 80 (12.7%) |
Disability Class: Cognitive Difficulty
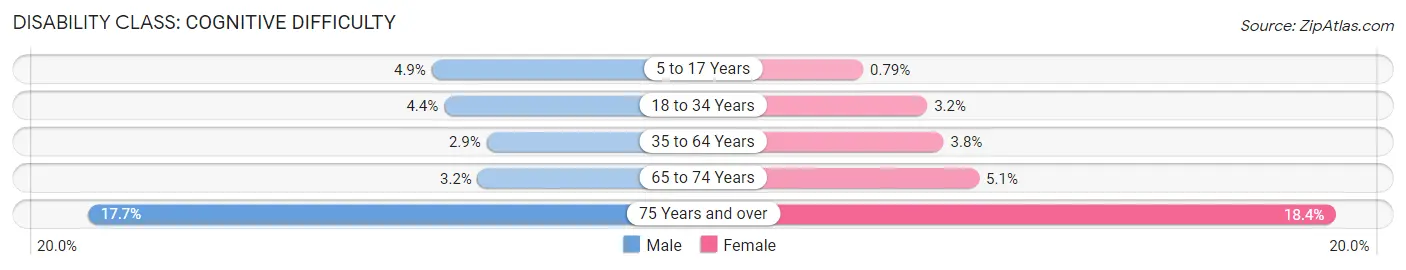
| Age Bracket | Male | Female |
| 5 to 17 Years | 162 (4.9%) | 25 (0.8%) |
| 18 to 34 Years | 141 (4.4%) | 106 (3.2%) |
| 35 to 64 Years | 166 (2.9%) | 210 (3.8%) |
| 65 to 74 Years | 30 (3.2%) | 57 (5.1%) |
| 75 Years and over | 51 (17.6%) | 116 (18.3%) |
Disability Class: Ambulatory Difficulty
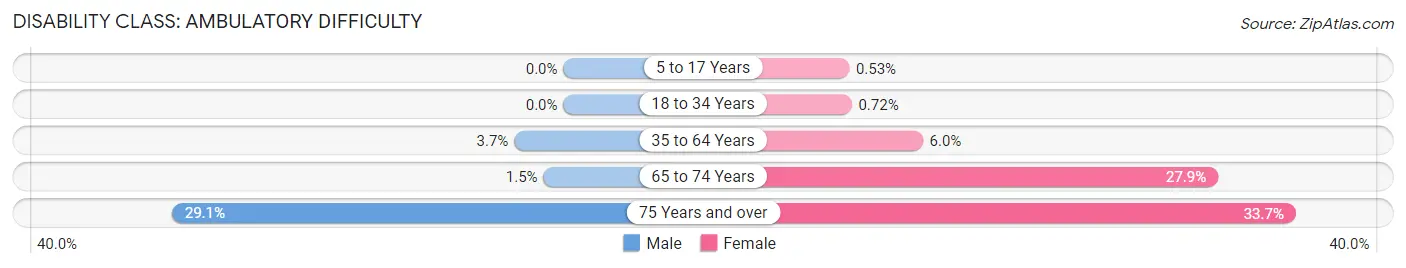
| Age Bracket | Male | Female |
| 5 to 17 Years | 0 (0.0%) | 17 (0.5%) |
| 18 to 34 Years | 0 (0.0%) | 24 (0.7%) |
| 35 to 64 Years | 212 (3.6%) | 333 (6.0%) |
| 65 to 74 Years | 14 (1.5%) | 312 (27.9%) |
| 75 Years and over | 84 (29.1%) | 213 (33.7%) |
Disability Class: Self-Care Difficulty
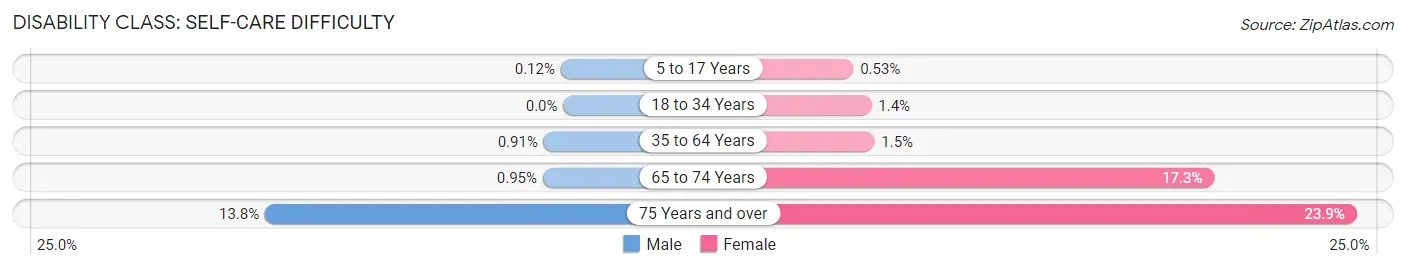
| Age Bracket | Male | Female |
| 5 to 17 Years | 4 (0.1%) | 17 (0.5%) |
| 18 to 34 Years | 0 (0.0%) | 46 (1.4%) |
| 35 to 64 Years | 53 (0.9%) | 84 (1.5%) |
| 65 to 74 Years | 9 (0.9%) | 193 (17.3%) |
| 75 Years and over | 40 (13.8%) | 151 (23.9%) |
Technology Access in Lathrop
Computing Device Access in Lathrop
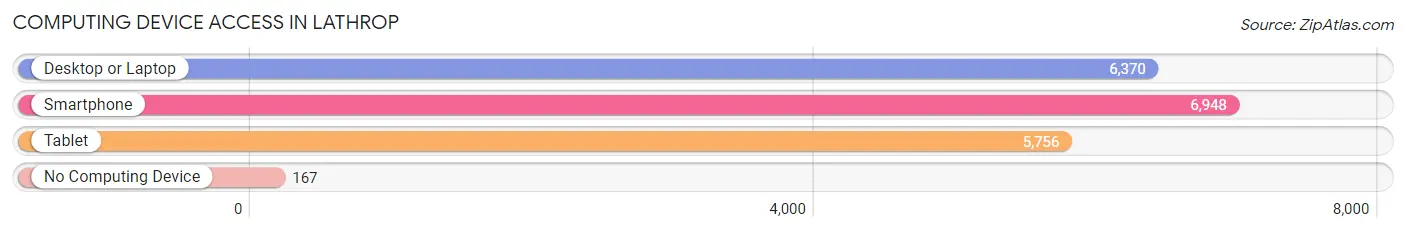
| Device Type | # Households | % Households |
| Desktop or Laptop | 6,370 | 86.6% |
| Smartphone | 6,948 | 94.4% |
| Tablet | 5,756 | 78.2% |
| No Computing Device | 167 | 2.3% |
| Total | 7,359 | 100.0% |
Internet Access in Lathrop
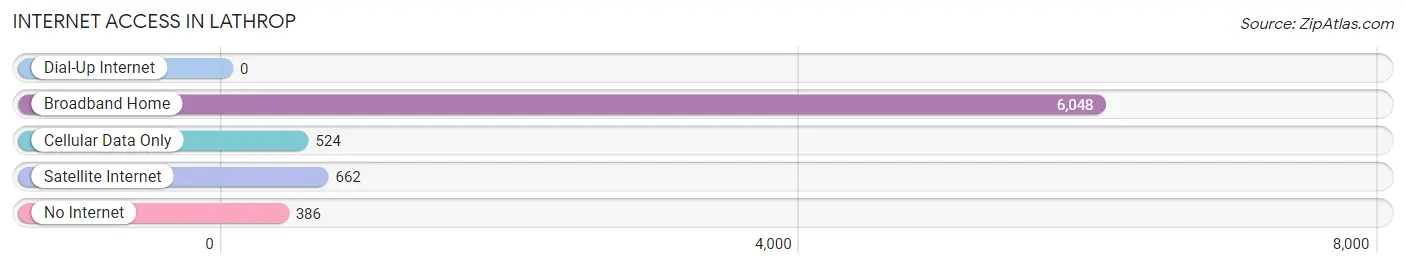
| Internet Type | # Households | % Households |
| Dial-Up Internet | 0 | 0.0% |
| Broadband Home | 6,048 | 82.2% |
| Cellular Data Only | 524 | 7.1% |
| Satellite Internet | 662 | 9.0% |
| No Internet | 386 | 5.2% |
| Total | 7,359 | 100.0% |
Lathrop Summary
Lathrop is a city located in San Joaquin County, California, United States. The city is located in the Central Valley, approximately 85 miles east of San Francisco and 70 miles south of Sacramento. As of the 2010 United States Census, the city had a population of 18,023.
History
The area that is now Lathrop was originally inhabited by the Yokut people, who were later displaced by Spanish settlers in the late 18th century. The area was part of the Rancho del Campo de Los Franceses, a Mexican land grant given to the family of Ygnacio Martinez in 1844. The area was later purchased by John Lathrop, a San Francisco businessman, in 1869. Lathrop established a large ranch and built a home on the property, which he named “Lathrop House”.
In the early 20th century, the area began to develop as a farming community. In 1909, the Southern Pacific Railroad built a line through the area, connecting it to the rest of the state. The city was officially incorporated in 1989.
Geography
Lathrop is located at 37°49′N 121°17′W (37.817, -121.283). According to the United States Census Bureau, the city has a total area of 8.3 square miles (21.5 km2), all of it land.
The city is located in the Central Valley, approximately 85 miles east of San Francisco and 70 miles south of Sacramento. It is bordered by the cities of Manteca to the north, Tracy to the east, and Stockton to the south.
Economy
Lathrop is a primarily residential city, with a small but growing commercial sector. The city’s largest employers are the Lathrop Unified School District, the City of Lathrop, and the Lathrop-Manteca Fire District.
The city is home to several industrial parks, including the Lathrop Business Park, the Lathrop Industrial Park, and the Lathrop Logistics Center. These parks are home to a variety of businesses, including manufacturing, warehousing, and distribution companies.
Demographics
As of the 2010 United States Census, there were 18,023 people, 5,845 households, and 4,717 families residing in the city. The population density was 2,164.3 people per square mile (835.2/km2). There were 6,093 housing units at an average density of 735.2 per square mile (284.2/km2). The racial makeup of the city was 57.2% White, 5.3% African American, 1.2% Native American, 8.2% Asian, 0.7% Pacific Islander, 24.2% from other races, and 3.3% from two or more races. Hispanic or Latino of any race were 44.2% of the population.
There were 5,845 households, out of which 44.2% had children under the age of 18 living with them, 54.2% were married couples living together, 15.2% had a female householder with no husband present, and 24.2% were non-families. 19.2% of all households were made up of individuals, and 6.2% had someone living alone who was 65 years of age or older. The average household size was 3.06 and the average family size was 3.50.
The median income for a household in the city was $60,945, and the median income for a family was $67,945. Males had a median income of $50,945 versus $37,945 for females. The per capita income for the city was $23,945. About 8.2% of families and 10.2% of the population were below the poverty line, including 14.2% of those under age 18 and 6.2% of those age 65 or over.
Common Questions
What is Per Capita Income in Lathrop?
Per Capita income in Lathrop is $33,980.
What is the Median Family Income in Lathrop?
Median Family Income in Lathrop is $112,971.
What is the Median Household income in Lathrop?
Median Household Income in Lathrop is $108,732.
What is Income or Wage Gap in Lathrop?
Income or Wage Gap in Lathrop is 39.4%.
Women in Lathrop earn 60.6 cents for every dollar earned by a man.
What is Family Income Deficit in Lathrop?
Family Income Deficit in Lathrop is $14,739.
Families that are below poverty line in Lathrop earn $14,739 less on average than the poverty threshold level.
What is Inequality or Gini Index in Lathrop?
Inequality or Gini Index in Lathrop is 0.41.
What is the Total Population of Lathrop?
Total Population of Lathrop is 29,633.
What is the Total Male Population of Lathrop?
Total Male Population of Lathrop is 14,812.
What is the Total Female Population of Lathrop?
Total Female Population of Lathrop is 14,821.
What is the Ratio of Males per 100 Females in Lathrop?
There are 99.94 Males per 100 Females in Lathrop.
What is the Ratio of Females per 100 Males in Lathrop?
There are 100.06 Females per 100 Males in Lathrop.
What is the Median Population Age in Lathrop?
Median Population Age in Lathrop is 33.5 Years.
What is the Average Family Size in Lathrop
Average Family Size in Lathrop is 4.2 People.
What is the Average Household Size in Lathrop
Average Household Size in Lathrop is 4.0 People.
How Large is the Labor Force in Lathrop?
There are 14,088 People in the Labor Forcein in Lathrop.
What is the Percentage of People in the Labor Force in Lathrop?
64.7% of People are in the Labor Force in Lathrop.
What is the Unemployment Rate in Lathrop?
Unemployment Rate in Lathrop is 8.9%.