Cities with the Highest Percentage of Subsaharan African Population in North Carolina
RELATED REPORTS & OPTIONS
Subsaharan African
North Carolina
Compare Cities
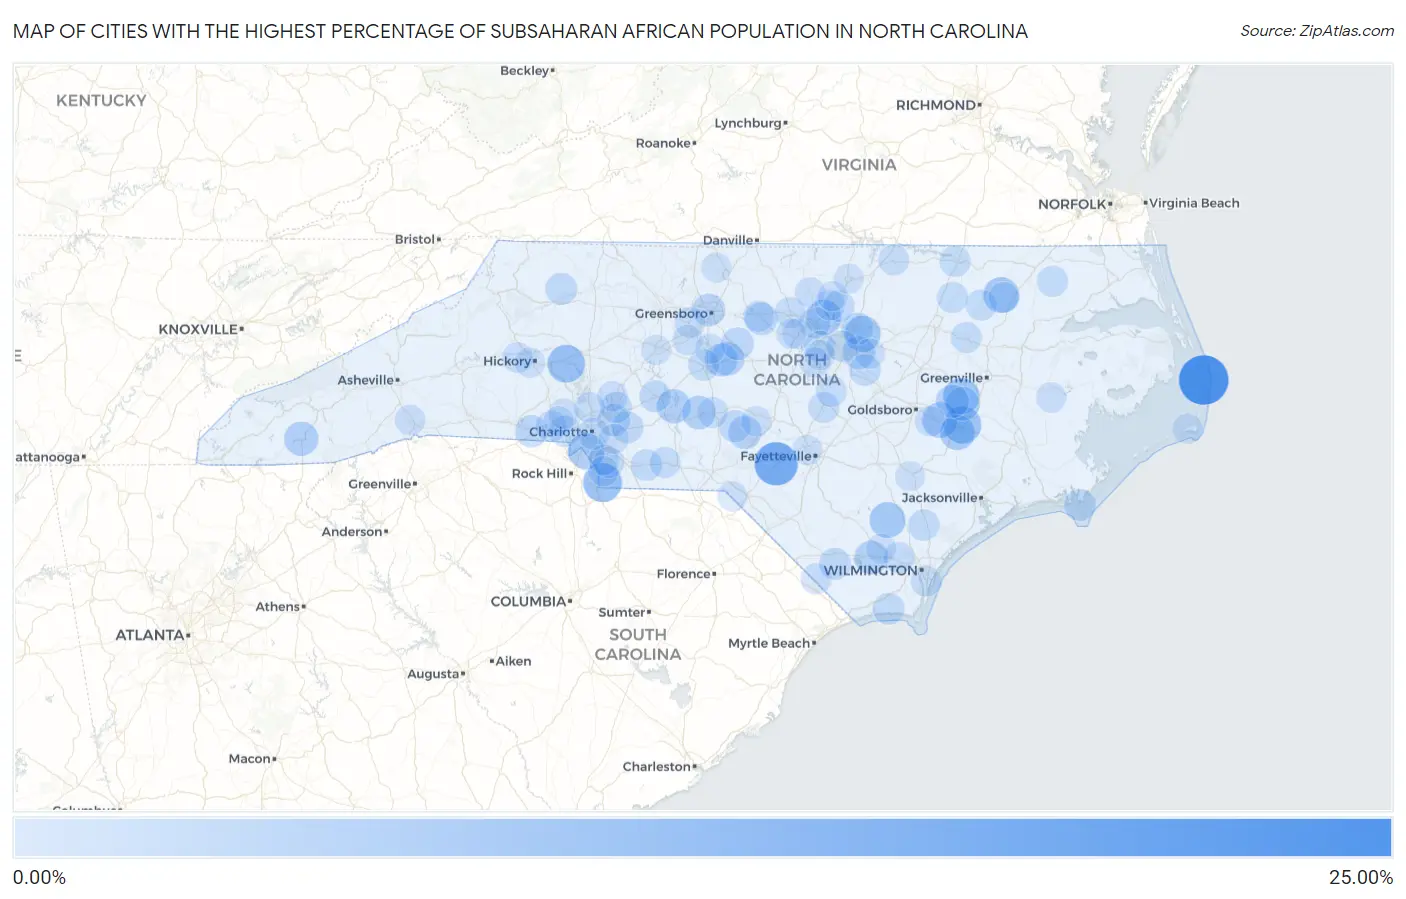
Map of Cities with the Highest Percentage of Subsaharan African Population in North Carolina
0.00%
25.00%
Cities with the Highest Percentage of Subsaharan African Population in North Carolina
| City | Subsaharan African | vs State | vs National | |
| 1. | Rodanthe | 22.83% | 1.27%(+21.6)#1 | 1.22%(+21.6)#38 |
| 2. | Silver City | 15.75% | 1.27%(+14.5)#2 | 1.22%(+14.5)#90 |
| 3. | Jaars | 10.82% | 1.27%(+9.55)#3 | 1.22%(+9.61)#176 |
| 4. | Catawba | 9.52% | 1.27%(+8.26)#4 | 1.22%(+8.31)#228 |
| 5. | Kinston | 9.26% | 1.27%(+7.99)#5 | 1.22%(+8.04)#239 |
| 6. | Maury | 8.06% | 1.27%(+6.79)#6 | 1.22%(+6.84)#303 |
| 7. | Rolesville | 7.93% | 1.27%(+6.66)#7 | 1.22%(+6.72)#316 |
| 8. | Pineville | 7.70% | 1.27%(+6.43)#8 | 1.22%(+6.49)#331 |
| 9. | Roxobel | 7.50% | 1.27%(+6.23)#9 | 1.22%(+6.28)#346 |
| 10. | Ivanhoe | 7.37% | 1.27%(+6.10)#10 | 1.22%(+6.16)#357 |
| 11. | La Grange | 7.12% | 1.27%(+5.85)#11 | 1.22%(+5.91)#379 |
| 12. | Gorman | 7.06% | 1.27%(+5.79)#12 | 1.22%(+5.85)#382 |
| 13. | Jackson Heights | 6.64% | 1.27%(+5.37)#13 | 1.22%(+5.42)#411 |
| 14. | Badin | 5.64% | 1.27%(+4.37)#14 | 1.22%(+4.42)#529 |
| 15. | Franklin | 5.59% | 1.27%(+4.32)#15 | 1.22%(+4.38)#538 |
| 16. | Hookerton | 5.36% | 1.27%(+4.09)#16 | 1.22%(+4.15)#571 |
| 17. | Bolton | 5.16% | 1.27%(+3.90)#17 | 1.22%(+3.95)#610 |
| 18. | Troy | 5.00% | 1.27%(+3.73)#18 | 1.22%(+3.78)#649 |
| 19. | Ramseur | 4.95% | 1.27%(+3.69)#19 | 1.22%(+3.74)#655 |
| 20. | Cherry Branch | 4.84% | 1.27%(+3.57)#20 | 1.22%(+3.62)#668 |
| 21. | Taylortown | 4.76% | 1.27%(+3.49)#21 | 1.22%(+3.54)#686 |
| 22. | Snow Hill | 4.64% | 1.27%(+3.37)#22 | 1.22%(+3.42)#711 |
| 23. | Grandy | 4.51% | 1.27%(+3.24)#23 | 1.22%(+3.30)#736 |
| 24. | Franklinville | 4.50% | 1.27%(+3.23)#24 | 1.22%(+3.28)#740 |
| 25. | Greensboro | 4.30% | 1.27%(+3.04)#25 | 1.22%(+3.09)#785 |
| 26. | Knightdale | 4.15% | 1.27%(+2.88)#26 | 1.22%(+2.93)#823 |
| 27. | Swepsonville | 4.10% | 1.27%(+2.83)#27 | 1.22%(+2.88)#835 |
| 28. | Liberty | 3.94% | 1.27%(+2.67)#28 | 1.22%(+2.72)#882 |
| 29. | Harrisburg | 3.67% | 1.27%(+2.40)#29 | 1.22%(+2.46)#968 |
| 30. | Kings Mountain | 3.61% | 1.27%(+2.34)#30 | 1.22%(+2.40)#986 |
| 31. | Deep Run | 3.31% | 1.27%(+2.04)#31 | 1.22%(+2.09)#1,091 |
| 32. | Seven Lakes | 3.28% | 1.27%(+2.01)#32 | 1.22%(+2.06)#1,099 |
| 33. | Brunswick | 3.24% | 1.27%(+1.98)#33 | 1.22%(+2.03)#1,120 |
| 34. | Wake Forest | 3.24% | 1.27%(+1.97)#34 | 1.22%(+2.03)#1,122 |
| 35. | Hays | 3.24% | 1.27%(+1.97)#35 | 1.22%(+2.02)#1,123 |
| 36. | Misenheimer | 3.22% | 1.27%(+1.95)#36 | 1.22%(+2.01)#1,136 |
| 37. | Harkers Island | 3.17% | 1.27%(+1.90)#37 | 1.22%(+1.96)#1,158 |
| 38. | Midland | 3.12% | 1.27%(+1.85)#38 | 1.22%(+1.91)#1,187 |
| 39. | Charlotte | 3.06% | 1.27%(+1.79)#39 | 1.22%(+1.84)#1,212 |
| 40. | Varnamtown | 3.01% | 1.27%(+1.74)#40 | 1.22%(+1.80)#1,241 |
| 41. | Clayton | 2.96% | 1.27%(+1.69)#41 | 1.22%(+1.74)#1,262 |
| 42. | Raleigh | 2.90% | 1.27%(+1.63)#42 | 1.22%(+1.68)#1,291 |
| 43. | Burgaw | 2.87% | 1.27%(+1.60)#43 | 1.22%(+1.65)#1,305 |
| 44. | Asheboro | 2.85% | 1.27%(+1.58)#44 | 1.22%(+1.63)#1,312 |
| 45. | Marshville | 2.81% | 1.27%(+1.54)#45 | 1.22%(+1.59)#1,334 |
| 46. | Cramerton | 2.78% | 1.27%(+1.51)#46 | 1.22%(+1.56)#1,357 |
| 47. | Creedmoor | 2.77% | 1.27%(+1.50)#47 | 1.22%(+1.56)#1,360 |
| 48. | Durham | 2.73% | 1.27%(+1.47)#48 | 1.22%(+1.52)#1,381 |
| 49. | Concord | 2.70% | 1.27%(+1.43)#49 | 1.22%(+1.48)#1,405 |
| 50. | Graham | 2.58% | 1.27%(+1.31)#50 | 1.22%(+1.36)#1,470 |
| 51. | Roanoke Rapids | 2.51% | 1.27%(+1.24)#51 | 1.22%(+1.29)#1,517 |
| 52. | Gastonia | 2.46% | 1.27%(+1.20)#52 | 1.22%(+1.25)#1,550 |
| 53. | Polkton | 2.45% | 1.27%(+1.18)#53 | 1.22%(+1.24)#1,562 |
| 54. | Scotland Neck | 2.42% | 1.27%(+1.15)#54 | 1.22%(+1.20)#1,576 |
| 55. | Harrellsville | 2.40% | 1.27%(+1.14)#55 | 1.22%(+1.19)#1,585 |
| 56. | Enfield | 2.39% | 1.27%(+1.12)#56 | 1.22%(+1.17)#1,599 |
| 57. | Morrisville | 2.36% | 1.27%(+1.09)#57 | 1.22%(+1.15)#1,616 |
| 58. | Lillington | 2.34% | 1.27%(+1.07)#58 | 1.22%(+1.13)#1,634 |
| 59. | Tarboro | 2.33% | 1.27%(+1.06)#59 | 1.22%(+1.11)#1,648 |
| 60. | Angier | 2.32% | 1.27%(+1.05)#60 | 1.22%(+1.10)#1,659 |
| 61. | Wesley Chapel | 2.28% | 1.27%(+1.01)#61 | 1.22%(+1.07)#1,688 |
| 62. | Biscoe | 2.24% | 1.27%(+0.967)#62 | 1.22%(+1.02)#1,724 |
| 63. | Hillsborough | 2.22% | 1.27%(+0.955)#63 | 1.22%(+1.01)#1,736 |
| 64. | Norlina | 2.22% | 1.27%(+0.954)#64 | 1.22%(+1.01)#1,739 |
| 65. | Northwest | 2.21% | 1.27%(+0.942)#65 | 1.22%(+0.996)#1,753 |
| 66. | Weddington | 2.16% | 1.27%(+0.887)#66 | 1.22%(+0.941)#1,815 |
| 67. | Kelford | 2.13% | 1.27%(+0.859)#67 | 1.22%(+0.913)#1,839 |
| 68. | Silver Lake | 2.12% | 1.27%(+0.848)#68 | 1.22%(+0.902)#1,851 |
| 69. | High Point | 2.03% | 1.27%(+0.761)#69 | 1.22%(+0.814)#1,937 |
| 70. | Chapel Hill | 2.01% | 1.27%(+0.743)#70 | 1.22%(+0.796)#1,962 |
| 71. | Tabor City | 2.00% | 1.27%(+0.727)#71 | 1.22%(+0.780)#1,983 |
| 72. | Kannapolis | 1.89% | 1.27%(+0.618)#72 | 1.22%(+0.672)#2,096 |
| 73. | Trinity | 1.87% | 1.27%(+0.600)#73 | 1.22%(+0.653)#2,121 |
| 74. | Butner | 1.86% | 1.27%(+0.594)#74 | 1.22%(+0.648)#2,127 |
| 75. | Huntersville | 1.80% | 1.27%(+0.527)#75 | 1.22%(+0.581)#2,219 |
| 76. | Connelly Springs | 1.78% | 1.27%(+0.515)#76 | 1.22%(+0.568)#2,234 |
| 77. | Barker Heights | 1.74% | 1.27%(+0.470)#77 | 1.22%(+0.523)#2,298 |
| 78. | Walnut Creek | 1.72% | 1.27%(+0.451)#78 | 1.22%(+0.505)#2,331 |
| 79. | Bath | 1.69% | 1.27%(+0.426)#79 | 1.22%(+0.480)#2,363 |
| 80. | Stanley | 1.69% | 1.27%(+0.420)#80 | 1.22%(+0.474)#2,373 |
| 81. | Rougemont | 1.69% | 1.27%(+0.420)#81 | 1.22%(+0.474)#2,374 |
| 82. | Apex | 1.64% | 1.27%(+0.370)#82 | 1.22%(+0.424)#2,454 |
| 83. | Wendell | 1.59% | 1.27%(+0.320)#83 | 1.22%(+0.374)#2,523 |
| 84. | Carthage | 1.58% | 1.27%(+0.315)#84 | 1.22%(+0.368)#2,535 |
| 85. | Waxhaw | 1.55% | 1.27%(+0.285)#85 | 1.22%(+0.338)#2,566 |
| 86. | Long View | 1.53% | 1.27%(+0.263)#86 | 1.22%(+0.316)#2,605 |
| 87. | Cary | 1.53% | 1.27%(+0.261)#87 | 1.22%(+0.315)#2,607 |
| 88. | Carrboro | 1.52% | 1.27%(+0.252)#88 | 1.22%(+0.305)#2,617 |
| 89. | Frisco | 1.52% | 1.27%(+0.249)#89 | 1.22%(+0.302)#2,624 |
| 90. | Wentworth | 1.50% | 1.27%(+0.233)#90 | 1.22%(+0.286)#2,649 |
| 91. | Stem | 1.49% | 1.27%(+0.225)#91 | 1.22%(+0.279)#2,659 |
| 92. | Magnolia | 1.48% | 1.27%(+0.215)#92 | 1.22%(+0.268)#2,675 |
| 93. | Fayetteville | 1.48% | 1.27%(+0.213)#93 | 1.22%(+0.266)#2,684 |
| 94. | Gibson | 1.47% | 1.27%(+0.204)#94 | 1.22%(+0.257)#2,701 |
| 95. | Ranlo | 1.47% | 1.27%(+0.202)#95 | 1.22%(+0.256)#2,709 |
| 96. | Mint Hill | 1.46% | 1.27%(+0.190)#96 | 1.22%(+0.243)#2,735 |
| 97. | Randleman | 1.44% | 1.27%(+0.175)#97 | 1.22%(+0.228)#2,770 |
| 98. | Sandyfield | 1.44% | 1.27%(+0.171)#98 | 1.22%(+0.225)#2,778 |
| 99. | Oxford | 1.44% | 1.27%(+0.171)#99 | 1.22%(+0.224)#2,782 |
| 100. | Lexington | 1.43% | 1.27%(+0.166)#100 | 1.22%(+0.219)#2,797 |
Common Questions
What are the Top 10 Cities with the Highest Percentage of Subsaharan African Population in North Carolina?
Top 10 Cities with the Highest Percentage of Subsaharan African Population in North Carolina are:
#1
22.83%
#2
15.75%
#3
10.82%
#4
9.52%
#5
9.26%
#6
8.06%
#7
7.93%
#8
7.70%
#9
7.50%
#10
7.37%
What city has the Highest Percentage of Subsaharan African Population in North Carolina?
Rodanthe has the Highest Percentage of Subsaharan African Population in North Carolina with 22.83%.
What is the Percentage of Subsaharan African Population in the State of North Carolina?
Percentage of Subsaharan African Population in North Carolina is 1.27%.
What is the Percentage of Subsaharan African Population in the United States?
Percentage of Subsaharan African Population in the United States is 1.22%.