Cities with the Highest Percentage of Subsaharan African Population in Tennessee
RELATED REPORTS & OPTIONS
Subsaharan African
Tennessee
Compare Cities
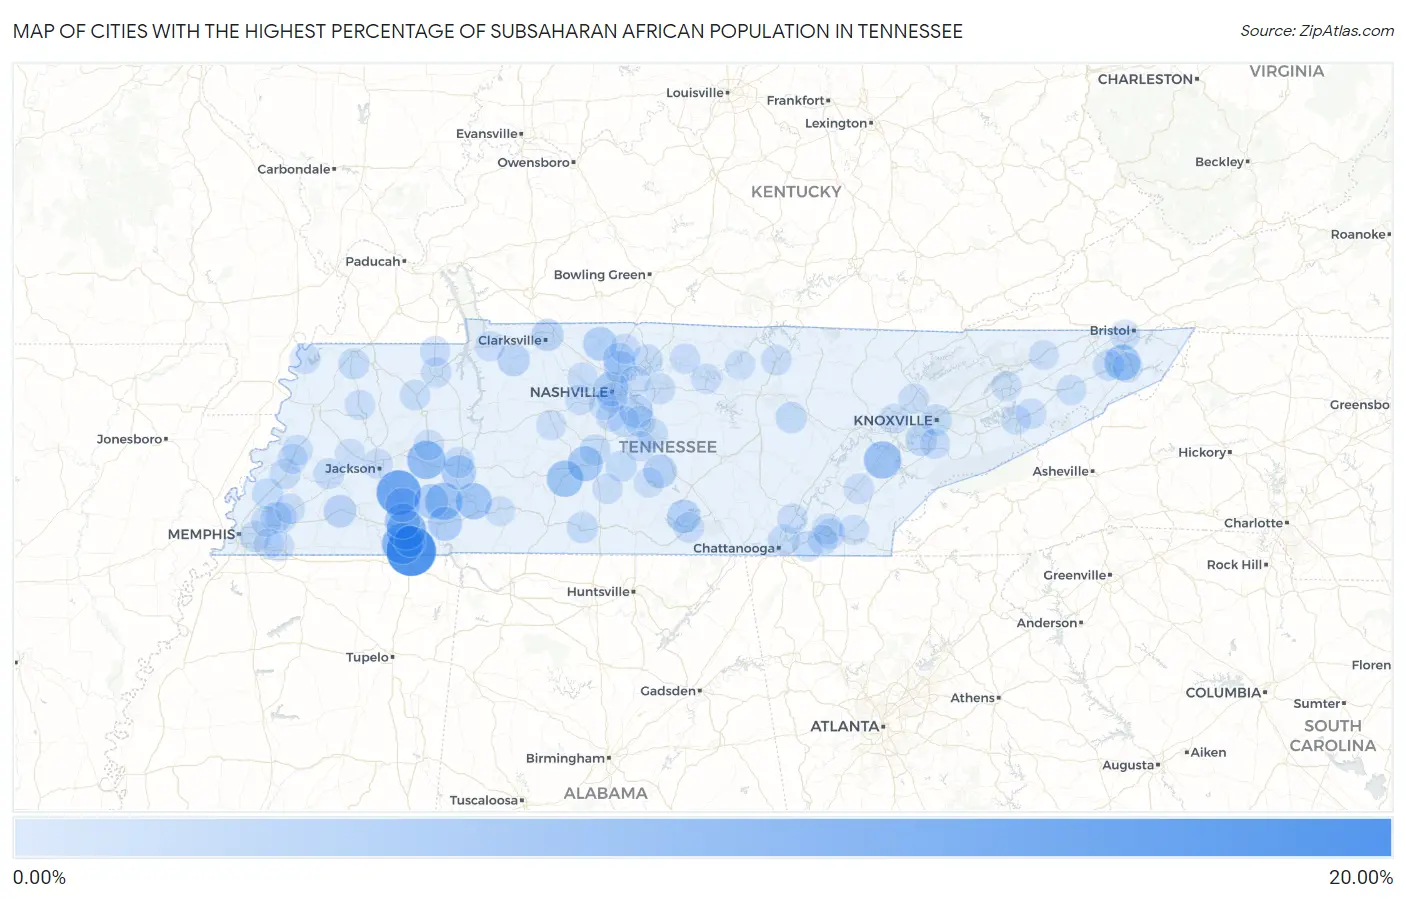
Map of Cities with the Highest Percentage of Subsaharan African Population in Tennessee
0.00%
20.00%
Cities with the Highest Percentage of Subsaharan African Population in Tennessee
| City | Subsaharan African | vs State | vs National | |
| 1. | Guys | 19.22% | 1.21%(+18.0)#1 | 1.22%(+18.0)#59 |
| 2. | Henderson | 14.04% | 1.21%(+12.8)#2 | 1.22%(+12.8)#113 |
| 3. | Ramer | 10.62% | 1.21%(+9.41)#3 | 1.22%(+9.41)#188 |
| 4. | Selmer | 9.61% | 1.21%(+8.40)#4 | 1.22%(+8.39)#225 |
| 5. | Lexington | 8.19% | 1.21%(+6.98)#5 | 1.22%(+6.97)#293 |
| 6. | Philadelphia | 7.21% | 1.21%(+6.00)#6 | 1.22%(+5.99)#375 |
| 7. | Saltillo | 6.99% | 1.21%(+5.78)#7 | 1.22%(+5.77)#388 |
| 8. | Mount Pleasant | 6.38% | 1.21%(+5.17)#8 | 1.22%(+5.16)#439 |
| 9. | Clifton | 6.25% | 1.21%(+5.05)#9 | 1.22%(+5.04)#450 |
| 10. | Watauga | 5.88% | 1.21%(+4.67)#10 | 1.22%(+4.67)#492 |
| 11. | Bethel Springs | 5.44% | 1.21%(+4.23)#11 | 1.22%(+4.22)#559 |
| 12. | Columbia | 5.16% | 1.21%(+3.95)#12 | 1.22%(+3.94)#611 |
| 13. | Finger | 4.68% | 1.21%(+3.47)#13 | 1.22%(+3.46)#702 |
| 14. | Decaturville | 4.59% | 1.21%(+3.38)#14 | 1.22%(+3.37)#719 |
| 15. | Nashville | 4.48% | 1.21%(+3.27)#15 | 1.22%(+3.26)#743 |
| 16. | Milledgeville | 4.37% | 1.21%(+3.16)#16 | 1.22%(+3.15)#766 |
| 17. | Savannah | 4.25% | 1.21%(+3.04)#17 | 1.22%(+3.03)#795 |
| 18. | Springfield | 3.86% | 1.21%(+2.65)#18 | 1.22%(+2.65)#904 |
| 19. | Bell Buckle | 3.70% | 1.21%(+2.49)#19 | 1.22%(+2.49)#956 |
| 20. | Estill Springs | 3.56% | 1.21%(+2.35)#20 | 1.22%(+2.35)#1,005 |
| 21. | La Vergne | 3.44% | 1.21%(+2.24)#21 | 1.22%(+2.23)#1,034 |
| 22. | Whiteville | 2.94% | 1.21%(+1.73)#22 | 1.22%(+1.72)#1,279 |
| 23. | Cumberland City | 2.75% | 1.21%(+1.55)#23 | 1.22%(+1.54)#1,369 |
| 24. | Goodlettsville | 2.69% | 1.21%(+1.48)#24 | 1.22%(+1.47)#1,410 |
| 25. | Clarksville | 2.55% | 1.21%(+1.34)#25 | 1.22%(+1.33)#1,497 |
| 26. | Millersville | 2.08% | 1.21%(+0.870)#26 | 1.22%(+0.865)#1,895 |
| 27. | Louisville | 1.95% | 1.21%(+0.741)#27 | 1.22%(+0.735)#2,024 |
| 28. | Pleasant Hill | 1.70% | 1.21%(+0.488)#28 | 1.22%(+0.483)#2,355 |
| 29. | Johnson City | 1.63% | 1.21%(+0.417)#29 | 1.22%(+0.411)#2,468 |
| 30. | Nolensville | 1.62% | 1.21%(+0.411)#30 | 1.22%(+0.405)#2,478 |
| 31. | Pulaski | 1.61% | 1.21%(+0.405)#31 | 1.22%(+0.399)#2,489 |
| 32. | Parsons | 1.59% | 1.21%(+0.381)#32 | 1.22%(+0.375)#2,521 |
| 33. | Eastview | 1.56% | 1.21%(+0.347)#33 | 1.22%(+0.342)#2,561 |
| 34. | Atoka | 1.52% | 1.21%(+0.310)#34 | 1.22%(+0.304)#2,619 |
| 35. | Rocky Top | 1.52% | 1.21%(+0.308)#35 | 1.22%(+0.303)#2,623 |
| 36. | Knoxville | 1.51% | 1.21%(+0.296)#36 | 1.22%(+0.290)#2,642 |
| 37. | Memphis | 1.49% | 1.21%(+0.283)#37 | 1.22%(+0.277)#2,663 |
| 38. | Arlington | 1.49% | 1.21%(+0.283)#38 | 1.22%(+0.277)#2,664 |
| 39. | Chattanooga | 1.47% | 1.21%(+0.262)#39 | 1.22%(+0.256)#2,708 |
| 40. | Rives | 1.47% | 1.21%(+0.261)#40 | 1.22%(+0.255)#2,711 |
| 41. | Smyrna | 1.46% | 1.21%(+0.247)#41 | 1.22%(+0.241)#2,739 |
| 42. | Spring Hill | 1.43% | 1.21%(+0.219)#42 | 1.22%(+0.213)#2,811 |
| 43. | Chapel Hill | 1.41% | 1.21%(+0.205)#43 | 1.22%(+0.199)#2,836 |
| 44. | Gallatin | 1.35% | 1.21%(+0.143)#44 | 1.22%(+0.138)#2,949 |
| 45. | Cleveland | 1.29% | 1.21%(+0.081)#45 | 1.22%(+0.076)#3,069 |
| 46. | Lebanon | 1.28% | 1.21%(+0.075)#46 | 1.22%(+0.069)#3,085 |
| 47. | Brownsville | 1.27% | 1.21%(+0.064)#47 | 1.22%(+0.058)#3,110 |
| 48. | Lakeland | 1.23% | 1.21%(+0.021)#48 | 1.22%(+0.016)#3,201 |
| 49. | Bartlett | 1.22% | 1.21%(+0.010)#49 | 1.22%(+0.004)#3,214 |
| 50. | East Cleveland | 1.16% | 1.21%(-0.044)#50 | 1.22%(-0.050)#3,330 |
| 51. | Covington | 1.13% | 1.21%(-0.076)#51 | 1.22%(-0.081)#3,401 |
| 52. | Collegedale | 1.12% | 1.21%(-0.091)#52 | 1.22%(-0.097)#3,435 |
| 53. | Lynchburg | 1.11% | 1.21%(-0.096)#53 | 1.22%(-0.102)#3,451 |
| 54. | Livingston | 1.10% | 1.21%(-0.113)#54 | 1.22%(-0.118)#3,485 |
| 55. | Mckenzie | 1.07% | 1.21%(-0.140)#55 | 1.22%(-0.145)#3,524 |
| 56. | Winchester | 1.07% | 1.21%(-0.141)#56 | 1.22%(-0.146)#3,529 |
| 57. | Paris | 1.04% | 1.21%(-0.172)#57 | 1.22%(-0.177)#3,602 |
| 58. | Murfreesboro | 1.02% | 1.21%(-0.188)#58 | 1.22%(-0.194)#3,656 |
| 59. | Parker S Crossroads | 1.00% | 1.21%(-0.206)#59 | 1.22%(-0.212)#3,706 |
| 60. | Ripley | 0.98% | 1.21%(-0.234)#60 | 1.22%(-0.240)#3,793 |
| 61. | Tiptonville | 0.97% | 1.21%(-0.244)#61 | 1.22%(-0.250)#3,816 |
| 62. | Collierville | 0.94% | 1.21%(-0.273)#62 | 1.22%(-0.279)#3,916 |
| 63. | Walnut Hill | 0.91% | 1.21%(-0.303)#63 | 1.22%(-0.309)#4,016 |
| 64. | Jackson | 0.90% | 1.21%(-0.306)#64 | 1.22%(-0.312)#4,027 |
| 65. | Carthage | 0.90% | 1.21%(-0.313)#65 | 1.22%(-0.319)#4,038 |
| 66. | Athens | 0.89% | 1.21%(-0.322)#66 | 1.22%(-0.328)#4,064 |
| 67. | Green Hill | 0.87% | 1.21%(-0.338)#67 | 1.22%(-0.344)#4,117 |
| 68. | Hartsville Trousdale County | 0.87% | 1.21%(-0.338)#68 | 1.22%(-0.344)#4,118 |
| 69. | Rockvale | 0.86% | 1.21%(-0.351)#69 | 1.22%(-0.357)#4,156 |
| 70. | Parrottsville | 0.85% | 1.21%(-0.355)#70 | 1.22%(-0.360)#4,169 |
| 71. | Brentwood | 0.85% | 1.21%(-0.357)#71 | 1.22%(-0.363)#4,174 |
| 72. | Dyer | 0.84% | 1.21%(-0.369)#72 | 1.22%(-0.374)#4,217 |
| 73. | Clinton | 0.83% | 1.21%(-0.384)#73 | 1.22%(-0.390)#4,281 |
| 74. | Soddy Daisy | 0.82% | 1.21%(-0.392)#74 | 1.22%(-0.398)#4,315 |
| 75. | Berry Hill | 0.81% | 1.21%(-0.404)#75 | 1.22%(-0.410)#4,347 |
| 76. | Lewisburg | 0.79% | 1.21%(-0.418)#76 | 1.22%(-0.423)#4,395 |
| 77. | Henning | 0.76% | 1.21%(-0.452)#77 | 1.22%(-0.458)#4,528 |
| 78. | Gallaway | 0.75% | 1.21%(-0.456)#78 | 1.22%(-0.462)#4,547 |
| 79. | Pegram | 0.74% | 1.21%(-0.471)#79 | 1.22%(-0.477)#4,596 |
| 80. | Puryear | 0.73% | 1.21%(-0.478)#80 | 1.22%(-0.483)#4,618 |
| 81. | White House | 0.73% | 1.21%(-0.480)#81 | 1.22%(-0.486)#4,629 |
| 82. | Ashland City | 0.73% | 1.21%(-0.480)#82 | 1.22%(-0.486)#4,630 |
| 83. | South Cleveland | 0.72% | 1.21%(-0.486)#83 | 1.22%(-0.492)#4,649 |
| 84. | Eagleton Village | 0.71% | 1.21%(-0.496)#84 | 1.22%(-0.502)#4,687 |
| 85. | Tusculum | 0.71% | 1.21%(-0.504)#85 | 1.22%(-0.510)#4,713 |
| 86. | Dover | 0.71% | 1.21%(-0.504)#86 | 1.22%(-0.510)#4,714 |
| 87. | Shelbyville | 0.69% | 1.21%(-0.517)#87 | 1.22%(-0.522)#4,763 |
| 88. | Benton | 0.63% | 1.21%(-0.578)#88 | 1.22%(-0.584)#5,064 |
| 89. | Forest Hills | 0.63% | 1.21%(-0.580)#89 | 1.22%(-0.585)#5,074 |
| 90. | Germantown | 0.61% | 1.21%(-0.596)#90 | 1.22%(-0.602)#5,146 |
| 91. | Oak Ridge | 0.61% | 1.21%(-0.601)#91 | 1.22%(-0.606)#5,166 |
| 92. | Rogersville | 0.60% | 1.21%(-0.605)#92 | 1.22%(-0.610)#5,176 |
| 93. | Bells | 0.60% | 1.21%(-0.611)#93 | 1.22%(-0.617)#5,206 |
| 94. | Bon Aqua Junction | 0.60% | 1.21%(-0.613)#94 | 1.22%(-0.619)#5,212 |
| 95. | Elizabethton | 0.59% | 1.21%(-0.618)#95 | 1.22%(-0.624)#5,240 |
| 96. | Waynesboro | 0.59% | 1.21%(-0.621)#96 | 1.22%(-0.627)#5,251 |
| 97. | Newport | 0.57% | 1.21%(-0.640)#97 | 1.22%(-0.646)#5,334 |
| 98. | Fowlkes | 0.56% | 1.21%(-0.652)#98 | 1.22%(-0.658)#5,395 |
| 99. | Gainesboro | 0.55% | 1.21%(-0.657)#99 | 1.22%(-0.663)#5,420 |
| 100. | Morristown | 0.55% | 1.21%(-0.663)#100 | 1.22%(-0.669)#5,452 |
Common Questions
What are the Top 10 Cities with the Highest Percentage of Subsaharan African Population in Tennessee?
Top 10 Cities with the Highest Percentage of Subsaharan African Population in Tennessee are:
#1
19.22%
#2
14.04%
#3
10.62%
#4
9.61%
#5
8.19%
#6
7.21%
#7
6.99%
#8
6.38%
#9
6.25%
#10
5.88%
What city has the Highest Percentage of Subsaharan African Population in Tennessee?
Guys has the Highest Percentage of Subsaharan African Population in Tennessee with 19.22%.
What is the Percentage of Subsaharan African Population in the State of Tennessee?
Percentage of Subsaharan African Population in Tennessee is 1.21%.
What is the Percentage of Subsaharan African Population in the United States?
Percentage of Subsaharan African Population in the United States is 1.22%.