Cities with the Highest Percentage of Subsaharan African Population in New York
RELATED REPORTS & OPTIONS
Subsaharan African
New York
Compare Cities
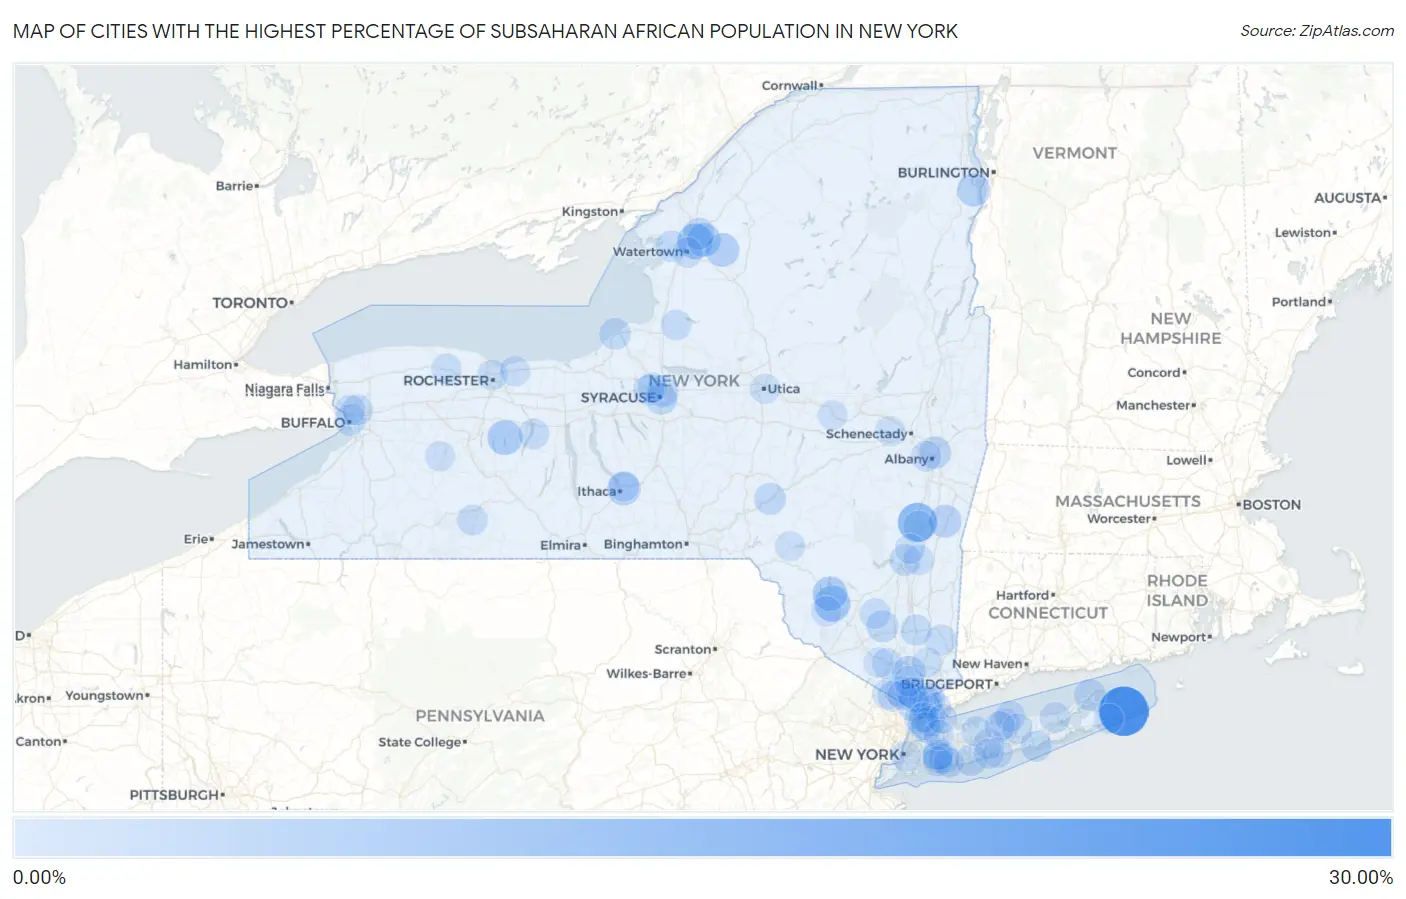
Map of Cities with the Highest Percentage of Subsaharan African Population in New York
0.00%
30.00%
Cities with the Highest Percentage of Subsaharan African Population in New York
| City | Subsaharan African | vs State | vs National | |
| 1. | Napeague | 28.57% | 1.43%(+27.1)#1 | 1.22%(+27.4)#21 |
| 2. | Schuyler Lake | 19.51% | 1.43%(+18.1)#2 | 1.22%(+18.3)#56 |
| 3. | South Cairo | 16.91% | 1.43%(+15.5)#3 | 1.22%(+15.7)#77 |
| 4. | Jefferson Heights | 13.87% | 1.43%(+12.4)#4 | 1.22%(+12.7)#116 |
| 5. | South Fallsburg | 9.34% | 1.43%(+7.91)#5 | 1.22%(+8.12)#237 |
| 6. | Calcium | 8.67% | 1.43%(+7.24)#6 | 1.22%(+7.45)#265 |
| 7. | Wells Bridge | 8.20% | 1.43%(+6.77)#7 | 1.22%(+6.98)#292 |
| 8. | Honeoye | 8.07% | 1.43%(+6.65)#8 | 1.22%(+6.86)#301 |
| 9. | Loch Sheldrake | 7.52% | 1.43%(+6.09)#9 | 1.22%(+6.30)#345 |
| 10. | Fort Drum | 6.44% | 1.43%(+5.01)#10 | 1.22%(+5.22)#432 |
| 11. | Carthage | 6.21% | 1.43%(+4.78)#11 | 1.22%(+4.99)#456 |
| 12. | Forest Home | 5.69% | 1.43%(+4.26)#12 | 1.22%(+4.48)#520 |
| 13. | Willsboro | 5.58% | 1.43%(+4.15)#13 | 1.22%(+4.36)#543 |
| 14. | Elmsford | 5.53% | 1.43%(+4.10)#14 | 1.22%(+4.31)#549 |
| 15. | Verplanck | 5.53% | 1.43%(+4.10)#15 | 1.22%(+4.31)#550 |
| 16. | Philmont | 5.39% | 1.43%(+3.96)#16 | 1.22%(+4.17)#569 |
| 17. | Piermont | 5.03% | 1.43%(+3.60)#17 | 1.22%(+3.81)#640 |
| 18. | Valhalla | 4.69% | 1.43%(+3.26)#18 | 1.22%(+3.47)#697 |
| 19. | Menands | 4.37% | 1.43%(+2.94)#19 | 1.22%(+3.15)#765 |
| 20. | Lyncourt | 4.03% | 1.43%(+2.61)#20 | 1.22%(+2.82)#857 |
| 21. | Otego | 4.02% | 1.43%(+2.60)#21 | 1.22%(+2.81)#859 |
| 22. | Walden | 4.02% | 1.43%(+2.60)#22 | 1.22%(+2.81)#860 |
| 23. | Evans Mills | 3.98% | 1.43%(+2.55)#23 | 1.22%(+2.76)#870 |
| 24. | Mount Vernon | 3.91% | 1.43%(+2.49)#24 | 1.22%(+2.70)#891 |
| 25. | Syracuse | 3.80% | 1.43%(+2.37)#25 | 1.22%(+2.58)#926 |
| 26. | Siena College | 3.80% | 1.43%(+2.37)#26 | 1.22%(+2.58)#928 |
| 27. | Greenport West | 3.68% | 1.43%(+2.25)#27 | 1.22%(+2.46)#967 |
| 28. | Amityville | 3.65% | 1.43%(+2.22)#28 | 1.22%(+2.43)#973 |
| 29. | Suny Oswego | 3.57% | 1.43%(+2.14)#29 | 1.22%(+2.35)#1,002 |
| 30. | Lake Katrine | 3.27% | 1.43%(+1.84)#30 | 1.22%(+2.05)#1,110 |
| 31. | New Hackensack | 3.24% | 1.43%(+1.81)#31 | 1.22%(+2.02)#1,128 |
| 32. | South Floral Park | 3.16% | 1.43%(+1.74)#32 | 1.22%(+1.95)#1,160 |
| 33. | Sparrow Bush | 3.14% | 1.43%(+1.72)#33 | 1.22%(+1.93)#1,174 |
| 34. | Greenville Cdp Greene County | 3.08% | 1.43%(+1.66)#34 | 1.22%(+1.87)#1,201 |
| 35. | Dexter | 3.01% | 1.43%(+1.59)#35 | 1.22%(+1.80)#1,238 |
| 36. | Mastic Beach | 2.91% | 1.43%(+1.48)#36 | 1.22%(+1.69)#1,286 |
| 37. | Catskill | 2.90% | 1.43%(+1.47)#37 | 1.22%(+1.68)#1,290 |
| 38. | Fishkill | 2.85% | 1.43%(+1.42)#38 | 1.22%(+1.63)#1,310 |
| 39. | Buffalo | 2.81% | 1.43%(+1.38)#39 | 1.22%(+1.59)#1,333 |
| 40. | Yonkers | 2.77% | 1.43%(+1.34)#40 | 1.22%(+1.56)#1,361 |
| 41. | Lakeland | 2.71% | 1.43%(+1.28)#41 | 1.22%(+1.49)#1,396 |
| 42. | North Valley Stream | 2.56% | 1.43%(+1.13)#42 | 1.22%(+1.35)#1,480 |
| 43. | Crystal Beach | 2.55% | 1.43%(+1.12)#43 | 1.22%(+1.33)#1,492 |
| 44. | Stony Brook University | 2.49% | 1.43%(+1.06)#44 | 1.22%(+1.27)#1,530 |
| 45. | Alfred | 2.47% | 1.43%(+1.04)#45 | 1.22%(+1.25)#1,545 |
| 46. | Albany | 2.47% | 1.43%(+1.04)#46 | 1.22%(+1.25)#1,548 |
| 47. | Eggertsville | 2.45% | 1.43%(+1.03)#47 | 1.22%(+1.24)#1,560 |
| 48. | Suffern | 2.44% | 1.43%(+1.02)#48 | 1.22%(+1.23)#1,564 |
| 49. | Crest View Heights | 2.42% | 1.43%(+0.996)#49 | 1.22%(+1.21)#1,574 |
| 50. | Harriman | 2.40% | 1.43%(+0.977)#50 | 1.22%(+1.19)#1,586 |
| 51. | Watchtower | 2.39% | 1.43%(+0.959)#51 | 1.22%(+1.17)#1,602 |
| 52. | Riverhead | 2.34% | 1.43%(+0.909)#52 | 1.22%(+1.12)#1,641 |
| 53. | New York | 2.31% | 1.43%(+0.887)#53 | 1.22%(+1.10)#1,666 |
| 54. | Lake Carmel | 2.31% | 1.43%(+0.886)#54 | 1.22%(+1.10)#1,668 |
| 55. | Hillcrest | 2.26% | 1.43%(+0.836)#55 | 1.22%(+1.05)#1,702 |
| 56. | Altmar | 2.26% | 1.43%(+0.832)#56 | 1.22%(+1.04)#1,706 |
| 57. | Lakeview | 2.26% | 1.43%(+0.831)#57 | 1.22%(+1.04)#1,708 |
| 58. | Belle Terre | 2.22% | 1.43%(+0.793)#58 | 1.22%(+1.00)#1,743 |
| 59. | Rochester | 2.22% | 1.43%(+0.793)#59 | 1.22%(+1.00)#1,745 |
| 60. | Airmont | 2.22% | 1.43%(+0.789)#60 | 1.22%(+1.00)#1,747 |
| 61. | Nyack | 2.20% | 1.43%(+0.770)#61 | 1.22%(+0.981)#1,767 |
| 62. | Roessleville | 2.18% | 1.43%(+0.749)#62 | 1.22%(+0.960)#1,792 |
| 63. | Valley Cottage | 2.16% | 1.43%(+0.735)#63 | 1.22%(+0.946)#1,809 |
| 64. | Rosendale | 2.11% | 1.43%(+0.683)#64 | 1.22%(+0.894)#1,863 |
| 65. | Brentwood | 2.09% | 1.43%(+0.662)#65 | 1.22%(+0.873)#1,888 |
| 66. | Coram | 2.07% | 1.43%(+0.642)#66 | 1.22%(+0.853)#1,901 |
| 67. | Elmont | 2.06% | 1.43%(+0.636)#67 | 1.22%(+0.847)#1,904 |
| 68. | Haverstraw | 2.06% | 1.43%(+0.633)#68 | 1.22%(+0.844)#1,908 |
| 69. | Kenmore | 2.04% | 1.43%(+0.613)#69 | 1.22%(+0.824)#1,929 |
| 70. | Watertown | 2.00% | 1.43%(+0.577)#70 | 1.22%(+0.788)#1,968 |
| 71. | Tuxedo | 1.99% | 1.43%(+0.560)#71 | 1.22%(+0.771)#1,995 |
| 72. | Harrison | 1.97% | 1.43%(+0.548)#72 | 1.22%(+0.759)#2,002 |
| 73. | Monticello | 1.97% | 1.43%(+0.540)#73 | 1.22%(+0.751)#2,010 |
| 74. | New Rochelle | 1.96% | 1.43%(+0.536)#74 | 1.22%(+0.747)#2,013 |
| 75. | Northeast Ithaca | 1.94% | 1.43%(+0.515)#75 | 1.22%(+0.726)#2,034 |
| 76. | Head Of The Harbor | 1.93% | 1.43%(+0.506)#76 | 1.22%(+0.717)#2,049 |
| 77. | Red Hook | 1.93% | 1.43%(+0.501)#77 | 1.22%(+0.712)#2,053 |
| 78. | East Islip | 1.92% | 1.43%(+0.496)#78 | 1.22%(+0.707)#2,060 |
| 79. | Greenlawn | 1.92% | 1.43%(+0.492)#79 | 1.22%(+0.703)#2,063 |
| 80. | Holley | 1.91% | 1.43%(+0.487)#80 | 1.22%(+0.699)#2,070 |
| 81. | Baldwin | 1.84% | 1.43%(+0.412)#81 | 1.22%(+0.623)#2,162 |
| 82. | Webster | 1.83% | 1.43%(+0.408)#82 | 1.22%(+0.619)#2,170 |
| 83. | Nanuet | 1.82% | 1.43%(+0.391)#83 | 1.22%(+0.602)#2,193 |
| 84. | Pelham Manor | 1.81% | 1.43%(+0.387)#84 | 1.22%(+0.598)#2,198 |
| 85. | Silver Springs | 1.79% | 1.43%(+0.362)#85 | 1.22%(+0.574)#2,226 |
| 86. | Brightwaters | 1.76% | 1.43%(+0.334)#86 | 1.22%(+0.545)#2,262 |
| 87. | Liverpool | 1.76% | 1.43%(+0.333)#87 | 1.22%(+0.544)#2,265 |
| 88. | Utica | 1.73% | 1.43%(+0.303)#88 | 1.22%(+0.514)#2,316 |
| 89. | Jefferson Valley Yorktown | 1.69% | 1.43%(+0.265)#89 | 1.22%(+0.476)#2,369 |
| 90. | Walton Park | 1.69% | 1.43%(+0.265)#90 | 1.22%(+0.476)#2,370 |
| 91. | Fort Plain | 1.69% | 1.43%(+0.261)#91 | 1.22%(+0.472)#2,376 |
| 92. | Valley Stream | 1.67% | 1.43%(+0.244)#92 | 1.22%(+0.455)#2,400 |
| 93. | Mariaville Lake | 1.67% | 1.43%(+0.243)#93 | 1.22%(+0.454)#2,404 |
| 94. | East Hampton | 1.65% | 1.43%(+0.227)#94 | 1.22%(+0.438)#2,429 |
| 95. | Tuckahoe | 1.64% | 1.43%(+0.218)#95 | 1.22%(+0.429)#2,445 |
| 96. | Port Washington North | 1.64% | 1.43%(+0.215)#96 | 1.22%(+0.426)#2,450 |
| 97. | Rye | 1.63% | 1.43%(+0.203)#97 | 1.22%(+0.414)#2,466 |
| 98. | Downsville | 1.59% | 1.43%(+0.161)#98 | 1.22%(+0.372)#2,527 |
| 99. | Saugerties South | 1.57% | 1.43%(+0.148)#99 | 1.22%(+0.359)#2,543 |
| 100. | St. John Fisher College | 1.57% | 1.43%(+0.141)#100 | 1.22%(+0.352)#2,545 |
Common Questions
What are the Top 10 Cities with the Highest Percentage of Subsaharan African Population in New York?
Top 10 Cities with the Highest Percentage of Subsaharan African Population in New York are:
#1
28.57%
#2
13.87%
#3
9.34%
#4
8.67%
#5
8.07%
#6
7.52%
#7
6.44%
#8
6.21%
#9
5.69%
#10
5.58%
What city has the Highest Percentage of Subsaharan African Population in New York?
Napeague has the Highest Percentage of Subsaharan African Population in New York with 28.57%.
What is the Percentage of Subsaharan African Population in the State of New York?
Percentage of Subsaharan African Population in New York is 1.43%.
What is the Percentage of Subsaharan African Population in the United States?
Percentage of Subsaharan African Population in the United States is 1.22%.