Cities with the Highest Percentage of Subsaharan African Population in South Carolina
RELATED REPORTS & OPTIONS
Subsaharan African
South Carolina
Compare Cities
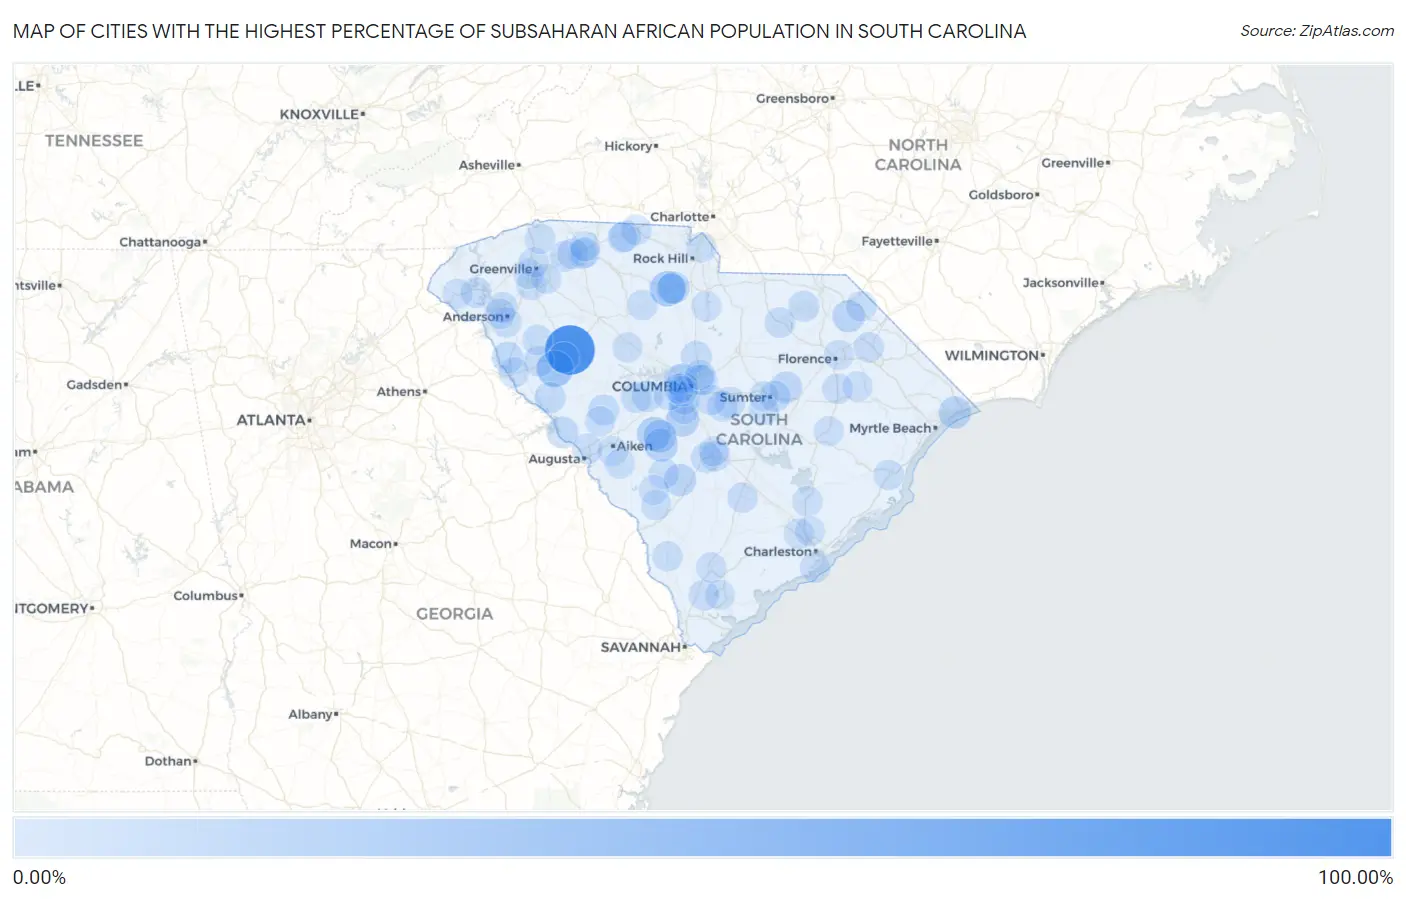
Map of Cities with the Highest Percentage of Subsaharan African Population in South Carolina
0.00%
100.00%
Cities with the Highest Percentage of Subsaharan African Population in South Carolina
| City | Subsaharan African | vs State | vs National | |
| 1. | Coronaca | 100.00% | 0.94%(+99.1)#1 | 1.22%(+98.8)#1 |
| 2. | Promised Land | 32.93% | 0.94%(+32.0)#2 | 1.22%(+31.7)#16 |
| 3. | Gayle Mill | 26.43% | 0.94%(+25.5)#3 | 1.22%(+25.2)#25 |
| 4. | Wagener | 17.86% | 0.94%(+16.9)#4 | 1.22%(+16.6)#68 |
| 5. | Salley | 16.84% | 0.94%(+15.9)#5 | 1.22%(+15.6)#78 |
| 6. | Swansea | 15.70% | 0.94%(+14.8)#6 | 1.22%(+14.5)#93 |
| 7. | Perry | 14.93% | 0.94%(+14.0)#7 | 1.22%(+13.7)#100 |
| 8. | Tamassee | 12.20% | 0.94%(+11.3)#8 | 1.22%(+11.0)#135 |
| 9. | Atlantic Beach | 12.05% | 0.94%(+11.1)#9 | 1.22%(+10.8)#138 |
| 10. | Foreston | 12.03% | 0.94%(+11.1)#10 | 1.22%(+10.8)#140 |
| 11. | Denmark | 11.57% | 0.94%(+10.6)#11 | 1.22%(+10.4)#152 |
| 12. | Blenheim | 11.11% | 0.94%(+10.2)#12 | 1.22%(+9.90)#163 |
| 13. | Eureka Mill | 10.91% | 0.94%(+9.96)#13 | 1.22%(+9.69)#172 |
| 14. | Mayesville | 10.15% | 0.94%(+9.21)#14 | 1.22%(+8.93)#209 |
| 15. | Clarks Hill | 8.97% | 0.94%(+8.03)#15 | 1.22%(+7.76)#251 |
| 16. | Lowndesville | 8.15% | 0.94%(+7.21)#16 | 1.22%(+6.94)#294 |
| 17. | Pine Ridge | 7.93% | 0.94%(+6.99)#17 | 1.22%(+6.71)#317 |
| 18. | Finklea | 6.55% | 0.94%(+5.61)#18 | 1.22%(+5.34)#419 |
| 19. | Mccormick | 6.41% | 0.94%(+5.47)#19 | 1.22%(+5.20)#435 |
| 20. | Johnston | 5.64% | 0.94%(+4.70)#20 | 1.22%(+4.43)#528 |
| 21. | Summit | 5.57% | 0.94%(+4.62)#21 | 1.22%(+4.35)#545 |
| 22. | East Gaffney | 5.48% | 0.94%(+4.54)#22 | 1.22%(+4.27)#556 |
| 23. | East Sumter | 5.45% | 0.94%(+4.51)#23 | 1.22%(+4.23)#558 |
| 24. | Patrick | 5.20% | 0.94%(+4.26)#24 | 1.22%(+3.98)#600 |
| 25. | Utica | 5.08% | 0.94%(+4.14)#25 | 1.22%(+3.86)#626 |
| 26. | Blythewood | 4.83% | 0.94%(+3.89)#26 | 1.22%(+3.61)#672 |
| 27. | Edisto | 4.67% | 0.94%(+3.73)#27 | 1.22%(+3.46)#703 |
| 28. | Batesburg Leesville | 4.56% | 0.94%(+3.62)#28 | 1.22%(+3.34)#725 |
| 29. | Eastover | 4.55% | 0.94%(+3.60)#29 | 1.22%(+3.33)#730 |
| 30. | Abbeville | 4.54% | 0.94%(+3.60)#30 | 1.22%(+3.32)#732 |
| 31. | Duncan | 4.49% | 0.94%(+3.55)#31 | 1.22%(+3.28)#742 |
| 32. | Greenwood | 4.34% | 0.94%(+3.40)#32 | 1.22%(+3.13)#770 |
| 33. | Northlake | 4.19% | 0.94%(+3.25)#33 | 1.22%(+2.97)#807 |
| 34. | Gadsden | 4.15% | 0.94%(+3.21)#34 | 1.22%(+2.94)#821 |
| 35. | Capitol View | 4.04% | 0.94%(+3.10)#35 | 1.22%(+2.82)#853 |
| 36. | Chester | 3.86% | 0.94%(+2.92)#36 | 1.22%(+2.64)#905 |
| 37. | Mcbee | 3.82% | 0.94%(+2.88)#37 | 1.22%(+2.61)#916 |
| 38. | Coward | 3.70% | 0.94%(+2.76)#38 | 1.22%(+2.48)#959 |
| 39. | Blacksburg | 3.64% | 0.94%(+2.70)#39 | 1.22%(+2.43)#975 |
| 40. | Gaston | 3.62% | 0.94%(+2.68)#40 | 1.22%(+2.40)#982 |
| 41. | Carlisle | 3.42% | 0.94%(+2.48)#41 | 1.22%(+2.21)#1,037 |
| 42. | Seven Oaks | 3.36% | 0.94%(+2.41)#42 | 1.22%(+2.14)#1,072 |
| 43. | Calhoun Falls | 3.30% | 0.94%(+2.36)#43 | 1.22%(+2.09)#1,093 |
| 44. | St Andrews | 3.30% | 0.94%(+2.36)#44 | 1.22%(+2.08)#1,094 |
| 45. | Red Bank | 3.25% | 0.94%(+2.31)#45 | 1.22%(+2.04)#1,117 |
| 46. | Wilkinson Heights | 3.23% | 0.94%(+2.29)#46 | 1.22%(+2.02)#1,131 |
| 47. | Wellford | 3.12% | 0.94%(+2.18)#47 | 1.22%(+1.91)#1,186 |
| 48. | Forest Acres | 3.12% | 0.94%(+2.18)#48 | 1.22%(+1.90)#1,189 |
| 49. | Hamer | 3.03% | 0.94%(+2.09)#49 | 1.22%(+1.81)#1,230 |
| 50. | Columbia | 2.95% | 0.94%(+2.01)#50 | 1.22%(+1.73)#1,271 |
| 51. | Arthurtown | 2.89% | 0.94%(+1.95)#51 | 1.22%(+1.68)#1,292 |
| 52. | Belvedere | 2.82% | 0.94%(+1.88)#52 | 1.22%(+1.60)#1,326 |
| 53. | Hopkins | 2.76% | 0.94%(+1.82)#53 | 1.22%(+1.55)#1,367 |
| 54. | Due West | 2.70% | 0.94%(+1.76)#54 | 1.22%(+1.49)#1,400 |
| 55. | Homeland Park | 2.60% | 0.94%(+1.66)#55 | 1.22%(+1.39)#1,454 |
| 56. | Ridgeland | 2.57% | 0.94%(+1.63)#56 | 1.22%(+1.35)#1,476 |
| 57. | Kline | 2.56% | 0.94%(+1.62)#57 | 1.22%(+1.35)#1,479 |
| 58. | Clio | 2.50% | 0.94%(+1.56)#58 | 1.22%(+1.29)#1,523 |
| 59. | West Columbia | 2.49% | 0.94%(+1.54)#59 | 1.22%(+1.27)#1,536 |
| 60. | St George | 2.37% | 0.94%(+1.43)#60 | 1.22%(+1.15)#1,610 |
| 61. | Georgetown | 2.36% | 0.94%(+1.42)#61 | 1.22%(+1.15)#1,615 |
| 62. | Centerville | 2.33% | 0.94%(+1.39)#62 | 1.22%(+1.11)#1,649 |
| 63. | Golden Grove | 2.29% | 0.94%(+1.34)#63 | 1.22%(+1.07)#1,687 |
| 64. | Yemassee | 2.26% | 0.94%(+1.32)#64 | 1.22%(+1.04)#1,705 |
| 65. | Sellers | 2.26% | 0.94%(+1.31)#65 | 1.22%(+1.04)#1,710 |
| 66. | Estill | 2.24% | 0.94%(+1.30)#66 | 1.22%(+1.03)#1,716 |
| 67. | Arkwright | 2.24% | 0.94%(+1.30)#67 | 1.22%(+1.03)#1,719 |
| 68. | Blackville | 2.21% | 0.94%(+1.27)#68 | 1.22%(+0.997)#1,750 |
| 69. | Dale | 2.19% | 0.94%(+1.25)#69 | 1.22%(+0.979)#1,769 |
| 70. | Folly Beach | 2.16% | 0.94%(+1.22)#70 | 1.22%(+0.942)#1,812 |
| 71. | Welcome | 2.12% | 0.94%(+1.18)#71 | 1.22%(+0.910)#1,842 |
| 72. | Sans Souci | 2.05% | 0.94%(+1.11)#72 | 1.22%(+0.837)#1,916 |
| 73. | Tigerville | 2.03% | 0.94%(+1.09)#73 | 1.22%(+0.811)#1,942 |
| 74. | Barnwell | 2.00% | 0.94%(+1.06)#74 | 1.22%(+0.788)#1,971 |
| 75. | Springdale | 1.99% | 0.94%(+1.05)#75 | 1.22%(+0.777)#1,988 |
| 76. | Mauldin | 1.99% | 0.94%(+1.05)#76 | 1.22%(+0.772)#1,992 |
| 77. | Aiken | 1.95% | 0.94%(+1.01)#77 | 1.22%(+0.737)#2,023 |
| 78. | Great Falls | 1.92% | 0.94%(+0.976)#78 | 1.22%(+0.702)#2,066 |
| 79. | Dentsville | 1.89% | 0.94%(+0.949)#79 | 1.22%(+0.675)#2,093 |
| 80. | Privateer | 1.87% | 0.94%(+0.930)#80 | 1.22%(+0.656)#2,116 |
| 81. | Westminster | 1.85% | 0.94%(+0.910)#81 | 1.22%(+0.636)#2,140 |
| 82. | Moncks Corner | 1.84% | 0.94%(+0.902)#82 | 1.22%(+0.628)#2,155 |
| 83. | North Charleston | 1.80% | 0.94%(+0.864)#83 | 1.22%(+0.590)#2,206 |
| 84. | Laurel Bay | 1.80% | 0.94%(+0.855)#84 | 1.22%(+0.581)#2,218 |
| 85. | Pamplico | 1.77% | 0.94%(+0.830)#85 | 1.22%(+0.556)#2,252 |
| 86. | Gaffney | 1.76% | 0.94%(+0.822)#86 | 1.22%(+0.548)#2,259 |
| 87. | Arcadia | 1.76% | 0.94%(+0.816)#87 | 1.22%(+0.542)#2,271 |
| 88. | Oak Grove | 1.70% | 0.94%(+0.754)#88 | 1.22%(+0.480)#2,361 |
| 89. | Fort Mill | 1.61% | 0.94%(+0.665)#89 | 1.22%(+0.391)#2,500 |
| 90. | Saxon | 1.53% | 0.94%(+0.593)#90 | 1.22%(+0.319)#2,597 |
| 91. | Newberry | 1.51% | 0.94%(+0.566)#91 | 1.22%(+0.292)#2,639 |
| 92. | Valley Falls | 1.45% | 0.94%(+0.509)#92 | 1.22%(+0.235)#2,761 |
| 93. | New Ellenton | 1.40% | 0.94%(+0.454)#93 | 1.22%(+0.180)#2,870 |
| 94. | Hilltop | 1.38% | 0.94%(+0.442)#94 | 1.22%(+0.168)#2,888 |
| 95. | Kingstree | 1.37% | 0.94%(+0.433)#95 | 1.22%(+0.159)#2,899 |
| 96. | Hanahan | 1.36% | 0.94%(+0.414)#96 | 1.22%(+0.140)#2,939 |
| 97. | Sumter | 1.35% | 0.94%(+0.413)#97 | 1.22%(+0.139)#2,944 |
| 98. | Quinby | 1.34% | 0.94%(+0.397)#98 | 1.22%(+0.123)#2,982 |
| 99. | Trenton | 1.29% | 0.94%(+0.353)#99 | 1.22%(+0.079)#3,059 |
| 100. | Brookdale | 1.25% | 0.94%(+0.312)#100 | 1.22%(+0.038)#3,148 |
Common Questions
What are the Top 10 Cities with the Highest Percentage of Subsaharan African Population in South Carolina?
Top 10 Cities with the Highest Percentage of Subsaharan African Population in South Carolina are:
#1
100.00%
#2
32.93%
#3
26.43%
#4
17.86%
#5
16.84%
#6
15.70%
#7
14.93%
#8
12.05%
#9
11.57%
#10
11.11%
What city has the Highest Percentage of Subsaharan African Population in South Carolina?
Coronaca has the Highest Percentage of Subsaharan African Population in South Carolina with 100.00%.
What is the Percentage of Subsaharan African Population in the State of South Carolina?
Percentage of Subsaharan African Population in South Carolina is 0.94%.
What is the Percentage of Subsaharan African Population in the United States?
Percentage of Subsaharan African Population in the United States is 1.22%.