Cities with the Highest Percentage of Subsaharan African Population in Kentucky
RELATED REPORTS & OPTIONS
Subsaharan African
Kentucky
Compare Cities
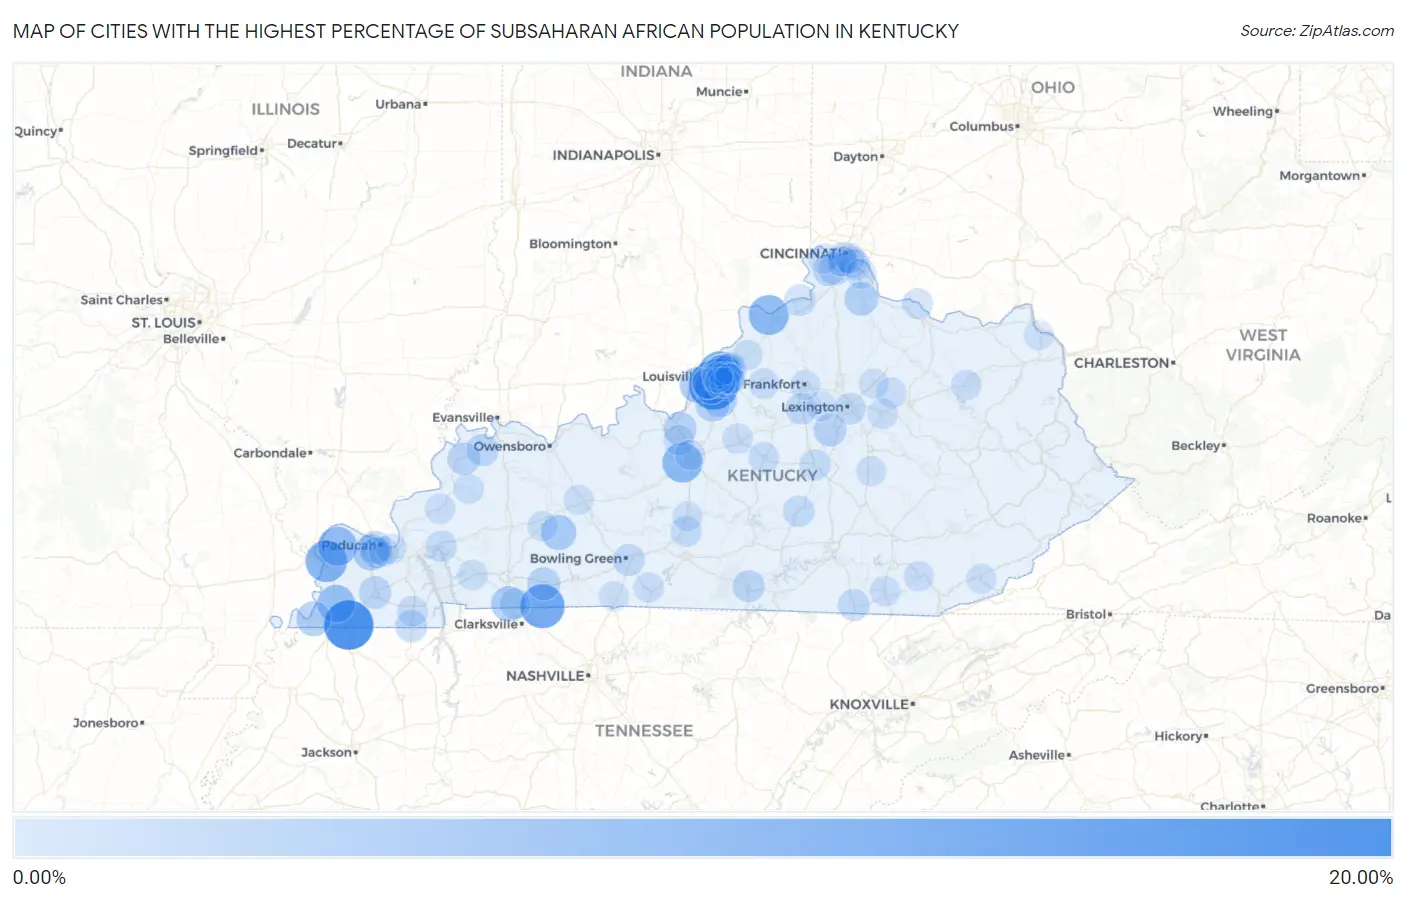
Map of Cities with the Highest Percentage of Subsaharan African Population in Kentucky
0.00%
20.00%
Cities with the Highest Percentage of Subsaharan African Population in Kentucky
| City | Subsaharan African | vs State | vs National | |
| 1. | Fulton | 18.72% | 0.88%(+17.8)#1 | 1.22%(+17.5)#62 |
| 2. | West Buechel | 18.34% | 0.88%(+17.5)#2 | 1.22%(+17.1)#65 |
| 3. | Guthrie | 13.51% | 0.88%(+12.6)#3 | 1.22%(+12.3)#120 |
| 4. | Bancroft | 11.82% | 0.88%(+10.9)#4 | 1.22%(+10.6)#145 |
| 5. | Wickliffe | 11.00% | 0.88%(+10.1)#5 | 1.22%(+9.79)#168 |
| 6. | Cecilia | 9.57% | 0.88%(+8.68)#6 | 1.22%(+8.35)#226 |
| 7. | Prestonville | 9.57% | 0.88%(+8.68)#7 | 1.22%(+8.35)#227 |
| 8. | La Center | 8.75% | 0.88%(+7.86)#8 | 1.22%(+7.53)#260 |
| 9. | Clinton | 7.42% | 0.88%(+6.53)#9 | 1.22%(+6.20)#351 |
| 10. | Briarwood | 5.97% | 0.88%(+5.09)#10 | 1.22%(+4.76)#480 |
| 11. | Massac | 5.68% | 0.88%(+4.79)#11 | 1.22%(+4.46)#521 |
| 12. | Shively | 5.40% | 0.88%(+4.52)#12 | 1.22%(+4.18)#568 |
| 13. | Watterson Park | 5.33% | 0.88%(+4.44)#13 | 1.22%(+4.11)#576 |
| 14. | Fort Campbell North | 5.22% | 0.88%(+4.33)#14 | 1.22%(+4.00)#595 |
| 15. | Forest Hills | 5.00% | 0.88%(+4.12)#15 | 1.22%(+3.78)#645 |
| 16. | Beechmont | 4.95% | 0.88%(+4.07)#16 | 1.22%(+3.74)#656 |
| 17. | Hickman | 4.83% | 0.88%(+3.95)#17 | 1.22%(+3.62)#670 |
| 18. | Creekside | 4.12% | 0.88%(+3.24)#18 | 1.22%(+2.91)#828 |
| 19. | Heritage Creek | 3.88% | 0.88%(+2.99)#19 | 1.22%(+2.66)#899 |
| 20. | Butler | 3.80% | 0.88%(+2.91)#20 | 1.22%(+2.58)#925 |
| 21. | Hillview | 3.71% | 0.88%(+2.83)#21 | 1.22%(+2.49)#955 |
| 22. | Lyndon | 3.50% | 0.88%(+2.62)#22 | 1.22%(+2.29)#1,022 |
| 23. | Fort Knox | 3.40% | 0.88%(+2.51)#23 | 1.22%(+2.18)#1,045 |
| 24. | Elkton | 3.23% | 0.88%(+2.34)#24 | 1.22%(+2.01)#1,134 |
| 25. | Poplar Hills | 3.08% | 0.88%(+2.20)#25 | 1.22%(+1.87)#1,202 |
| 26. | Paducah | 3.07% | 0.88%(+2.19)#26 | 1.22%(+1.86)#1,206 |
| 27. | Wilmore | 3.01% | 0.88%(+2.12)#27 | 1.22%(+1.79)#1,242 |
| 28. | Worthington Hills | 2.89% | 0.88%(+2.01)#28 | 1.22%(+1.67)#1,295 |
| 29. | Breckinridge Center | 2.82% | 0.88%(+1.94)#29 | 1.22%(+1.61)#1,324 |
| 30. | Mayfield | 2.79% | 0.88%(+1.90)#30 | 1.22%(+1.57)#1,347 |
| 31. | Louisville | 2.75% | 0.88%(+1.87)#31 | 1.22%(+1.53)#1,371 |
| 32. | Meadow Vale | 2.71% | 0.88%(+1.83)#32 | 1.22%(+1.50)#1,394 |
| 33. | Elsmere | 2.62% | 0.88%(+1.73)#33 | 1.22%(+1.40)#1,446 |
| 34. | Hazel | 2.46% | 0.88%(+1.57)#34 | 1.22%(+1.24)#1,556 |
| 35. | Corydon | 2.45% | 0.88%(+1.57)#35 | 1.22%(+1.24)#1,557 |
| 36. | Burkesville | 2.25% | 0.88%(+1.36)#36 | 1.22%(+1.03)#1,713 |
| 37. | Florence | 2.22% | 0.88%(+1.34)#37 | 1.22%(+1.01)#1,741 |
| 38. | Bowling Green | 2.15% | 0.88%(+1.26)#38 | 1.22%(+0.930)#1,823 |
| 39. | Sycamore | 2.14% | 0.88%(+1.26)#39 | 1.22%(+0.928)#1,825 |
| 40. | Pine Knot | 2.09% | 0.88%(+1.21)#40 | 1.22%(+0.875)#1,885 |
| 41. | Lawrenceburg | 1.94% | 0.88%(+1.06)#41 | 1.22%(+0.725)#2,035 |
| 42. | Liberty | 1.85% | 0.88%(+0.965)#42 | 1.22%(+0.633)#2,145 |
| 43. | Broeck Pointe | 1.85% | 0.88%(+0.961)#43 | 1.22%(+0.630)#2,151 |
| 44. | Lexington | 1.84% | 0.88%(+0.957)#44 | 1.22%(+0.625)#2,160 |
| 45. | Warsaw | 1.70% | 0.88%(+0.813)#45 | 1.22%(+0.482)#2,356 |
| 46. | Thornhill | 1.69% | 0.88%(+0.811)#46 | 1.22%(+0.480)#2,364 |
| 47. | Wildwood | 1.68% | 0.88%(+0.797)#47 | 1.22%(+0.466)#2,381 |
| 48. | Hendron | 1.62% | 0.88%(+0.740)#48 | 1.22%(+0.409)#2,471 |
| 49. | Eddyville | 1.58% | 0.88%(+0.697)#49 | 1.22%(+0.366)#2,537 |
| 50. | St Regis Park | 1.56% | 0.88%(+0.672)#50 | 1.22%(+0.341)#2,564 |
| 51. | Danville | 1.47% | 0.88%(+0.588)#51 | 1.22%(+0.257)#2,705 |
| 52. | Hurstbourne | 1.46% | 0.88%(+0.577)#52 | 1.22%(+0.246)#2,727 |
| 53. | Douglass Hills | 1.39% | 0.88%(+0.507)#53 | 1.22%(+0.175)#2,877 |
| 54. | Oak Grove | 1.36% | 0.88%(+0.471)#54 | 1.22%(+0.140)#2,940 |
| 55. | Horse Cave | 1.32% | 0.88%(+0.434)#55 | 1.22%(+0.102)#3,016 |
| 56. | Park Hills | 1.30% | 0.88%(+0.414)#56 | 1.22%(+0.083)#3,052 |
| 57. | Audubon Park | 1.27% | 0.88%(+0.391)#57 | 1.22%(+0.060)#3,108 |
| 58. | Cold Spring | 1.20% | 0.88%(+0.315)#58 | 1.22%(-0.017)#3,263 |
| 59. | Springfield | 1.19% | 0.88%(+0.311)#59 | 1.22%(-0.020)#3,269 |
| 60. | Shelbyville | 1.11% | 0.88%(+0.230)#60 | 1.22%(-0.101)#3,447 |
| 61. | Windy Hills | 1.09% | 0.88%(+0.210)#61 | 1.22%(-0.121)#3,488 |
| 62. | Murray | 1.08% | 0.88%(+0.196)#62 | 1.22%(-0.136)#3,509 |
| 63. | Vine Grove | 1.07% | 0.88%(+0.190)#63 | 1.22%(-0.141)#3,516 |
| 64. | Spring Valley | 1.05% | 0.88%(+0.164)#64 | 1.22%(-0.167)#3,576 |
| 65. | Fincastle | 1.02% | 0.88%(+0.136)#65 | 1.22%(-0.195)#3,661 |
| 66. | Dover | 0.99% | 0.88%(+0.109)#66 | 1.22%(-0.222)#3,740 |
| 67. | Marion | 0.93% | 0.88%(+0.046)#67 | 1.22%(-0.286)#3,938 |
| 68. | Winchester | 0.93% | 0.88%(+0.044)#68 | 1.22%(-0.287)#3,946 |
| 69. | Bardstown | 0.92% | 0.88%(+0.038)#69 | 1.22%(-0.294)#3,966 |
| 70. | North Middletown | 0.91% | 0.88%(+0.030)#70 | 1.22%(-0.301)#3,991 |
| 71. | Fort Mitchell | 0.91% | 0.88%(+0.028)#71 | 1.22%(-0.304)#3,996 |
| 72. | Scottsville | 0.90% | 0.88%(+0.016)#72 | 1.22%(-0.315)#4,032 |
| 73. | Elizabethtown | 0.88% | 0.88%(-0.002)#73 | 1.22%(-0.334)#4,075 |
| 74. | Cadiz | 0.88% | 0.88%(-0.005)#74 | 1.22%(-0.337)#4,088 |
| 75. | Williamsburg | 0.84% | 0.88%(-0.042)#75 | 1.22%(-0.374)#4,214 |
| 76. | Highland Heights | 0.84% | 0.88%(-0.046)#76 | 1.22%(-0.377)#4,240 |
| 77. | Morehead | 0.80% | 0.88%(-0.084)#77 | 1.22%(-0.415)#4,373 |
| 78. | Barbourville | 0.78% | 0.88%(-0.101)#78 | 1.22%(-0.433)#4,426 |
| 79. | Greenville | 0.76% | 0.88%(-0.122)#79 | 1.22%(-0.453)#4,515 |
| 80. | Clay | 0.74% | 0.88%(-0.142)#80 | 1.22%(-0.474)#4,590 |
| 81. | Ledbetter | 0.72% | 0.88%(-0.168)#81 | 1.22%(-0.499)#4,672 |
| 82. | La Grange | 0.71% | 0.88%(-0.169)#82 | 1.22%(-0.500)#4,680 |
| 83. | Hebron | 0.71% | 0.88%(-0.173)#83 | 1.22%(-0.504)#4,692 |
| 84. | Fort Wright | 0.68% | 0.88%(-0.199)#84 | 1.22%(-0.530)#4,804 |
| 85. | Harlan | 0.68% | 0.88%(-0.203)#85 | 1.22%(-0.534)#4,821 |
| 86. | Beaver Dam | 0.68% | 0.88%(-0.205)#86 | 1.22%(-0.536)#4,832 |
| 87. | Jeffersontown | 0.68% | 0.88%(-0.207)#87 | 1.22%(-0.538)#4,841 |
| 88. | Houston Acres | 0.67% | 0.88%(-0.218)#88 | 1.22%(-0.549)#4,897 |
| 89. | Alexandria | 0.66% | 0.88%(-0.225)#89 | 1.22%(-0.556)#4,933 |
| 90. | Versailles | 0.65% | 0.88%(-0.233)#90 | 1.22%(-0.564)#4,970 |
| 91. | Frankfort | 0.64% | 0.88%(-0.244)#91 | 1.22%(-0.576)#5,031 |
| 92. | Middletown | 0.61% | 0.88%(-0.269)#92 | 1.22%(-0.600)#5,136 |
| 93. | Franklin | 0.61% | 0.88%(-0.273)#93 | 1.22%(-0.604)#5,152 |
| 94. | St Matthews | 0.58% | 0.88%(-0.307)#94 | 1.22%(-0.638)#5,298 |
| 95. | Munfordville | 0.57% | 0.88%(-0.311)#95 | 1.22%(-0.642)#5,317 |
| 96. | Southgate | 0.57% | 0.88%(-0.313)#96 | 1.22%(-0.644)#5,327 |
| 97. | Farley | 0.57% | 0.88%(-0.314)#97 | 1.22%(-0.645)#5,329 |
| 98. | Greenup | 0.56% | 0.88%(-0.322)#98 | 1.22%(-0.653)#5,369 |
| 99. | Paris | 0.54% | 0.88%(-0.342)#99 | 1.22%(-0.673)#5,469 |
| 100. | Berea | 0.54% | 0.88%(-0.345)#100 | 1.22%(-0.676)#5,483 |
Common Questions
What are the Top 10 Cities with the Highest Percentage of Subsaharan African Population in Kentucky?
Top 10 Cities with the Highest Percentage of Subsaharan African Population in Kentucky are:
#1
18.72%
#2
18.34%
#3
13.51%
#4
11.82%
#5
11.00%
#6
9.57%
#7
9.57%
#8
8.75%
#9
7.42%
#10
5.97%
What city has the Highest Percentage of Subsaharan African Population in Kentucky?
Fulton has the Highest Percentage of Subsaharan African Population in Kentucky with 18.72%.
What is the Percentage of Subsaharan African Population in the State of Kentucky?
Percentage of Subsaharan African Population in Kentucky is 0.88%.
What is the Percentage of Subsaharan African Population in the United States?
Percentage of Subsaharan African Population in the United States is 1.22%.