Cities with the Highest Percentage of Subsaharan African Population in Illinois
RELATED REPORTS & OPTIONS
Subsaharan African
Illinois
Compare Cities
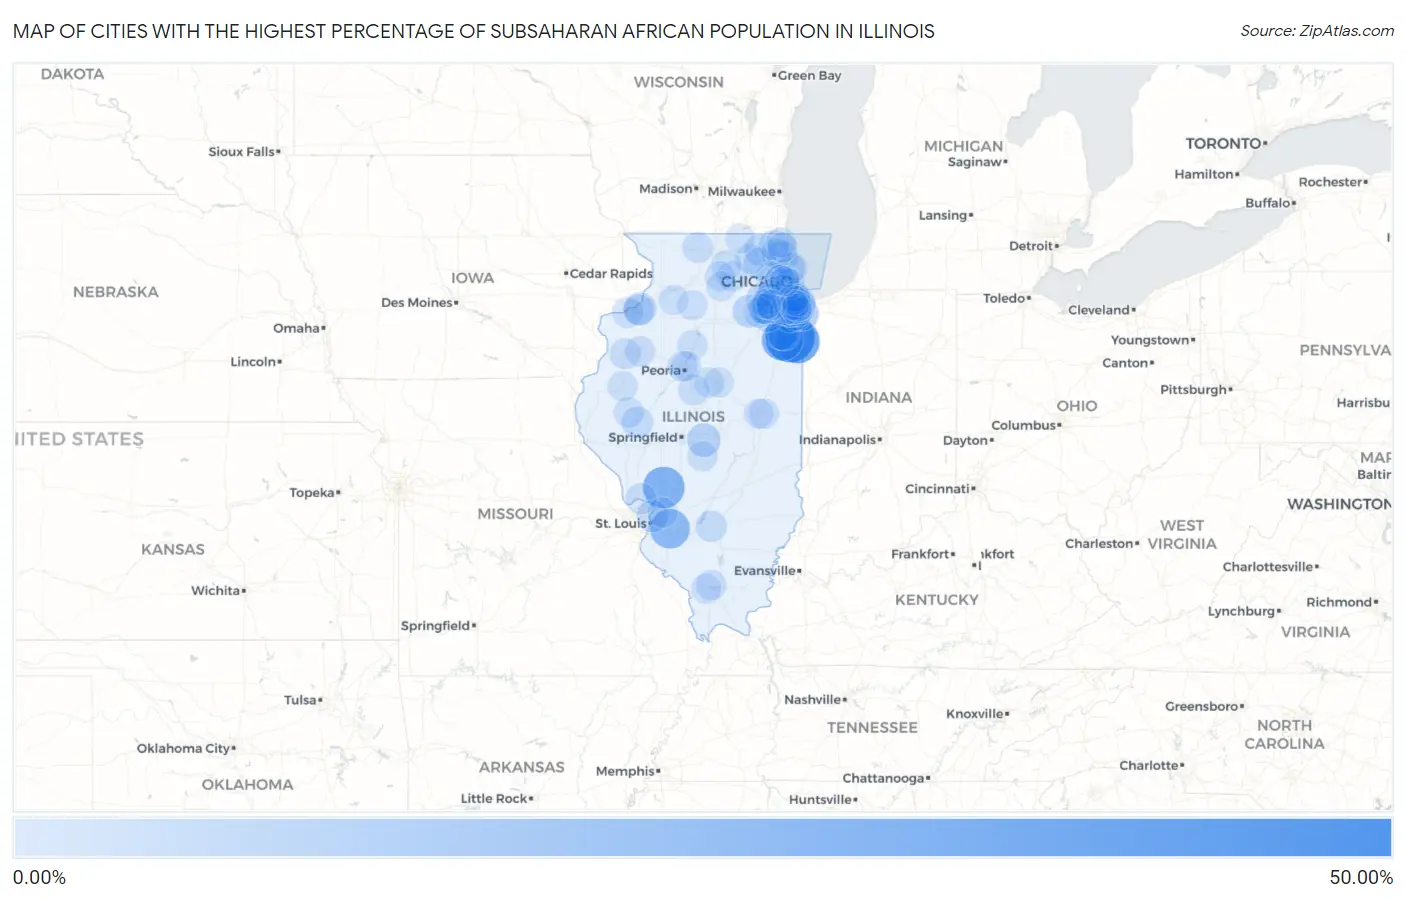
Map of Cities with the Highest Percentage of Subsaharan African Population in Illinois
0.00%
50.00%
Cities with the Highest Percentage of Subsaharan African Population in Illinois
| City | Subsaharan African | vs State | vs National | |
| 1. | Sun River Terrace | 41.76% | 1.05%(+40.7)#1 | 1.22%(+40.5)#12 |
| 2. | Hopkins Park | 30.36% | 1.05%(+29.3)#2 | 1.22%(+29.1)#18 |
| 3. | Royal Lakes | 24.91% | 1.05%(+23.9)#3 | 1.22%(+23.7)#29 |
| 4. | Kankakee | 24.44% | 1.05%(+23.4)#4 | 1.22%(+23.2)#31 |
| 5. | Scott Afb | 20.76% | 1.05%(+19.7)#5 | 1.22%(+19.5)#49 |
| 6. | University Park | 14.07% | 1.05%(+13.0)#6 | 1.22%(+12.9)#112 |
| 7. | Willowbrook | 10.71% | 1.05%(+9.66)#7 | 1.22%(+9.50)#184 |
| 8. | Nachusa | 7.97% | 1.05%(+6.92)#8 | 1.22%(+6.76)#312 |
| 9. | Mount Auburn | 7.95% | 1.05%(+6.90)#9 | 1.22%(+6.74)#315 |
| 10. | Preston Heights | 7.00% | 1.05%(+5.95)#10 | 1.22%(+5.78)#387 |
| 11. | Monee | 6.95% | 1.05%(+5.90)#11 | 1.22%(+5.74)#390 |
| 12. | East Moline | 6.42% | 1.05%(+5.37)#12 | 1.22%(+5.21)#433 |
| 13. | Flossmoor | 6.39% | 1.05%(+5.34)#13 | 1.22%(+5.18)#438 |
| 14. | East Dundee | 6.27% | 1.05%(+5.22)#14 | 1.22%(+5.06)#448 |
| 15. | Lisbon | 6.25% | 1.05%(+5.20)#15 | 1.22%(+5.03)#452 |
| 16. | Hillside | 5.92% | 1.05%(+4.86)#16 | 1.22%(+4.70)#487 |
| 17. | Bourbonnais | 5.36% | 1.05%(+4.31)#17 | 1.22%(+4.15)#572 |
| 18. | Madison | 5.34% | 1.05%(+4.29)#18 | 1.22%(+4.13)#575 |
| 19. | Frankfort Square | 5.03% | 1.05%(+3.98)#19 | 1.22%(+3.81)#639 |
| 20. | Beardstown | 4.28% | 1.05%(+3.23)#20 | 1.22%(+3.07)#789 |
| 21. | Rockdale | 4.17% | 1.05%(+3.12)#21 | 1.22%(+2.95)#810 |
| 22. | Prairie Grove | 4.12% | 1.05%(+3.07)#22 | 1.22%(+2.90)#829 |
| 23. | Country Club Hills | 4.07% | 1.05%(+3.01)#23 | 1.22%(+2.85)#844 |
| 24. | Hazel Crest | 3.96% | 1.05%(+2.91)#24 | 1.22%(+2.74)#874 |
| 25. | Bannockburn | 3.94% | 1.05%(+2.89)#25 | 1.22%(+2.73)#877 |
| 26. | Elwood | 3.89% | 1.05%(+2.84)#26 | 1.22%(+2.67)#898 |
| 27. | Crete | 3.85% | 1.05%(+2.79)#27 | 1.22%(+2.63)#908 |
| 28. | Junction City | 3.73% | 1.05%(+2.68)#28 | 1.22%(+2.52)#947 |
| 29. | Park Forest | 3.64% | 1.05%(+2.58)#29 | 1.22%(+2.42)#977 |
| 30. | Rest Haven | 3.61% | 1.05%(+2.55)#30 | 1.22%(+2.39)#989 |
| 31. | East Hazel Crest | 3.58% | 1.05%(+2.53)#31 | 1.22%(+2.36)#998 |
| 32. | Ingalls Park | 3.51% | 1.05%(+2.46)#32 | 1.22%(+2.30)#1,017 |
| 33. | Glendale Heights | 3.42% | 1.05%(+2.36)#33 | 1.22%(+2.20)#1,041 |
| 34. | Dolton | 3.38% | 1.05%(+2.33)#34 | 1.22%(+2.17)#1,057 |
| 35. | Plainfield | 3.33% | 1.05%(+2.28)#35 | 1.22%(+2.12)#1,079 |
| 36. | Bradley | 3.33% | 1.05%(+2.28)#36 | 1.22%(+2.11)#1,082 |
| 37. | South Holland | 3.25% | 1.05%(+2.19)#37 | 1.22%(+2.03)#1,119 |
| 38. | Lynwood | 3.18% | 1.05%(+2.13)#38 | 1.22%(+1.97)#1,153 |
| 39. | Joliet | 3.16% | 1.05%(+2.11)#39 | 1.22%(+1.94)#1,163 |
| 40. | Rock Island | 3.15% | 1.05%(+2.10)#40 | 1.22%(+1.93)#1,172 |
| 41. | Richton Park | 3.14% | 1.05%(+2.09)#41 | 1.22%(+1.93)#1,175 |
| 42. | Calumet City | 3.13% | 1.05%(+2.08)#42 | 1.22%(+1.92)#1,182 |
| 43. | Monmouth | 3.12% | 1.05%(+2.06)#43 | 1.22%(+1.90)#1,192 |
| 44. | Elsah | 3.02% | 1.05%(+1.97)#44 | 1.22%(+1.81)#1,233 |
| 45. | Pecatonica | 2.99% | 1.05%(+1.94)#45 | 1.22%(+1.77)#1,250 |
| 46. | Hopedale | 2.95% | 1.05%(+1.89)#46 | 1.22%(+1.73)#1,275 |
| 47. | Evanston | 2.81% | 1.05%(+1.76)#47 | 1.22%(+1.60)#1,328 |
| 48. | Silvis | 2.81% | 1.05%(+1.76)#48 | 1.22%(+1.59)#1,329 |
| 49. | Bolingbrook | 2.75% | 1.05%(+1.70)#49 | 1.22%(+1.54)#1,370 |
| 50. | Olympia Fields | 2.74% | 1.05%(+1.69)#50 | 1.22%(+1.53)#1,377 |
| 51. | Broadview | 2.65% | 1.05%(+1.60)#51 | 1.22%(+1.44)#1,426 |
| 52. | Lansing | 2.64% | 1.05%(+1.58)#52 | 1.22%(+1.42)#1,436 |
| 53. | Justice | 2.62% | 1.05%(+1.57)#53 | 1.22%(+1.40)#1,447 |
| 54. | Crest Hill | 2.57% | 1.05%(+1.52)#54 | 1.22%(+1.36)#1,473 |
| 55. | Skokie | 2.48% | 1.05%(+1.43)#55 | 1.22%(+1.27)#1,540 |
| 56. | Woodridge | 2.43% | 1.05%(+1.38)#56 | 1.22%(+1.22)#1,567 |
| 57. | Matteson | 2.42% | 1.05%(+1.37)#57 | 1.22%(+1.20)#1,575 |
| 58. | Cambria | 2.36% | 1.05%(+1.30)#58 | 1.22%(+1.14)#1,620 |
| 59. | Romeoville | 2.35% | 1.05%(+1.30)#59 | 1.22%(+1.14)#1,625 |
| 60. | Steger | 2.30% | 1.05%(+1.25)#60 | 1.22%(+1.09)#1,673 |
| 61. | Galesburg | 2.25% | 1.05%(+1.20)#61 | 1.22%(+1.03)#1,712 |
| 62. | Frankfort | 2.24% | 1.05%(+1.18)#62 | 1.22%(+1.02)#1,723 |
| 63. | Rushville | 2.22% | 1.05%(+1.17)#63 | 1.22%(+1.01)#1,738 |
| 64. | Minooka | 2.22% | 1.05%(+1.17)#64 | 1.22%(+1.01)#1,740 |
| 65. | Peoria | 2.20% | 1.05%(+1.15)#65 | 1.22%(+0.985)#1,762 |
| 66. | Riverdale | 2.18% | 1.05%(+1.12)#66 | 1.22%(+0.960)#1,793 |
| 67. | Urbana | 2.17% | 1.05%(+1.12)#67 | 1.22%(+0.953)#1,803 |
| 68. | Calumet Park | 2.14% | 1.05%(+1.09)#68 | 1.22%(+0.926)#1,827 |
| 69. | Dekalb | 2.10% | 1.05%(+1.04)#69 | 1.22%(+0.881)#1,878 |
| 70. | Glen Carbon | 2.08% | 1.05%(+1.03)#70 | 1.22%(+0.865)#1,894 |
| 71. | Huntley | 1.99% | 1.05%(+0.933)#71 | 1.22%(+0.770)#1,996 |
| 72. | Indian Creek | 1.96% | 1.05%(+0.905)#72 | 1.22%(+0.743)#2,017 |
| 73. | Grayslake | 1.94% | 1.05%(+0.885)#73 | 1.22%(+0.722)#2,036 |
| 74. | Taylorville | 1.93% | 1.05%(+0.882)#74 | 1.22%(+0.720)#2,040 |
| 75. | Waukegan | 1.90% | 1.05%(+0.844)#75 | 1.22%(+0.681)#2,087 |
| 76. | Kirkland | 1.88% | 1.05%(+0.823)#76 | 1.22%(+0.660)#2,108 |
| 77. | Creston | 1.81% | 1.05%(+0.753)#77 | 1.22%(+0.590)#2,203 |
| 78. | Posen | 1.80% | 1.05%(+0.748)#78 | 1.22%(+0.586)#2,213 |
| 79. | Champaign | 1.77% | 1.05%(+0.716)#79 | 1.22%(+0.553)#2,255 |
| 80. | Chicago | 1.75% | 1.05%(+0.698)#80 | 1.22%(+0.536)#2,279 |
| 81. | Shorewood | 1.74% | 1.05%(+0.687)#81 | 1.22%(+0.524)#2,297 |
| 82. | Danvers | 1.73% | 1.05%(+0.680)#82 | 1.22%(+0.517)#2,308 |
| 83. | Phoenix | 1.72% | 1.05%(+0.669)#83 | 1.22%(+0.506)#2,328 |
| 84. | Carbondale | 1.71% | 1.05%(+0.654)#84 | 1.22%(+0.491)#2,346 |
| 85. | Crystal Lawns | 1.68% | 1.05%(+0.625)#85 | 1.22%(+0.462)#2,389 |
| 86. | Sparland | 1.67% | 1.05%(+0.614)#86 | 1.22%(+0.452)#2,407 |
| 87. | Homewood | 1.65% | 1.05%(+0.598)#87 | 1.22%(+0.436)#2,435 |
| 88. | North Chicago | 1.63% | 1.05%(+0.579)#88 | 1.22%(+0.416)#2,463 |
| 89. | Chicago Heights | 1.63% | 1.05%(+0.577)#89 | 1.22%(+0.415)#2,465 |
| 90. | Ohio | 1.61% | 1.05%(+0.553)#90 | 1.22%(+0.390)#2,502 |
| 91. | Glenwood | 1.58% | 1.05%(+0.528)#91 | 1.22%(+0.365)#2,538 |
| 92. | Harvard | 1.56% | 1.05%(+0.503)#92 | 1.22%(+0.341)#2,565 |
| 93. | Fairmont | 1.54% | 1.05%(+0.489)#93 | 1.22%(+0.326)#2,586 |
| 94. | Normal | 1.54% | 1.05%(+0.488)#94 | 1.22%(+0.325)#2,587 |
| 95. | Lee | 1.54% | 1.05%(+0.486)#95 | 1.22%(+0.323)#2,590 |
| 96. | Macomb | 1.53% | 1.05%(+0.480)#96 | 1.22%(+0.317)#2,603 |
| 97. | Berkeley | 1.51% | 1.05%(+0.462)#97 | 1.22%(+0.299)#2,632 |
| 98. | Forest Park | 1.49% | 1.05%(+0.437)#98 | 1.22%(+0.274)#2,667 |
| 99. | Peoria Heights | 1.48% | 1.05%(+0.425)#99 | 1.22%(+0.262)#2,692 |
| 100. | Tampico | 1.48% | 1.05%(+0.424)#100 | 1.22%(+0.261)#2,693 |
Common Questions
What are the Top 10 Cities with the Highest Percentage of Subsaharan African Population in Illinois?
Top 10 Cities with the Highest Percentage of Subsaharan African Population in Illinois are:
#1
41.76%
#2
30.36%
#3
24.91%
#4
24.44%
#5
20.76%
#6
14.07%
#7
10.71%
#8
7.95%
#9
7.00%
#10
6.95%
What city has the Highest Percentage of Subsaharan African Population in Illinois?
Sun River Terrace has the Highest Percentage of Subsaharan African Population in Illinois with 41.76%.
What is the Percentage of Subsaharan African Population in the State of Illinois?
Percentage of Subsaharan African Population in Illinois is 1.05%.
What is the Percentage of Subsaharan African Population in the United States?
Percentage of Subsaharan African Population in the United States is 1.22%.