Cities with the Highest Percentage of Subsaharan African Population in Wisconsin
RELATED REPORTS & OPTIONS
Subsaharan African
Wisconsin
Compare Cities
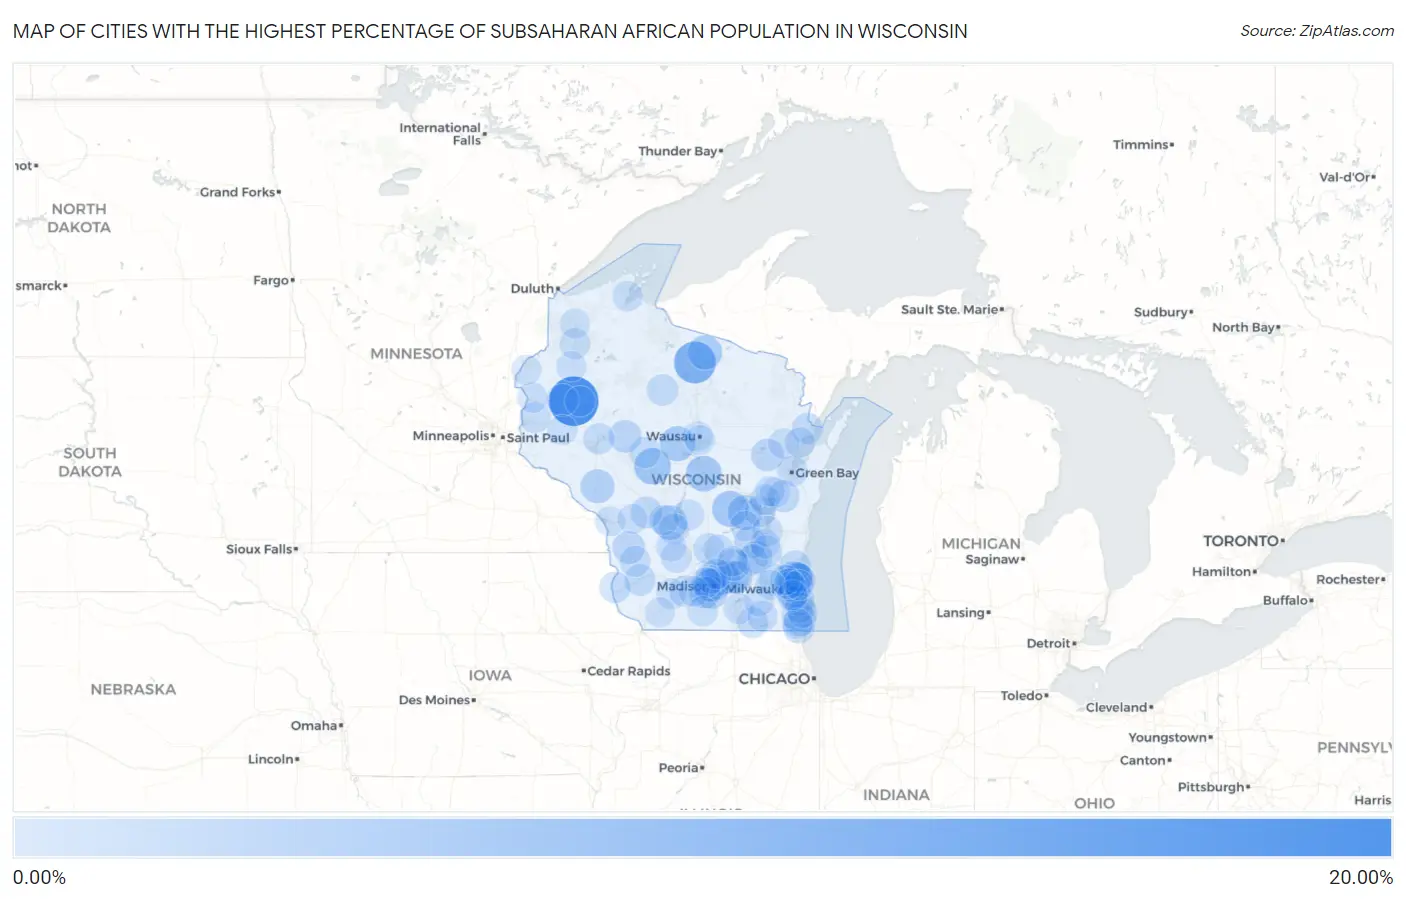
Map of Cities with the Highest Percentage of Subsaharan African Population in Wisconsin
0.00%
20.00%
Cities with the Highest Percentage of Subsaharan African Population in Wisconsin
| City | Subsaharan African | vs State | vs National | |
| 1. | Barron | 15.16% | 0.54%(+14.6)#1 | 1.22%(+13.9)#98 |
| 2. | Minocqua | 9.11% | 0.54%(+8.58)#2 | 1.22%(+7.90)#242 |
| 3. | Granton | 5.05% | 0.54%(+4.52)#3 | 1.22%(+3.84)#631 |
| 4. | Redgranite | 4.60% | 0.54%(+4.06)#4 | 1.22%(+3.38)#717 |
| 5. | Whiting | 4.55% | 0.54%(+4.02)#5 | 1.22%(+3.34)#728 |
| 6. | Fenwood | 4.05% | 0.54%(+3.52)#6 | 1.22%(+2.84)#849 |
| 7. | Eureka | 3.93% | 0.54%(+3.39)#7 | 1.22%(+2.71)#886 |
| 8. | Brown Deer | 3.84% | 0.54%(+3.31)#8 | 1.22%(+2.63)#909 |
| 9. | New Lisbon | 3.61% | 0.54%(+3.08)#9 | 1.22%(+2.40)#983 |
| 10. | Sayner | 3.55% | 0.54%(+3.01)#10 | 1.22%(+2.34)#1,008 |
| 11. | Independence | 3.16% | 0.54%(+2.62)#11 | 1.22%(+1.94)#1,166 |
| 12. | Sun Prairie | 3.15% | 0.54%(+2.62)#12 | 1.22%(+1.94)#1,169 |
| 13. | River Hills | 3.14% | 0.54%(+2.60)#13 | 1.22%(+1.92)#1,181 |
| 14. | Marshall | 2.65% | 0.54%(+2.11)#14 | 1.22%(+1.43)#1,429 |
| 15. | Madison | 2.51% | 0.54%(+1.98)#15 | 1.22%(+1.30)#1,512 |
| 16. | Fox Point | 2.45% | 0.54%(+1.92)#16 | 1.22%(+1.24)#1,561 |
| 17. | Fitchburg | 2.40% | 0.54%(+1.87)#17 | 1.22%(+1.19)#1,584 |
| 18. | Shorewood Hills | 2.35% | 0.54%(+1.81)#18 | 1.22%(+1.14)#1,628 |
| 19. | Bonduel | 2.24% | 0.54%(+1.71)#19 | 1.22%(+1.03)#1,715 |
| 20. | Viroqua | 2.20% | 0.54%(+1.67)#20 | 1.22%(+0.988)#1,760 |
| 21. | Stanley | 2.20% | 0.54%(+1.66)#21 | 1.22%(+0.985)#1,761 |
| 22. | Waterloo | 2.11% | 0.54%(+1.57)#22 | 1.22%(+0.893)#1,865 |
| 23. | Horicon | 1.90% | 0.54%(+1.36)#23 | 1.22%(+0.683)#2,085 |
| 24. | Waupun | 1.86% | 0.54%(+1.33)#24 | 1.22%(+0.648)#2,125 |
| 25. | Somers | 1.83% | 0.54%(+1.30)#25 | 1.22%(+0.616)#2,175 |
| 26. | Columbus | 1.77% | 0.54%(+1.23)#26 | 1.22%(+0.555)#2,254 |
| 27. | Almena | 1.75% | 0.54%(+1.22)#27 | 1.22%(+0.537)#2,276 |
| 28. | West Milwaukee | 1.66% | 0.54%(+1.12)#28 | 1.22%(+0.445)#2,416 |
| 29. | Waunakee | 1.62% | 0.54%(+1.09)#29 | 1.22%(+0.407)#2,473 |
| 30. | Forest Junction | 1.59% | 0.54%(+1.06)#30 | 1.22%(+0.379)#2,516 |
| 31. | Tunnel City | 1.56% | 0.54%(+1.03)#31 | 1.22%(+0.347)#2,553 |
| 32. | Verona | 1.56% | 0.54%(+1.02)#32 | 1.22%(+0.345)#2,556 |
| 33. | Grafton | 1.50% | 0.54%(+0.961)#33 | 1.22%(+0.282)#2,655 |
| 34. | Sturtevant | 1.47% | 0.54%(+0.930)#34 | 1.22%(+0.251)#2,722 |
| 35. | Milwaukee | 1.40% | 0.54%(+0.864)#35 | 1.22%(+0.184)#2,866 |
| 36. | Theresa | 1.38% | 0.54%(+0.842)#36 | 1.22%(+0.163)#2,892 |
| 37. | Peshtigo | 1.35% | 0.54%(+0.812)#37 | 1.22%(+0.132)#2,964 |
| 38. | Boscobel | 1.34% | 0.54%(+0.808)#38 | 1.22%(+0.128)#2,969 |
| 39. | Merton | 1.33% | 0.54%(+0.793)#39 | 1.22%(+0.113)#2,998 |
| 40. | Pleasant Prairie | 1.31% | 0.54%(+0.779)#40 | 1.22%(+0.100)#3,022 |
| 41. | Prentice | 1.29% | 0.54%(+0.755)#41 | 1.22%(+0.075)#3,073 |
| 42. | Oak Creek | 1.28% | 0.54%(+0.743)#42 | 1.22%(+0.064)#3,092 |
| 43. | Juneau | 1.25% | 0.54%(+0.716)#43 | 1.22%(+0.037)#3,151 |
| 44. | Barneveld | 1.24% | 0.54%(+0.702)#44 | 1.22%(+0.023)#3,187 |
| 45. | Prairie Du Chien | 1.20% | 0.54%(+0.664)#45 | 1.22%(-0.016)#3,259 |
| 46. | Chippewa Falls | 1.18% | 0.54%(+0.647)#46 | 1.22%(-0.032)#3,291 |
| 47. | Darien | 1.18% | 0.54%(+0.645)#47 | 1.22%(-0.035)#3,298 |
| 48. | Greenwood | 1.15% | 0.54%(+0.615)#48 | 1.22%(-0.065)#3,359 |
| 49. | Portage | 1.03% | 0.54%(+0.498)#49 | 1.22%(-0.182)#3,621 |
| 50. | Oconto Falls | 1.01% | 0.54%(+0.478)#50 | 1.22%(-0.201)#3,678 |
| 51. | Star Prairie | 1.00% | 0.54%(+0.461)#51 | 1.22%(-0.218)#3,723 |
| 52. | Oshkosh | 0.99% | 0.54%(+0.453)#52 | 1.22%(-0.227)#3,756 |
| 53. | Minong | 0.98% | 0.54%(+0.446)#53 | 1.22%(-0.233)#3,772 |
| 54. | Green Bay | 0.96% | 0.54%(+0.427)#54 | 1.22%(-0.253)#3,822 |
| 55. | Friendship | 0.94% | 0.54%(+0.403)#55 | 1.22%(-0.276)#3,906 |
| 56. | Soldiers Grove | 0.91% | 0.54%(+0.379)#56 | 1.22%(-0.301)#3,990 |
| 57. | Greendale | 0.89% | 0.54%(+0.354)#57 | 1.22%(-0.325)#4,056 |
| 58. | Loganville | 0.85% | 0.54%(+0.312)#58 | 1.22%(-0.368)#4,194 |
| 59. | Pardeeville | 0.84% | 0.54%(+0.301)#59 | 1.22%(-0.379)#4,244 |
| 60. | Dodgeville | 0.74% | 0.54%(+0.205)#60 | 1.22%(-0.474)#4,592 |
| 61. | Deforest | 0.72% | 0.54%(+0.189)#61 | 1.22%(-0.491)#4,644 |
| 62. | Caledonia | 0.72% | 0.54%(+0.188)#62 | 1.22%(-0.491)#4,645 |
| 63. | Fond Du Lac | 0.72% | 0.54%(+0.183)#63 | 1.22%(-0.496)#4,669 |
| 64. | Milton | 0.70% | 0.54%(+0.167)#64 | 1.22%(-0.512)#4,723 |
| 65. | Racine | 0.70% | 0.54%(+0.163)#65 | 1.22%(-0.517)#4,739 |
| 66. | Elkhorn | 0.67% | 0.54%(+0.137)#66 | 1.22%(-0.542)#4,859 |
| 67. | Centuria | 0.64% | 0.54%(+0.108)#67 | 1.22%(-0.572)#5,013 |
| 68. | Kenosha | 0.64% | 0.54%(+0.101)#68 | 1.22%(-0.579)#5,043 |
| 69. | Neenah | 0.63% | 0.54%(+0.091)#69 | 1.22%(-0.589)#5,088 |
| 70. | Oconto | 0.61% | 0.54%(+0.075)#70 | 1.22%(-0.605)#5,157 |
| 71. | Mauston | 0.60% | 0.54%(+0.068)#71 | 1.22%(-0.612)#5,189 |
| 72. | Middleton | 0.59% | 0.54%(+0.054)#72 | 1.22%(-0.625)#5,246 |
| 73. | La Valle | 0.59% | 0.54%(+0.054)#73 | 1.22%(-0.625)#5,247 |
| 74. | Bayside | 0.58% | 0.54%(+0.041)#74 | 1.22%(-0.638)#5,296 |
| 75. | Washburn | 0.56% | 0.54%(+0.021)#75 | 1.22%(-0.658)#5,400 |
| 76. | Wauwatosa | 0.55% | 0.54%(+0.015)#76 | 1.22%(-0.664)#5,430 |
| 77. | Mount Horeb | 0.54% | 0.54%(+0.009)#77 | 1.22%(-0.671)#5,463 |
| 78. | Camp Douglas | 0.54% | 0.54%(+0.006)#78 | 1.22%(-0.674)#5,475 |
| 79. | Monticello | 0.53% | 0.54%(-0.007)#79 | 1.22%(-0.686)#5,541 |
| 80. | Fall River | 0.53% | 0.54%(-0.009)#80 | 1.22%(-0.688)#5,550 |
| 81. | Ripon | 0.52% | 0.54%(-0.011)#81 | 1.22%(-0.691)#5,565 |
| 82. | Solon Springs | 0.52% | 0.54%(-0.015)#82 | 1.22%(-0.694)#5,582 |
| 83. | Greenfield | 0.52% | 0.54%(-0.019)#83 | 1.22%(-0.698)#5,601 |
| 84. | Menomonee Falls | 0.52% | 0.54%(-0.020)#84 | 1.22%(-0.700)#5,613 |
| 85. | Cameron | 0.50% | 0.54%(-0.036)#85 | 1.22%(-0.715)#5,702 |
| 86. | Spooner | 0.48% | 0.54%(-0.051)#86 | 1.22%(-0.730)#5,797 |
| 87. | Butler | 0.47% | 0.54%(-0.063)#87 | 1.22%(-0.743)#5,873 |
| 88. | Boyceville | 0.47% | 0.54%(-0.069)#88 | 1.22%(-0.749)#5,905 |
| 89. | Wausau | 0.45% | 0.54%(-0.085)#89 | 1.22%(-0.764)#5,983 |
| 90. | Combined Locks | 0.44% | 0.54%(-0.094)#90 | 1.22%(-0.773)#6,032 |
| 91. | Onalaska | 0.44% | 0.54%(-0.095)#91 | 1.22%(-0.774)#6,040 |
| 92. | Grantsburg | 0.43% | 0.54%(-0.102)#92 | 1.22%(-0.782)#6,083 |
| 93. | Sparta | 0.43% | 0.54%(-0.103)#93 | 1.22%(-0.783)#6,088 |
| 94. | Palmyra | 0.43% | 0.54%(-0.106)#94 | 1.22%(-0.786)#6,112 |
| 95. | Brownsville | 0.42% | 0.54%(-0.117)#95 | 1.22%(-0.797)#6,166 |
| 96. | Appleton | 0.41% | 0.54%(-0.123)#96 | 1.22%(-0.803)#6,209 |
| 97. | Nashotah | 0.41% | 0.54%(-0.124)#97 | 1.22%(-0.804)#6,215 |
| 98. | Belmont | 0.41% | 0.54%(-0.129)#98 | 1.22%(-0.808)#6,245 |
| 99. | Shorewood | 0.40% | 0.54%(-0.134)#99 | 1.22%(-0.814)#6,283 |
| 100. | Schofield | 0.40% | 0.54%(-0.137)#100 | 1.22%(-0.816)#6,299 |
Common Questions
What are the Top 10 Cities with the Highest Percentage of Subsaharan African Population in Wisconsin?
Top 10 Cities with the Highest Percentage of Subsaharan African Population in Wisconsin are:
#1
15.16%
#2
9.11%
#3
5.05%
#4
4.60%
#5
4.55%
#6
4.05%
#7
3.93%
#8
3.84%
#9
3.61%
#10
3.55%
What city has the Highest Percentage of Subsaharan African Population in Wisconsin?
Barron has the Highest Percentage of Subsaharan African Population in Wisconsin with 15.16%.
What is the Percentage of Subsaharan African Population in the State of Wisconsin?
Percentage of Subsaharan African Population in Wisconsin is 0.54%.
What is the Percentage of Subsaharan African Population in the United States?
Percentage of Subsaharan African Population in the United States is 1.22%.