El Paso de Robles Paso Robles, CA Map & Demographics
El Paso de Robles Paso Robles Map
El Paso de Robles Paso Robles Overview
$43,370
PER CAPITA INCOME
$103,027
AVG FAMILY INCOME
$83,948
AVG HOUSEHOLD INCOME
29.0%
WAGE / INCOME GAP [ % ]
71.0¢/ $1
WAGE / INCOME GAP [ $ ]
$10,298
FAMILY INCOME DEFICIT
0.47
INEQUALITY / GINI INDEX
31,595
TOTAL POPULATION
15,534
MALE POPULATION
16,061
FEMALE POPULATION
96.72
MALES / 100 FEMALES
103.39
FEMALES / 100 MALES
39.5
MEDIAN AGE
3.2
AVG FAMILY SIZE
2.6
AVG HOUSEHOLD SIZE
15,473
LABOR FORCE [ PEOPLE ]
61.9%
PERCENT IN LABOR FORCE
4.8%
UNEMPLOYMENT RATE
Income in El Paso de Robles Paso Robles
Income Overview in El Paso de Robles Paso Robles
Per Capita Income in El Paso de Robles Paso Robles is $43,370, while median incomes of families and households are $103,027 and $83,948 respectively.
| Characteristic | Number | Measure |
| Per Capita Income | 31,595 | $43,370 |
| Median Family Income | 7,959 | $103,027 |
| Mean Family Income | 7,959 | $133,549 |
| Median Household Income | 12,005 | $83,948 |
| Mean Household Income | 12,005 | $112,255 |
| Income Deficit | 7,959 | $10,298 |
| Wage / Income Gap (%) | 31,595 | 29.04% |
| Wage / Income Gap ($) | 31,595 | 70.96¢ per $1 |
| Gini / Inequality Index | 31,595 | 0.47 |
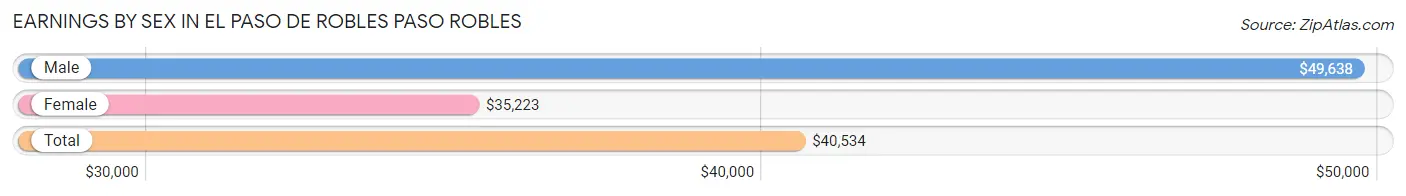
Earnings by Sex in El Paso de Robles Paso Robles
Average Earnings in El Paso de Robles Paso Robles are $40,534, $49,638 for men and $35,223 for women, a difference of 29.0%.
| Sex | Number | Average Earnings |
| Male | 7,998 (50.2%) | $49,638 |
| Female | 7,929 (49.8%) | $35,223 |
| Total | 15,927 (100.0%) | $40,534 |
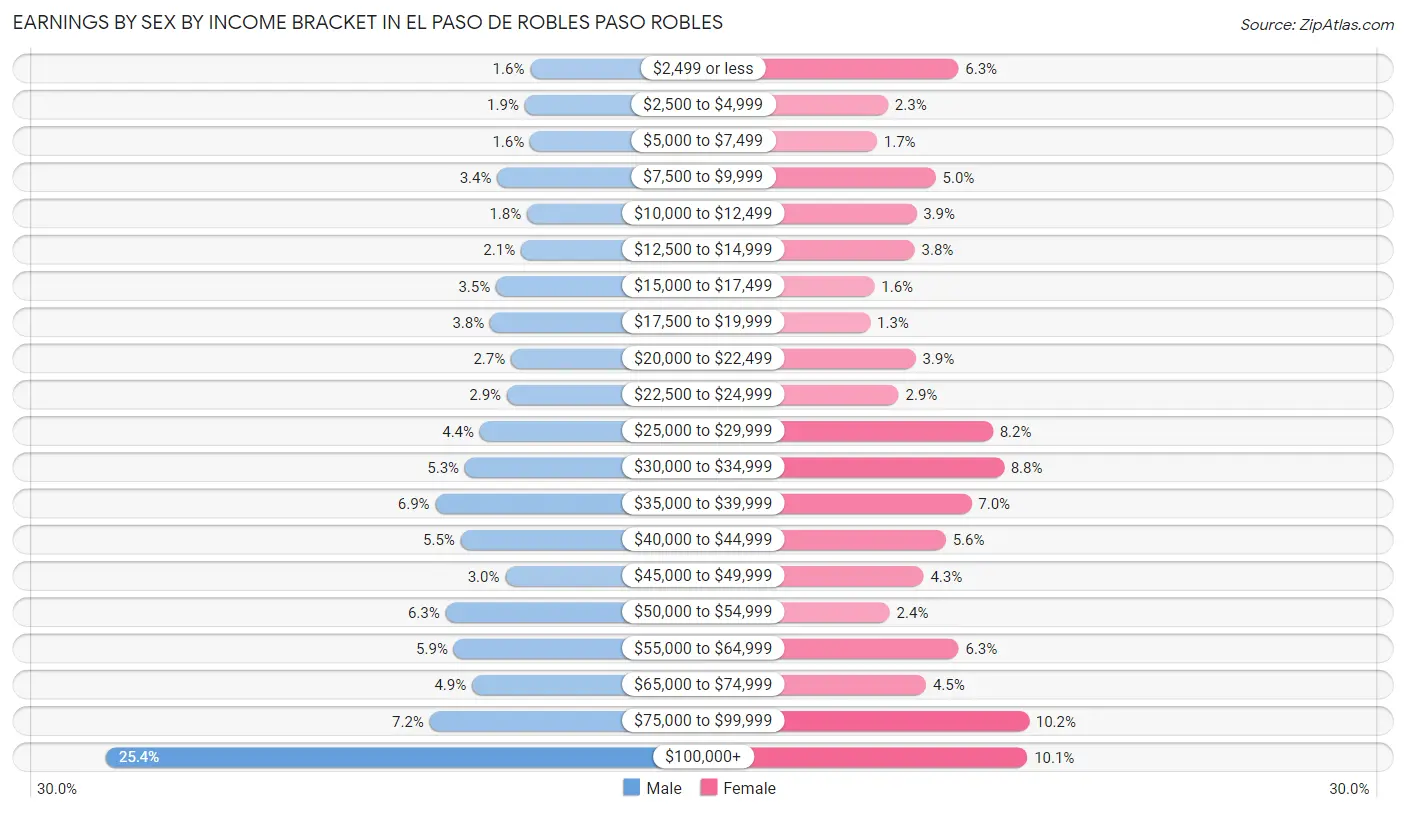
Earnings by Sex by Income Bracket in El Paso de Robles Paso Robles
The most common earnings brackets in El Paso de Robles Paso Robles are $100,000+ for men (2,034 | 25.4%) and $75,000 to $99,999 for women (811 | 10.2%).
| Income | Male | Female |
| $2,499 or less | 126 (1.6%) | 497 (6.3%) |
| $2,500 to $4,999 | 151 (1.9%) | 183 (2.3%) |
| $5,000 to $7,499 | 127 (1.6%) | 134 (1.7%) |
| $7,500 to $9,999 | 274 (3.4%) | 396 (5.0%) |
| $10,000 to $12,499 | 141 (1.8%) | 309 (3.9%) |
| $12,500 to $14,999 | 168 (2.1%) | 302 (3.8%) |
| $15,000 to $17,499 | 280 (3.5%) | 123 (1.5%) |
| $17,500 to $19,999 | 307 (3.8%) | 104 (1.3%) |
| $20,000 to $22,499 | 213 (2.7%) | 306 (3.9%) |
| $22,500 to $24,999 | 231 (2.9%) | 231 (2.9%) |
| $25,000 to $29,999 | 353 (4.4%) | 650 (8.2%) |
| $30,000 to $34,999 | 420 (5.2%) | 699 (8.8%) |
| $35,000 to $39,999 | 553 (6.9%) | 555 (7.0%) |
| $40,000 to $44,999 | 439 (5.5%) | 441 (5.6%) |
| $45,000 to $49,999 | 238 (3.0%) | 342 (4.3%) |
| $50,000 to $54,999 | 507 (6.3%) | 191 (2.4%) |
| $55,000 to $64,999 | 470 (5.9%) | 498 (6.3%) |
| $65,000 to $74,999 | 388 (4.9%) | 353 (4.4%) |
| $75,000 to $99,999 | 578 (7.2%) | 811 (10.2%) |
| $100,000+ | 2,034 (25.4%) | 804 (10.1%) |
| Total | 7,998 (100.0%) | 7,929 (100.0%) |
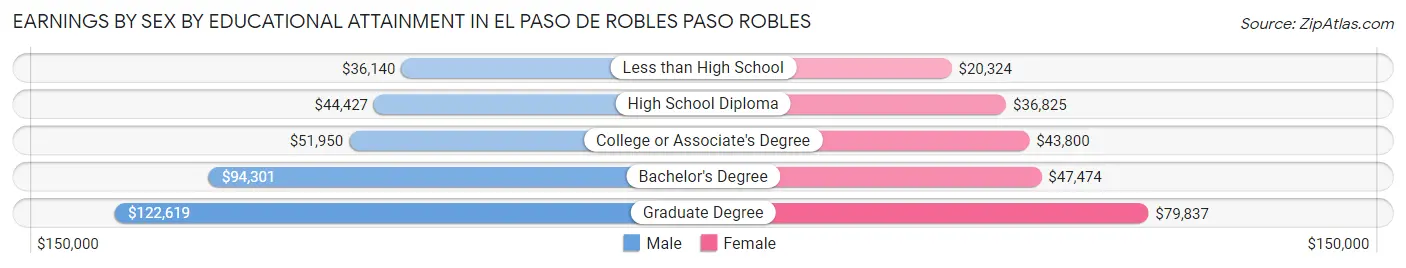
Earnings by Sex by Educational Attainment in El Paso de Robles Paso Robles
Average earnings in El Paso de Robles Paso Robles are $55,471 for men and $40,358 for women, a difference of 27.2%. Men with an educational attainment of graduate degree enjoy the highest average annual earnings of $122,619, while those with less than high school education earn the least with $36,140. Women with an educational attainment of graduate degree earn the most with the average annual earnings of $79,837, while those with less than high school education have the smallest earnings of $20,324.
| Educational Attainment | Male Income | Female Income |
| Less than High School | $36,140 | $20,324 |
| High School Diploma | $44,427 | $36,825 |
| College or Associate's Degree | $51,950 | $43,800 |
| Bachelor's Degree | $94,301 | $47,474 |
| Graduate Degree | $122,619 | $79,837 |
| Total | $55,471 | $40,358 |
Family Income in El Paso de Robles Paso Robles
Family Income Brackets in El Paso de Robles Paso Robles
According to the El Paso de Robles Paso Robles family income data, there are 1,783 families falling into the $100,000 to $149,999 income range, which is the most common income bracket and makes up 22.4% of all families. Conversely, the less than $10,000 income bracket is the least frequent group with only 199 families (2.5%) belonging to this category.
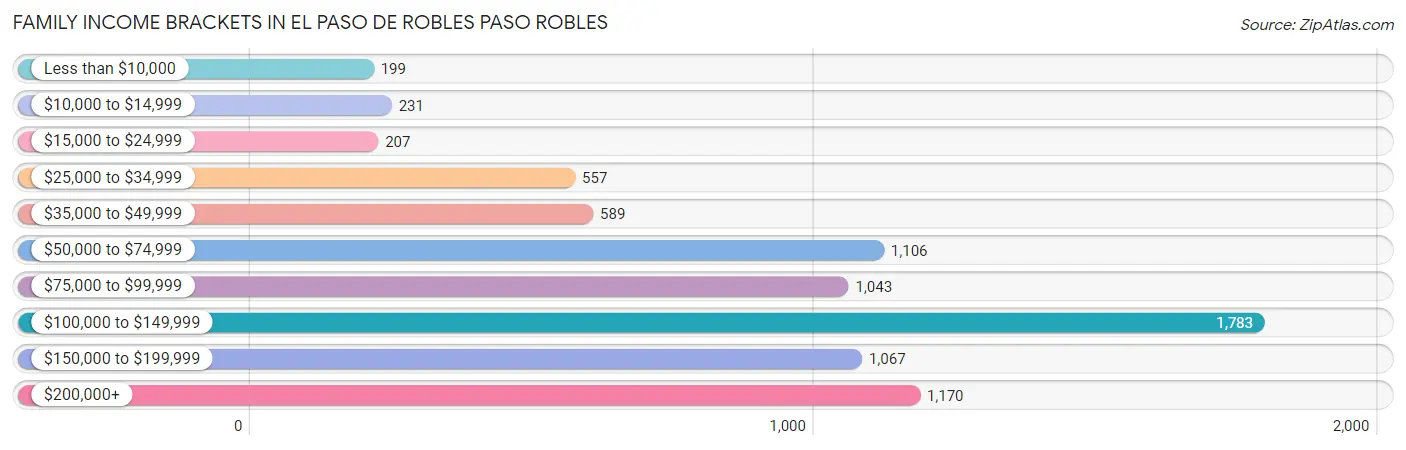
| Income Bracket | # Families | % Families |
| Less than $10,000 | 199 | 2.5% |
| $10,000 to $14,999 | 231 | 2.9% |
| $15,000 to $24,999 | 207 | 2.6% |
| $25,000 to $34,999 | 557 | 7.0% |
| $35,000 to $49,999 | 589 | 7.4% |
| $50,000 to $74,999 | 1,106 | 13.9% |
| $75,000 to $99,999 | 1,043 | 13.1% |
| $100,000 to $149,999 | 1,783 | 22.4% |
| $150,000 to $199,999 | 1,067 | 13.4% |
| $200,000+ | 1,170 | 14.7% |
Family Income by Famaliy Size in El Paso de Robles Paso Robles
7+ person families (119 | 1.5%) account for the highest median family income in El Paso de Robles Paso Robles with $149,180 per family, while 2-person families (3,784 | 47.5%) have the highest median income of $40,810 per family member.
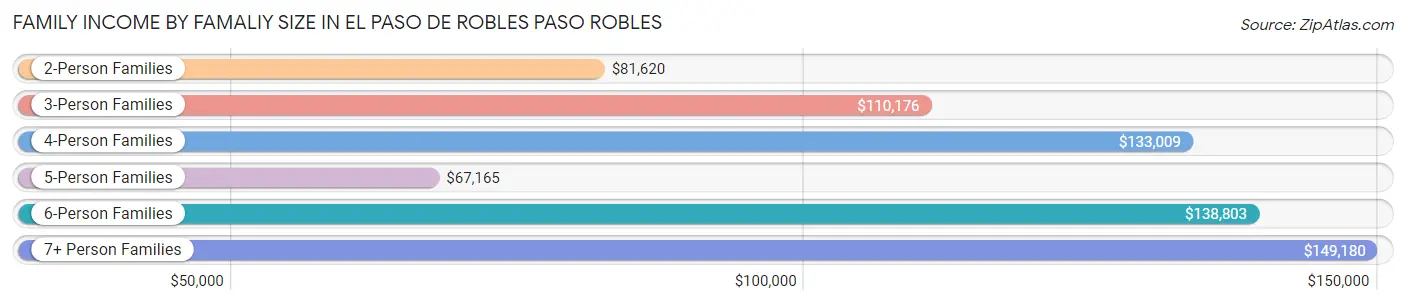
| Income Bracket | # Families | Median Income |
| 2-Person Families | 3,784 (47.5%) | $81,620 |
| 3-Person Families | 1,649 (20.7%) | $110,176 |
| 4-Person Families | 1,355 (17.0%) | $133,009 |
| 5-Person Families | 695 (8.7%) | $67,165 |
| 6-Person Families | 357 (4.5%) | $138,803 |
| 7+ Person Families | 119 (1.5%) | $149,180 |
| Total | 7,959 (100.0%) | $103,027 |
Family Income by Number of Earners in El Paso de Robles Paso Robles
The median family income in El Paso de Robles Paso Robles is $103,027, with families comprising 3+ earners (1,005) having the highest median family income of $154,107, while families with no earners (1,560) have the lowest median family income of $52,330, accounting for 12.6% and 19.6% of families, respectively.
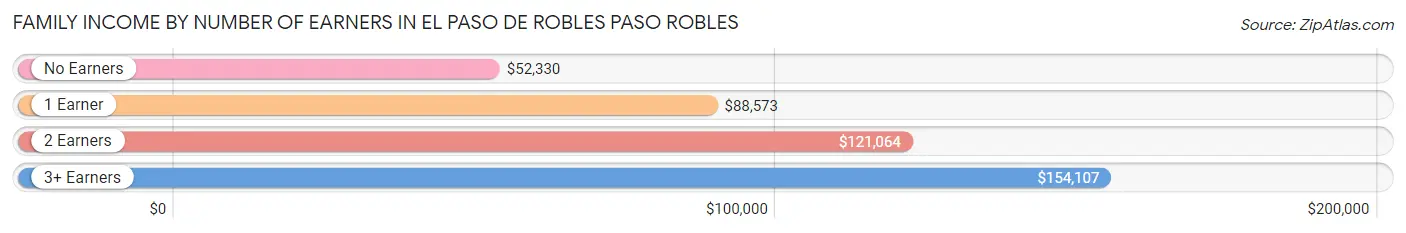
| Number of Earners | # Families | Median Income |
| No Earners | 1,560 (19.6%) | $52,330 |
| 1 Earner | 2,395 (30.1%) | $88,573 |
| 2 Earners | 2,999 (37.7%) | $121,064 |
| 3+ Earners | 1,005 (12.6%) | $154,107 |
| Total | 7,959 (100.0%) | $103,027 |
Household Income in El Paso de Robles Paso Robles
Household Income Brackets in El Paso de Robles Paso Robles
With 2,581 households falling in the category, the $100,000 to $149,999 income range is the most frequent in El Paso de Robles Paso Robles, accounting for 21.5% of all households. In contrast, only 348 households (2.9%) fall into the $10,000 to $14,999 income bracket, making it the least populous group.
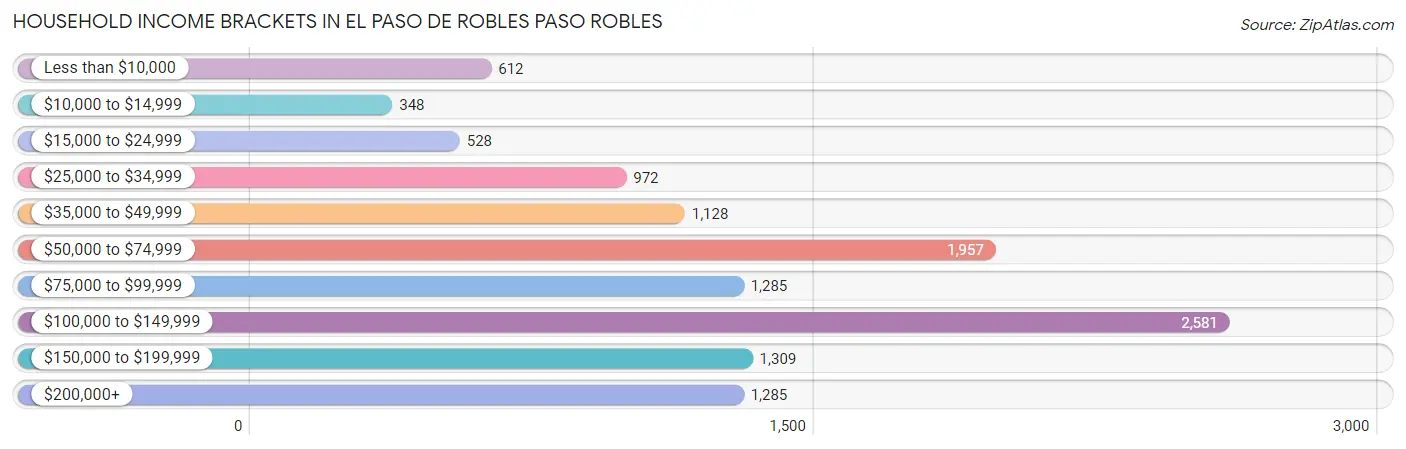
| Income Bracket | # Households | % Households |
| Less than $10,000 | 612 | 5.1% |
| $10,000 to $14,999 | 348 | 2.9% |
| $15,000 to $24,999 | 528 | 4.4% |
| $25,000 to $34,999 | 972 | 8.1% |
| $35,000 to $49,999 | 1,128 | 9.4% |
| $50,000 to $74,999 | 1,957 | 16.3% |
| $75,000 to $99,999 | 1,285 | 10.7% |
| $100,000 to $149,999 | 2,581 | 21.5% |
| $150,000 to $199,999 | 1,309 | 10.9% |
| $200,000+ | 1,285 | 10.7% |
Household Income by Householder Age in El Paso de Robles Paso Robles
The median household income in El Paso de Robles Paso Robles is $83,948, with the highest median household income of $100,536 found in the 45 to 64 years age bracket for the primary householder. A total of 4,146 households (34.5%) fall into this category. Meanwhile, the 15 to 24 years age bracket for the primary householder has the lowest median household income of $63,000, with 348 households (2.9%) in this group.
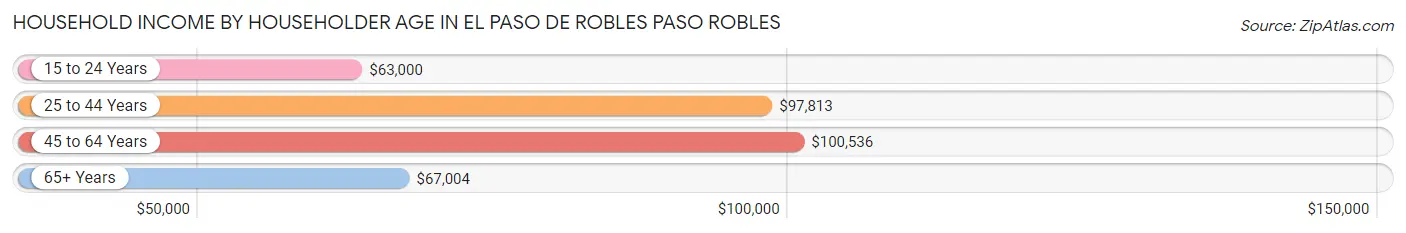
| Income Bracket | # Households | Median Income |
| 15 to 24 Years | 348 (2.9%) | $63,000 |
| 25 to 44 Years | 3,379 (28.1%) | $97,813 |
| 45 to 64 Years | 4,146 (34.5%) | $100,536 |
| 65+ Years | 4,132 (34.4%) | $67,004 |
| Total | 12,005 (100.0%) | $83,948 |
Poverty in El Paso de Robles Paso Robles
Income Below Poverty by Sex and Age in El Paso de Robles Paso Robles
With 9.9% poverty level for males and 12.0% for females among the residents of El Paso de Robles Paso Robles, under 5 year old males and 16 and 17 year old females are the most vulnerable to poverty, with 318 males (32.8%) and 113 females (21.9%) in their respective age groups living below the poverty level.
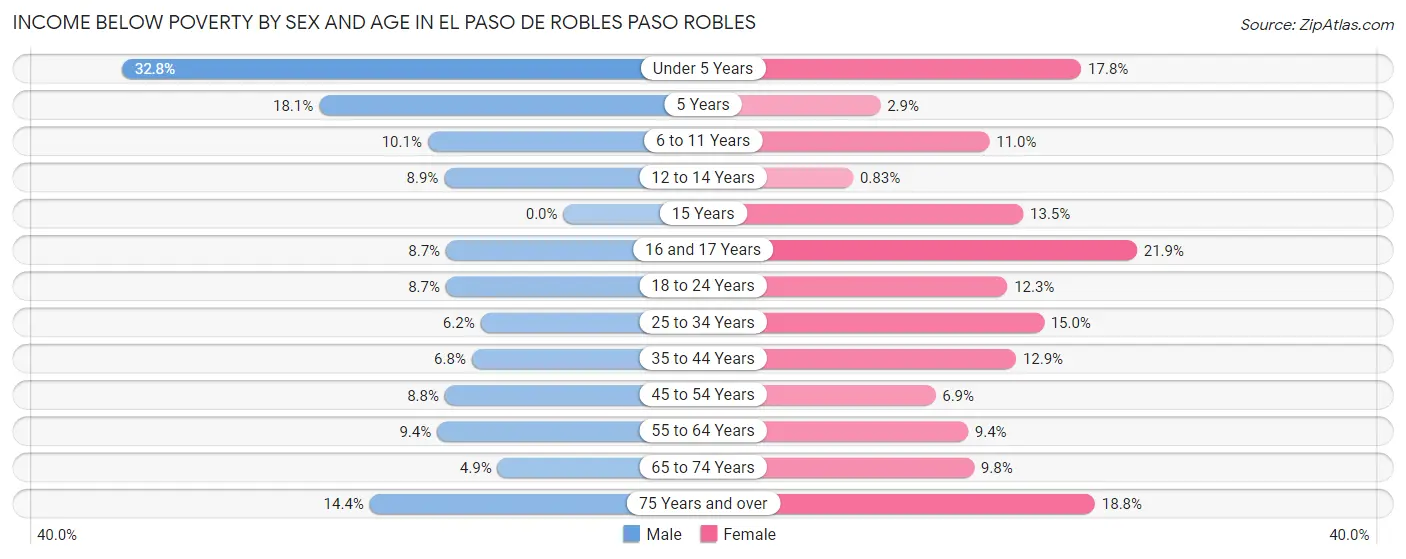
| Age Bracket | Male | Female |
| Under 5 Years | 318 (32.8%) | 167 (17.8%) |
| 5 Years | 41 (18.1%) | 7 (2.9%) |
| 6 to 11 Years | 125 (10.1%) | 112 (11.0%) |
| 12 to 14 Years | 77 (8.8%) | 6 (0.8%) |
| 15 Years | 0 (0.0%) | 14 (13.5%) |
| 16 and 17 Years | 34 (8.7%) | 113 (21.9%) |
| 18 to 24 Years | 110 (8.7%) | 155 (12.3%) |
| 25 to 34 Years | 123 (6.1%) | 270 (15.0%) |
| 35 to 44 Years | 145 (6.8%) | 264 (12.9%) |
| 45 to 54 Years | 186 (8.8%) | 112 (6.9%) |
| 55 to 64 Years | 141 (9.4%) | 204 (9.4%) |
| 65 to 74 Years | 72 (4.9%) | 190 (9.8%) |
| 75 Years and over | 154 (14.4%) | 314 (18.8%) |
| Total | 1,526 (9.9%) | 1,928 (12.0%) |
Income Above Poverty by Sex and Age in El Paso de Robles Paso Robles
According to the poverty statistics in El Paso de Robles Paso Robles, males aged 15 years and females aged 12 to 14 years are the age groups that are most secure financially, with 100.0% of males and 99.2% of females in these age groups living above the poverty line.
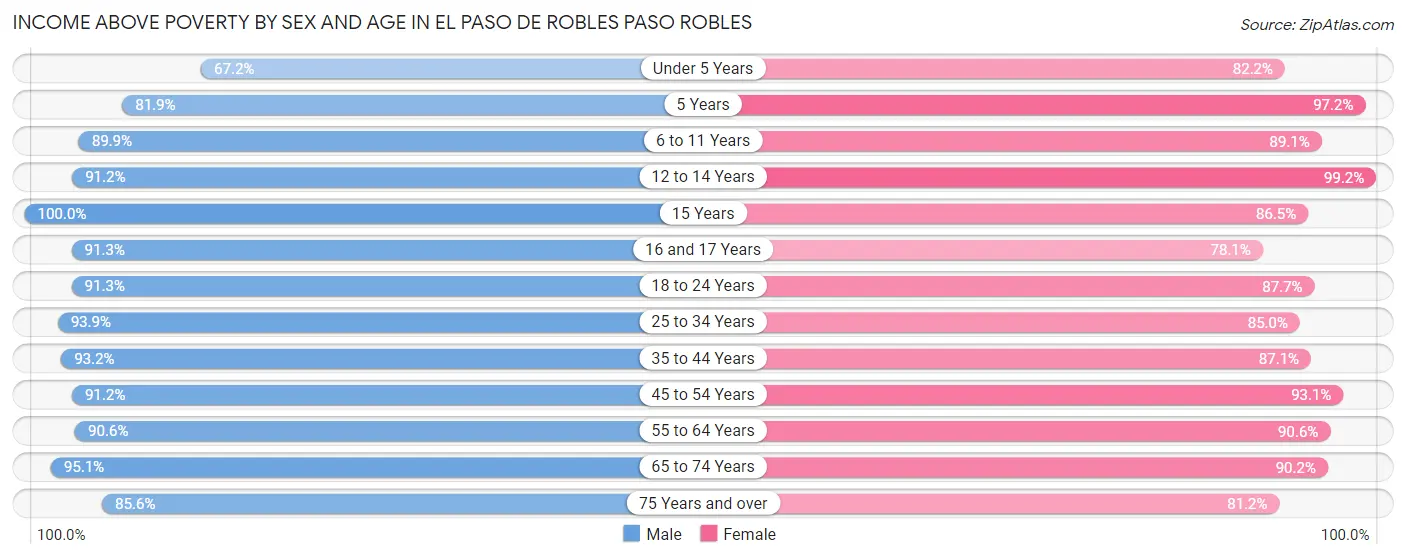
| Age Bracket | Male | Female |
| Under 5 Years | 652 (67.2%) | 773 (82.2%) |
| 5 Years | 185 (81.9%) | 239 (97.2%) |
| 6 to 11 Years | 1,116 (89.9%) | 911 (89.0%) |
| 12 to 14 Years | 793 (91.1%) | 714 (99.2%) |
| 15 Years | 209 (100.0%) | 90 (86.5%) |
| 16 and 17 Years | 356 (91.3%) | 403 (78.1%) |
| 18 to 24 Years | 1,150 (91.3%) | 1,107 (87.7%) |
| 25 to 34 Years | 1,877 (93.9%) | 1,531 (85.0%) |
| 35 to 44 Years | 1,986 (93.2%) | 1,777 (87.1%) |
| 45 to 54 Years | 1,927 (91.2%) | 1,502 (93.1%) |
| 55 to 64 Years | 1,363 (90.6%) | 1,976 (90.6%) |
| 65 to 74 Years | 1,400 (95.1%) | 1,747 (90.2%) |
| 75 Years and over | 917 (85.6%) | 1,357 (81.2%) |
| Total | 13,931 (90.1%) | 14,127 (88.0%) |
Income Below Poverty Among Married-Couple Families in El Paso de Robles Paso Robles
The poverty statistics for married-couple families in El Paso de Robles Paso Robles show that 6.0% or 356 of the total 5,946 families live below the poverty line. Families with 3 or 4 children have the highest poverty rate of 20.5%, comprising of 115 families. On the other hand, families with 5 or more children have the lowest poverty rate of 0.0%, which includes 0 families.
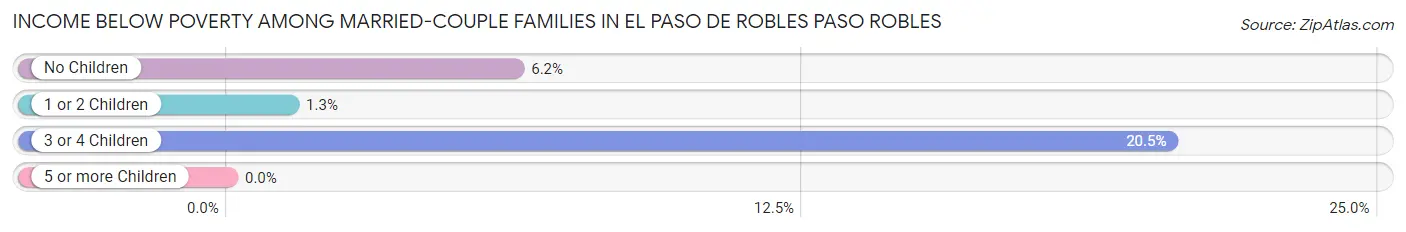
| Children | Above Poverty | Below Poverty |
| No Children | 3,249 (93.8%) | 216 (6.2%) |
| 1 or 2 Children | 1,859 (98.7%) | 25 (1.3%) |
| 3 or 4 Children | 447 (79.5%) | 115 (20.5%) |
| 5 or more Children | 35 (100.0%) | 0 (0.0%) |
| Total | 5,590 (94.0%) | 356 (6.0%) |
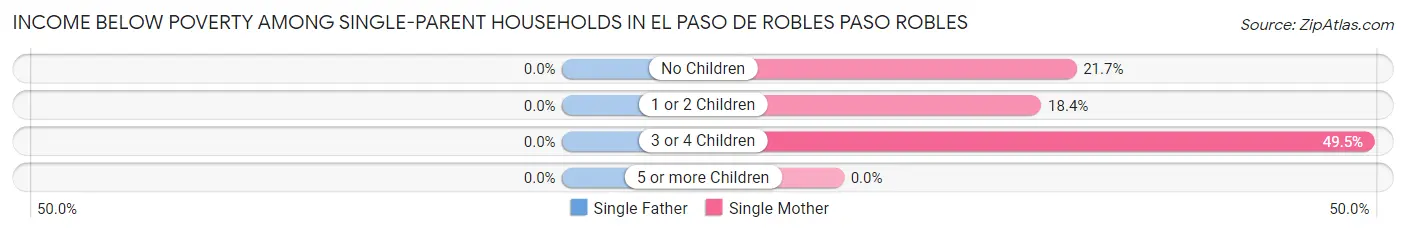
Income Below Poverty Among Single-Parent Households in El Paso de Robles Paso Robles
| Children | Single Father | Single Mother |
| No Children | 0 (0.0%) | 81 (21.7%) |
| 1 or 2 Children | 0 (0.0%) | 183 (18.4%) |
| 3 or 4 Children | 0 (0.0%) | 47 (49.5%) |
| 5 or more Children | 0 (0.0%) | 0 (0.0%) |
| Total | 0 (0.0%) | 311 (21.2%) |
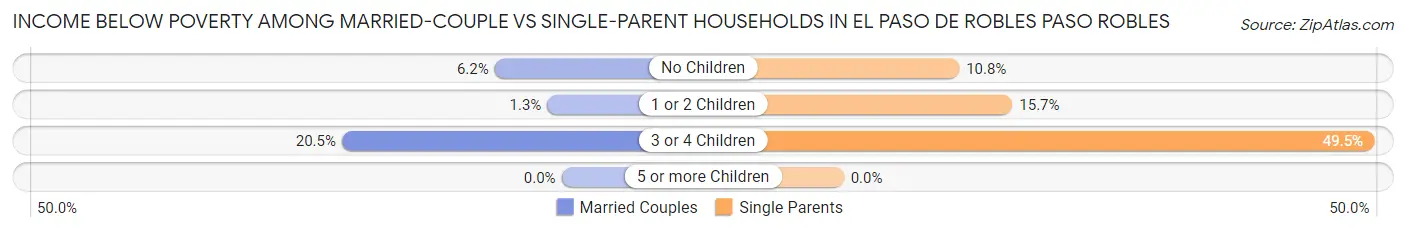
Income Below Poverty Among Married-Couple vs Single-Parent Households in El Paso de Robles Paso Robles
The poverty data for El Paso de Robles Paso Robles shows that 356 of the married-couple family households (6.0%) and 311 of the single-parent households (15.4%) are living below the poverty level. Within the married-couple family households, those with 3 or 4 children have the highest poverty rate, with 115 households (20.5%) falling below the poverty line. Among the single-parent households, those with 3 or 4 children have the highest poverty rate, with 47 household (49.5%) living below poverty.
| Children | Married-Couple Families | Single-Parent Households |
| No Children | 216 (6.2%) | 81 (10.8%) |
| 1 or 2 Children | 25 (1.3%) | 183 (15.7%) |
| 3 or 4 Children | 115 (20.5%) | 47 (49.5%) |
| 5 or more Children | 0 (0.0%) | 0 (0.0%) |
| Total | 356 (6.0%) | 311 (15.4%) |
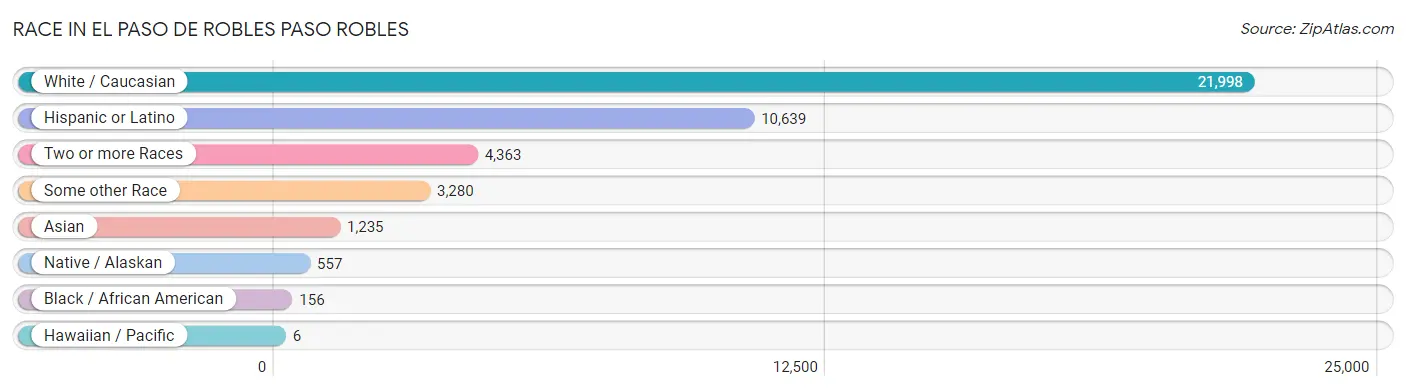
Race in El Paso de Robles Paso Robles
The most populous races in El Paso de Robles Paso Robles are White / Caucasian (21,998 | 69.6%), Hispanic or Latino (10,639 | 33.7%), and Two or more Races (4,363 | 13.8%).
| Race | # Population | % Population |
| Asian | 1,235 | 3.9% |
| Black / African American | 156 | 0.5% |
| Hawaiian / Pacific | 6 | 0.0% |
| Hispanic or Latino | 10,639 | 33.7% |
| Native / Alaskan | 557 | 1.8% |
| White / Caucasian | 21,998 | 69.6% |
| Two or more Races | 4,363 | 13.8% |
| Some other Race | 3,280 | 10.4% |
| Total | 31,595 | 100.0% |
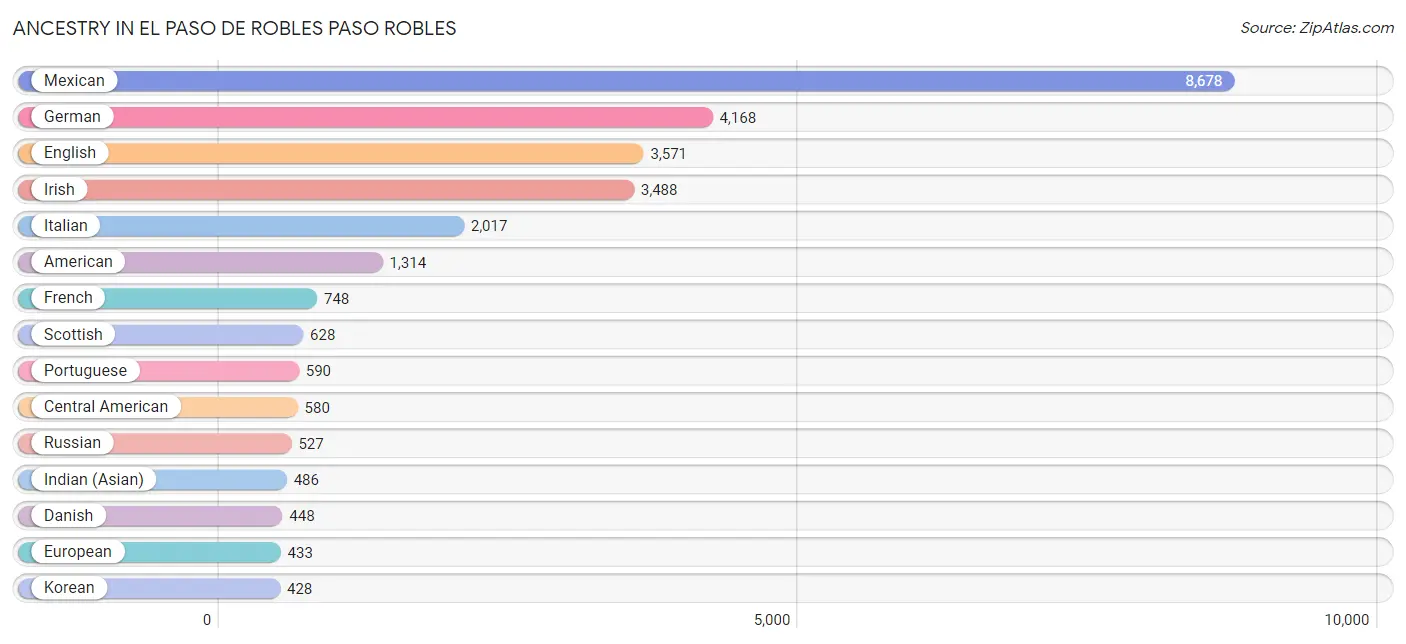
Ancestry in El Paso de Robles Paso Robles
The most populous ancestries reported in El Paso de Robles Paso Robles are Mexican (8,678 | 27.5%), German (4,168 | 13.2%), English (3,571 | 11.3%), Irish (3,488 | 11.0%), and Italian (2,017 | 6.4%), together accounting for 69.4% of all El Paso de Robles Paso Robles residents.
| Ancestry | # Population | % Population |
| African | 31 | 0.1% |
| American | 1,314 | 4.2% |
| Apache | 68 | 0.2% |
| Arab | 272 | 0.9% |
| Argentinean | 25 | 0.1% |
| Armenian | 23 | 0.1% |
| Assyrian / Chaldean / Syriac | 19 | 0.1% |
| Australian | 73 | 0.2% |
| Austrian | 120 | 0.4% |
| Basque | 59 | 0.2% |
| Bhutanese | 189 | 0.6% |
| British | 101 | 0.3% |
| Burmese | 205 | 0.6% |
| Canadian | 80 | 0.3% |
| Celtic | 13 | 0.0% |
| Central American | 580 | 1.8% |
| Central American Indian | 188 | 0.6% |
| Cherokee | 298 | 0.9% |
| Chickasaw | 16 | 0.1% |
| Chippewa | 13 | 0.0% |
| Choctaw | 133 | 0.4% |
| Colombian | 115 | 0.4% |
| Costa Rican | 7 | 0.0% |
| Croatian | 41 | 0.1% |
| Cuban | 148 | 0.5% |
| Czech | 107 | 0.3% |
| Czechoslovakian | 15 | 0.1% |
| Danish | 448 | 1.4% |
| Delaware | 22 | 0.1% |
| Dominican | 20 | 0.1% |
| Dutch | 148 | 0.5% |
| Eastern European | 64 | 0.2% |
| Egyptian | 192 | 0.6% |
| English | 3,571 | 11.3% |
| European | 433 | 1.4% |
| Filipino | 26 | 0.1% |
| Finnish | 122 | 0.4% |
| French | 748 | 2.4% |
| French Canadian | 125 | 0.4% |
| German | 4,168 | 13.2% |
| Greek | 25 | 0.1% |
| Guamanian / Chamorro | 6 | 0.0% |
| Guatemalan | 361 | 1.1% |
| Honduran | 7 | 0.0% |
| Hungarian | 48 | 0.2% |
| Indian (Asian) | 486 | 1.5% |
| Iranian | 21 | 0.1% |
| Irish | 3,488 | 11.0% |
| Italian | 2,017 | 6.4% |
| Kenyan | 27 | 0.1% |
| Korean | 428 | 1.3% |
| Lebanese | 6 | 0.0% |
| Lithuanian | 41 | 0.1% |
| Mexican | 8,678 | 27.5% |
| Mexican American Indian | 182 | 0.6% |
| Native Hawaiian | 37 | 0.1% |
| Nicaraguan | 122 | 0.4% |
| Northern European | 59 | 0.2% |
| Norwegian | 293 | 0.9% |
| Pakistani | 47 | 0.2% |
| Panamanian | 33 | 0.1% |
| Pennsylvania German | 4 | 0.0% |
| Peruvian | 50 | 0.2% |
| Pima | 68 | 0.2% |
| Polish | 281 | 0.9% |
| Portuguese | 590 | 1.9% |
| Potawatomi | 9 | 0.0% |
| Puerto Rican | 168 | 0.5% |
| Russian | 527 | 1.7% |
| Salvadoran | 50 | 0.2% |
| Scandinavian | 113 | 0.4% |
| Scotch-Irish | 415 | 1.3% |
| Scottish | 628 | 2.0% |
| Slavic | 6 | 0.0% |
| Slovak | 39 | 0.1% |
| Slovene | 14 | 0.0% |
| South African | 32 | 0.1% |
| South American | 251 | 0.8% |
| Spaniard | 384 | 1.2% |
| Spanish | 130 | 0.4% |
| Sri Lankan | 254 | 0.8% |
| Subsaharan African | 137 | 0.4% |
| Swedish | 253 | 0.8% |
| Swiss | 140 | 0.4% |
| Syrian | 35 | 0.1% |
| Thai | 31 | 0.1% |
| Ukrainian | 46 | 0.2% |
| Welsh | 392 | 1.2% |
| Yaqui | 85 | 0.3% |
| Yugoslavian | 103 | 0.3% | View All 90 Rows |
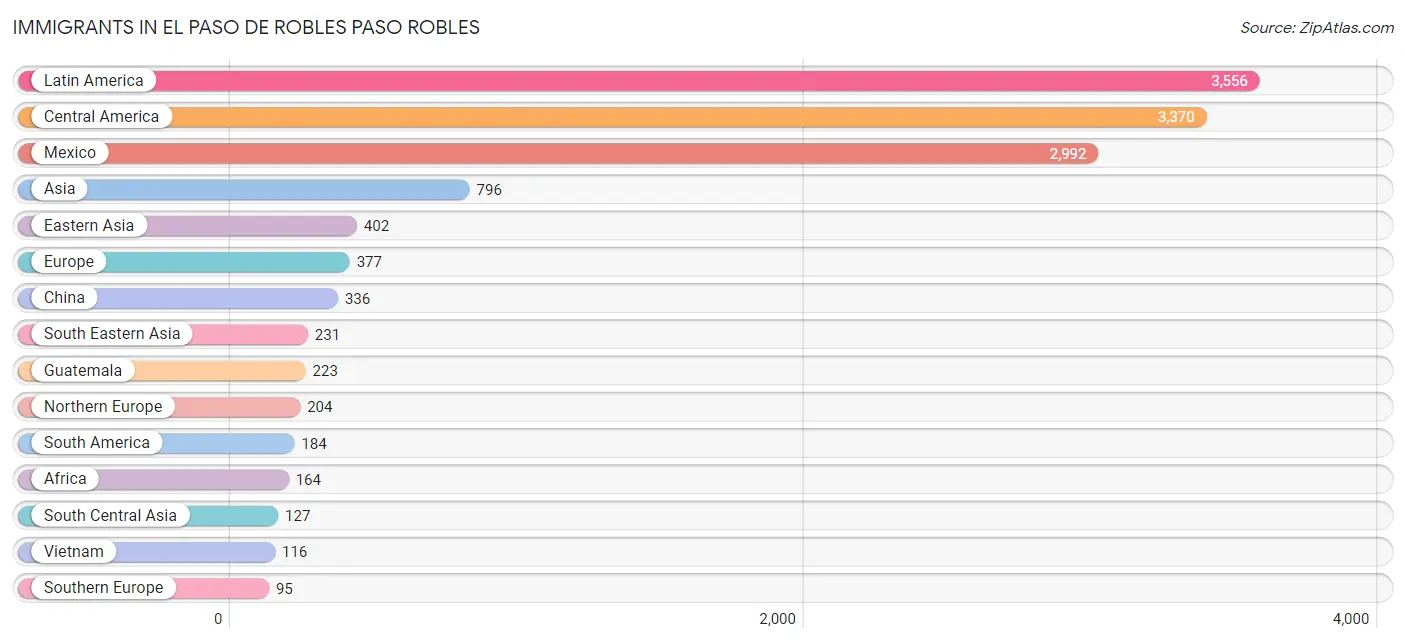
Immigrants in El Paso de Robles Paso Robles
The most numerous immigrant groups reported in El Paso de Robles Paso Robles came from Latin America (3,556 | 11.3%), Central America (3,370 | 10.7%), Mexico (2,992 | 9.5%), Asia (796 | 2.5%), and Eastern Asia (402 | 1.3%), together accounting for 35.2% of all El Paso de Robles Paso Robles residents.
| Immigration Origin | # Population | % Population |
| Africa | 164 | 0.5% |
| Argentina | 44 | 0.1% |
| Asia | 796 | 2.5% |
| Australia | 12 | 0.0% |
| Austria | 11 | 0.0% |
| Azores | 47 | 0.2% |
| Bosnia and Herzegovina | 21 | 0.1% |
| Brazil | 16 | 0.1% |
| Canada | 78 | 0.3% |
| Caribbean | 2 | 0.0% |
| Central America | 3,370 | 10.7% |
| China | 336 | 1.1% |
| Colombia | 61 | 0.2% |
| Costa Rica | 7 | 0.0% |
| Cuba | 2 | 0.0% |
| Denmark | 34 | 0.1% |
| Eastern Africa | 15 | 0.1% |
| Eastern Asia | 402 | 1.3% |
| Eastern Europe | 48 | 0.2% |
| Egypt | 91 | 0.3% |
| El Salvador | 41 | 0.1% |
| England | 62 | 0.2% |
| Europe | 377 | 1.2% |
| Germany | 19 | 0.1% |
| Guatemala | 223 | 0.7% |
| Hong Kong | 18 | 0.1% |
| India | 31 | 0.1% |
| Iran | 59 | 0.2% |
| Iraq | 11 | 0.0% |
| Ireland | 31 | 0.1% |
| Israel | 9 | 0.0% |
| Japan | 28 | 0.1% |
| Kenya | 15 | 0.1% |
| Korea | 38 | 0.1% |
| Latin America | 3,556 | 11.3% |
| Mexico | 2,992 | 9.5% |
| Nicaragua | 94 | 0.3% |
| Northern Africa | 91 | 0.3% |
| Northern Europe | 204 | 0.6% |
| Oceania | 12 | 0.0% |
| Pakistan | 37 | 0.1% |
| Panama | 13 | 0.0% |
| Peru | 63 | 0.2% |
| Philippines | 93 | 0.3% |
| Portugal | 47 | 0.2% |
| Russia | 27 | 0.1% |
| Scotland | 15 | 0.1% |
| South Africa | 58 | 0.2% |
| South America | 184 | 0.6% |
| South Central Asia | 127 | 0.4% |
| South Eastern Asia | 231 | 0.7% |
| Southern Europe | 95 | 0.3% |
| Spain | 48 | 0.2% |
| Syria | 16 | 0.1% |
| Taiwan | 84 | 0.3% |
| Thailand | 22 | 0.1% |
| Vietnam | 116 | 0.4% |
| Western Asia | 36 | 0.1% |
| Western Europe | 30 | 0.1% | View All 59 Rows |
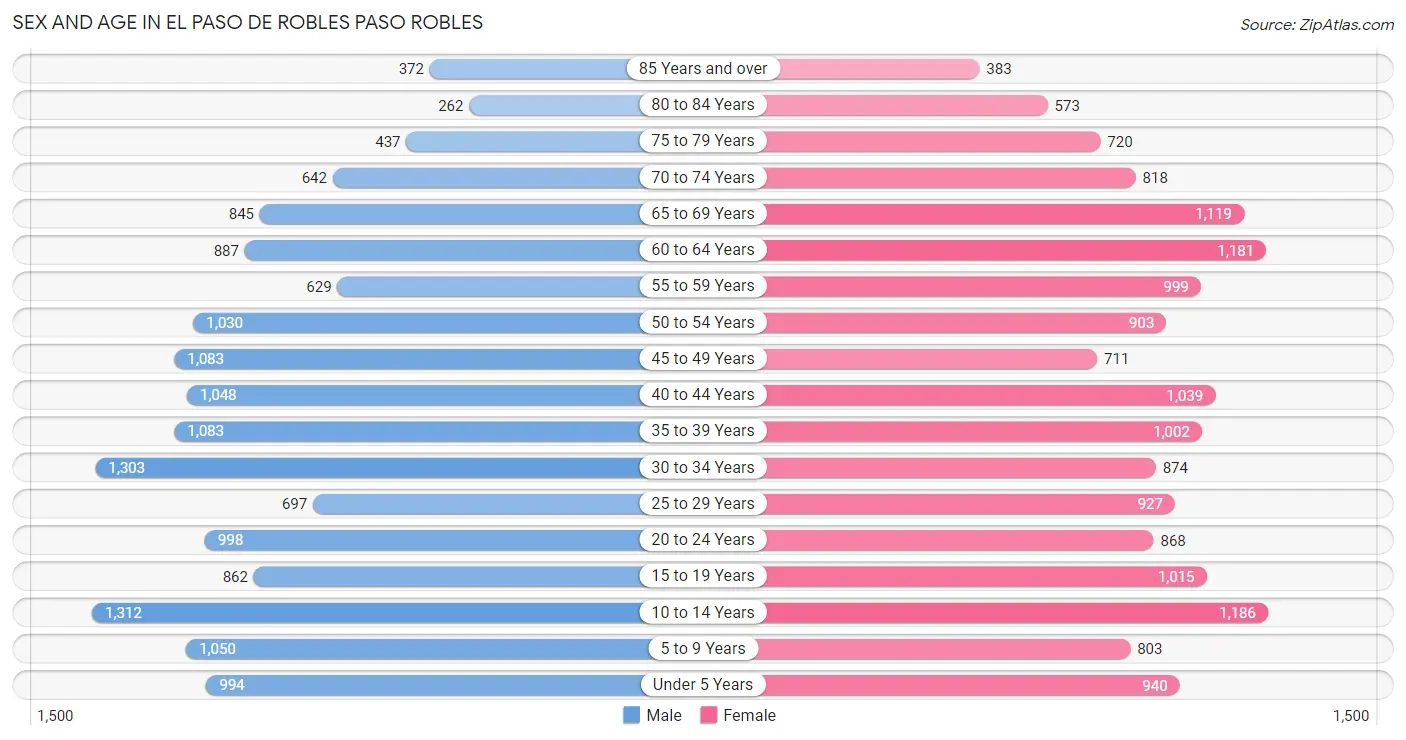
Sex and Age in El Paso de Robles Paso Robles
Sex and Age in El Paso de Robles Paso Robles
The most populous age groups in El Paso de Robles Paso Robles are 10 to 14 Years (1,312 | 8.5%) for men and 10 to 14 Years (1,186 | 7.4%) for women.
| Age Bracket | Male | Female |
| Under 5 Years | 994 (6.4%) | 940 (5.9%) |
| 5 to 9 Years | 1,050 (6.8%) | 803 (5.0%) |
| 10 to 14 Years | 1,312 (8.5%) | 1,186 (7.4%) |
| 15 to 19 Years | 862 (5.6%) | 1,015 (6.3%) |
| 20 to 24 Years | 998 (6.4%) | 868 (5.4%) |
| 25 to 29 Years | 697 (4.5%) | 927 (5.8%) |
| 30 to 34 Years | 1,303 (8.4%) | 874 (5.4%) |
| 35 to 39 Years | 1,083 (7.0%) | 1,002 (6.2%) |
| 40 to 44 Years | 1,048 (6.8%) | 1,039 (6.5%) |
| 45 to 49 Years | 1,083 (7.0%) | 711 (4.4%) |
| 50 to 54 Years | 1,030 (6.6%) | 903 (5.6%) |
| 55 to 59 Years | 629 (4.1%) | 999 (6.2%) |
| 60 to 64 Years | 887 (5.7%) | 1,181 (7.3%) |
| 65 to 69 Years | 845 (5.4%) | 1,119 (7.0%) |
| 70 to 74 Years | 642 (4.1%) | 818 (5.1%) |
| 75 to 79 Years | 437 (2.8%) | 720 (4.5%) |
| 80 to 84 Years | 262 (1.7%) | 573 (3.6%) |
| 85 Years and over | 372 (2.4%) | 383 (2.4%) |
| Total | 15,534 (100.0%) | 16,061 (100.0%) |
Families and Households in El Paso de Robles Paso Robles
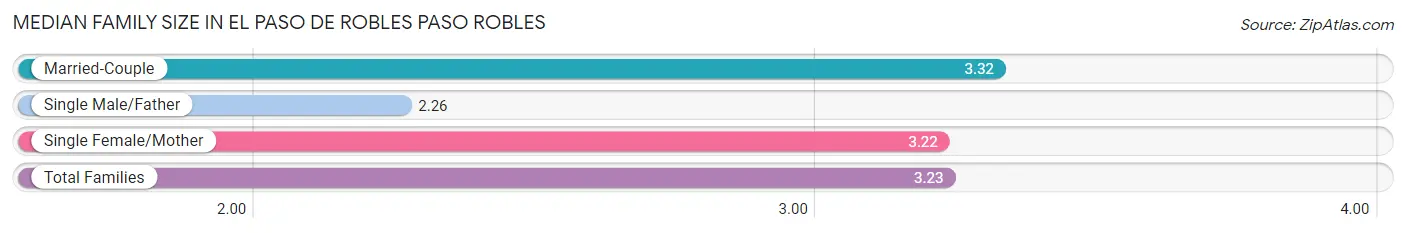
Median Family Size in El Paso de Robles Paso Robles
The median family size in El Paso de Robles Paso Robles is 3.23 persons per family, with married-couple families (5,946 | 74.7%) accounting for the largest median family size of 3.32 persons per family. On the other hand, single male/father families (549 | 6.9%) represent the smallest median family size with 2.26 persons per family.
| Family Type | # Families | Family Size |
| Married-Couple | 5,946 (74.7%) | 3.32 |
| Single Male/Father | 549 (6.9%) | 2.26 |
| Single Female/Mother | 1,464 (18.4%) | 3.22 |
| Total Families | 7,959 (100.0%) | 3.23 |
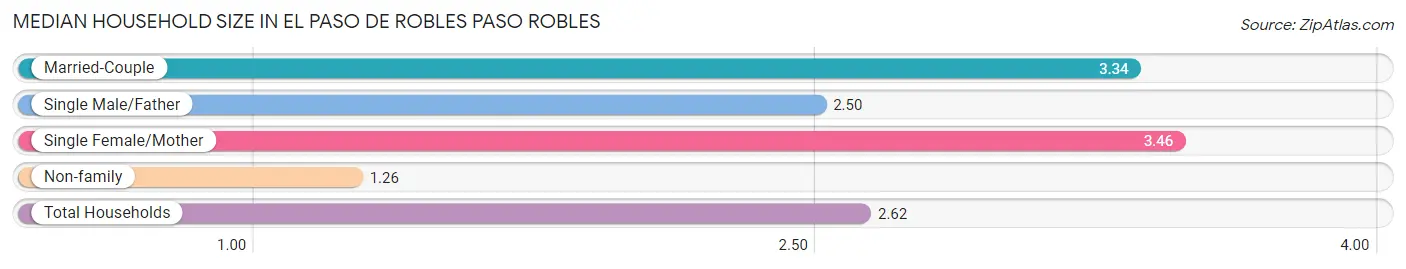
Median Household Size in El Paso de Robles Paso Robles
The median household size in El Paso de Robles Paso Robles is 2.62 persons per household, with single female/mother households (1,464 | 12.2%) accounting for the largest median household size of 3.46 persons per household. non-family households (4,046 | 33.7%) represent the smallest median household size with 1.26 persons per household.
| Household Type | # Households | Household Size |
| Married-Couple | 5,946 (49.5%) | 3.34 |
| Single Male/Father | 549 (4.6%) | 2.50 |
| Single Female/Mother | 1,464 (12.2%) | 3.46 |
| Non-family | 4,046 (33.7%) | 1.26 |
| Total Households | 12,005 (100.0%) | 2.62 |
Household Size by Marriage Status in El Paso de Robles Paso Robles
Out of a total of 12,005 households in El Paso de Robles Paso Robles, 7,959 (66.3%) are family households, while 4,046 (33.7%) are nonfamily households. The most numerous type of family households are 2-person households, comprising 3,470, and the most common type of nonfamily households are 1-person households, comprising 3,194.
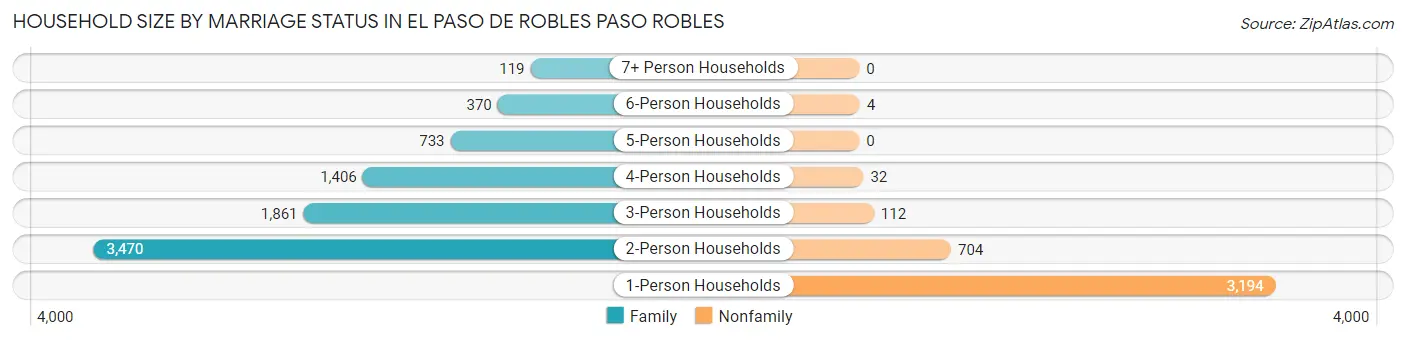
| Household Size | Family Households | Nonfamily Households |
| 1-Person Households | - | 3,194 (26.6%) |
| 2-Person Households | 3,470 (28.9%) | 704 (5.9%) |
| 3-Person Households | 1,861 (15.5%) | 112 (0.9%) |
| 4-Person Households | 1,406 (11.7%) | 32 (0.3%) |
| 5-Person Households | 733 (6.1%) | 0 (0.0%) |
| 6-Person Households | 370 (3.1%) | 4 (0.0%) |
| 7+ Person Households | 119 (1.0%) | 0 (0.0%) |
| Total | 7,959 (66.3%) | 4,046 (33.7%) |
Female Fertility in El Paso de Robles Paso Robles
Fertility by Age in El Paso de Robles Paso Robles
Average fertility rate in El Paso de Robles Paso Robles is 27.0 births per 1,000 women. Women in the age bracket of 20 to 34 years have the highest fertility rate with 48.0 births per 1,000 women. Women in the age bracket of 20 to 34 years acount for 72.3% of all women with births.
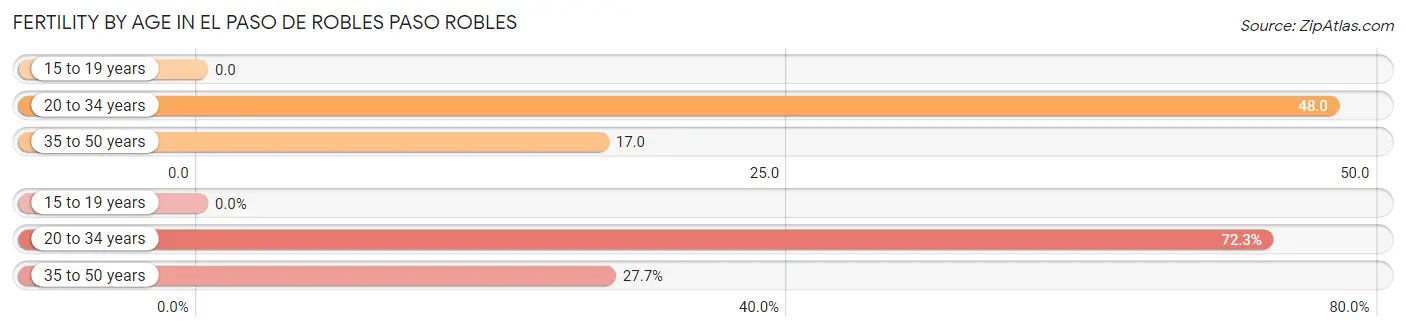
| Age Bracket | Women with Births | Births / 1,000 Women |
| 15 to 19 years | 0 (0.0%) | 0.0 |
| 20 to 34 years | 128 (72.3%) | 48.0 |
| 35 to 50 years | 49 (27.7%) | 17.0 |
| Total | 177 (100.0%) | 27.0 |
Fertility by Age by Marriage Status in El Paso de Robles Paso Robles
72.3% of women with births (177) in El Paso de Robles Paso Robles are married. The highest percentage of unmarried women with births falls into 20 to 34 years age bracket with 38.3% of them unmarried at the time of birth, while the lowest percentage of unmarried women with births belong to 35 to 50 years age bracket with 0.0% of them unmarried.
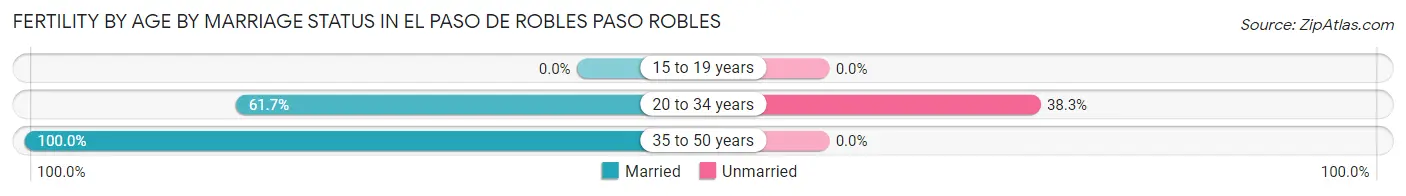
| Age Bracket | Married | Unmarried |
| 15 to 19 years | 0 (0.0%) | 0 (0.0%) |
| 20 to 34 years | 79 (61.7%) | 49 (38.3%) |
| 35 to 50 years | 49 (100.0%) | 0 (0.0%) |
| Total | 128 (72.3%) | 49 (27.7%) |
Fertility by Education in El Paso de Robles Paso Robles
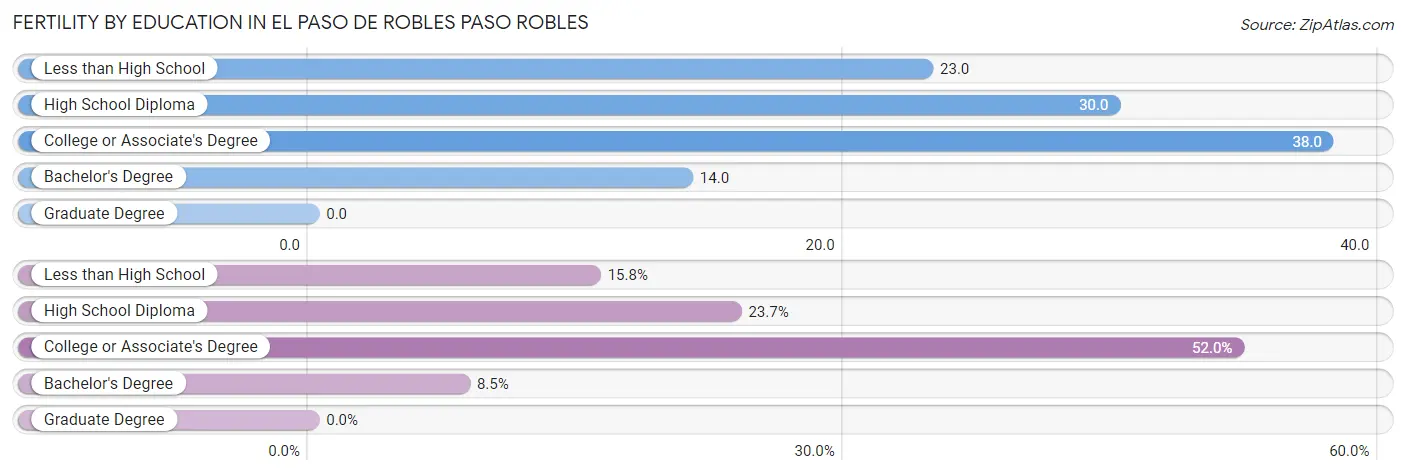
| Educational Attainment | Women with Births | Births / 1,000 Women |
| Less than High School | 28 (15.8%) | 23.0 |
| High School Diploma | 42 (23.7%) | 30.0 |
| College or Associate's Degree | 92 (52.0%) | 38.0 |
| Bachelor's Degree | 15 (8.5%) | 14.0 |
| Graduate Degree | 0 (0.0%) | 0.0 |
| Total | 177 (100.0%) | 27.0 |
Fertility by Education by Marriage Status in El Paso de Robles Paso Robles
27.7% of women with births in El Paso de Robles Paso Robles are unmarried. Women with the educational attainment of bachelor's degree are most likely to be married with 100.0% of them married at childbirth, while women with the educational attainment of high school diploma are least likely to be married with 97.6% of them unmarried at childbirth.
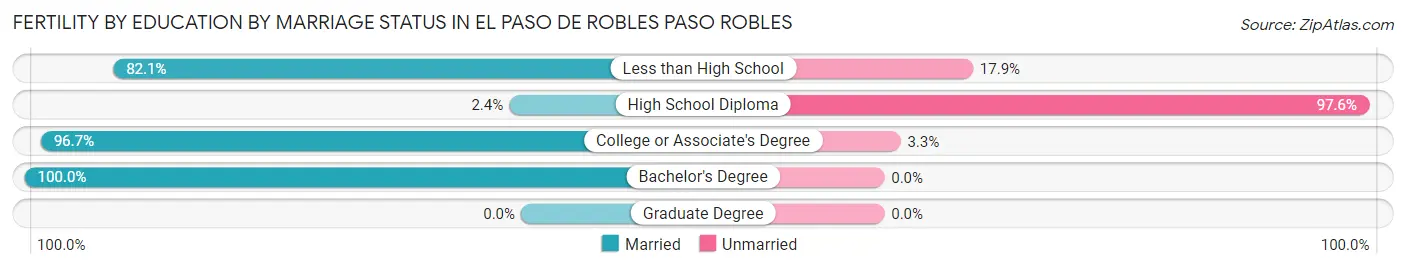
| Educational Attainment | Married | Unmarried |
| Less than High School | 23 (82.1%) | 5 (17.9%) |
| High School Diploma | 1 (2.4%) | 41 (97.6%) |
| College or Associate's Degree | 89 (96.7%) | 3 (3.3%) |
| Bachelor's Degree | 15 (100.0%) | 0 (0.0%) |
| Graduate Degree | 0 (0.0%) | 0 (0.0%) |
| Total | 128 (72.3%) | 49 (27.7%) |
Employment Characteristics in El Paso de Robles Paso Robles
Employment by Class of Employer in El Paso de Robles Paso Robles
Among the 14,426 employed individuals in El Paso de Robles Paso Robles, private company employees (9,690 | 67.2%), state government employees (1,188 | 8.2%), and local government employees (924 | 6.4%) make up the most common classes of employment.
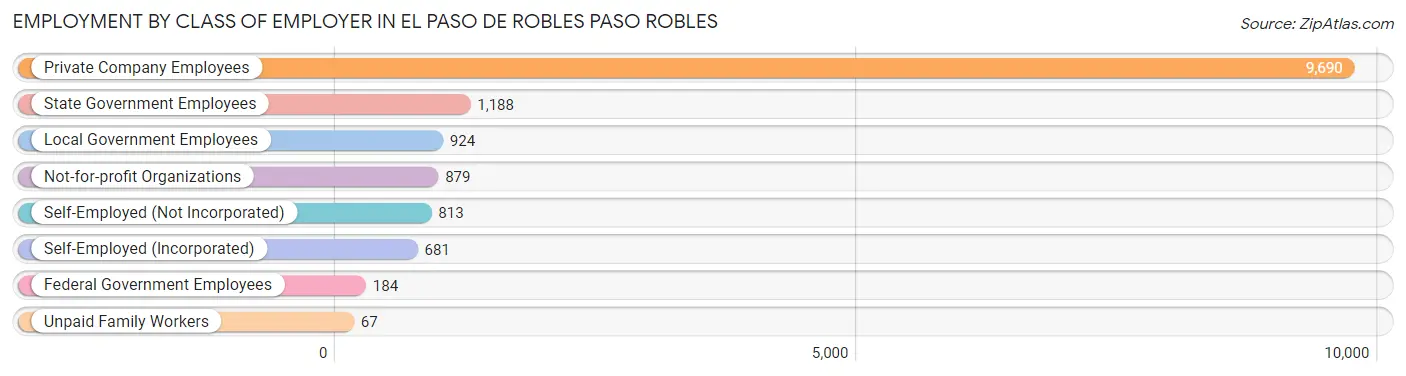
| Employer Class | # Employees | % Employees |
| Private Company Employees | 9,690 | 67.2% |
| Self-Employed (Incorporated) | 681 | 4.7% |
| Self-Employed (Not Incorporated) | 813 | 5.6% |
| Not-for-profit Organizations | 879 | 6.1% |
| Local Government Employees | 924 | 6.4% |
| State Government Employees | 1,188 | 8.2% |
| Federal Government Employees | 184 | 1.3% |
| Unpaid Family Workers | 67 | 0.5% |
| Total | 14,426 | 100.0% |
Employment Status by Age in El Paso de Robles Paso Robles
According to the labor force statistics for El Paso de Robles Paso Robles, out of the total population over 16 years of age (24,996), 61.9% or 15,473 individuals are in the labor force, with 4.8% or 743 of them unemployed. The age group with the highest labor force participation rate is 25 to 29 years, with 90.3% or 1,466 individuals in the labor force. Within the labor force, the 30 to 34 years age range has the highest percentage of unemployed individuals, with 11.4% or 178 of them being unemployed.
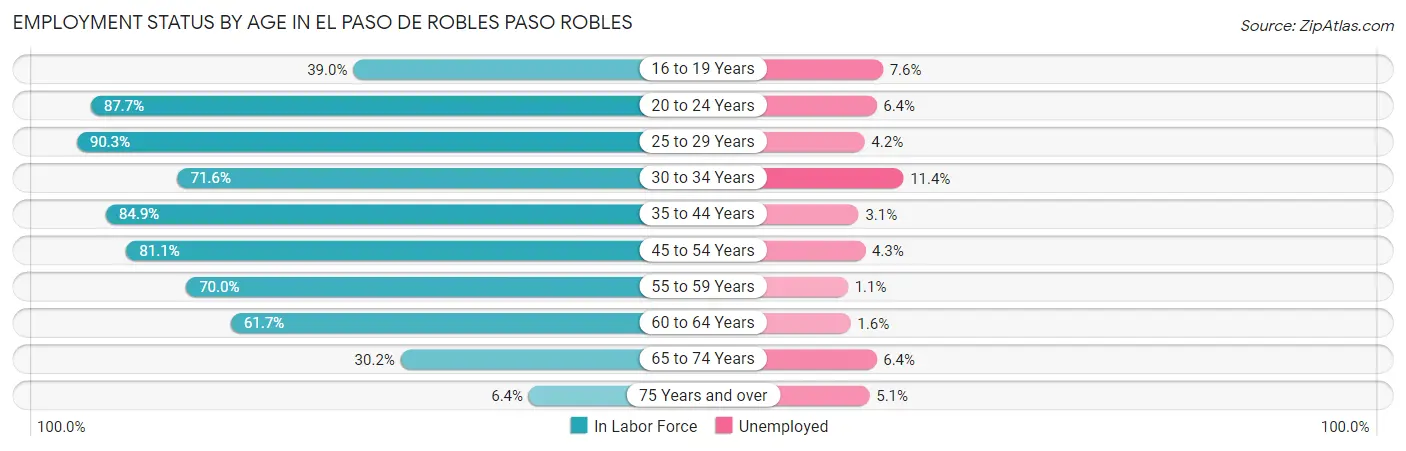
| Age Bracket | In Labor Force | Unemployed |
| 16 to 19 Years | 610 (39.0%) | 46 (7.6%) |
| 20 to 24 Years | 1,636 (87.7%) | 105 (6.4%) |
| 25 to 29 Years | 1,466 (90.3%) | 62 (4.2%) |
| 30 to 34 Years | 1,559 (71.6%) | 178 (11.4%) |
| 35 to 44 Years | 3,542 (84.9%) | 110 (3.1%) |
| 45 to 54 Years | 3,023 (81.1%) | 130 (4.3%) |
| 55 to 59 Years | 1,140 (70.0%) | 13 (1.1%) |
| 60 to 64 Years | 1,276 (61.7%) | 20 (1.6%) |
| 65 to 74 Years | 1,034 (30.2%) | 66 (6.4%) |
| 75 Years and over | 176 (6.4%) | 9 (5.1%) |
| Total | 15,473 (61.9%) | 743 (4.8%) |
Employment Status by Educational Attainment in El Paso de Robles Paso Robles
According to labor force statistics for El Paso de Robles Paso Robles, 78.0% of individuals (12,009) out of the total population between 25 and 64 years of age (15,396) are in the labor force, with 4.3% or 516 of them being unemployed. The group with the highest labor force participation rate are those with the educational attainment of bachelor's degree or higher, with 87.5% or 3,798 individuals in the labor force. Within the labor force, individuals with less than high school education have the highest percentage of unemployment, with 6.0% or 82 of them being unemployed.
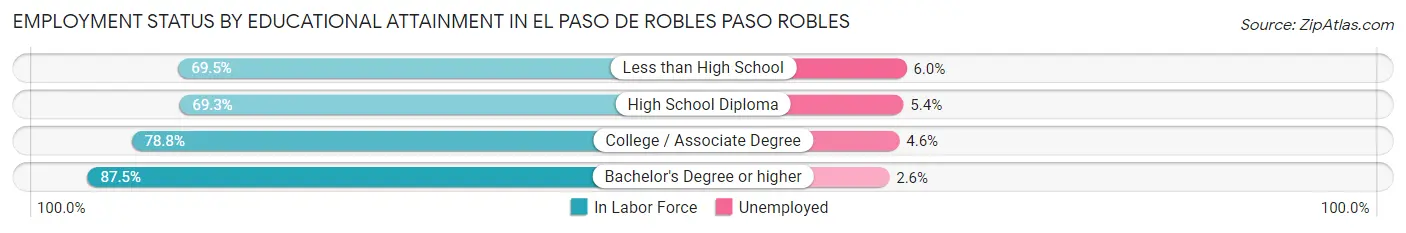
| Educational Attainment | In Labor Force | Unemployed |
| Less than High School | 1,368 (69.5%) | 118 (6.0%) |
| High School Diploma | 2,334 (69.3%) | 182 (5.4%) |
| College / Associate Degree | 4,507 (78.8%) | 263 (4.6%) |
| Bachelor's Degree or higher | 3,798 (87.5%) | 113 (2.6%) |
| Total | 12,009 (78.0%) | 662 (4.3%) |
Employment Occupations by Sex in El Paso de Robles Paso Robles
Management, Business, Science and Arts Occupations
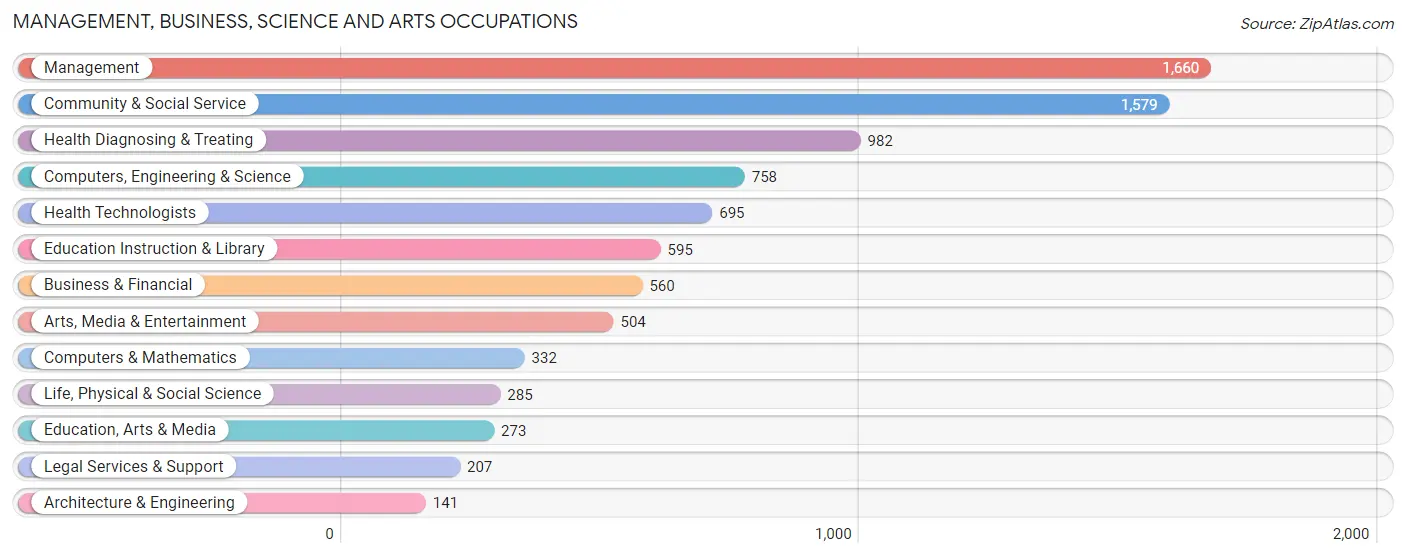
The most common Management, Business, Science and Arts occupations in El Paso de Robles Paso Robles are Management (1,660 | 11.3%), Community & Social Service (1,579 | 10.7%), Health Diagnosing & Treating (982 | 6.7%), Computers, Engineering & Science (758 | 5.1%), and Health Technologists (695 | 4.7%).
Management, Business, Science and Arts Occupations by Sex
Within the Management, Business, Science and Arts occupations in El Paso de Robles Paso Robles, the most male-oriented occupations are Architecture & Engineering (100.0%), Computers & Mathematics (97.3%), and Computers, Engineering & Science (87.3%), while the most female-oriented occupations are Health Technologists (86.8%), Health Diagnosing & Treating (81.9%), and Education, Arts & Media (75.5%).
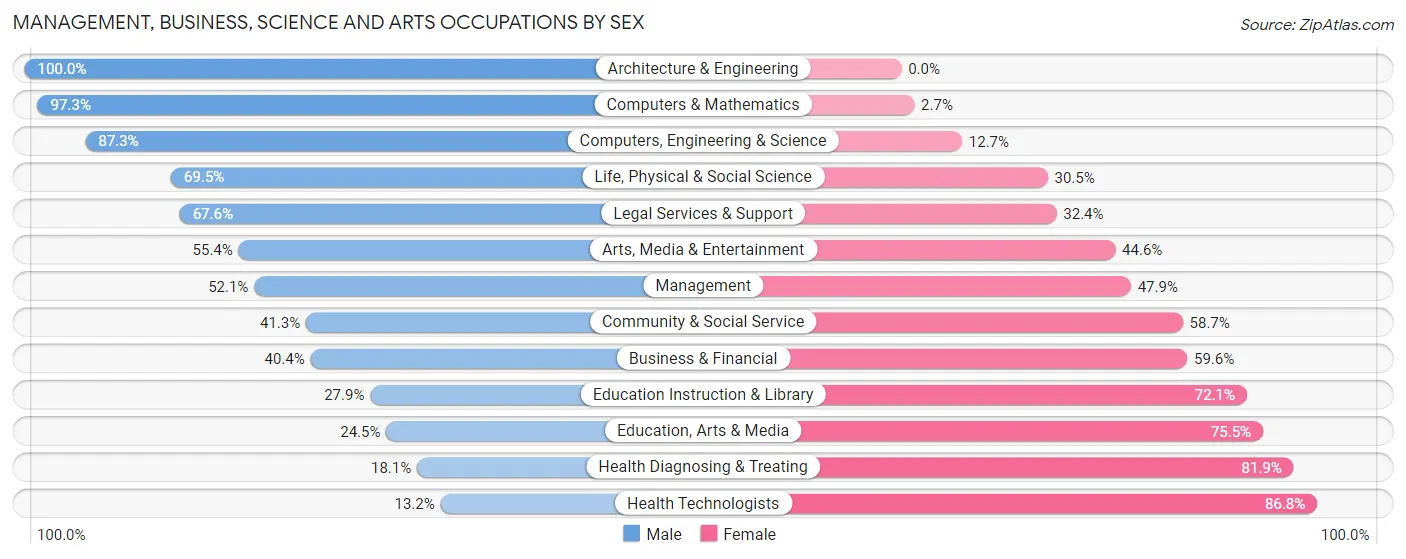
| Occupation | Male | Female |
| Management | 865 (52.1%) | 795 (47.9%) |
| Business & Financial | 226 (40.4%) | 334 (59.6%) |
| Computers, Engineering & Science | 662 (87.3%) | 96 (12.7%) |
| Computers & Mathematics | 323 (97.3%) | 9 (2.7%) |
| Architecture & Engineering | 141 (100.0%) | 0 (0.0%) |
| Life, Physical & Social Science | 198 (69.5%) | 87 (30.5%) |
| Community & Social Service | 652 (41.3%) | 927 (58.7%) |
| Education, Arts & Media | 67 (24.5%) | 206 (75.5%) |
| Legal Services & Support | 140 (67.6%) | 67 (32.4%) |
| Education Instruction & Library | 166 (27.9%) | 429 (72.1%) |
| Arts, Media & Entertainment | 279 (55.4%) | 225 (44.6%) |
| Health Diagnosing & Treating | 178 (18.1%) | 804 (81.9%) |
| Health Technologists | 92 (13.2%) | 603 (86.8%) |
| Total (Category) | 2,583 (46.6%) | 2,956 (53.4%) |
| Total (Overall) | 7,465 (50.7%) | 7,258 (49.3%) |
Services Occupations
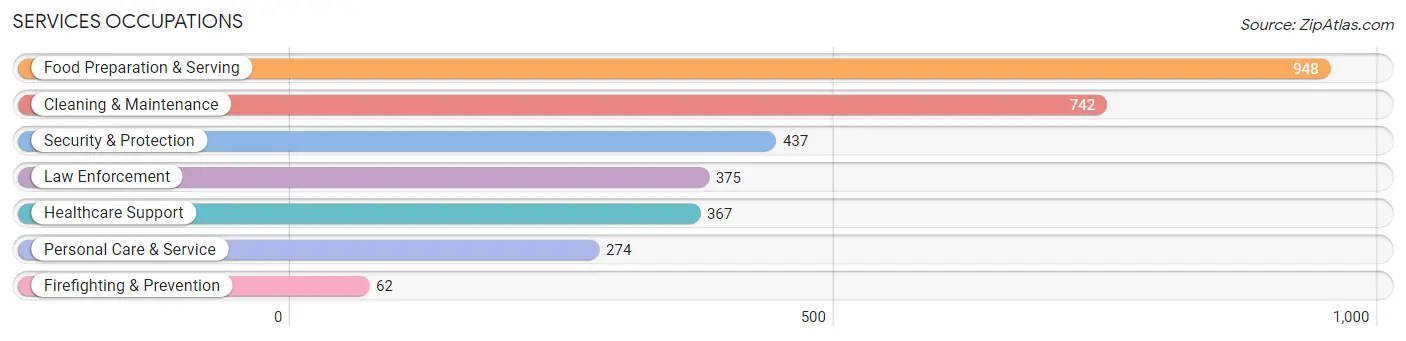
The most common Services occupations in El Paso de Robles Paso Robles are Food Preparation & Serving (948 | 6.4%), Cleaning & Maintenance (742 | 5.0%), Security & Protection (437 | 3.0%), Law Enforcement (375 | 2.5%), and Healthcare Support (367 | 2.5%).
Services Occupations by Sex
Within the Services occupations in El Paso de Robles Paso Robles, the most male-oriented occupations are Law Enforcement (77.1%), Security & Protection (71.9%), and Cleaning & Maintenance (64.1%), while the most female-oriented occupations are Healthcare Support (97.0%), Food Preparation & Serving (78.9%), and Personal Care & Service (69.0%).
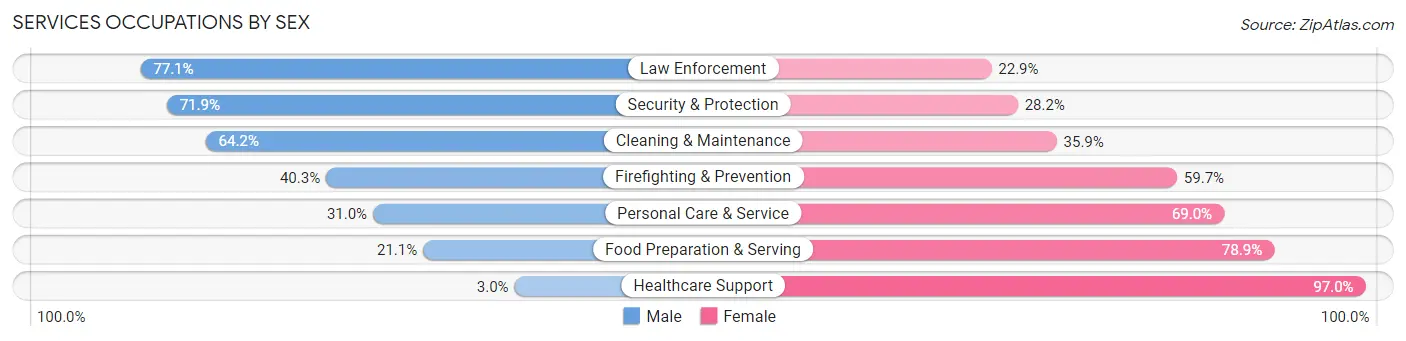
| Occupation | Male | Female |
| Healthcare Support | 11 (3.0%) | 356 (97.0%) |
| Security & Protection | 314 (71.9%) | 123 (28.1%) |
| Firefighting & Prevention | 25 (40.3%) | 37 (59.7%) |
| Law Enforcement | 289 (77.1%) | 86 (22.9%) |
| Food Preparation & Serving | 200 (21.1%) | 748 (78.9%) |
| Cleaning & Maintenance | 476 (64.1%) | 266 (35.8%) |
| Personal Care & Service | 85 (31.0%) | 189 (69.0%) |
| Total (Category) | 1,086 (39.2%) | 1,682 (60.8%) |
| Total (Overall) | 7,465 (50.7%) | 7,258 (49.3%) |
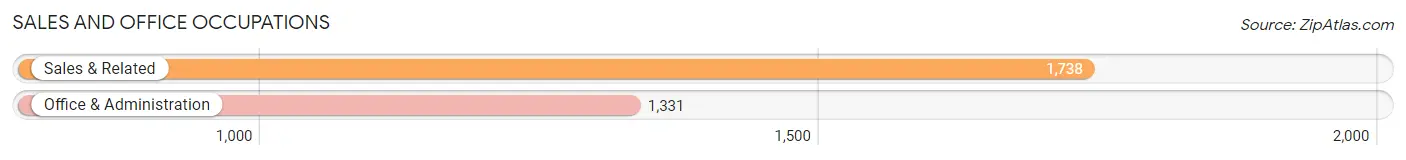
Sales and Office Occupations
The most common Sales and Office occupations in El Paso de Robles Paso Robles are Sales & Related (1,738 | 11.8%), and Office & Administration (1,331 | 9.0%).
Sales and Office Occupations by Sex
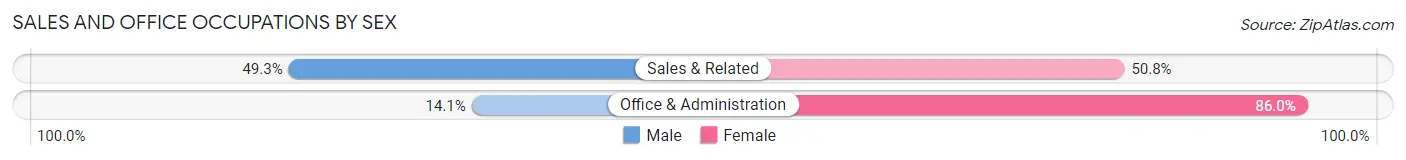
| Occupation | Male | Female |
| Sales & Related | 856 (49.2%) | 882 (50.7%) |
| Office & Administration | 187 (14.1%) | 1,144 (86.0%) |
| Total (Category) | 1,043 (34.0%) | 2,026 (66.0%) |
| Total (Overall) | 7,465 (50.7%) | 7,258 (49.3%) |
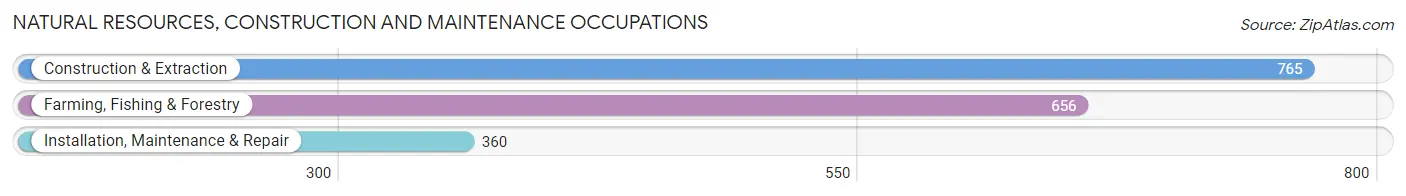
Natural Resources, Construction and Maintenance Occupations
The most common Natural Resources, Construction and Maintenance occupations in El Paso de Robles Paso Robles are Construction & Extraction (765 | 5.2%), Farming, Fishing & Forestry (656 | 4.5%), and Installation, Maintenance & Repair (360 | 2.5%).
Natural Resources, Construction and Maintenance Occupations by Sex
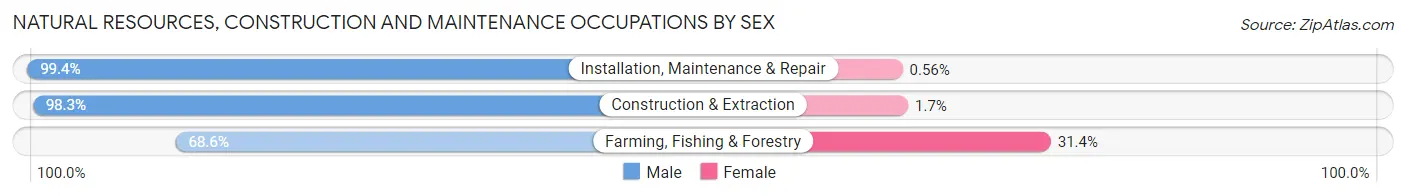
| Occupation | Male | Female |
| Farming, Fishing & Forestry | 450 (68.6%) | 206 (31.4%) |
| Construction & Extraction | 752 (98.3%) | 13 (1.7%) |
| Installation, Maintenance & Repair | 358 (99.4%) | 2 (0.6%) |
| Total (Category) | 1,560 (87.6%) | 221 (12.4%) |
| Total (Overall) | 7,465 (50.7%) | 7,258 (49.3%) |
Production, Transportation and Moving Occupations
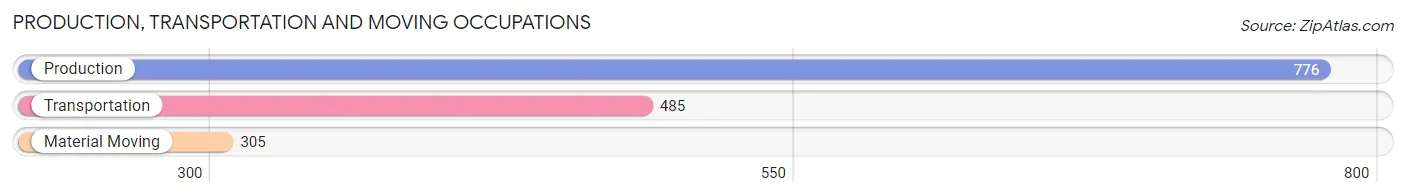
The most common Production, Transportation and Moving occupations in El Paso de Robles Paso Robles are Production (776 | 5.3%), Transportation (485 | 3.3%), and Material Moving (305 | 2.1%).
Production, Transportation and Moving Occupations by Sex
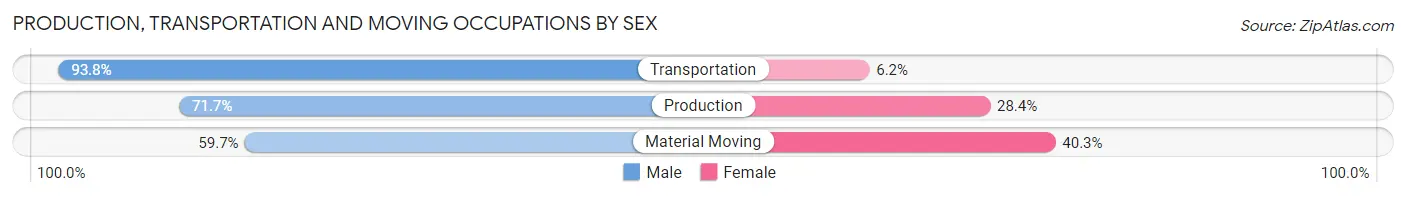
| Occupation | Male | Female |
| Production | 556 (71.7%) | 220 (28.3%) |
| Transportation | 455 (93.8%) | 30 (6.2%) |
| Material Moving | 182 (59.7%) | 123 (40.3%) |
| Total (Category) | 1,193 (76.2%) | 373 (23.8%) |
| Total (Overall) | 7,465 (50.7%) | 7,258 (49.3%) |
Employment Industries by Sex in El Paso de Robles Paso Robles
Employment Industries in El Paso de Robles Paso Robles
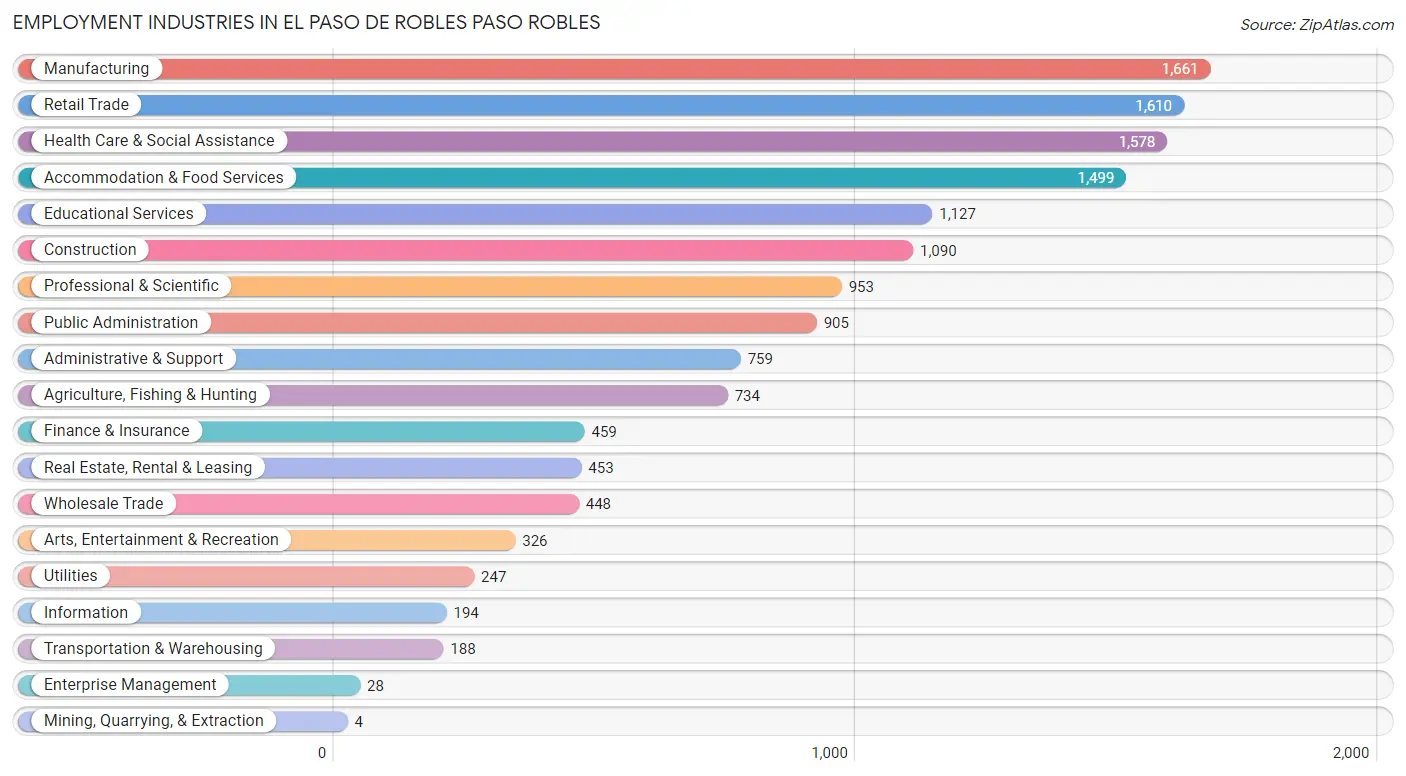
The major employment industries in El Paso de Robles Paso Robles include Manufacturing (1,661 | 11.3%), Retail Trade (1,610 | 10.9%), Health Care & Social Assistance (1,578 | 10.7%), Accommodation & Food Services (1,499 | 10.2%), and Educational Services (1,127 | 7.6%).
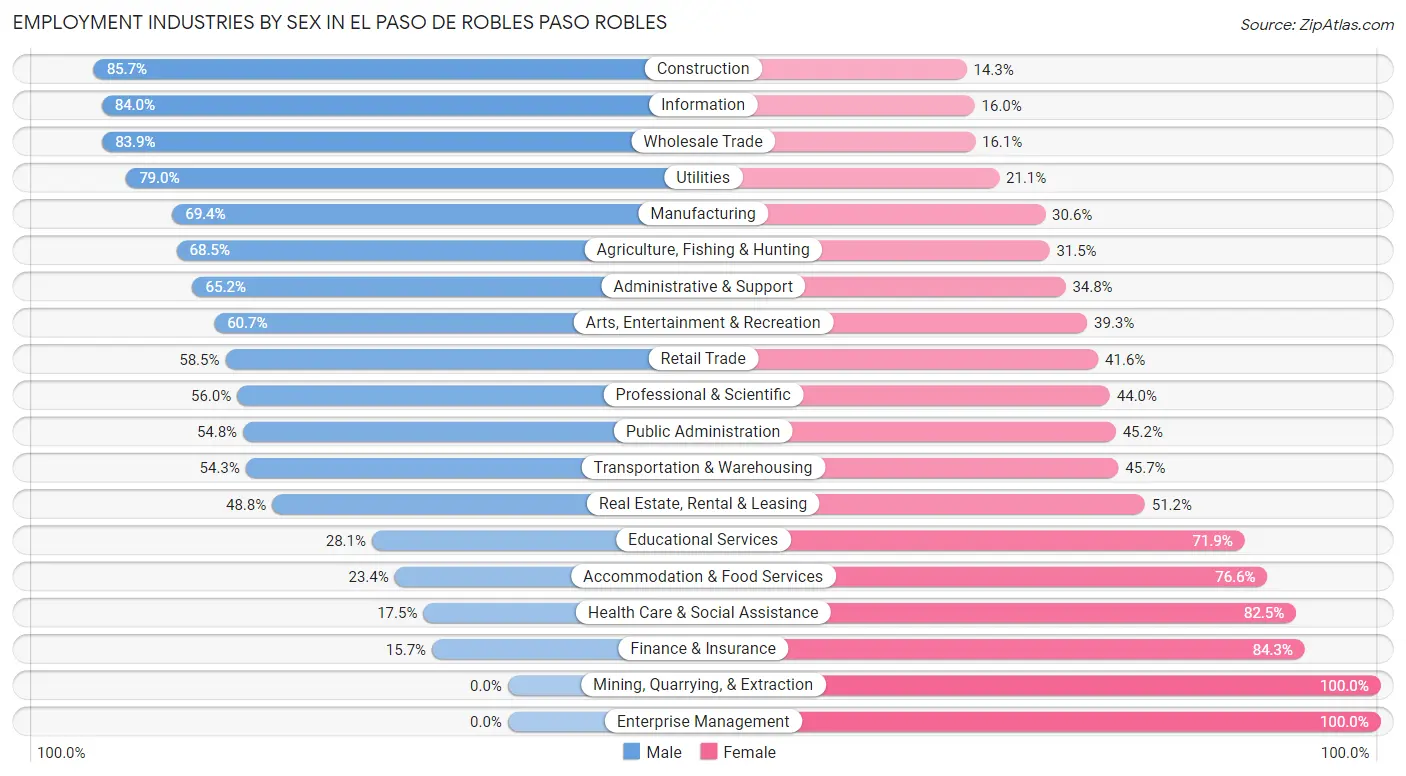
Employment Industries by Sex in El Paso de Robles Paso Robles
The El Paso de Robles Paso Robles industries that see more men than women are Construction (85.7%), Information (84.0%), and Wholesale Trade (83.9%), whereas the industries that tend to have a higher number of women are Mining, Quarrying, & Extraction (100.0%), Enterprise Management (100.0%), and Finance & Insurance (84.3%).
| Industry | Male | Female |
| Agriculture, Fishing & Hunting | 503 (68.5%) | 231 (31.5%) |
| Mining, Quarrying, & Extraction | 0 (0.0%) | 4 (100.0%) |
| Construction | 934 (85.7%) | 156 (14.3%) |
| Manufacturing | 1,153 (69.4%) | 508 (30.6%) |
| Wholesale Trade | 376 (83.9%) | 72 (16.1%) |
| Retail Trade | 941 (58.5%) | 669 (41.5%) |
| Transportation & Warehousing | 102 (54.3%) | 86 (45.7%) |
| Utilities | 195 (78.9%) | 52 (21.0%) |
| Information | 163 (84.0%) | 31 (16.0%) |
| Finance & Insurance | 72 (15.7%) | 387 (84.3%) |
| Real Estate, Rental & Leasing | 221 (48.8%) | 232 (51.2%) |
| Professional & Scientific | 534 (56.0%) | 419 (44.0%) |
| Enterprise Management | 0 (0.0%) | 28 (100.0%) |
| Administrative & Support | 495 (65.2%) | 264 (34.8%) |
| Educational Services | 317 (28.1%) | 810 (71.9%) |
| Health Care & Social Assistance | 276 (17.5%) | 1,302 (82.5%) |
| Arts, Entertainment & Recreation | 198 (60.7%) | 128 (39.3%) |
| Accommodation & Food Services | 351 (23.4%) | 1,148 (76.6%) |
| Public Administration | 496 (54.8%) | 409 (45.2%) |
| Total | 7,465 (50.7%) | 7,258 (49.3%) |
Education in El Paso de Robles Paso Robles
School Enrollment in El Paso de Robles Paso Robles
The most common levels of schooling among the 7,617 students in El Paso de Robles Paso Robles are high school (1,822 | 23.9%), middle school (1,756 | 23.1%), and elementary school (1,571 | 20.6%).
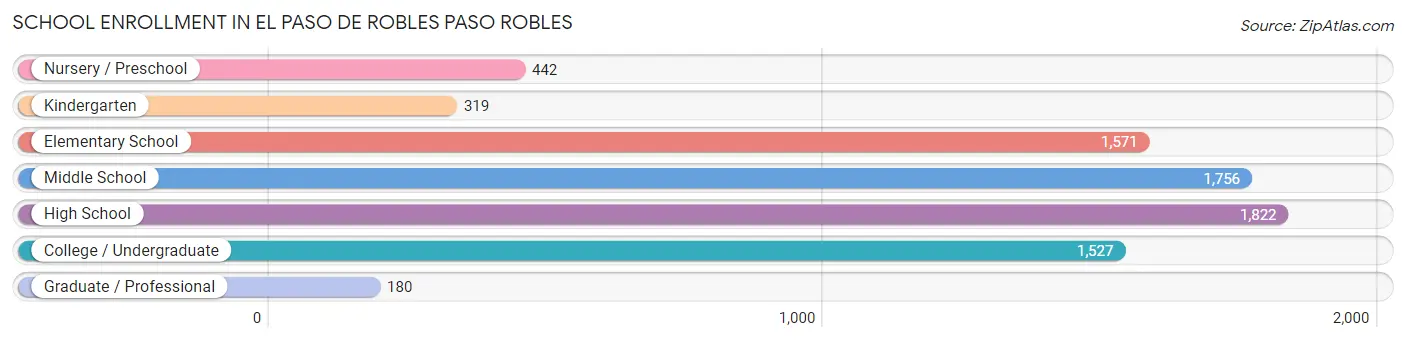
| School Level | # Students | % Students |
| Nursery / Preschool | 442 | 5.8% |
| Kindergarten | 319 | 4.2% |
| Elementary School | 1,571 | 20.6% |
| Middle School | 1,756 | 23.1% |
| High School | 1,822 | 23.9% |
| College / Undergraduate | 1,527 | 20.1% |
| Graduate / Professional | 180 | 2.4% |
| Total | 7,617 | 100.0% |
School Enrollment by Age by Funding Source in El Paso de Robles Paso Robles
Out of a total of 7,617 students who are enrolled in schools in El Paso de Robles Paso Robles, 442 (5.8%) attend a private institution, while the remaining 7,175 (94.2%) are enrolled in public schools. The age group of 3 to 4 year olds has the highest likelihood of being enrolled in private schools, with 56 (21.0% in the age bracket) enrolled. Conversely, the age group of 18 to 19 year olds has the lowest likelihood of being enrolled in a private school, with 479 (100.0% in the age bracket) attending a public institution.
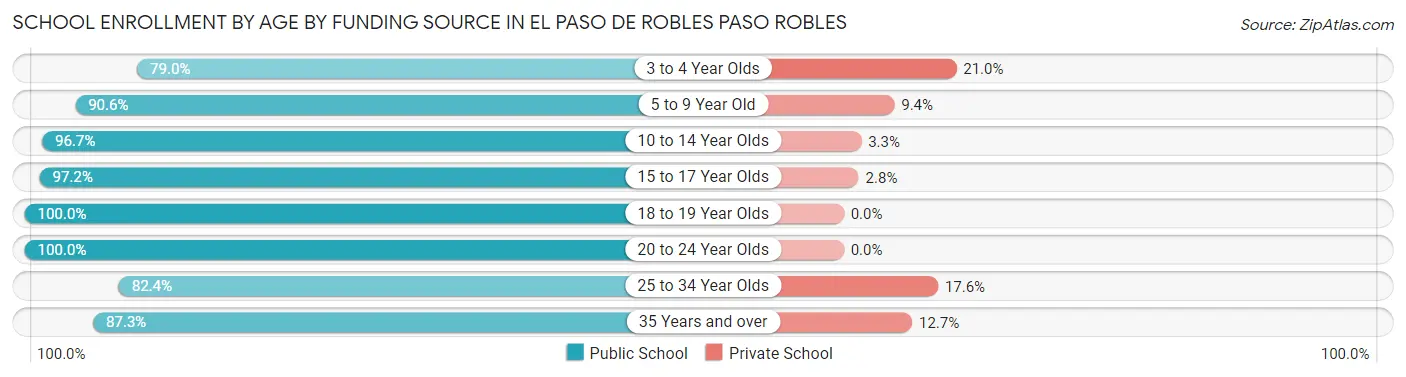
| Age Bracket | Public School | Private School |
| 3 to 4 Year Olds | 211 (79.0%) | 56 (21.0%) |
| 5 to 9 Year Old | 1,614 (90.6%) | 168 (9.4%) |
| 10 to 14 Year Olds | 2,402 (96.7%) | 81 (3.3%) |
| 15 to 17 Year Olds | 1,186 (97.2%) | 34 (2.8%) |
| 18 to 19 Year Olds | 479 (100.0%) | 0 (0.0%) |
| 20 to 24 Year Olds | 681 (100.0%) | 0 (0.0%) |
| 25 to 34 Year Olds | 277 (82.4%) | 59 (17.6%) |
| 35 Years and over | 322 (87.3%) | 47 (12.7%) |
| Total | 7,175 (94.2%) | 442 (5.8%) |
Educational Attainment by Field of Study in El Paso de Robles Paso Robles
Business (936 | 14.2%), engineering (677 | 10.3%), bio, nature & agricultural (609 | 9.3%), liberal arts & history (600 | 9.1%), and science & technology (575 | 8.7%) are the most common fields of study among 6,580 individuals in El Paso de Robles Paso Robles who have obtained a bachelor's degree or higher.
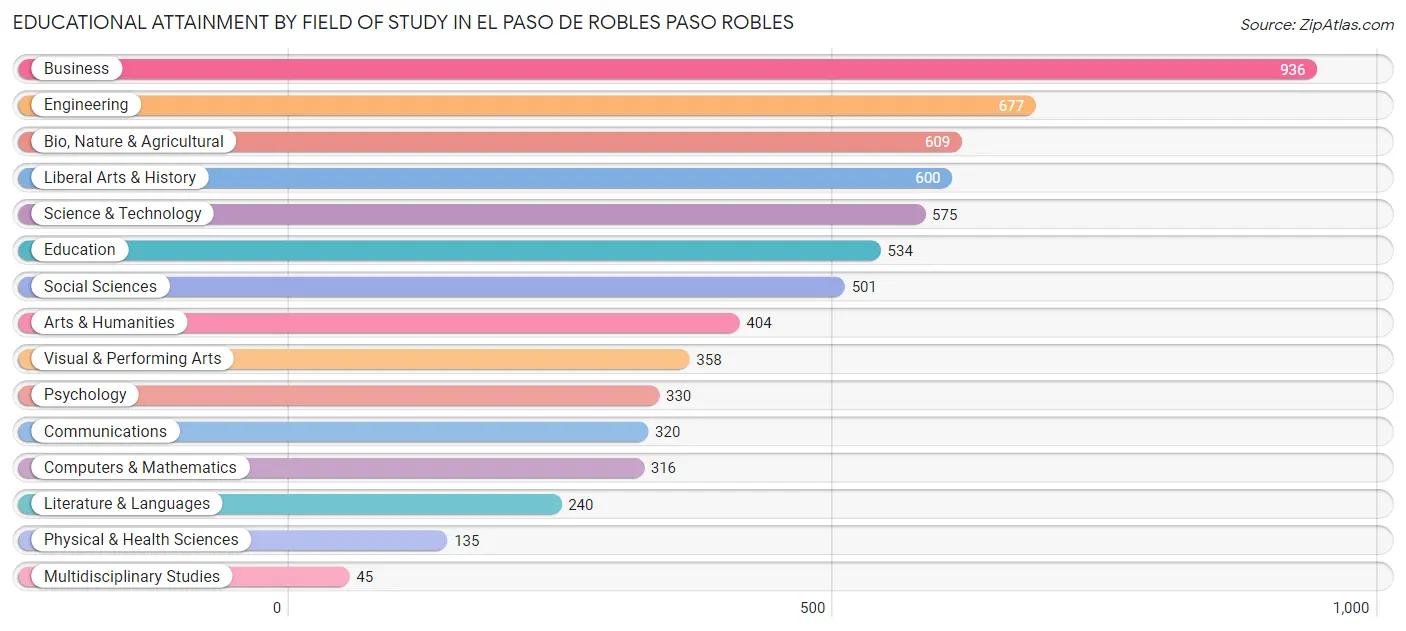
| Field of Study | # Graduates | % Graduates |
| Computers & Mathematics | 316 | 4.8% |
| Bio, Nature & Agricultural | 609 | 9.3% |
| Physical & Health Sciences | 135 | 2.1% |
| Psychology | 330 | 5.0% |
| Social Sciences | 501 | 7.6% |
| Engineering | 677 | 10.3% |
| Multidisciplinary Studies | 45 | 0.7% |
| Science & Technology | 575 | 8.7% |
| Business | 936 | 14.2% |
| Education | 534 | 8.1% |
| Literature & Languages | 240 | 3.6% |
| Liberal Arts & History | 600 | 9.1% |
| Visual & Performing Arts | 358 | 5.4% |
| Communications | 320 | 4.9% |
| Arts & Humanities | 404 | 6.1% |
| Total | 6,580 | 100.0% |
Transportation & Commute in El Paso de Robles Paso Robles
Vehicle Availability by Sex in El Paso de Robles Paso Robles
The most prevalent vehicle ownership categories in El Paso de Robles Paso Robles are males with 2 vehicles (2,865, accounting for 39.3%) and females with 2 vehicles (2,484, making up 40.3%).
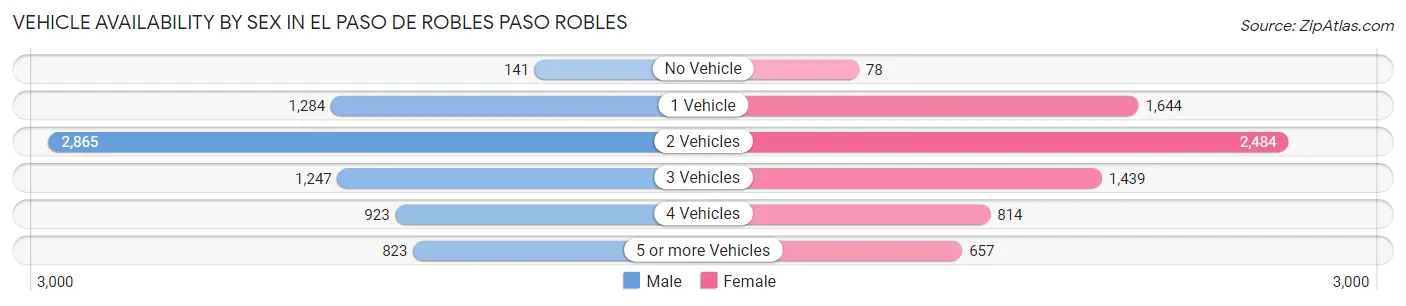
| Vehicles Available | Male | Female |
| No Vehicle | 141 (1.9%) | 78 (1.1%) |
| 1 Vehicle | 1,284 (17.6%) | 1,644 (23.1%) |
| 2 Vehicles | 2,865 (39.3%) | 2,484 (34.9%) |
| 3 Vehicles | 1,247 (17.1%) | 1,439 (20.2%) |
| 4 Vehicles | 923 (12.7%) | 814 (11.4%) |
| 5 or more Vehicles | 823 (11.3%) | 657 (9.2%) |
| Total | 7,283 (100.0%) | 7,116 (100.0%) |
Commute Time in El Paso de Robles Paso Robles
The most frequently occuring commute durations in El Paso de Robles Paso Robles are 10 to 14 minutes (2,762 commuters, 21.0%), 5 to 9 minutes (2,216 commuters, 16.8%), and 30 to 34 minutes (1,630 commuters, 12.4%).
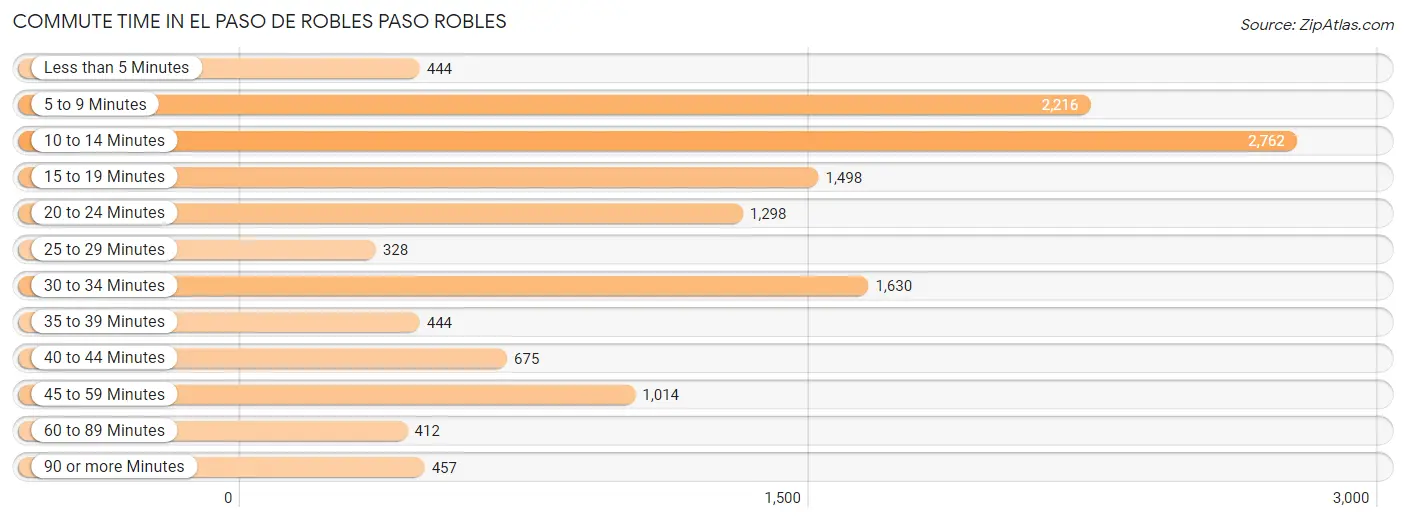
| Commute Time | # Commuters | % Commuters |
| Less than 5 Minutes | 444 | 3.4% |
| 5 to 9 Minutes | 2,216 | 16.8% |
| 10 to 14 Minutes | 2,762 | 21.0% |
| 15 to 19 Minutes | 1,498 | 11.4% |
| 20 to 24 Minutes | 1,298 | 9.9% |
| 25 to 29 Minutes | 328 | 2.5% |
| 30 to 34 Minutes | 1,630 | 12.4% |
| 35 to 39 Minutes | 444 | 3.4% |
| 40 to 44 Minutes | 675 | 5.1% |
| 45 to 59 Minutes | 1,014 | 7.7% |
| 60 to 89 Minutes | 412 | 3.1% |
| 90 or more Minutes | 457 | 3.5% |
Commute Time by Sex in El Paso de Robles Paso Robles
The most common commute times in El Paso de Robles Paso Robles are 10 to 14 minutes (1,665 commuters, 25.3%) for males and 5 to 9 minutes (1,599 commuters, 24.3%) for females.
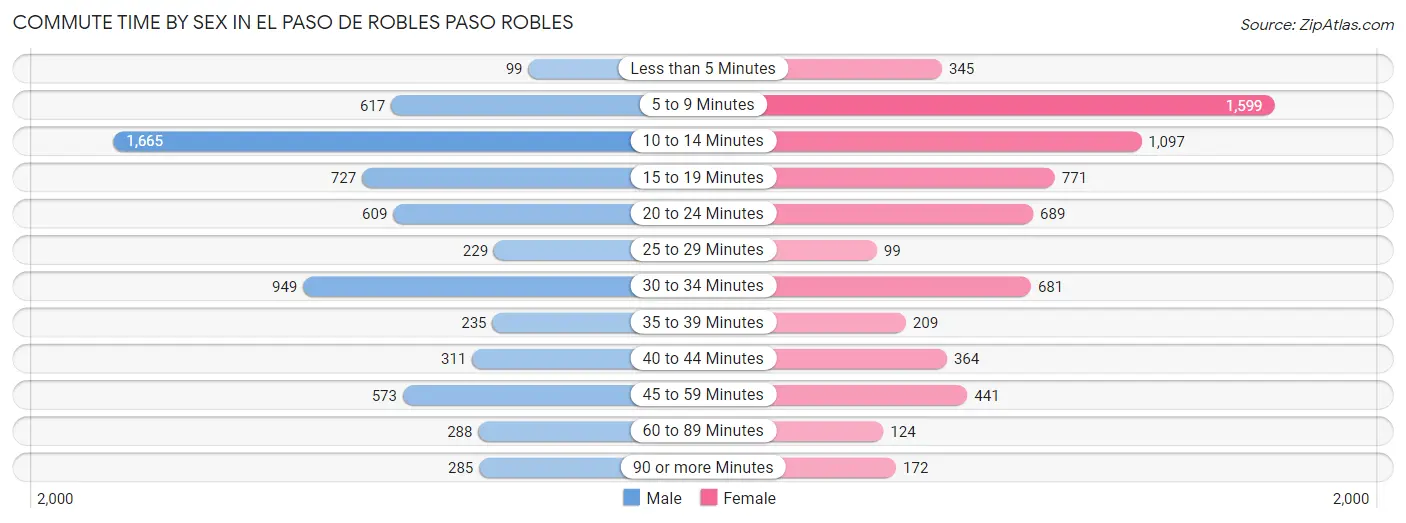
| Commute Time | Male | Female |
| Less than 5 Minutes | 99 (1.5%) | 345 (5.2%) |
| 5 to 9 Minutes | 617 (9.4%) | 1,599 (24.3%) |
| 10 to 14 Minutes | 1,665 (25.3%) | 1,097 (16.6%) |
| 15 to 19 Minutes | 727 (11.0%) | 771 (11.7%) |
| 20 to 24 Minutes | 609 (9.2%) | 689 (10.4%) |
| 25 to 29 Minutes | 229 (3.5%) | 99 (1.5%) |
| 30 to 34 Minutes | 949 (14.4%) | 681 (10.3%) |
| 35 to 39 Minutes | 235 (3.6%) | 209 (3.2%) |
| 40 to 44 Minutes | 311 (4.7%) | 364 (5.5%) |
| 45 to 59 Minutes | 573 (8.7%) | 441 (6.7%) |
| 60 to 89 Minutes | 288 (4.4%) | 124 (1.9%) |
| 90 or more Minutes | 285 (4.3%) | 172 (2.6%) |
Time of Departure to Work by Sex in El Paso de Robles Paso Robles
The most frequent times of departure to work in El Paso de Robles Paso Robles are 7:00 AM to 7:29 AM (1,240, 18.8%) for males and 7:00 AM to 7:29 AM (879, 13.3%) for females.
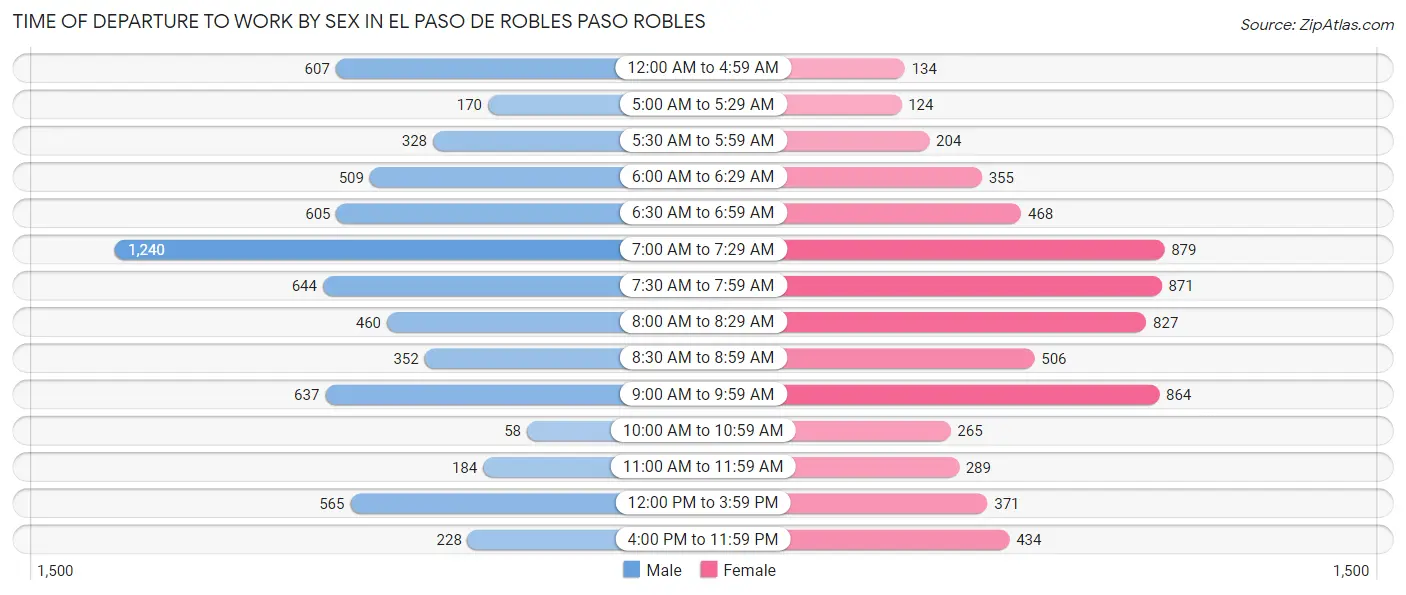
| Time of Departure | Male | Female |
| 12:00 AM to 4:59 AM | 607 (9.2%) | 134 (2.0%) |
| 5:00 AM to 5:29 AM | 170 (2.6%) | 124 (1.9%) |
| 5:30 AM to 5:59 AM | 328 (5.0%) | 204 (3.1%) |
| 6:00 AM to 6:29 AM | 509 (7.7%) | 355 (5.4%) |
| 6:30 AM to 6:59 AM | 605 (9.2%) | 468 (7.1%) |
| 7:00 AM to 7:29 AM | 1,240 (18.8%) | 879 (13.3%) |
| 7:30 AM to 7:59 AM | 644 (9.8%) | 871 (13.2%) |
| 8:00 AM to 8:29 AM | 460 (7.0%) | 827 (12.6%) |
| 8:30 AM to 8:59 AM | 352 (5.3%) | 506 (7.7%) |
| 9:00 AM to 9:59 AM | 637 (9.7%) | 864 (13.1%) |
| 10:00 AM to 10:59 AM | 58 (0.9%) | 265 (4.0%) |
| 11:00 AM to 11:59 AM | 184 (2.8%) | 289 (4.4%) |
| 12:00 PM to 3:59 PM | 565 (8.6%) | 371 (5.6%) |
| 4:00 PM to 11:59 PM | 228 (3.5%) | 434 (6.6%) |
| Total | 6,587 (100.0%) | 6,591 (100.0%) |
Housing Occupancy in El Paso de Robles Paso Robles
Occupancy by Ownership in El Paso de Robles Paso Robles
Of the total 12,005 dwellings in El Paso de Robles Paso Robles, owner-occupied units account for 7,342 (61.2%), while renter-occupied units make up 4,663 (38.8%).
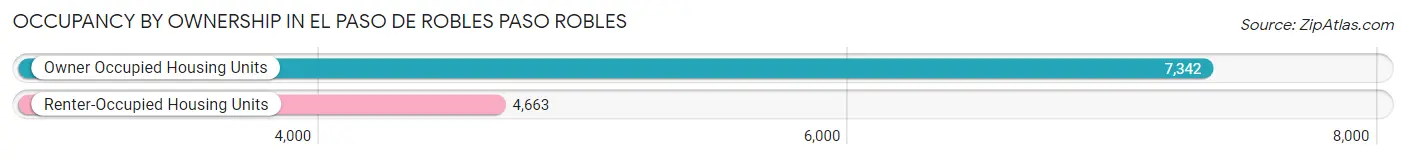
| Occupancy | # Housing Units | % Housing Units |
| Owner Occupied Housing Units | 7,342 | 61.2% |
| Renter-Occupied Housing Units | 4,663 | 38.8% |
| Total Occupied Housing Units | 12,005 | 100.0% |
Occupancy by Household Size in El Paso de Robles Paso Robles
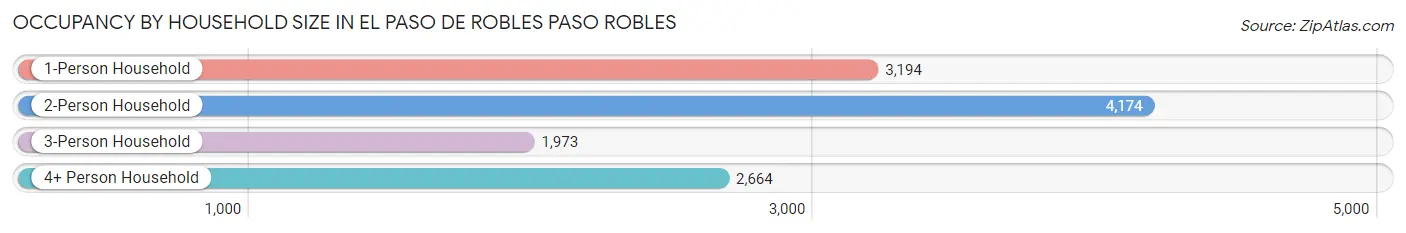
| Household Size | # Housing Units | % Housing Units |
| 1-Person Household | 3,194 | 26.6% |
| 2-Person Household | 4,174 | 34.8% |
| 3-Person Household | 1,973 | 16.4% |
| 4+ Person Household | 2,664 | 22.2% |
| Total Housing Units | 12,005 | 100.0% |
Occupancy by Ownership by Household Size in El Paso de Robles Paso Robles
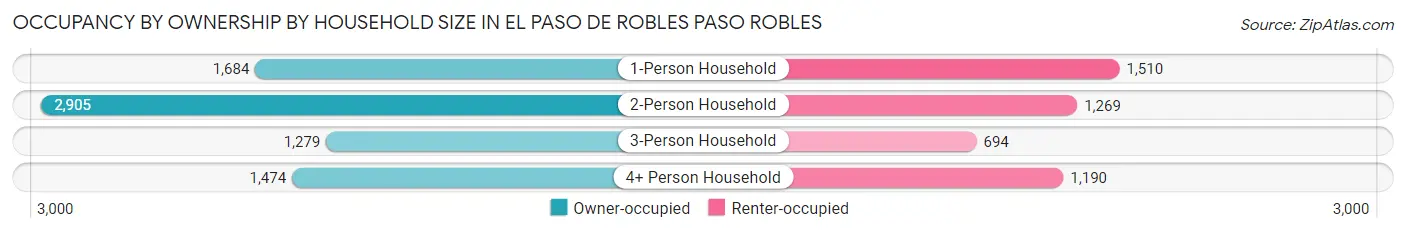
| Household Size | Owner-occupied | Renter-occupied |
| 1-Person Household | 1,684 (52.7%) | 1,510 (47.3%) |
| 2-Person Household | 2,905 (69.6%) | 1,269 (30.4%) |
| 3-Person Household | 1,279 (64.8%) | 694 (35.2%) |
| 4+ Person Household | 1,474 (55.3%) | 1,190 (44.7%) |
| Total Housing Units | 7,342 (61.2%) | 4,663 (38.8%) |
Occupancy by Educational Attainment in El Paso de Robles Paso Robles
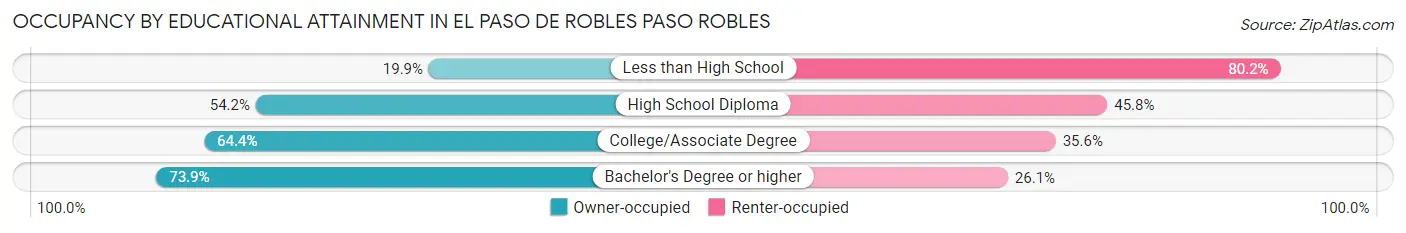
| Household Size | Owner-occupied | Renter-occupied |
| Less than High School | 240 (19.9%) | 969 (80.1%) |
| High School Diploma | 1,065 (54.2%) | 901 (45.8%) |
| College/Associate Degree | 3,307 (64.4%) | 1,828 (35.6%) |
| Bachelor's Degree or higher | 2,730 (73.9%) | 965 (26.1%) |
Occupancy by Age of Householder in El Paso de Robles Paso Robles
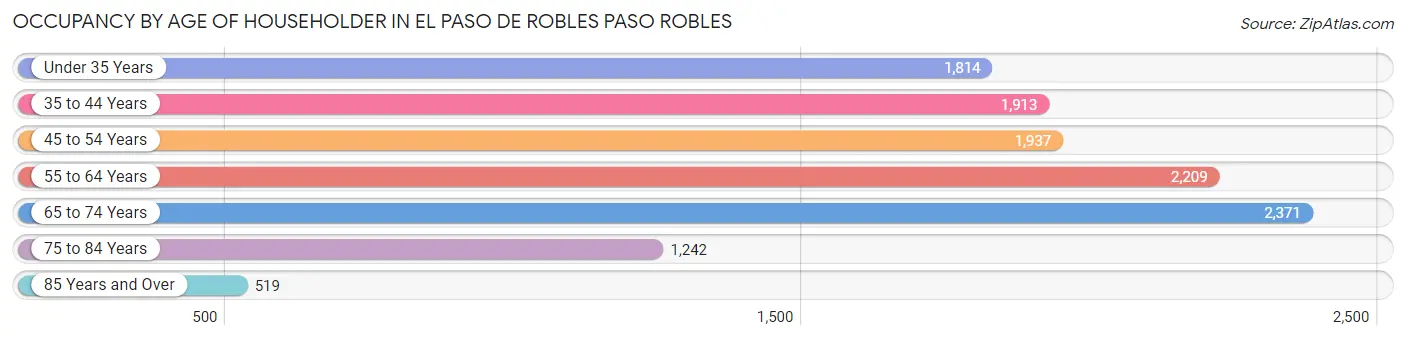
| Age Bracket | # Households | % Households |
| Under 35 Years | 1,814 | 15.1% |
| 35 to 44 Years | 1,913 | 15.9% |
| 45 to 54 Years | 1,937 | 16.1% |
| 55 to 64 Years | 2,209 | 18.4% |
| 65 to 74 Years | 2,371 | 19.8% |
| 75 to 84 Years | 1,242 | 10.3% |
| 85 Years and Over | 519 | 4.3% |
| Total | 12,005 | 100.0% |
Housing Finances in El Paso de Robles Paso Robles
Median Income by Occupancy in El Paso de Robles Paso Robles
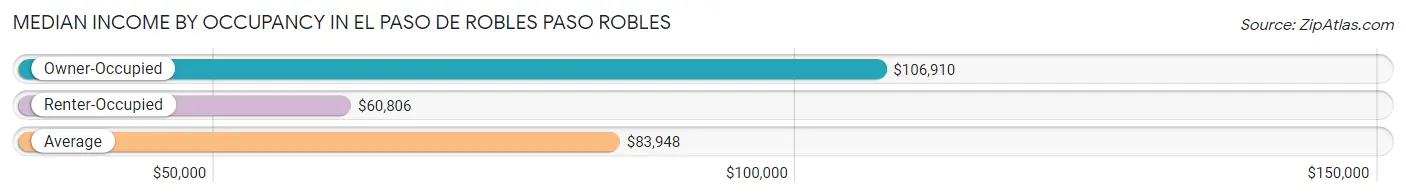
| Occupancy Type | # Households | Median Income |
| Owner-Occupied | 7,342 (61.2%) | $106,910 |
| Renter-Occupied | 4,663 (38.8%) | $60,806 |
| Average | 12,005 (100.0%) | $83,948 |
Occupancy by Householder Income Bracket in El Paso de Robles Paso Robles
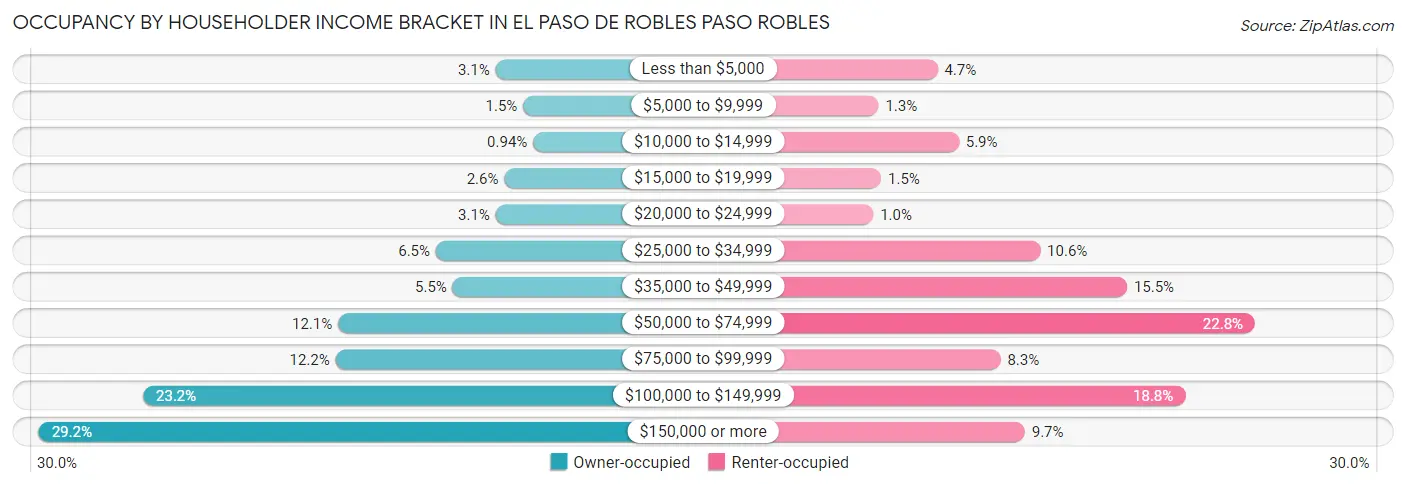
| Income Bracket | Owner-occupied | Renter-occupied |
| Less than $5,000 | 227 (3.1%) | 218 (4.7%) |
| $5,000 to $9,999 | 111 (1.5%) | 61 (1.3%) |
| $10,000 to $14,999 | 69 (0.9%) | 275 (5.9%) |
| $15,000 to $19,999 | 190 (2.6%) | 68 (1.5%) |
| $20,000 to $24,999 | 226 (3.1%) | 47 (1.0%) |
| $25,000 to $34,999 | 477 (6.5%) | 492 (10.5%) |
| $35,000 to $49,999 | 407 (5.5%) | 723 (15.5%) |
| $50,000 to $74,999 | 888 (12.1%) | 1,064 (22.8%) |
| $75,000 to $99,999 | 898 (12.2%) | 386 (8.3%) |
| $100,000 to $149,999 | 1,706 (23.2%) | 878 (18.8%) |
| $150,000 or more | 2,143 (29.2%) | 451 (9.7%) |
| Total | 7,342 (100.0%) | 4,663 (100.0%) |
Monthly Housing Cost Tiers in El Paso de Robles Paso Robles
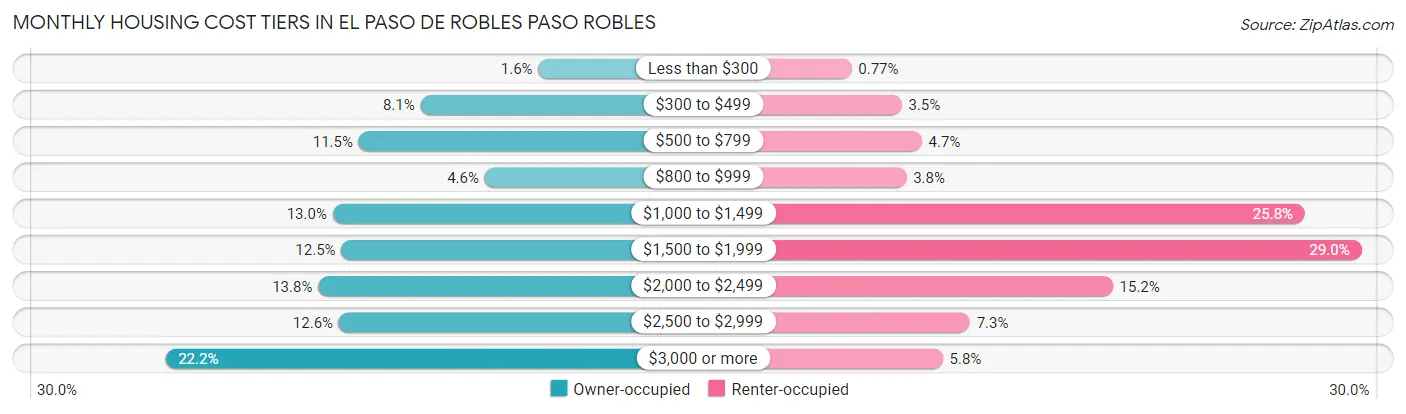
| Monthly Cost | Owner-occupied | Renter-occupied |
| Less than $300 | 119 (1.6%) | 36 (0.8%) |
| $300 to $499 | 597 (8.1%) | 165 (3.5%) |
| $500 to $799 | 847 (11.5%) | 217 (4.6%) |
| $800 to $999 | 336 (4.6%) | 177 (3.8%) |
| $1,000 to $1,499 | 953 (13.0%) | 1,204 (25.8%) |
| $1,500 to $1,999 | 918 (12.5%) | 1,350 (28.9%) |
| $2,000 to $2,499 | 1,012 (13.8%) | 709 (15.2%) |
| $2,500 to $2,999 | 928 (12.6%) | 341 (7.3%) |
| $3,000 or more | 1,632 (22.2%) | 271 (5.8%) |
| Total | 7,342 (100.0%) | 4,663 (100.0%) |
Physical Housing Characteristics in El Paso de Robles Paso Robles
Housing Structures in El Paso de Robles Paso Robles
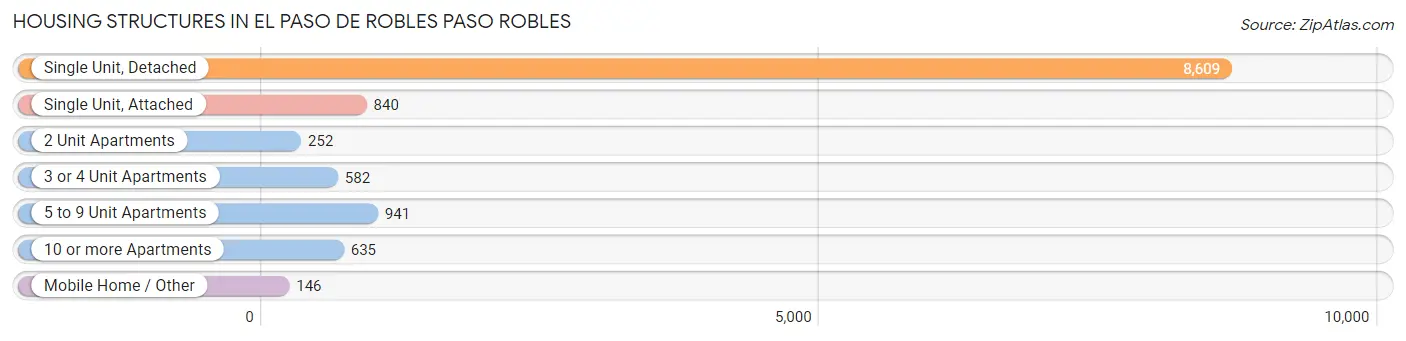
| Structure Type | # Housing Units | % Housing Units |
| Single Unit, Detached | 8,609 | 71.7% |
| Single Unit, Attached | 840 | 7.0% |
| 2 Unit Apartments | 252 | 2.1% |
| 3 or 4 Unit Apartments | 582 | 4.9% |
| 5 to 9 Unit Apartments | 941 | 7.8% |
| 10 or more Apartments | 635 | 5.3% |
| Mobile Home / Other | 146 | 1.2% |
| Total | 12,005 | 100.0% |
Housing Structures by Occupancy in El Paso de Robles Paso Robles
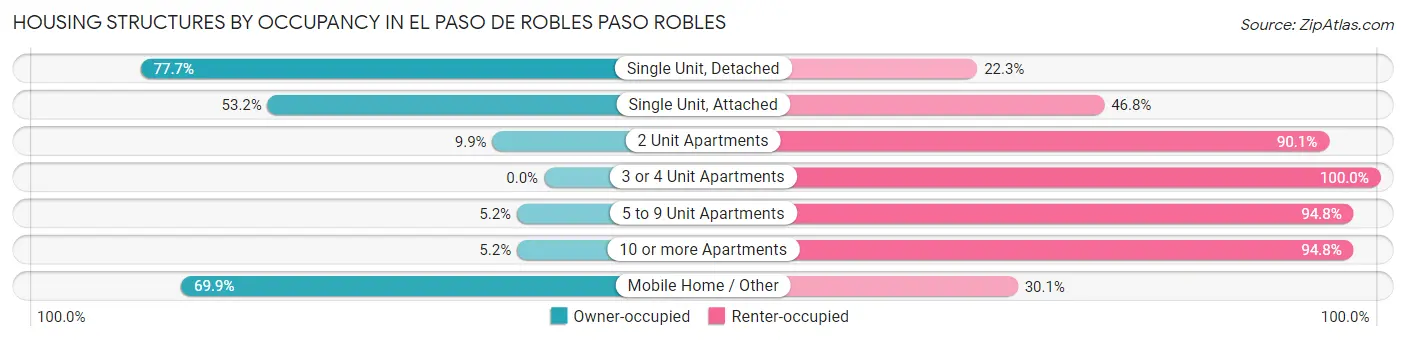
| Structure Type | Owner-occupied | Renter-occupied |
| Single Unit, Detached | 6,686 (77.7%) | 1,923 (22.3%) |
| Single Unit, Attached | 447 (53.2%) | 393 (46.8%) |
| 2 Unit Apartments | 25 (9.9%) | 227 (90.1%) |
| 3 or 4 Unit Apartments | 0 (0.0%) | 582 (100.0%) |
| 5 to 9 Unit Apartments | 49 (5.2%) | 892 (94.8%) |
| 10 or more Apartments | 33 (5.2%) | 602 (94.8%) |
| Mobile Home / Other | 102 (69.9%) | 44 (30.1%) |
| Total | 7,342 (61.2%) | 4,663 (38.8%) |
Housing Structures by Number of Rooms in El Paso de Robles Paso Robles
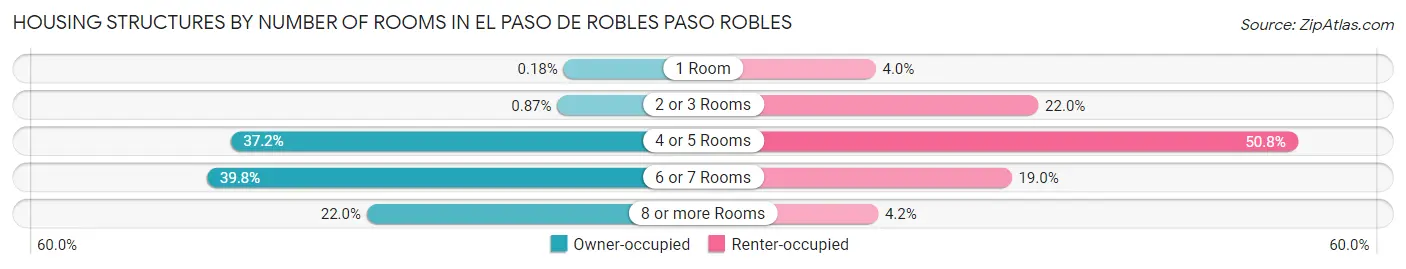
| Number of Rooms | Owner-occupied | Renter-occupied |
| 1 Room | 13 (0.2%) | 184 (4.0%) |
| 2 or 3 Rooms | 64 (0.9%) | 1,026 (22.0%) |
| 4 or 5 Rooms | 2,728 (37.2%) | 2,368 (50.8%) |
| 6 or 7 Rooms | 2,920 (39.8%) | 888 (19.0%) |
| 8 or more Rooms | 1,617 (22.0%) | 197 (4.2%) |
| Total | 7,342 (100.0%) | 4,663 (100.0%) |
Housing Structure by Heating Type in El Paso de Robles Paso Robles
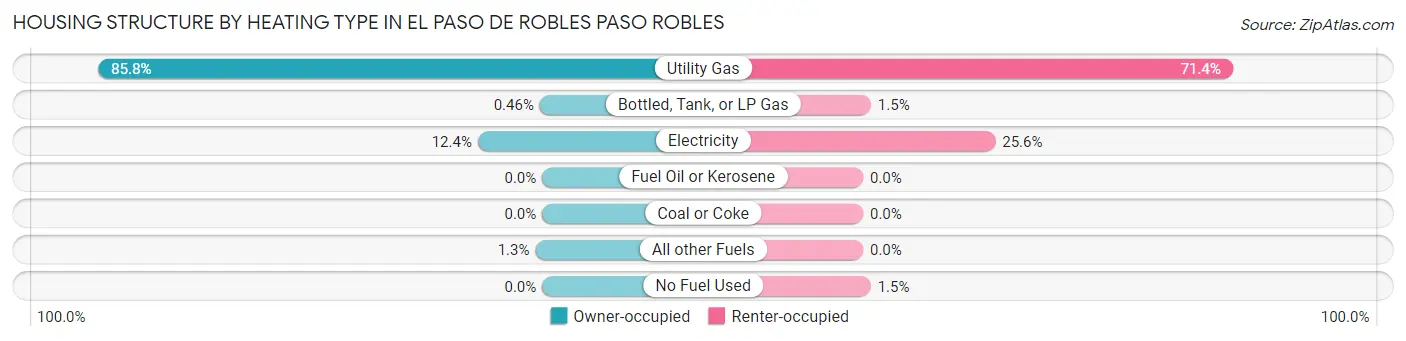
| Heating Type | Owner-occupied | Renter-occupied |
| Utility Gas | 6,298 (85.8%) | 3,331 (71.4%) |
| Bottled, Tank, or LP Gas | 34 (0.5%) | 71 (1.5%) |
| Electricity | 913 (12.4%) | 1,192 (25.6%) |
| Fuel Oil or Kerosene | 0 (0.0%) | 0 (0.0%) |
| Coal or Coke | 0 (0.0%) | 0 (0.0%) |
| All other Fuels | 97 (1.3%) | 0 (0.0%) |
| No Fuel Used | 0 (0.0%) | 69 (1.5%) |
| Total | 7,342 (100.0%) | 4,663 (100.0%) |
Household Vehicle Usage in El Paso de Robles Paso Robles
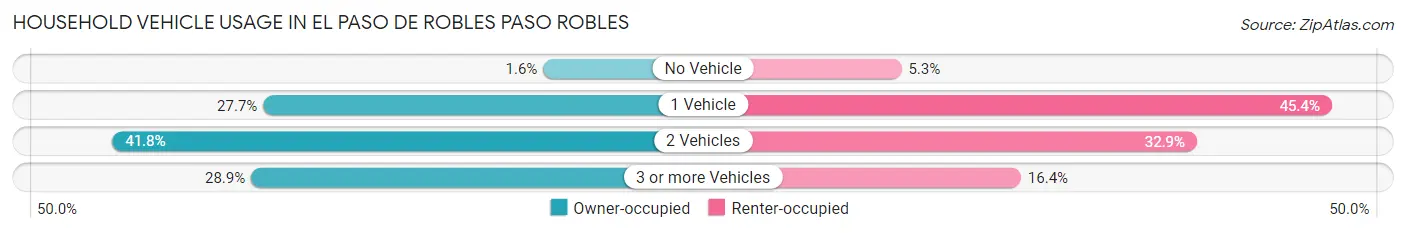
| Vehicles per Household | Owner-occupied | Renter-occupied |
| No Vehicle | 117 (1.6%) | 246 (5.3%) |
| 1 Vehicle | 2,036 (27.7%) | 2,119 (45.4%) |
| 2 Vehicles | 3,070 (41.8%) | 1,532 (32.9%) |
| 3 or more Vehicles | 2,119 (28.9%) | 766 (16.4%) |
| Total | 7,342 (100.0%) | 4,663 (100.0%) |
Real Estate & Mortgages in El Paso de Robles Paso Robles
Real Estate and Mortgage Overview in El Paso de Robles Paso Robles
| Characteristic | Without Mortgage | With Mortgage |
| Housing Units | 2,341 | 5,001 |
| Median Property Value | $658,300 | $603,500 |
| Median Household Income | $66,265 | $1,826 |
| Monthly Housing Costs | $669 | $1,632 |
| Real Estate Taxes | $3,581 | $102 |
Property Value by Mortgage Status in El Paso de Robles Paso Robles
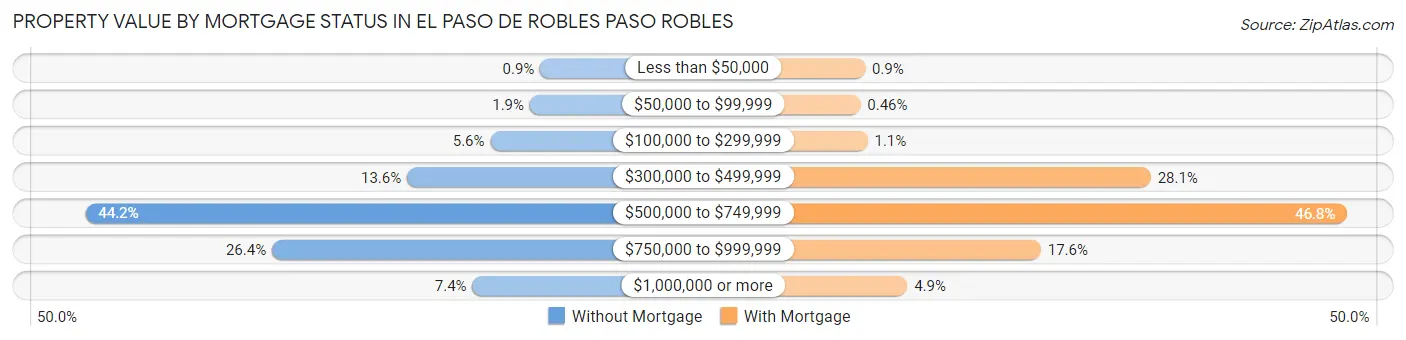
| Property Value | Without Mortgage | With Mortgage |
| Less than $50,000 | 21 (0.9%) | 45 (0.9%) |
| $50,000 to $99,999 | 44 (1.9%) | 23 (0.5%) |
| $100,000 to $299,999 | 132 (5.6%) | 57 (1.1%) |
| $300,000 to $499,999 | 318 (13.6%) | 1,406 (28.1%) |
| $500,000 to $749,999 | 1,035 (44.2%) | 2,342 (46.8%) |
| $750,000 to $999,999 | 619 (26.4%) | 882 (17.6%) |
| $1,000,000 or more | 172 (7.3%) | 246 (4.9%) |
| Total | 2,341 (100.0%) | 5,001 (100.0%) |
Household Income by Mortgage Status in El Paso de Robles Paso Robles
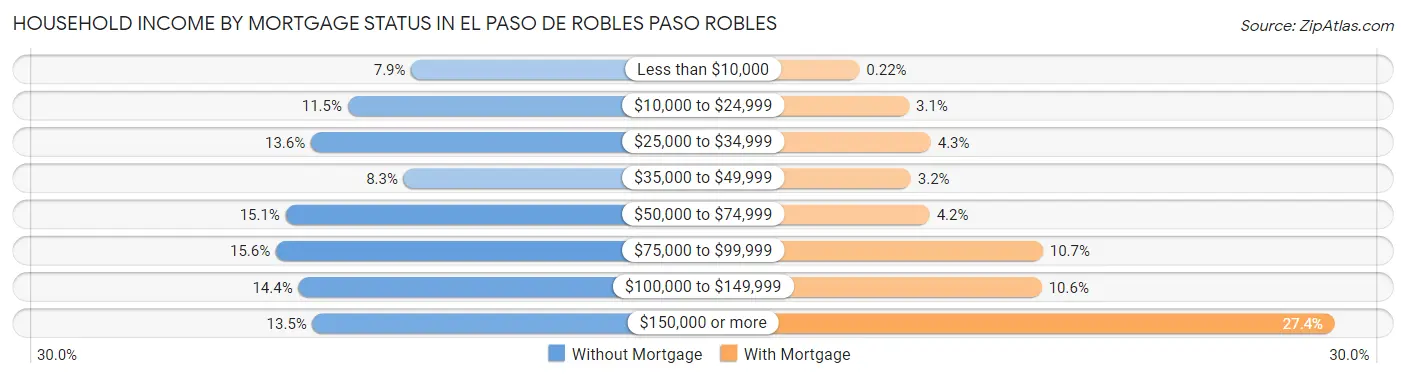
| Household Income | Without Mortgage | With Mortgage |
| Less than $10,000 | 185 (7.9%) | 11 (0.2%) |
| $10,000 to $24,999 | 270 (11.5%) | 153 (3.1%) |
| $25,000 to $34,999 | 319 (13.6%) | 215 (4.3%) |
| $35,000 to $49,999 | 195 (8.3%) | 158 (3.2%) |
| $50,000 to $74,999 | 353 (15.1%) | 212 (4.2%) |
| $75,000 to $99,999 | 366 (15.6%) | 535 (10.7%) |
| $100,000 to $149,999 | 336 (14.3%) | 532 (10.6%) |
| $150,000 or more | 317 (13.5%) | 1,370 (27.4%) |
| Total | 2,341 (100.0%) | 5,001 (100.0%) |
Property Value to Household Income Ratio in El Paso de Robles Paso Robles
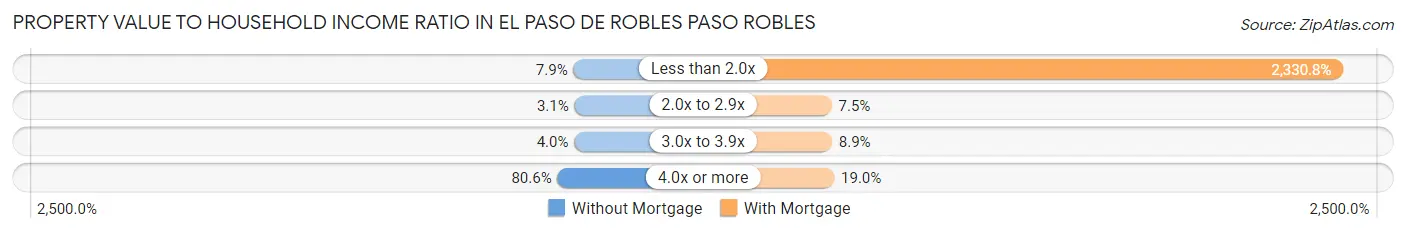
| Value-to-Income Ratio | Without Mortgage | With Mortgage |
| Less than 2.0x | 185 (7.9%) | 116,563 (2,330.8%) |
| 2.0x to 2.9x | 72 (3.1%) | 376 (7.5%) |
| 3.0x to 3.9x | 94 (4.0%) | 446 (8.9%) |
| 4.0x or more | 1,886 (80.6%) | 950 (19.0%) |
| Total | 2,341 (100.0%) | 5,001 (100.0%) |
Real Estate Taxes by Mortgage Status in El Paso de Robles Paso Robles
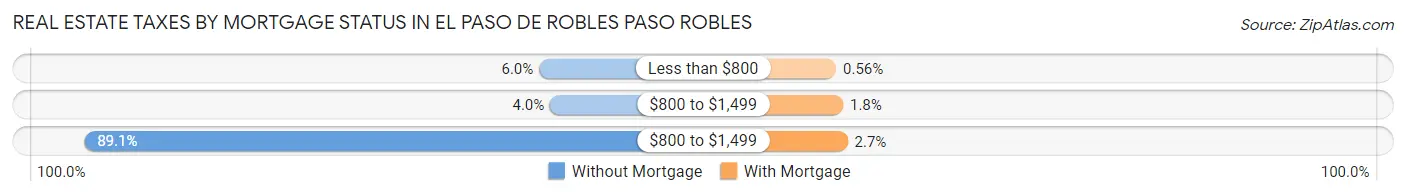
| Property Taxes | Without Mortgage | With Mortgage |
| Less than $800 | 141 (6.0%) | 28 (0.6%) |
| $800 to $1,499 | 94 (4.0%) | 91 (1.8%) |
| $800 to $1,499 | 2,086 (89.1%) | 133 (2.7%) |
| Total | 2,341 (100.0%) | 5,001 (100.0%) |
Health & Disability in El Paso de Robles Paso Robles
Health Insurance Coverage by Age in El Paso de Robles Paso Robles
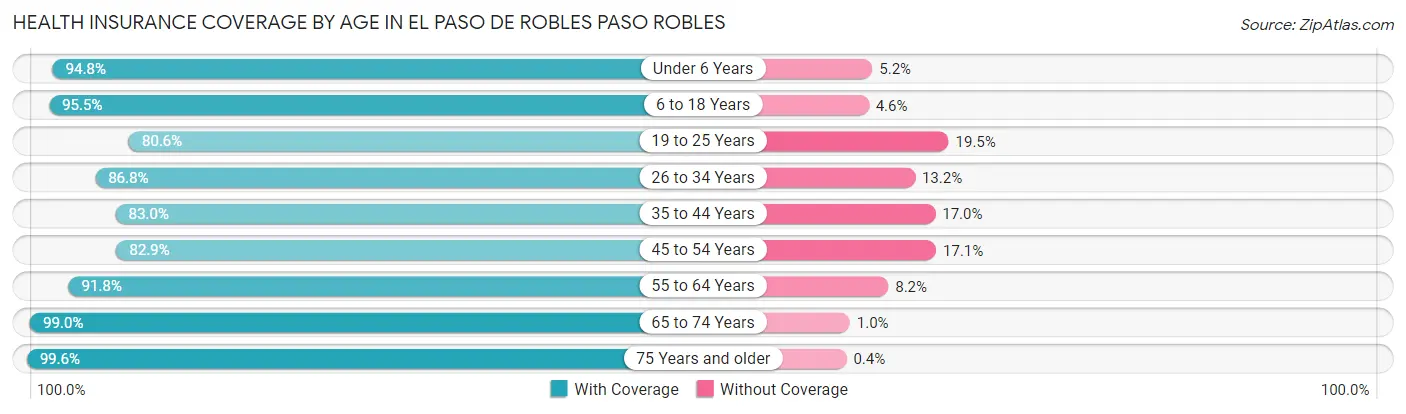
| Age Bracket | With Coverage | Without Coverage |
| Under 6 Years | 2,285 (94.8%) | 126 (5.2%) |
| 6 to 18 Years | 5,178 (95.5%) | 247 (4.5%) |
| 19 to 25 Years | 2,063 (80.5%) | 498 (19.5%) |
| 26 to 34 Years | 2,978 (86.8%) | 452 (13.2%) |
| 35 to 44 Years | 3,464 (83.0%) | 708 (17.0%) |
| 45 to 54 Years | 3,089 (82.9%) | 638 (17.1%) |
| 55 to 64 Years | 3,382 (91.8%) | 302 (8.2%) |
| 65 to 74 Years | 3,374 (99.0%) | 35 (1.0%) |
| 75 Years and older | 2,731 (99.6%) | 11 (0.4%) |
| Total | 28,544 (90.4%) | 3,017 (9.6%) |
Health Insurance Coverage by Citizenship Status in El Paso de Robles Paso Robles
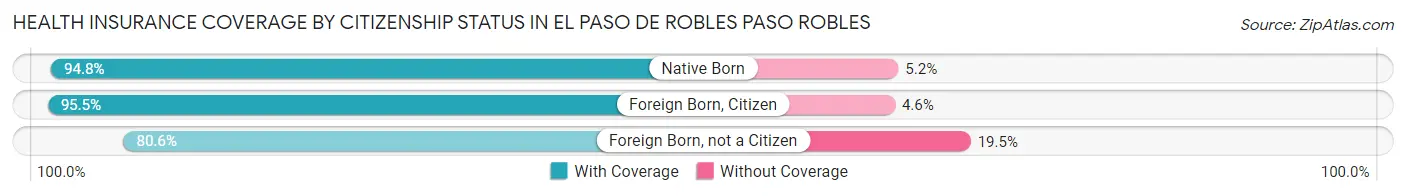
| Citizenship Status | With Coverage | Without Coverage |
| Native Born | 2,285 (94.8%) | 126 (5.2%) |
| Foreign Born, Citizen | 5,178 (95.5%) | 247 (4.5%) |
| Foreign Born, not a Citizen | 2,063 (80.5%) | 498 (19.5%) |
Health Insurance Coverage by Household Income in El Paso de Robles Paso Robles
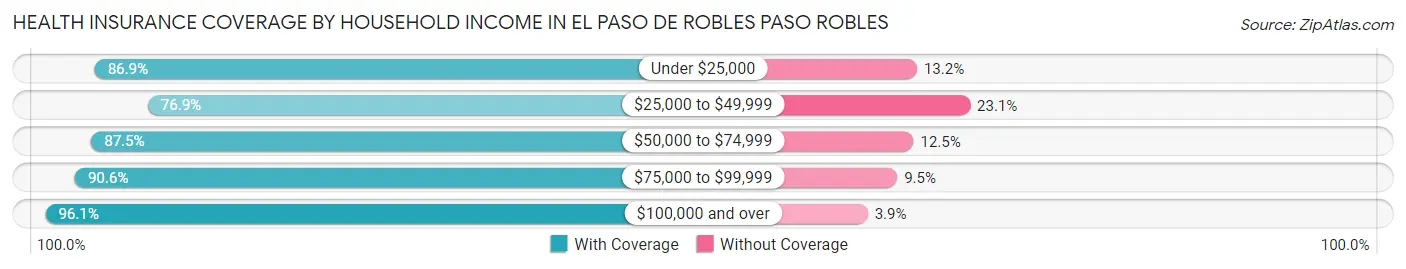
| Household Income | With Coverage | Without Coverage |
| Under $25,000 | 2,154 (86.9%) | 326 (13.2%) |
| $25,000 to $49,999 | 3,886 (76.9%) | 1,168 (23.1%) |
| $50,000 to $74,999 | 3,962 (87.5%) | 566 (12.5%) |
| $75,000 to $99,999 | 2,988 (90.5%) | 312 (9.5%) |
| $100,000 and over | 15,410 (96.1%) | 629 (3.9%) |
Public vs Private Health Insurance Coverage by Age in El Paso de Robles Paso Robles
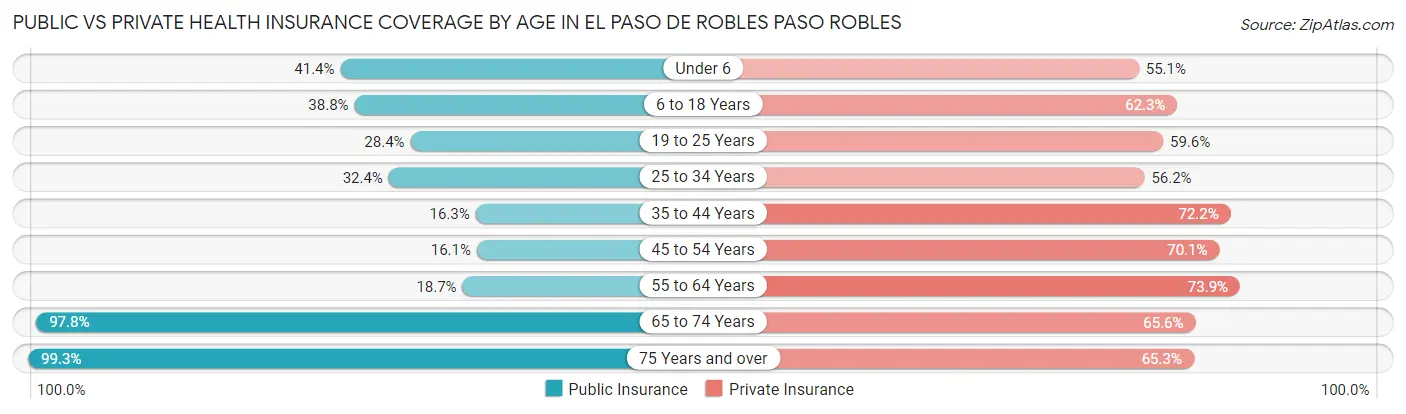
| Age Bracket | Public Insurance | Private Insurance |
| Under 6 | 998 (41.4%) | 1,329 (55.1%) |
| 6 to 18 Years | 2,104 (38.8%) | 3,378 (62.3%) |
| 19 to 25 Years | 727 (28.4%) | 1,527 (59.6%) |
| 25 to 34 Years | 1,112 (32.4%) | 1,927 (56.2%) |
| 35 to 44 Years | 680 (16.3%) | 3,010 (72.2%) |
| 45 to 54 Years | 599 (16.1%) | 2,611 (70.1%) |
| 55 to 64 Years | 690 (18.7%) | 2,722 (73.9%) |
| 65 to 74 Years | 3,335 (97.8%) | 2,237 (65.6%) |
| 75 Years and over | 2,724 (99.3%) | 1,791 (65.3%) |
| Total | 12,969 (41.1%) | 20,532 (65.0%) |
Disability Status by Sex by Age in El Paso de Robles Paso Robles
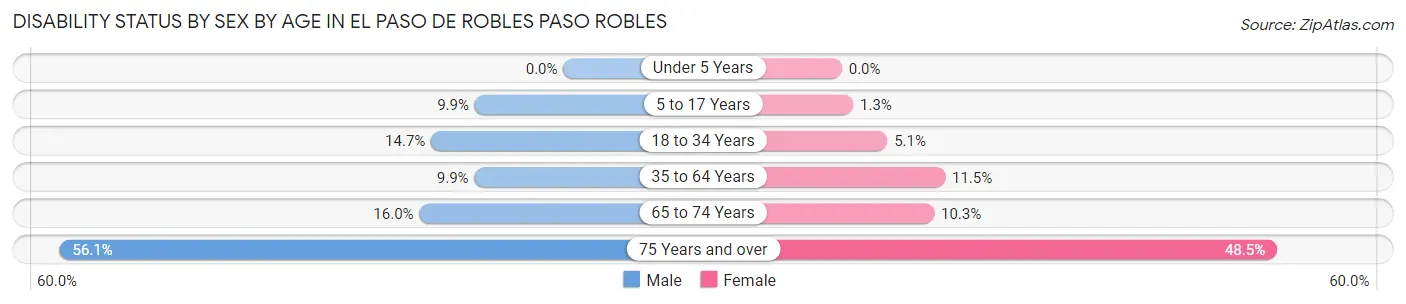
| Age Bracket | Male | Female |
| Under 5 Years | 0 (0.0%) | 0 (0.0%) |
| 5 to 17 Years | 292 (9.9%) | 33 (1.3%) |
| 18 to 34 Years | 480 (14.7%) | 155 (5.1%) |
| 35 to 64 Years | 569 (9.9%) | 671 (11.5%) |
| 65 to 74 Years | 236 (16.0%) | 199 (10.3%) |
| 75 Years and over | 601 (56.1%) | 810 (48.5%) |
Disability Class by Sex by Age in El Paso de Robles Paso Robles
Disability Class: Hearing Difficulty
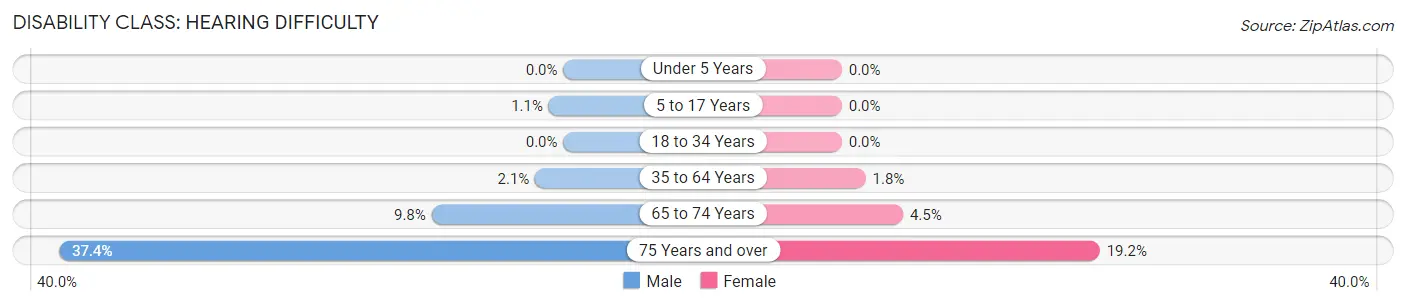
| Age Bracket | Male | Female |
| Under 5 Years | 0 (0.0%) | 0 (0.0%) |
| 5 to 17 Years | 32 (1.1%) | 0 (0.0%) |
| 18 to 34 Years | 0 (0.0%) | 0 (0.0%) |
| 35 to 64 Years | 120 (2.1%) | 103 (1.8%) |
| 65 to 74 Years | 144 (9.8%) | 88 (4.5%) |
| 75 Years and over | 401 (37.4%) | 320 (19.2%) |
Disability Class: Vision Difficulty
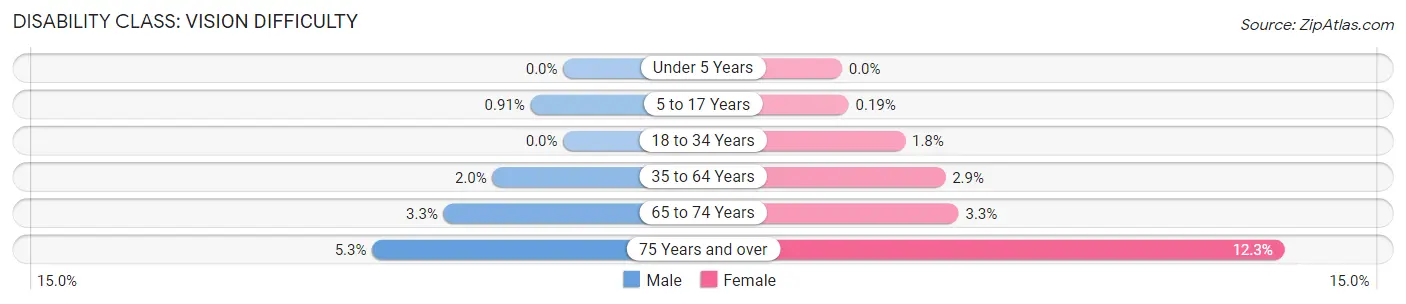
| Age Bracket | Male | Female |
| Under 5 Years | 0 (0.0%) | 0 (0.0%) |
| 5 to 17 Years | 27 (0.9%) | 5 (0.2%) |
| 18 to 34 Years | 0 (0.0%) | 54 (1.8%) |
| 35 to 64 Years | 113 (2.0%) | 168 (2.9%) |
| 65 to 74 Years | 49 (3.3%) | 63 (3.3%) |
| 75 Years and over | 57 (5.3%) | 206 (12.3%) |
Disability Class: Cognitive Difficulty
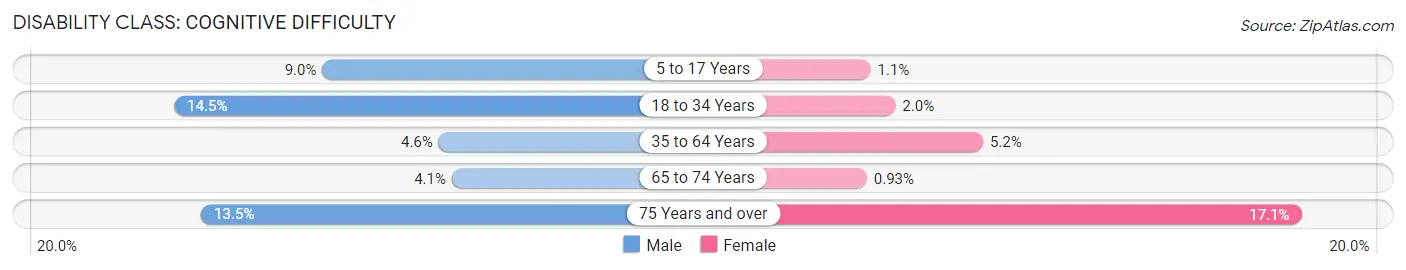
| Age Bracket | Male | Female |
| 5 to 17 Years | 265 (8.9%) | 28 (1.1%) |
| 18 to 34 Years | 471 (14.4%) | 61 (2.0%) |
| 35 to 64 Years | 266 (4.6%) | 306 (5.2%) |
| 65 to 74 Years | 61 (4.1%) | 18 (0.9%) |
| 75 Years and over | 144 (13.5%) | 285 (17.1%) |
Disability Class: Ambulatory Difficulty
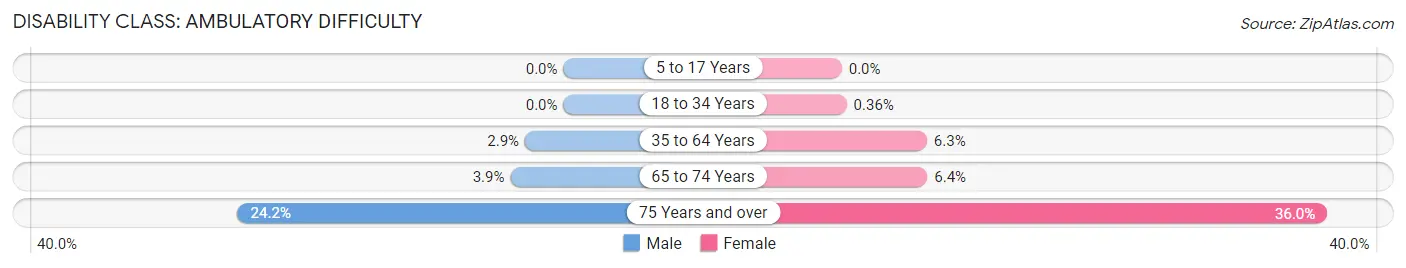
| Age Bracket | Male | Female |
| 5 to 17 Years | 0 (0.0%) | 0 (0.0%) |
| 18 to 34 Years | 0 (0.0%) | 11 (0.4%) |
| 35 to 64 Years | 164 (2.9%) | 369 (6.3%) |
| 65 to 74 Years | 58 (3.9%) | 123 (6.4%) |
| 75 Years and over | 259 (24.2%) | 602 (36.0%) |
Disability Class: Self-Care Difficulty
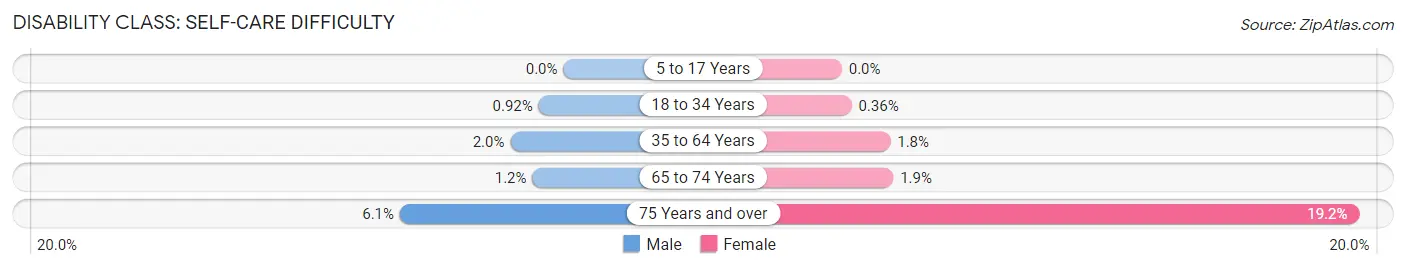
| Age Bracket | Male | Female |
| 5 to 17 Years | 0 (0.0%) | 0 (0.0%) |
| 18 to 34 Years | 30 (0.9%) | 11 (0.4%) |
| 35 to 64 Years | 113 (2.0%) | 105 (1.8%) |
| 65 to 74 Years | 17 (1.1%) | 37 (1.9%) |
| 75 Years and over | 65 (6.1%) | 321 (19.2%) |
Technology Access in El Paso de Robles Paso Robles
Computing Device Access in El Paso de Robles Paso Robles
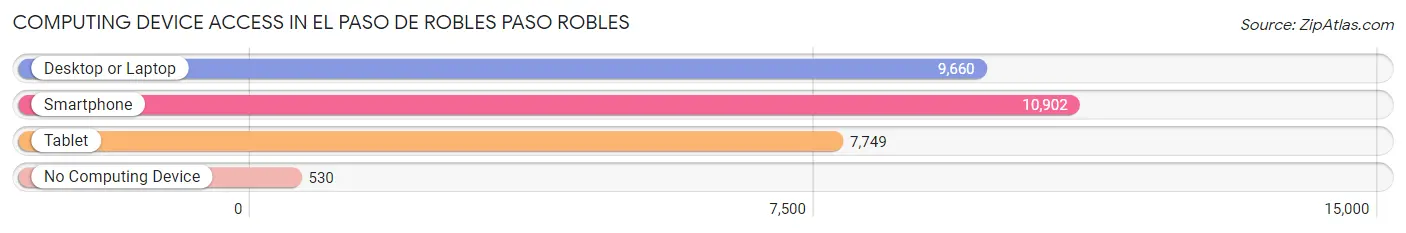
| Device Type | # Households | % Households |
| Desktop or Laptop | 9,660 | 80.5% |
| Smartphone | 10,902 | 90.8% |
| Tablet | 7,749 | 64.5% |
| No Computing Device | 530 | 4.4% |
| Total | 12,005 | 100.0% |
Internet Access in El Paso de Robles Paso Robles
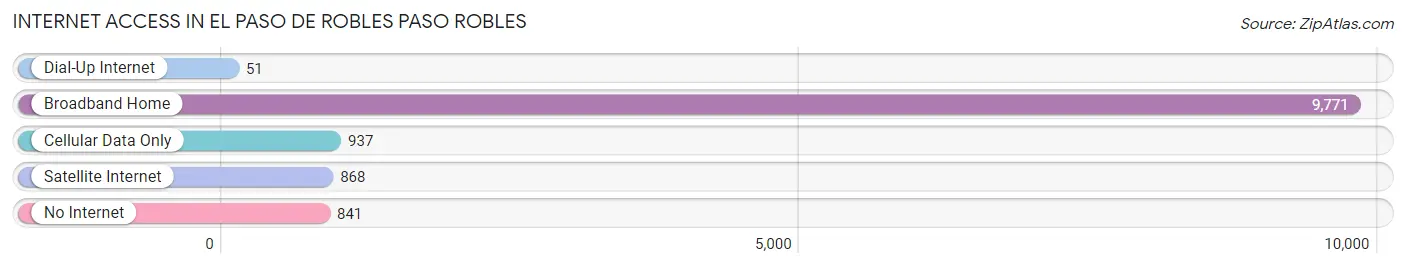
| Internet Type | # Households | % Households |
| Dial-Up Internet | 51 | 0.4% |
| Broadband Home | 9,771 | 81.4% |
| Cellular Data Only | 937 | 7.8% |
| Satellite Internet | 868 | 7.2% |
| No Internet | 841 | 7.0% |
| Total | 12,005 | 100.0% |
El Paso de Robles Paso Robles Summary
El Paso de Robles, or Paso Robles, is a city located in San Luis Obispo County, California. It is situated in the Central Coast region of the state, approximately halfway between Los Angeles and San Francisco. The city is known for its hot springs, wineries, and its historic downtown.
History
The area that is now Paso Robles was originally inhabited by the Salinan Indians, who were hunter-gatherers. The first European settlers arrived in the area in 1797, when Spanish explorer Don Gaspar de Portola and his expedition passed through the area. The area was later settled by Mexican ranchers, who named the area El Paso de Robles, or “The Pass of the Oaks”.
In 1857, the area was incorporated as a city, and the name was changed to Paso Robles. The city was a popular destination for travelers, due to its hot springs and its location on the stagecoach route between Los Angeles and San Francisco. The city was also known for its wineries, which were established in the late 19th century.
In the early 20th century, Paso Robles became a popular tourist destination, and the city’s downtown area was revitalized. The city was also home to a large military base during World War II, which brought a large influx of people to the area.
Geography
Paso Robles is located in the Central Coast region of California, approximately halfway between Los Angeles and San Francisco. The city is situated in the Salinas Valley, and is surrounded by rolling hills and oak-studded valleys. The city is located at an elevation of 830 feet above sea level.
The climate in Paso Robles is Mediterranean, with hot, dry summers and mild, wet winters. The average annual temperature is 64°F, and the average annual precipitation is 17.5 inches.
Economy
The economy of Paso Robles is largely based on agriculture and tourism. The city is home to numerous wineries, and is a popular destination for wine-tasting tours. The city is also home to a number of manufacturing companies, including a large olive oil processing plant.
The city is also home to a number of retail stores, restaurants, and other businesses. The city is served by the Paso Robles Municipal Airport, which provides air service to the area.
Demographics
As of the 2010 census, the population of Paso Robles was 29,793. The racial makeup of the city was 79.3% White, 1.2% African American, 0.7% Native American, 1.2% Asian, 0.2% Pacific Islander, 13.3% from other races, and 4.2% from two or more races. Hispanic or Latino of any race were 24.3% of the population.
The median household income in Paso Robles was $50,945, and the median family income was $60,945. The per capita income was $25,945. About 11.3% of the population was below the poverty line.
Conclusion
Paso Robles is a city located in San Luis Obispo County, California. It is situated in the Central Coast region of the state, and is known for its hot springs, wineries, and its historic downtown. The economy of Paso Robles is largely based on agriculture and tourism, and the city is home to numerous wineries and manufacturing companies. The population of Paso Robles was 29,793 as of the 2010 census, and the median household income was $50,945.
Common Questions
What is Per Capita Income in El Paso de Robles Paso Robles?
Per Capita income in El Paso de Robles Paso Robles is $43,370.
What is the Median Family Income in El Paso de Robles Paso Robles?
Median Family Income in El Paso de Robles Paso Robles is $103,027.
What is the Median Household income in El Paso de Robles Paso Robles?
Median Household Income in El Paso de Robles Paso Robles is $83,948.
What is Income or Wage Gap in El Paso de Robles Paso Robles?
Income or Wage Gap in El Paso de Robles Paso Robles is 29.0%.
Women in El Paso de Robles Paso Robles earn 71.0 cents for every dollar earned by a man.
What is Family Income Deficit in El Paso de Robles Paso Robles?
Family Income Deficit in El Paso de Robles Paso Robles is $10,298.
Families that are below poverty line in El Paso de Robles Paso Robles earn $10,298 less on average than the poverty threshold level.
What is Inequality or Gini Index in El Paso de Robles Paso Robles?
Inequality or Gini Index in El Paso de Robles Paso Robles is 0.47.
What is the Total Population of El Paso de Robles Paso Robles?
Total Population of El Paso de Robles Paso Robles is 31,595.
What is the Total Male Population of El Paso de Robles Paso Robles?
Total Male Population of El Paso de Robles Paso Robles is 15,534.
What is the Total Female Population of El Paso de Robles Paso Robles?
Total Female Population of El Paso de Robles Paso Robles is 16,061.
What is the Ratio of Males per 100 Females in El Paso de Robles Paso Robles?
There are 96.72 Males per 100 Females in El Paso de Robles Paso Robles.
What is the Ratio of Females per 100 Males in El Paso de Robles Paso Robles?
There are 103.39 Females per 100 Males in El Paso de Robles Paso Robles.
What is the Median Population Age in El Paso de Robles Paso Robles?
Median Population Age in El Paso de Robles Paso Robles is 39.5 Years.
What is the Average Family Size in El Paso de Robles Paso Robles
Average Family Size in El Paso de Robles Paso Robles is 3.2 People.
What is the Average Household Size in El Paso de Robles Paso Robles
Average Household Size in El Paso de Robles Paso Robles is 2.6 People.
How Large is the Labor Force in El Paso de Robles Paso Robles?
There are 15,473 People in the Labor Forcein in El Paso de Robles Paso Robles.
What is the Percentage of People in the Labor Force in El Paso de Robles Paso Robles?
61.9% of People are in the Labor Force in El Paso de Robles Paso Robles.
What is the Unemployment Rate in El Paso de Robles Paso Robles?
Unemployment Rate in El Paso de Robles Paso Robles is 4.8%.