Signal Hill, CA Map & Demographics
Signal Hill Map
Signal Hill Overview
$46,714
PER CAPITA INCOME
$106,023
AVG FAMILY INCOME
$96,385
AVG HOUSEHOLD INCOME
1.7%
WAGE / INCOME GAP [ % ]
98.3¢/ $1
WAGE / INCOME GAP [ $ ]
0.39
INEQUALITY / GINI INDEX
11,678
TOTAL POPULATION
5,827
MALE POPULATION
5,851
FEMALE POPULATION
99.59
MALES / 100 FEMALES
100.41
FEMALES / 100 MALES
36.8
MEDIAN AGE
3.4
AVG FAMILY SIZE
2.5
AVG HOUSEHOLD SIZE
6,742
LABOR FORCE [ PEOPLE ]
70.6%
PERCENT IN LABOR FORCE
4.6%
UNEMPLOYMENT RATE
Signal Hill Zip Codes
Income in Signal Hill
Income Overview in Signal Hill
Per Capita Income in Signal Hill is $46,714, while median incomes of families and households are $106,023 and $96,385 respectively.
| Characteristic | Number | Measure |
| Per Capita Income | 11,678 | $46,714 |
| Median Family Income | 2,581 | $106,023 |
| Mean Family Income | 2,581 | $130,248 |
| Median Household Income | 4,563 | $96,385 |
| Mean Household Income | 4,563 | $117,481 |
| Income Deficit | 2,581 | $0 |
| Wage / Income Gap (%) | 11,678 | 1.74% |
| Wage / Income Gap ($) | 11,678 | 98.26¢ per $1 |
| Gini / Inequality Index | 11,678 | 0.39 |
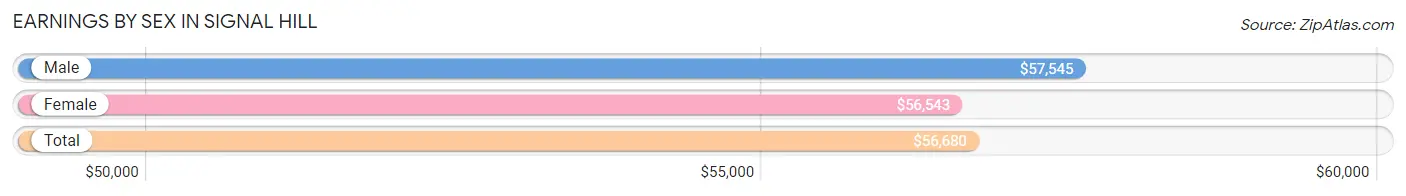
Earnings by Sex in Signal Hill
Average Earnings in Signal Hill are $56,680, $57,545 for men and $56,543 for women, a difference of 1.7%.
| Sex | Number | Average Earnings |
| Male | 3,805 (55.3%) | $57,545 |
| Female | 3,074 (44.7%) | $56,543 |
| Total | 6,879 (100.0%) | $56,680 |
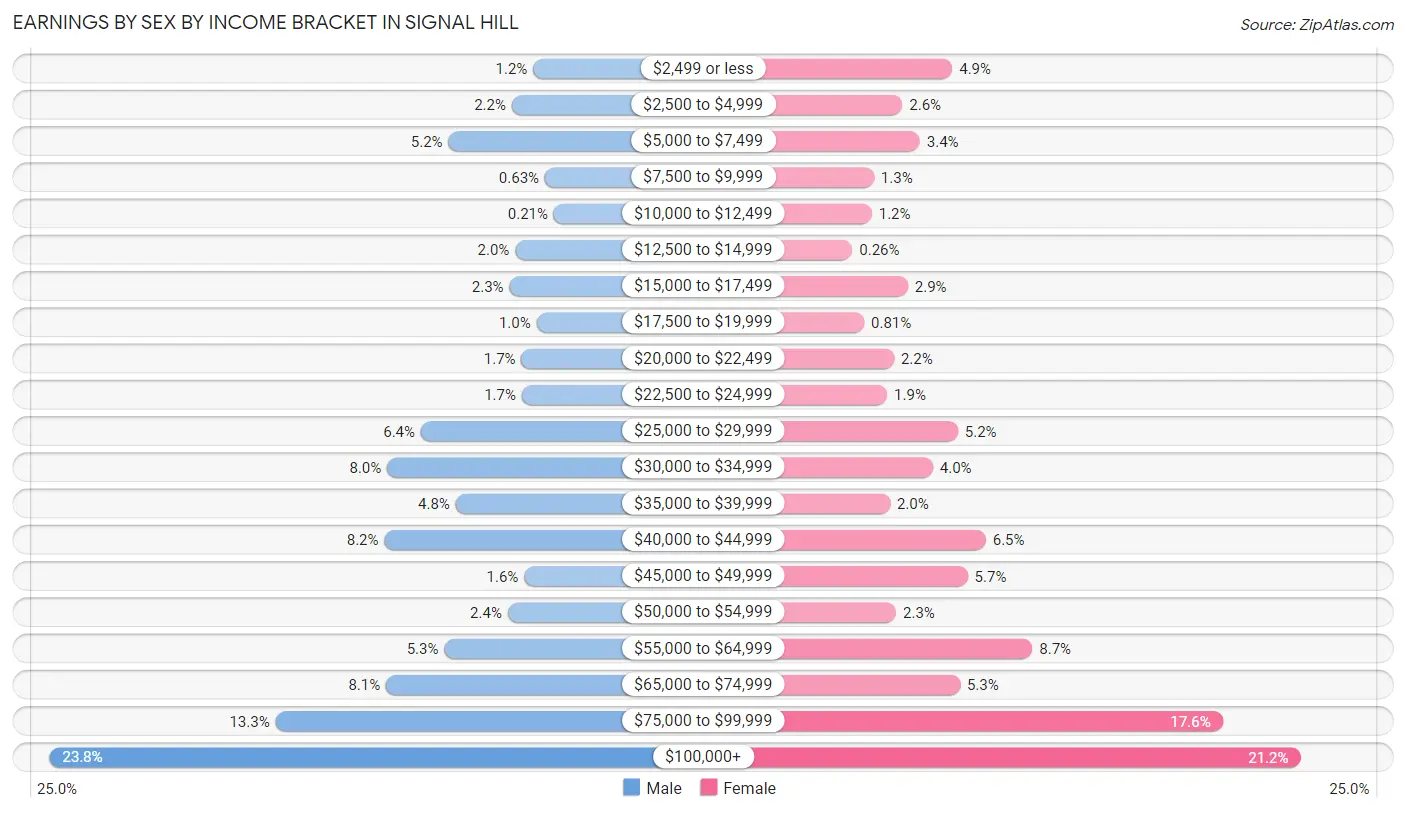
Earnings by Sex by Income Bracket in Signal Hill
The most common earnings brackets in Signal Hill are $100,000+ for men (907 | 23.8%) and $100,000+ for women (653 | 21.2%).
| Income | Male | Female |
| $2,499 or less | 45 (1.2%) | 152 (4.9%) |
| $2,500 to $4,999 | 83 (2.2%) | 80 (2.6%) |
| $5,000 to $7,499 | 196 (5.1%) | 105 (3.4%) |
| $7,500 to $9,999 | 24 (0.6%) | 39 (1.3%) |
| $10,000 to $12,499 | 8 (0.2%) | 36 (1.2%) |
| $12,500 to $14,999 | 77 (2.0%) | 8 (0.3%) |
| $15,000 to $17,499 | 87 (2.3%) | 88 (2.9%) |
| $17,500 to $19,999 | 39 (1.0%) | 25 (0.8%) |
| $20,000 to $22,499 | 66 (1.7%) | 68 (2.2%) |
| $22,500 to $24,999 | 65 (1.7%) | 58 (1.9%) |
| $25,000 to $29,999 | 245 (6.4%) | 160 (5.2%) |
| $30,000 to $34,999 | 305 (8.0%) | 124 (4.0%) |
| $35,000 to $39,999 | 183 (4.8%) | 62 (2.0%) |
| $40,000 to $44,999 | 310 (8.2%) | 200 (6.5%) |
| $45,000 to $49,999 | 61 (1.6%) | 174 (5.7%) |
| $50,000 to $54,999 | 90 (2.4%) | 71 (2.3%) |
| $55,000 to $64,999 | 203 (5.3%) | 267 (8.7%) |
| $65,000 to $74,999 | 307 (8.1%) | 163 (5.3%) |
| $75,000 to $99,999 | 504 (13.3%) | 541 (17.6%) |
| $100,000+ | 907 (23.8%) | 653 (21.2%) |
| Total | 3,805 (100.0%) | 3,074 (100.0%) |
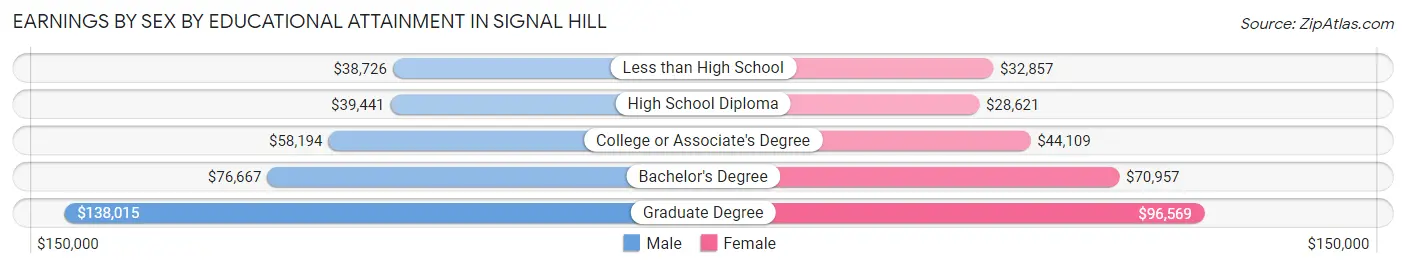
Earnings by Sex by Educational Attainment in Signal Hill
Average earnings in Signal Hill are $60,625 for men and $60,577 for women, a difference of 0.1%. Men with an educational attainment of graduate degree enjoy the highest average annual earnings of $138,015, while those with less than high school education earn the least with $38,726. Women with an educational attainment of graduate degree earn the most with the average annual earnings of $96,569, while those with high school diploma education have the smallest earnings of $28,621.
| Educational Attainment | Male Income | Female Income |
| Less than High School | $38,726 | $32,857 |
| High School Diploma | $39,441 | $28,621 |
| College or Associate's Degree | $58,194 | $44,109 |
| Bachelor's Degree | $76,667 | $70,957 |
| Graduate Degree | $138,015 | $96,569 |
| Total | $60,625 | $60,577 |
Family Income in Signal Hill
Family Income Brackets in Signal Hill
According to the Signal Hill family income data, there are 586 families falling into the $200,000+ income range, which is the most common income bracket and makes up 22.7% of all families. Conversely, the less than $10,000 income bracket is the least frequent group with only 41 families (1.6%) belonging to this category.
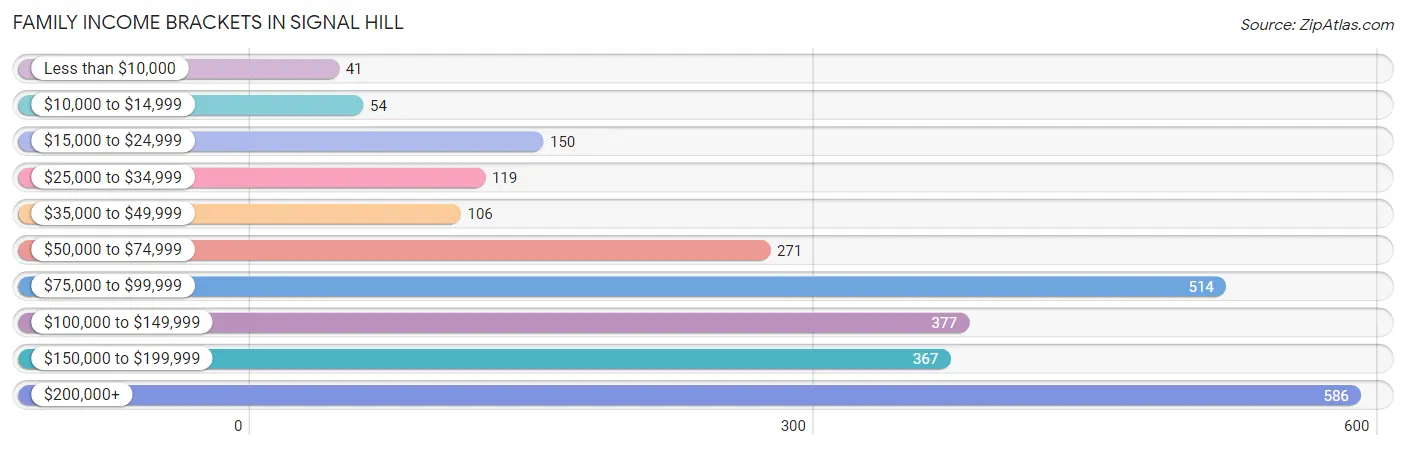
| Income Bracket | # Families | % Families |
| Less than $10,000 | 41 | 1.6% |
| $10,000 to $14,999 | 54 | 2.1% |
| $15,000 to $24,999 | 150 | 5.8% |
| $25,000 to $34,999 | 119 | 4.6% |
| $35,000 to $49,999 | 106 | 4.1% |
| $50,000 to $74,999 | 271 | 10.5% |
| $75,000 to $99,999 | 514 | 19.9% |
| $100,000 to $149,999 | 377 | 14.6% |
| $150,000 to $199,999 | 367 | 14.2% |
| $200,000+ | 586 | 22.7% |
Family Income by Famaliy Size in Signal Hill
4-person families (471 | 18.2%) account for the highest median family income in Signal Hill with $165,444 per family, while 2-person families (1,018 | 39.4%) have the highest median income of $51,150 per family member.
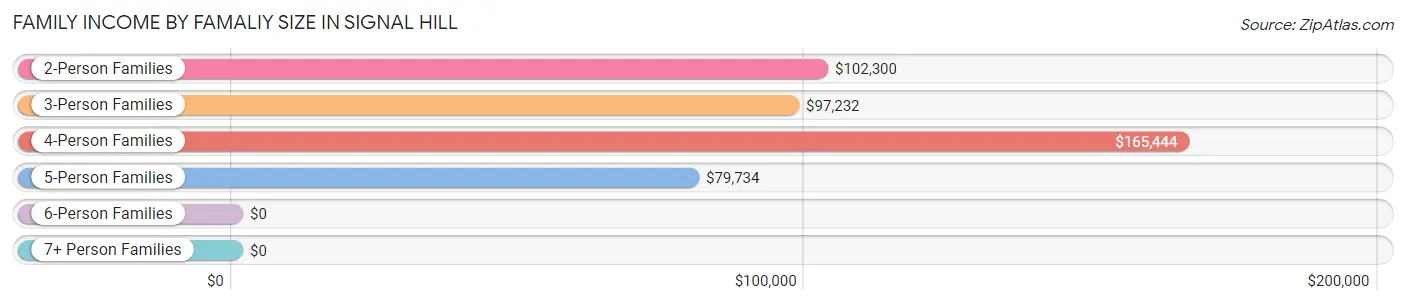
| Income Bracket | # Families | Median Income |
| 2-Person Families | 1,018 (39.4%) | $102,300 |
| 3-Person Families | 727 (28.2%) | $97,232 |
| 4-Person Families | 471 (18.2%) | $165,444 |
| 5-Person Families | 163 (6.3%) | $79,734 |
| 6-Person Families | 30 (1.2%) | $0 |
| 7+ Person Families | 172 (6.7%) | $0 |
| Total | 2,581 (100.0%) | $106,023 |
Family Income by Number of Earners in Signal Hill
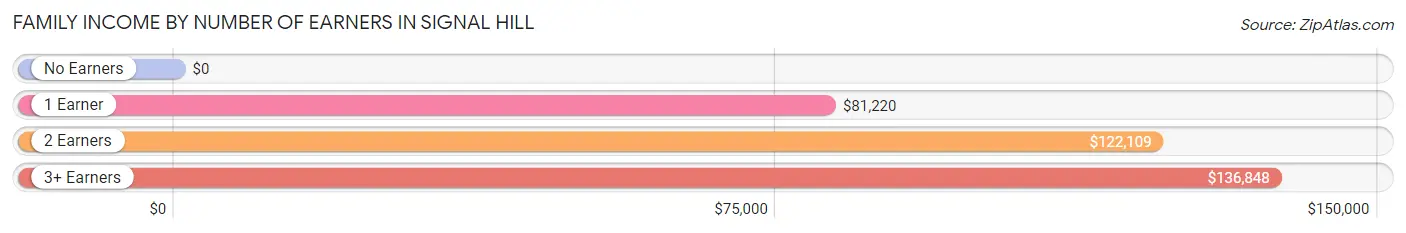
| Number of Earners | # Families | Median Income |
| No Earners | 282 (10.9%) | $0 |
| 1 Earner | 898 (34.8%) | $81,220 |
| 2 Earners | 847 (32.8%) | $122,109 |
| 3+ Earners | 554 (21.5%) | $136,848 |
| Total | 2,581 (100.0%) | $106,023 |
Household Income in Signal Hill
Household Income Brackets in Signal Hill
With 826 households falling in the category, the $100,000 to $149,999 income range is the most frequent in Signal Hill, accounting for 18.1% of all households. In contrast, only 82 households (1.8%) fall into the $10,000 to $14,999 income bracket, making it the least populous group.
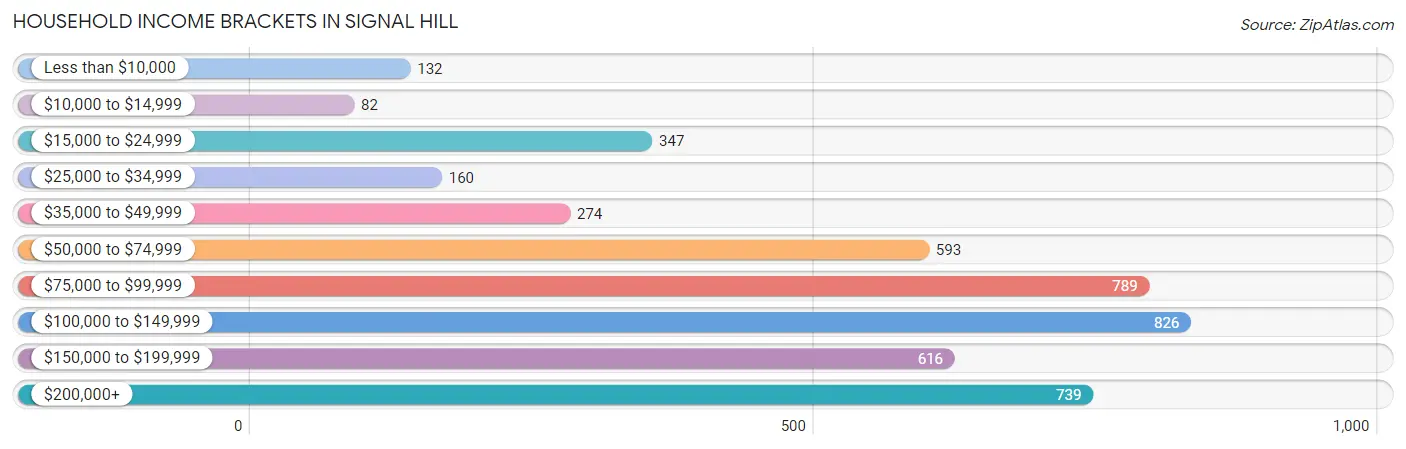
| Income Bracket | # Households | % Households |
| Less than $10,000 | 132 | 2.9% |
| $10,000 to $14,999 | 82 | 1.8% |
| $15,000 to $24,999 | 347 | 7.6% |
| $25,000 to $34,999 | 160 | 3.5% |
| $35,000 to $49,999 | 274 | 6.0% |
| $50,000 to $74,999 | 593 | 13.0% |
| $75,000 to $99,999 | 789 | 17.3% |
| $100,000 to $149,999 | 826 | 18.1% |
| $150,000 to $199,999 | 616 | 13.5% |
| $200,000+ | 739 | 16.2% |
Household Income by Householder Age in Signal Hill
The median household income in Signal Hill is $96,385, with the highest median household income of $113,859 found in the 45 to 64 years age bracket for the primary householder. A total of 1,849 households (40.5%) fall into this category. Meanwhile, the 15 to 24 years age bracket for the primary householder has the lowest median household income of $57,313, with 81 households (1.8%) in this group.
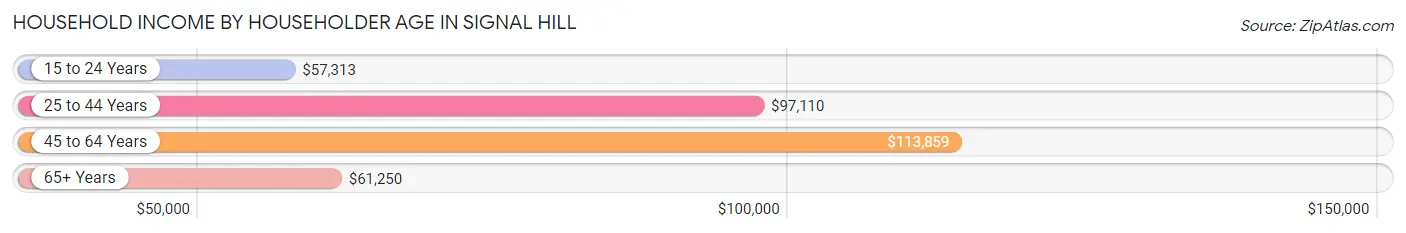
| Income Bracket | # Households | Median Income |
| 15 to 24 Years | 81 (1.8%) | $57,313 |
| 25 to 44 Years | 1,831 (40.1%) | $97,110 |
| 45 to 64 Years | 1,849 (40.5%) | $113,859 |
| 65+ Years | 802 (17.6%) | $61,250 |
| Total | 4,563 (100.0%) | $96,385 |
Poverty in Signal Hill
Income Below Poverty by Sex and Age in Signal Hill
With 6.9% poverty level for males and 12.1% for females among the residents of Signal Hill, under 5 year old males and under 5 year old females are the most vulnerable to poverty, with 110 males (20.4%) and 105 females (46.1%) in their respective age groups living below the poverty level.
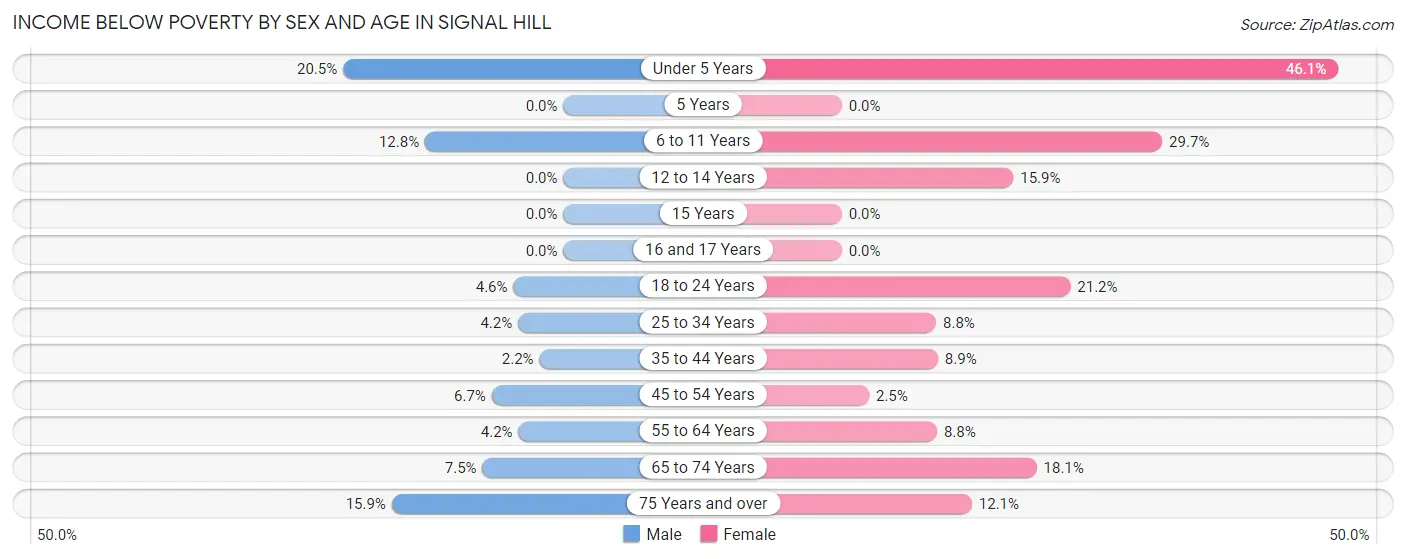
| Age Bracket | Male | Female |
| Under 5 Years | 110 (20.4%) | 105 (46.1%) |
| 5 Years | 0 (0.0%) | 0 (0.0%) |
| 6 to 11 Years | 57 (12.8%) | 88 (29.7%) |
| 12 to 14 Years | 0 (0.0%) | 46 (15.9%) |
| 15 Years | 0 (0.0%) | 0 (0.0%) |
| 16 and 17 Years | 0 (0.0%) | 0 (0.0%) |
| 18 to 24 Years | 18 (4.6%) | 77 (21.2%) |
| 25 to 34 Years | 51 (4.2%) | 112 (8.7%) |
| 35 to 44 Years | 20 (2.2%) | 63 (8.9%) |
| 45 to 54 Years | 67 (6.7%) | 23 (2.5%) |
| 55 to 64 Years | 25 (4.2%) | 59 (8.8%) |
| 65 to 74 Years | 19 (7.5%) | 98 (18.1%) |
| 75 Years and over | 36 (15.9%) | 35 (12.1%) |
| Total | 403 (6.9%) | 706 (12.1%) |
Income Above Poverty by Sex and Age in Signal Hill
According to the poverty statistics in Signal Hill, males aged 5 years and females aged 5 years are the age groups that are most secure financially, with 100.0% of males and 100.0% of females in these age groups living above the poverty line.
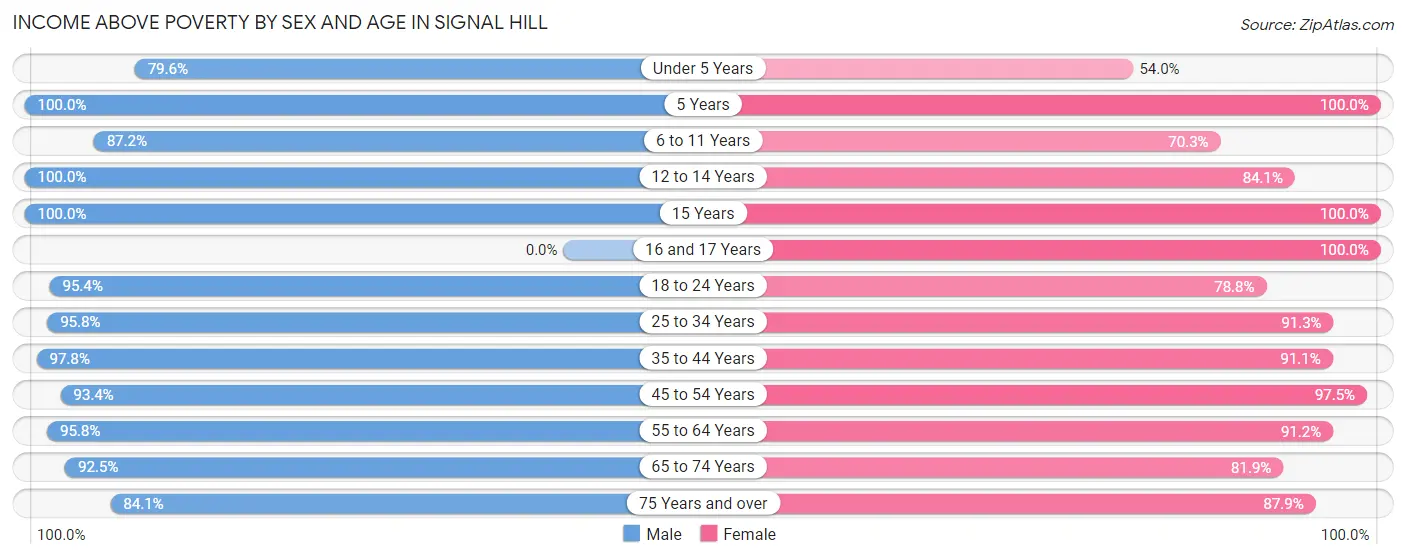
| Age Bracket | Male | Female |
| Under 5 Years | 428 (79.5%) | 123 (53.9%) |
| 5 Years | 4 (100.0%) | 54 (100.0%) |
| 6 to 11 Years | 387 (87.2%) | 208 (70.3%) |
| 12 to 14 Years | 168 (100.0%) | 243 (84.1%) |
| 15 Years | 62 (100.0%) | 45 (100.0%) |
| 16 and 17 Years | 0 (0.0%) | 149 (100.0%) |
| 18 to 24 Years | 370 (95.4%) | 286 (78.8%) |
| 25 to 34 Years | 1,164 (95.8%) | 1,168 (91.2%) |
| 35 to 44 Years | 881 (97.8%) | 643 (91.1%) |
| 45 to 54 Years | 940 (93.3%) | 886 (97.5%) |
| 55 to 64 Years | 575 (95.8%) | 609 (91.2%) |
| 65 to 74 Years | 234 (92.5%) | 444 (81.9%) |
| 75 Years and over | 190 (84.1%) | 255 (87.9%) |
| Total | 5,403 (93.1%) | 5,113 (87.9%) |
Income Below Poverty Among Married-Couple Families in Signal Hill
The poverty statistics for married-couple families in Signal Hill show that 5.7% or 98 of the total 1,714 families live below the poverty line. Families with 1 or 2 children have the highest poverty rate of 7.0%, comprising of 44 families. On the other hand, families with 3 or 4 children have the lowest poverty rate of 0.0%, which includes 0 families.
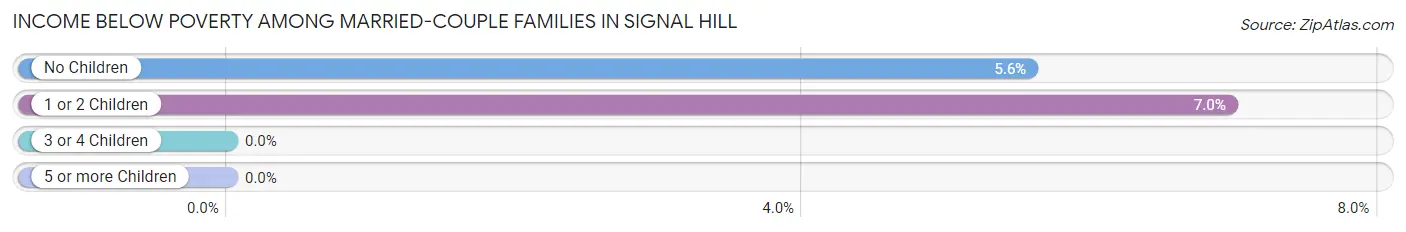
| Children | Above Poverty | Below Poverty |
| No Children | 915 (94.4%) | 54 (5.6%) |
| 1 or 2 Children | 588 (93.0%) | 44 (7.0%) |
| 3 or 4 Children | 113 (100.0%) | 0 (0.0%) |
| 5 or more Children | 0 (0.0%) | 0 (0.0%) |
| Total | 1,616 (94.3%) | 98 (5.7%) |
Income Below Poverty Among Single-Parent Households in Signal Hill
According to the poverty data in Signal Hill, 1.7% or 5 single-father households and 19.0% or 110 single-mother households are living below the poverty line. Among single-father households, those with no children have the highest poverty rate, with 5 households (3.1%) experiencing poverty. Likewise, among single-mother households, those with 3 or 4 children have the highest poverty rate, with 94 households (100.0%) falling below the poverty line.
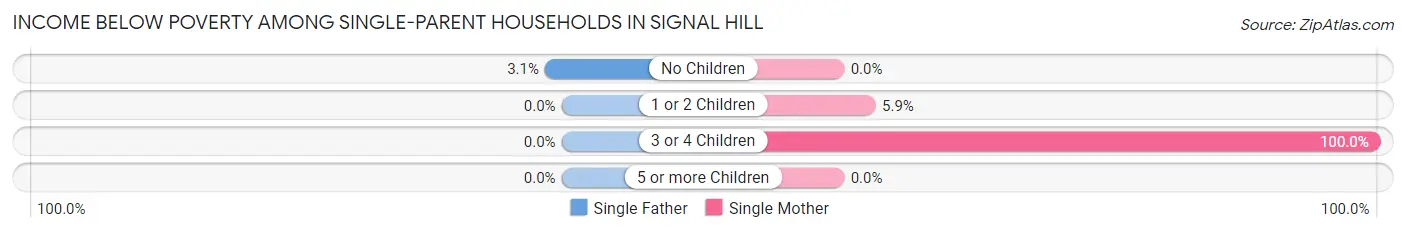
| Children | Single Father | Single Mother |
| No Children | 5 (3.1%) | 0 (0.0%) |
| 1 or 2 Children | 0 (0.0%) | 16 (5.9%) |
| 3 or 4 Children | 0 (0.0%) | 94 (100.0%) |
| 5 or more Children | 0 (0.0%) | 0 (0.0%) |
| Total | 5 (1.7%) | 110 (19.0%) |
Income Below Poverty Among Married-Couple vs Single-Parent Households in Signal Hill
The poverty data for Signal Hill shows that 98 of the married-couple family households (5.7%) and 115 of the single-parent households (13.3%) are living below the poverty level. Within the married-couple family households, those with 1 or 2 children have the highest poverty rate, with 44 households (7.0%) falling below the poverty line. Among the single-parent households, those with 3 or 4 children have the highest poverty rate, with 94 household (100.0%) living below poverty.
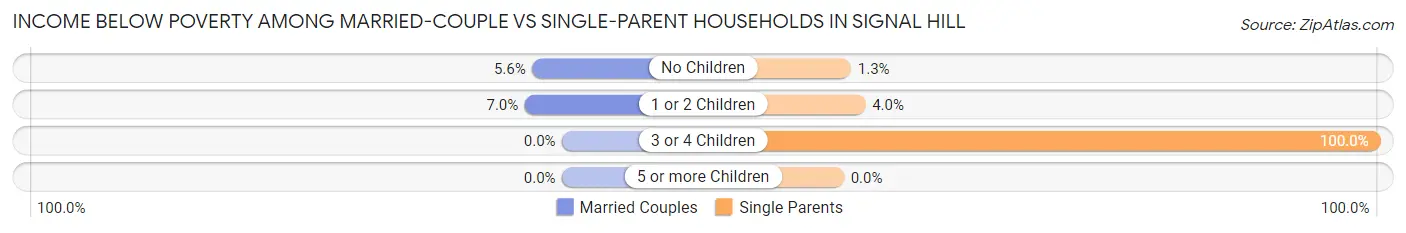
| Children | Married-Couple Families | Single-Parent Households |
| No Children | 54 (5.6%) | 5 (1.3%) |
| 1 or 2 Children | 44 (7.0%) | 16 (4.0%) |
| 3 or 4 Children | 0 (0.0%) | 94 (100.0%) |
| 5 or more Children | 0 (0.0%) | 0 (0.0%) |
| Total | 98 (5.7%) | 115 (13.3%) |
Race in Signal Hill
The most populous races in Signal Hill are Hispanic or Latino (4,621 | 39.6%), White / Caucasian (4,618 | 39.5%), and Asian (2,643 | 22.6%).
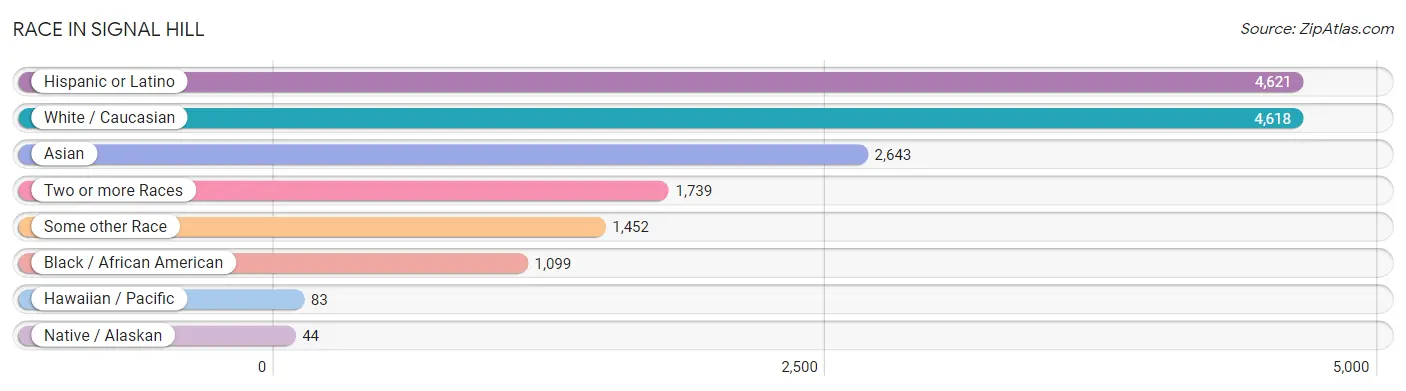
| Race | # Population | % Population |
| Asian | 2,643 | 22.6% |
| Black / African American | 1,099 | 9.4% |
| Hawaiian / Pacific | 83 | 0.7% |
| Hispanic or Latino | 4,621 | 39.6% |
| Native / Alaskan | 44 | 0.4% |
| White / Caucasian | 4,618 | 39.5% |
| Two or more Races | 1,739 | 14.9% |
| Some other Race | 1,452 | 12.4% |
| Total | 11,678 | 100.0% |
Ancestry in Signal Hill
The most populous ancestries reported in Signal Hill are Mexican (3,984 | 34.1%), Korean (1,187 | 10.2%), Japanese (1,041 | 8.9%), English (689 | 5.9%), and Irish (533 | 4.6%), together accounting for 63.6% of all Signal Hill residents.
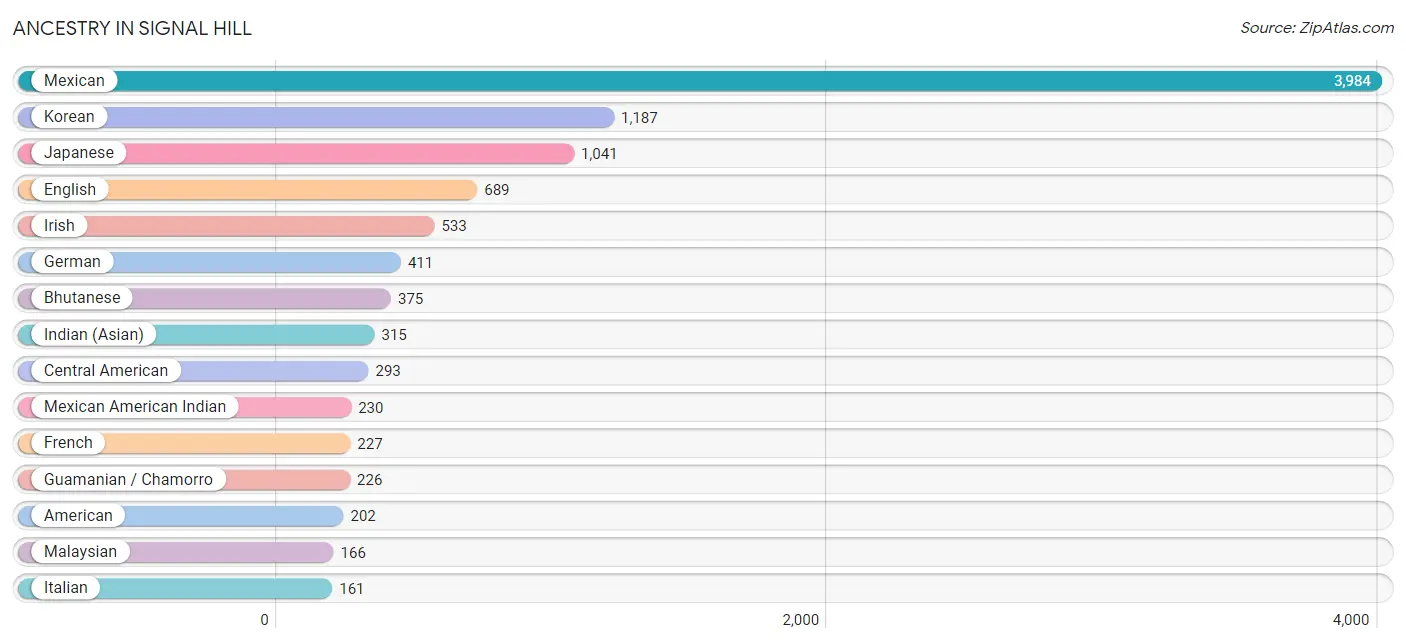
| Ancestry | # Population | % Population |
| African | 123 | 1.1% |
| American | 202 | 1.7% |
| Apache | 15 | 0.1% |
| Arab | 154 | 1.3% |
| Armenian | 5 | 0.0% |
| Austrian | 6 | 0.1% |
| Belgian | 6 | 0.1% |
| Bhutanese | 375 | 3.2% |
| Brazilian | 24 | 0.2% |
| British | 4 | 0.0% |
| Burmese | 127 | 1.1% |
| Canadian | 16 | 0.1% |
| Central American | 293 | 2.5% |
| Central American Indian | 156 | 1.3% |
| Cherokee | 8 | 0.1% |
| Chilean | 14 | 0.1% |
| Chippewa | 6 | 0.1% |
| Colombian | 8 | 0.1% |
| Costa Rican | 7 | 0.1% |
| Croatian | 11 | 0.1% |
| Danish | 20 | 0.2% |
| Dominican | 82 | 0.7% |
| Dutch | 34 | 0.3% |
| Eastern European | 18 | 0.2% |
| Ecuadorian | 8 | 0.1% |
| Egyptian | 18 | 0.2% |
| English | 689 | 5.9% |
| European | 105 | 0.9% |
| Finnish | 33 | 0.3% |
| French | 227 | 1.9% |
| French Canadian | 15 | 0.1% |
| German | 411 | 3.5% |
| Greek | 17 | 0.2% |
| Guamanian / Chamorro | 226 | 1.9% |
| Guatemalan | 27 | 0.2% |
| Honduran | 26 | 0.2% |
| Hungarian | 25 | 0.2% |
| Indian (Asian) | 315 | 2.7% |
| Indonesian | 25 | 0.2% |
| Iranian | 54 | 0.5% |
| Irish | 533 | 4.6% |
| Iroquois | 16 | 0.1% |
| Israeli | 6 | 0.1% |
| Italian | 161 | 1.4% |
| Japanese | 1,041 | 8.9% |
| Korean | 1,187 | 10.2% |
| Lithuanian | 19 | 0.2% |
| Malaysian | 166 | 1.4% |
| Mexican | 3,984 | 34.1% |
| Mexican American Indian | 230 | 2.0% |
| Native Hawaiian | 19 | 0.2% |
| Nicaraguan | 57 | 0.5% |
| Northern European | 23 | 0.2% |
| Norwegian | 51 | 0.4% |
| Pakistani | 14 | 0.1% |
| Palestinian | 10 | 0.1% |
| Panamanian | 129 | 1.1% |
| Pennsylvania German | 16 | 0.1% |
| Peruvian | 3 | 0.0% |
| Polish | 72 | 0.6% |
| Portuguese | 43 | 0.4% |
| Puerto Rican | 51 | 0.4% |
| Romanian | 11 | 0.1% |
| Russian | 113 | 1.0% |
| Salvadoran | 47 | 0.4% |
| Samoan | 43 | 0.4% |
| Scandinavian | 19 | 0.2% |
| Scottish | 35 | 0.3% |
| South American | 33 | 0.3% |
| Spaniard | 40 | 0.3% |
| Spanish | 65 | 0.6% |
| Sri Lankan | 149 | 1.3% |
| Subsaharan African | 123 | 1.1% |
| Swedish | 28 | 0.2% |
| Thai | 23 | 0.2% |
| Tohono O'Odham | 21 | 0.2% |
| Ukrainian | 6 | 0.1% |
| Vietnamese | 24 | 0.2% |
| Welsh | 27 | 0.2% |
| Yaqui | 13 | 0.1% |
| Yuman | 9 | 0.1% | View All 81 Rows |
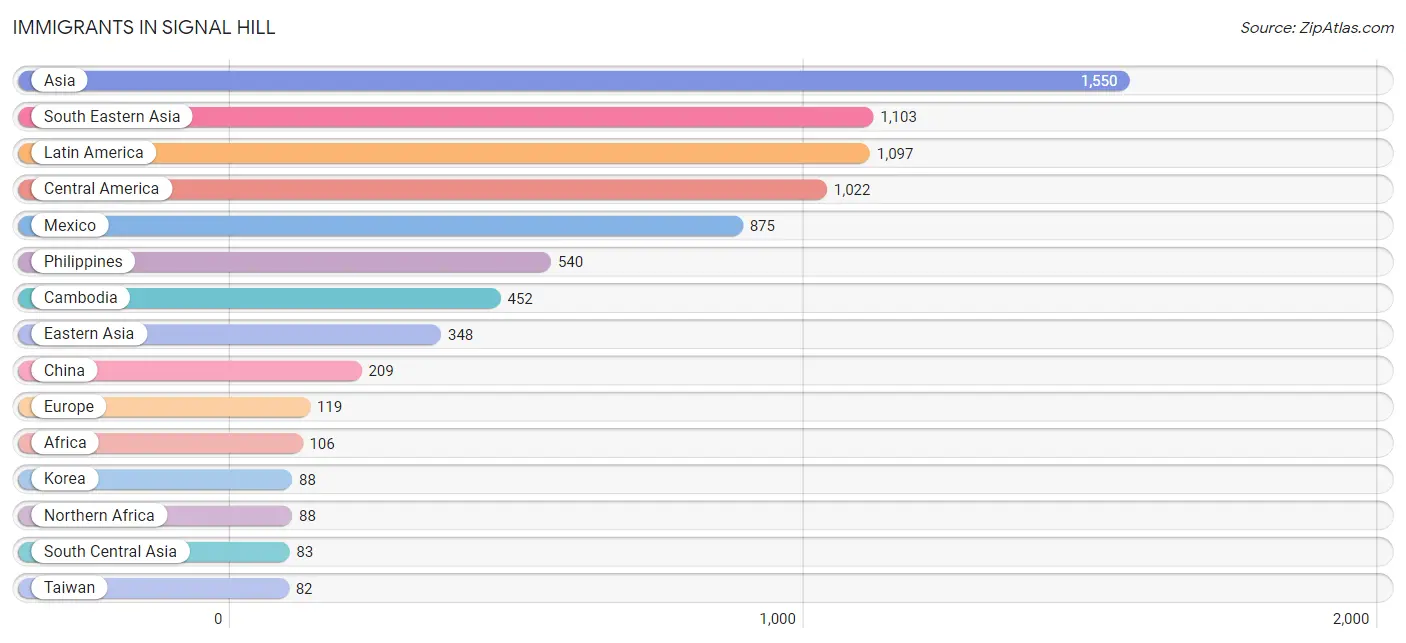
Immigrants in Signal Hill
The most numerous immigrant groups reported in Signal Hill came from Asia (1,550 | 13.3%), South Eastern Asia (1,103 | 9.5%), Latin America (1,097 | 9.4%), Central America (1,022 | 8.7%), and Mexico (875 | 7.5%), together accounting for 48.3% of all Signal Hill residents.
| Immigration Origin | # Population | % Population |
| Africa | 106 | 0.9% |
| Asia | 1,550 | 13.3% |
| Bangladesh | 24 | 0.2% |
| Brazil | 24 | 0.2% |
| Cambodia | 452 | 3.9% |
| Canada | 17 | 0.2% |
| Caribbean | 32 | 0.3% |
| Central America | 1,022 | 8.7% |
| China | 209 | 1.8% |
| Colombia | 8 | 0.1% |
| Costa Rica | 7 | 0.1% |
| Dominican Republic | 32 | 0.3% |
| Eastern Asia | 348 | 3.0% |
| Eastern Europe | 25 | 0.2% |
| Ecuador | 8 | 0.1% |
| Egypt | 10 | 0.1% |
| El Salvador | 57 | 0.5% |
| England | 56 | 0.5% |
| Europe | 119 | 1.0% |
| Germany | 18 | 0.2% |
| Ghana | 18 | 0.2% |
| Honduras | 26 | 0.2% |
| Hong Kong | 18 | 0.2% |
| India | 7 | 0.1% |
| Iran | 39 | 0.3% |
| Israel | 6 | 0.1% |
| Japan | 51 | 0.4% |
| Korea | 88 | 0.7% |
| Latin America | 1,097 | 9.4% |
| Mexico | 875 | 7.5% |
| Morocco | 78 | 0.7% |
| Nicaragua | 57 | 0.5% |
| Northern Africa | 88 | 0.7% |
| Northern Europe | 76 | 0.6% |
| Norway | 20 | 0.2% |
| Peru | 3 | 0.0% |
| Philippines | 540 | 4.6% |
| Romania | 25 | 0.2% |
| South America | 43 | 0.4% |
| South Central Asia | 83 | 0.7% |
| South Eastern Asia | 1,103 | 9.5% |
| Sri Lanka | 13 | 0.1% |
| Taiwan | 82 | 0.7% |
| Thailand | 31 | 0.3% |
| Vietnam | 68 | 0.6% |
| Western Africa | 18 | 0.2% |
| Western Asia | 6 | 0.1% |
| Western Europe | 18 | 0.2% | View All 48 Rows |
Sex and Age in Signal Hill
Sex and Age in Signal Hill
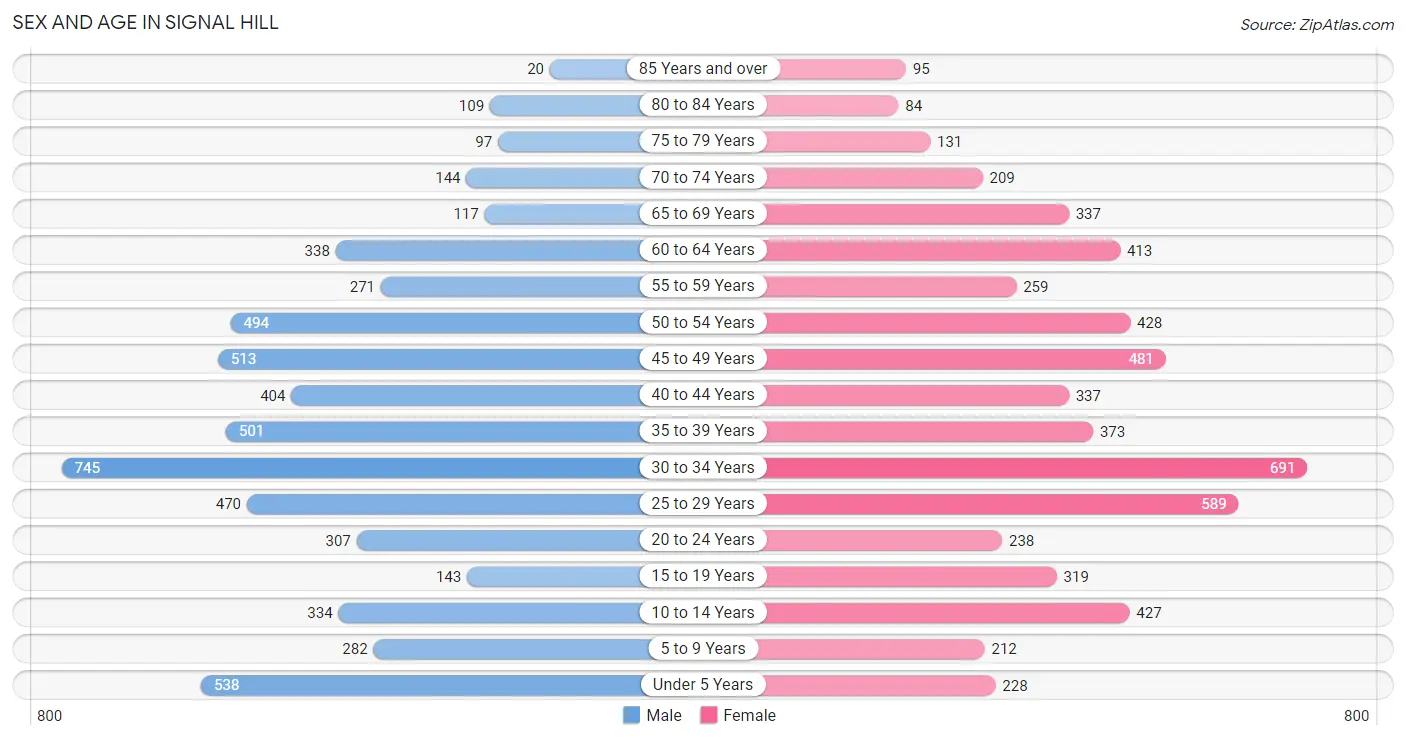
The most populous age groups in Signal Hill are 30 to 34 Years (745 | 12.8%) for men and 30 to 34 Years (691 | 11.8%) for women.
| Age Bracket | Male | Female |
| Under 5 Years | 538 (9.2%) | 228 (3.9%) |
| 5 to 9 Years | 282 (4.8%) | 212 (3.6%) |
| 10 to 14 Years | 334 (5.7%) | 427 (7.3%) |
| 15 to 19 Years | 143 (2.5%) | 319 (5.4%) |
| 20 to 24 Years | 307 (5.3%) | 238 (4.1%) |
| 25 to 29 Years | 470 (8.1%) | 589 (10.1%) |
| 30 to 34 Years | 745 (12.8%) | 691 (11.8%) |
| 35 to 39 Years | 501 (8.6%) | 373 (6.4%) |
| 40 to 44 Years | 404 (6.9%) | 337 (5.8%) |
| 45 to 49 Years | 513 (8.8%) | 481 (8.2%) |
| 50 to 54 Years | 494 (8.5%) | 428 (7.3%) |
| 55 to 59 Years | 271 (4.6%) | 259 (4.4%) |
| 60 to 64 Years | 338 (5.8%) | 413 (7.1%) |
| 65 to 69 Years | 117 (2.0%) | 337 (5.8%) |
| 70 to 74 Years | 144 (2.5%) | 209 (3.6%) |
| 75 to 79 Years | 97 (1.7%) | 131 (2.2%) |
| 80 to 84 Years | 109 (1.9%) | 84 (1.4%) |
| 85 Years and over | 20 (0.3%) | 95 (1.6%) |
| Total | 5,827 (100.0%) | 5,851 (100.0%) |
Families and Households in Signal Hill
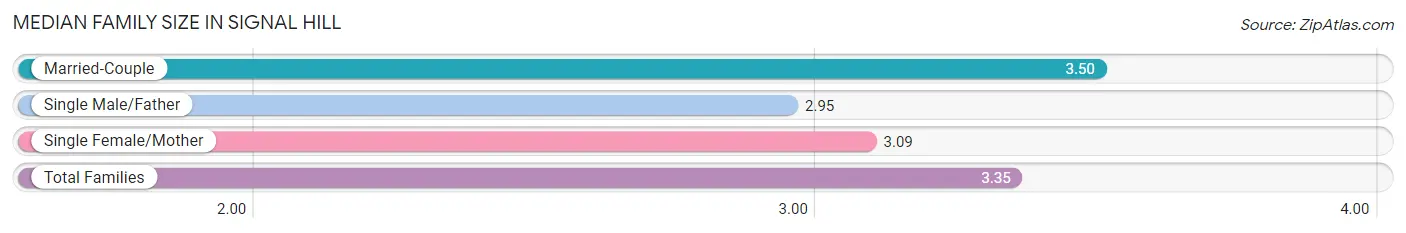
Median Family Size in Signal Hill
The median family size in Signal Hill is 3.35 persons per family, with married-couple families (1,714 | 66.4%) accounting for the largest median family size of 3.5 persons per family. On the other hand, single male/father families (287 | 11.1%) represent the smallest median family size with 2.95 persons per family.
| Family Type | # Families | Family Size |
| Married-Couple | 1,714 (66.4%) | 3.50 |
| Single Male/Father | 287 (11.1%) | 2.95 |
| Single Female/Mother | 580 (22.5%) | 3.09 |
| Total Families | 2,581 (100.0%) | 3.35 |
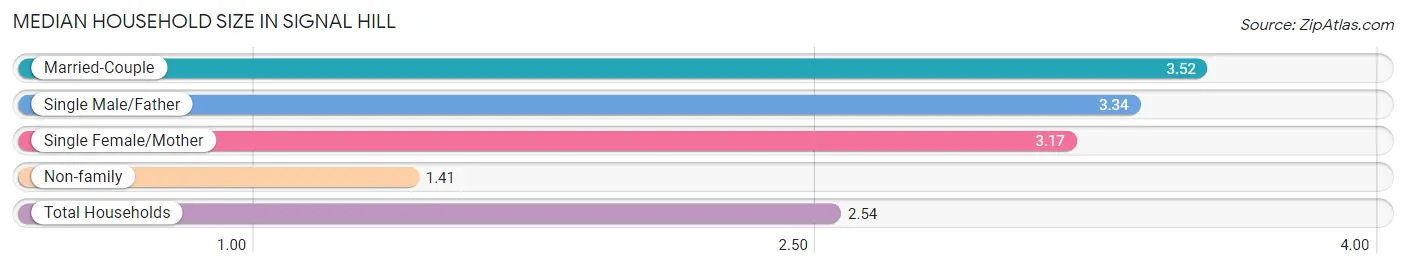
Median Household Size in Signal Hill
The median household size in Signal Hill is 2.54 persons per household, with married-couple households (1,714 | 37.6%) accounting for the largest median household size of 3.52 persons per household. non-family households (1,982 | 43.4%) represent the smallest median household size with 1.41 persons per household.
| Household Type | # Households | Household Size |
| Married-Couple | 1,714 (37.6%) | 3.52 |
| Single Male/Father | 287 (6.3%) | 3.34 |
| Single Female/Mother | 580 (12.7%) | 3.17 |
| Non-family | 1,982 (43.4%) | 1.41 |
| Total Households | 4,563 (100.0%) | 2.54 |
Household Size by Marriage Status in Signal Hill
Out of a total of 4,563 households in Signal Hill, 2,581 (56.6%) are family households, while 1,982 (43.4%) are nonfamily households. The most numerous type of family households are 2-person households, comprising 966, and the most common type of nonfamily households are 1-person households, comprising 1,351.
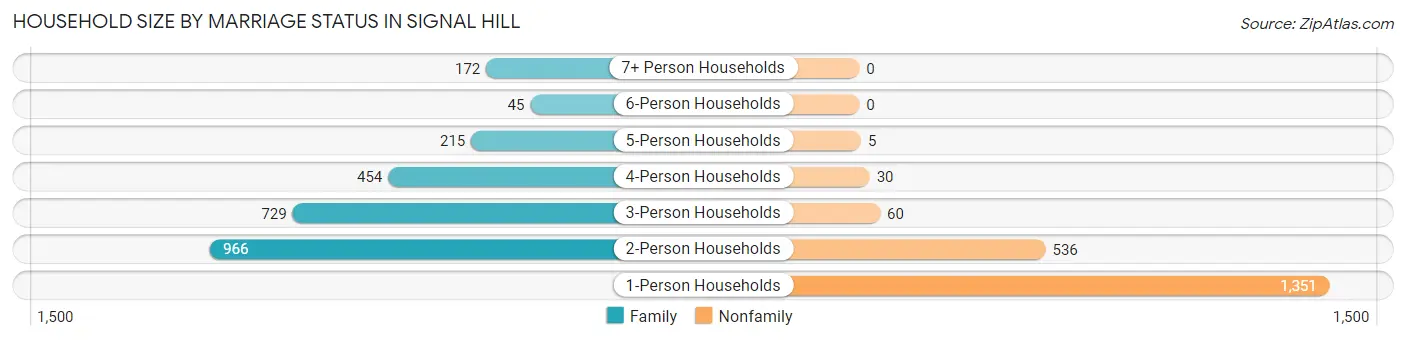
| Household Size | Family Households | Nonfamily Households |
| 1-Person Households | - | 1,351 (29.6%) |
| 2-Person Households | 966 (21.2%) | 536 (11.7%) |
| 3-Person Households | 729 (16.0%) | 60 (1.3%) |
| 4-Person Households | 454 (10.0%) | 30 (0.7%) |
| 5-Person Households | 215 (4.7%) | 5 (0.1%) |
| 6-Person Households | 45 (1.0%) | 0 (0.0%) |
| 7+ Person Households | 172 (3.8%) | 0 (0.0%) |
| Total | 2,581 (56.6%) | 1,982 (43.4%) |
Female Fertility in Signal Hill
Fertility by Age in Signal Hill
Average fertility rate in Signal Hill is 30.0 births per 1,000 women. Women in the age bracket of 20 to 34 years have the highest fertility rate with 56.0 births per 1,000 women. Women in the age bracket of 20 to 34 years acount for 92.4% of all women with births.
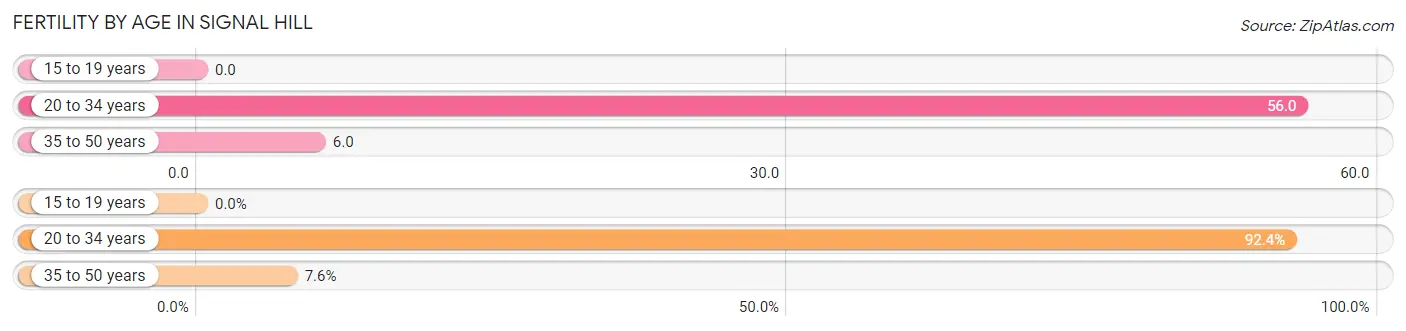
| Age Bracket | Women with Births | Births / 1,000 Women |
| 15 to 19 years | 0 (0.0%) | 0.0 |
| 20 to 34 years | 85 (92.4%) | 56.0 |
| 35 to 50 years | 7 (7.6%) | 6.0 |
| Total | 92 (100.0%) | 30.0 |
Fertility by Age by Marriage Status in Signal Hill
44.6% of women with births (92) in Signal Hill are married. The highest percentage of unmarried women with births falls into 20 to 34 years age bracket with 60.0% of them unmarried at the time of birth, while the lowest percentage of unmarried women with births belong to 35 to 50 years age bracket with 0.0% of them unmarried.
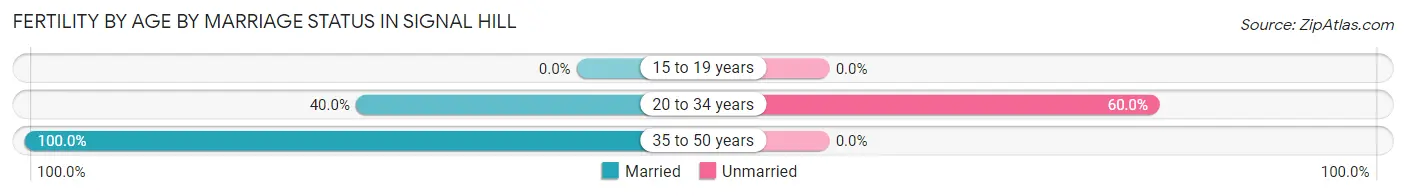
| Age Bracket | Married | Unmarried |
| 15 to 19 years | 0 (0.0%) | 0 (0.0%) |
| 20 to 34 years | 34 (40.0%) | 51 (60.0%) |
| 35 to 50 years | 7 (100.0%) | 0 (0.0%) |
| Total | 41 (44.6%) | 51 (55.4%) |
Fertility by Education in Signal Hill
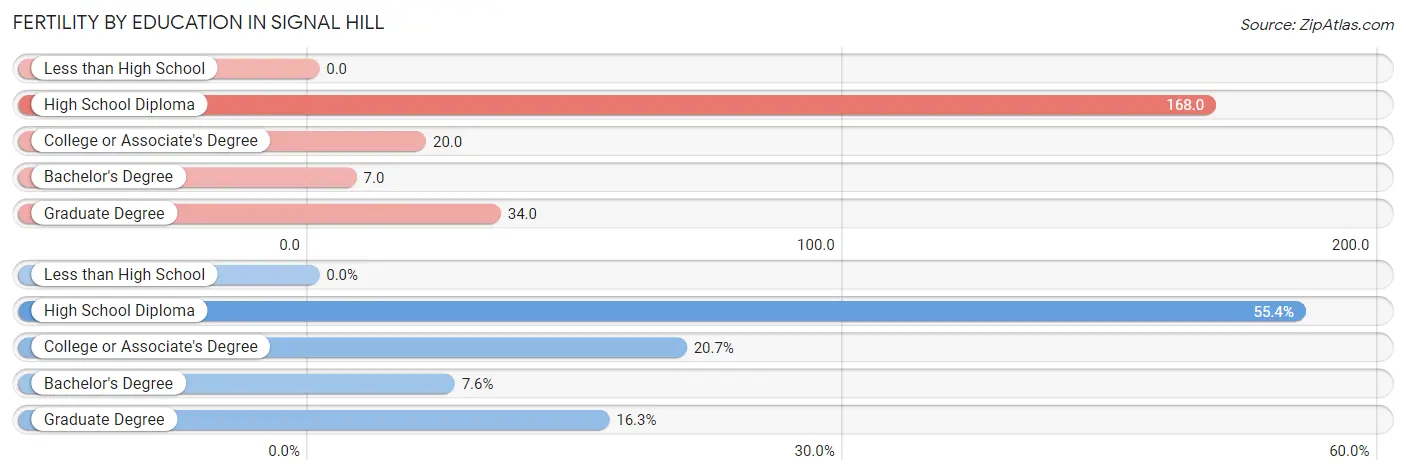
| Educational Attainment | Women with Births | Births / 1,000 Women |
| Less than High School | 0 (0.0%) | 0.0 |
| High School Diploma | 51 (55.4%) | 168.0 |
| College or Associate's Degree | 19 (20.6%) | 20.0 |
| Bachelor's Degree | 7 (7.6%) | 7.0 |
| Graduate Degree | 15 (16.3%) | 34.0 |
| Total | 92 (100.0%) | 30.0 |
Fertility by Education by Marriage Status in Signal Hill
55.4% of women with births in Signal Hill are unmarried. Women with the educational attainment of college or associate's degree are most likely to be married with 100.0% of them married at childbirth, while women with the educational attainment of high school diploma are least likely to be married with 100.0% of them unmarried at childbirth.
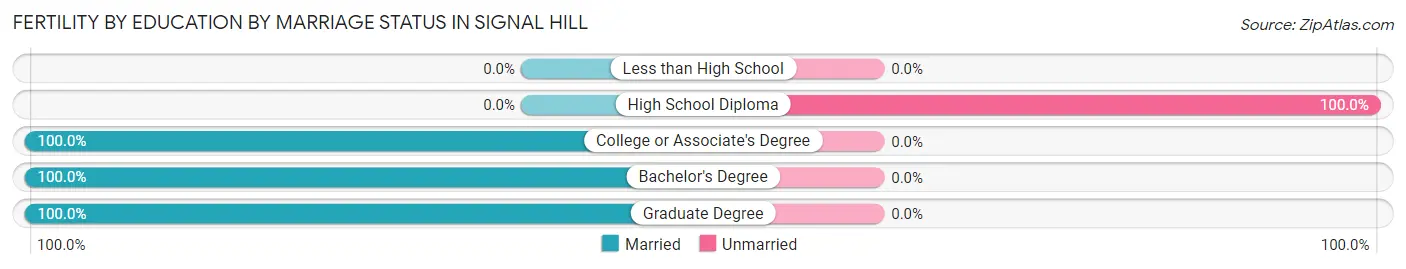
| Educational Attainment | Married | Unmarried |
| Less than High School | 0 (0.0%) | 0 (0.0%) |
| High School Diploma | 0 (0.0%) | 51 (100.0%) |
| College or Associate's Degree | 19 (100.0%) | 0 (0.0%) |
| Bachelor's Degree | 7 (100.0%) | 0 (0.0%) |
| Graduate Degree | 15 (100.0%) | 0 (0.0%) |
| Total | 41 (44.6%) | 51 (55.4%) |
Employment Characteristics in Signal Hill
Employment by Class of Employer in Signal Hill
Among the 6,329 employed individuals in Signal Hill, private company employees (3,969 | 62.7%), local government employees (729 | 11.5%), and not-for-profit organizations (582 | 9.2%) make up the most common classes of employment.
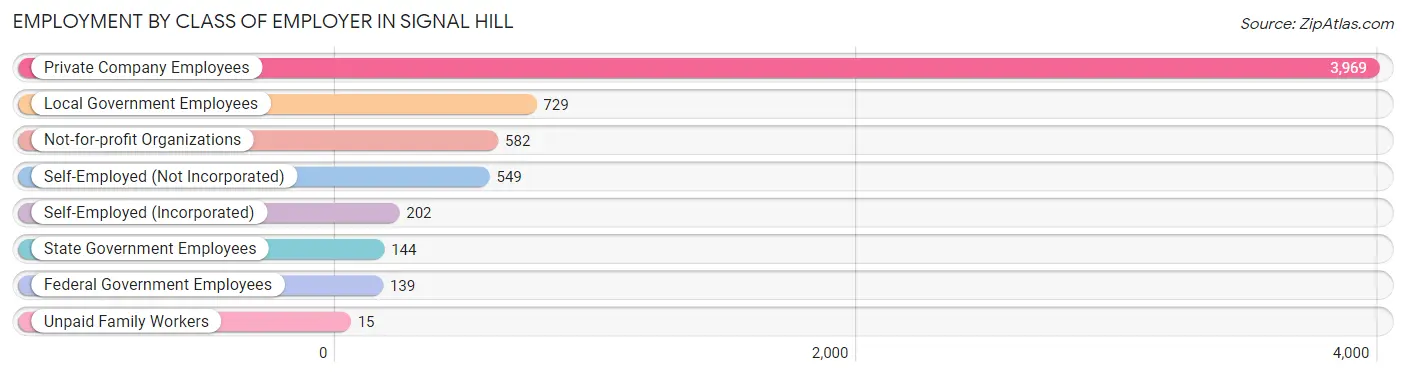
| Employer Class | # Employees | % Employees |
| Private Company Employees | 3,969 | 62.7% |
| Self-Employed (Incorporated) | 202 | 3.2% |
| Self-Employed (Not Incorporated) | 549 | 8.7% |
| Not-for-profit Organizations | 582 | 9.2% |
| Local Government Employees | 729 | 11.5% |
| State Government Employees | 144 | 2.3% |
| Federal Government Employees | 139 | 2.2% |
| Unpaid Family Workers | 15 | 0.2% |
| Total | 6,329 | 100.0% |
Employment Status by Age in Signal Hill
According to the labor force statistics for Signal Hill, out of the total population over 16 years of age (9,550), 70.6% or 6,742 individuals are in the labor force, with 4.6% or 310 of them unemployed. The age group with the highest labor force participation rate is 30 to 34 years, with 91.4% or 1,313 individuals in the labor force. Within the labor force, the 20 to 24 years age range has the highest percentage of unemployed individuals, with 12.3% or 51 of them being unemployed.
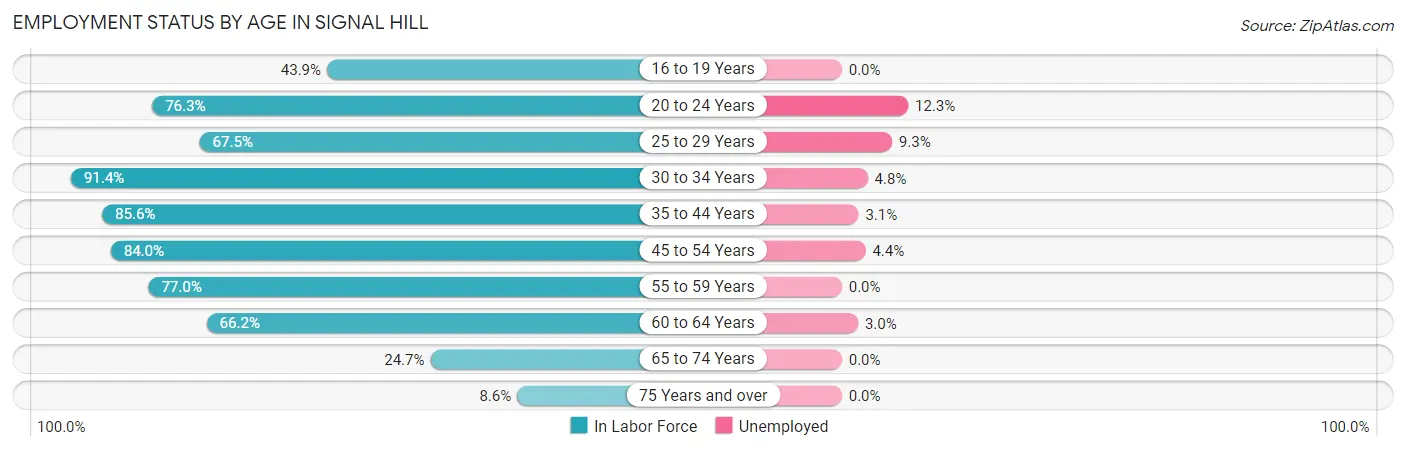
| Age Bracket | In Labor Force | Unemployed |
| 16 to 19 Years | 156 (43.9%) | 0 (0.0%) |
| 20 to 24 Years | 416 (76.3%) | 51 (12.3%) |
| 25 to 29 Years | 715 (67.5%) | 66 (9.3%) |
| 30 to 34 Years | 1,313 (91.4%) | 63 (4.8%) |
| 35 to 44 Years | 1,382 (85.6%) | 43 (3.1%) |
| 45 to 54 Years | 1,609 (84.0%) | 71 (4.4%) |
| 55 to 59 Years | 408 (77.0%) | 0 (0.0%) |
| 60 to 64 Years | 497 (66.2%) | 15 (3.0%) |
| 65 to 74 Years | 199 (24.7%) | 0 (0.0%) |
| 75 Years and over | 46 (8.6%) | 0 (0.0%) |
| Total | 6,742 (70.6%) | 310 (4.6%) |
Employment Status by Educational Attainment in Signal Hill
According to labor force statistics for Signal Hill, 81.1% of individuals (5,926) out of the total population between 25 and 64 years of age (7,307) are in the labor force, with 4.3% or 255 of them being unemployed. The group with the highest labor force participation rate are those with the educational attainment of bachelor's degree or higher, with 86.5% or 2,810 individuals in the labor force. Within the labor force, individuals with less than high school education have the highest percentage of unemployment, with 9.0% or 27 of them being unemployed.
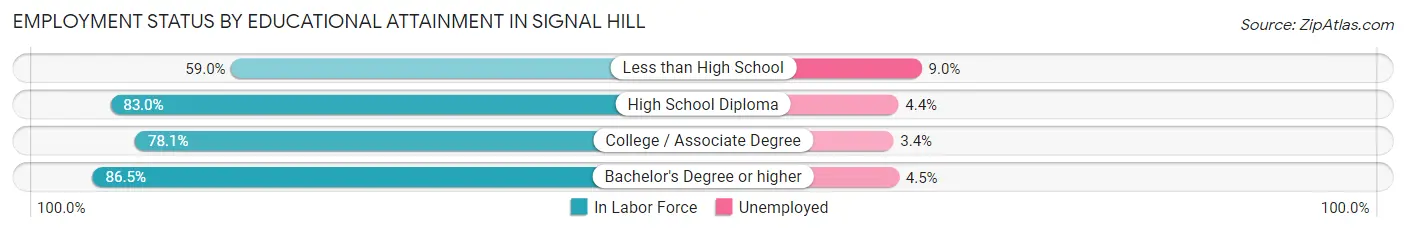
| Educational Attainment | In Labor Force | Unemployed |
| Less than High School | 299 (59.0%) | 46 (9.0%) |
| High School Diploma | 720 (83.0%) | 38 (4.4%) |
| College / Associate Degree | 2,096 (78.1%) | 91 (3.4%) |
| Bachelor's Degree or higher | 2,810 (86.5%) | 146 (4.5%) |
| Total | 5,926 (81.1%) | 314 (4.3%) |
Employment Occupations by Sex in Signal Hill
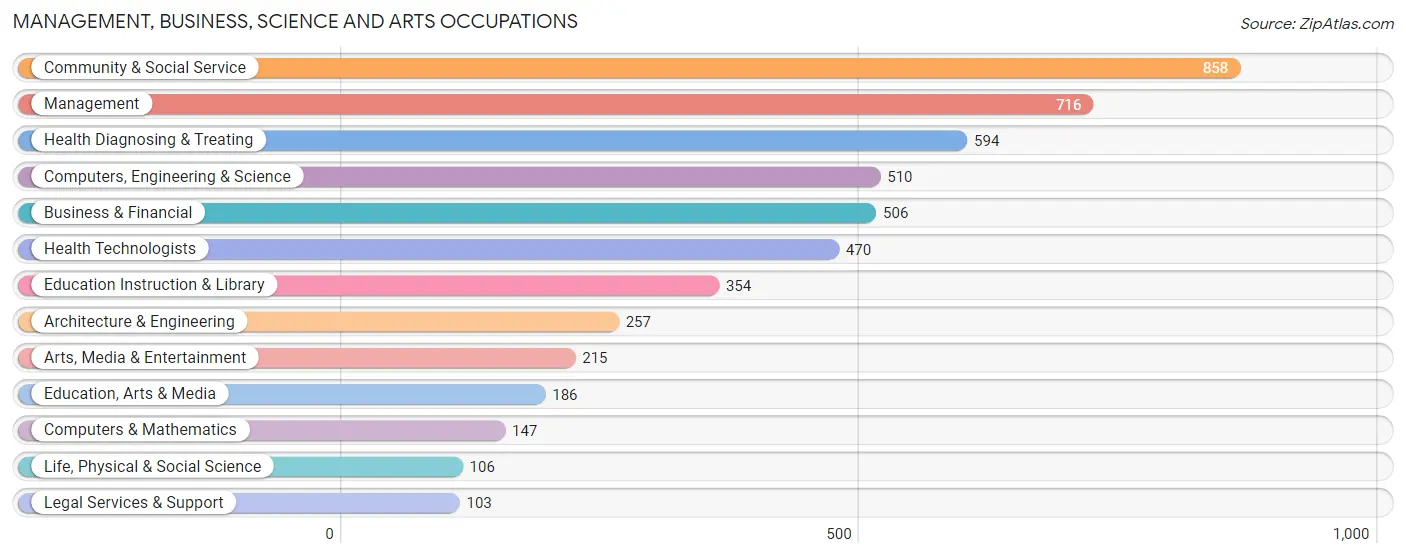
Management, Business, Science and Arts Occupations
The most common Management, Business, Science and Arts occupations in Signal Hill are Community & Social Service (858 | 13.4%), Management (716 | 11.2%), Health Diagnosing & Treating (594 | 9.3%), Computers, Engineering & Science (510 | 8.0%), and Business & Financial (506 | 7.9%).
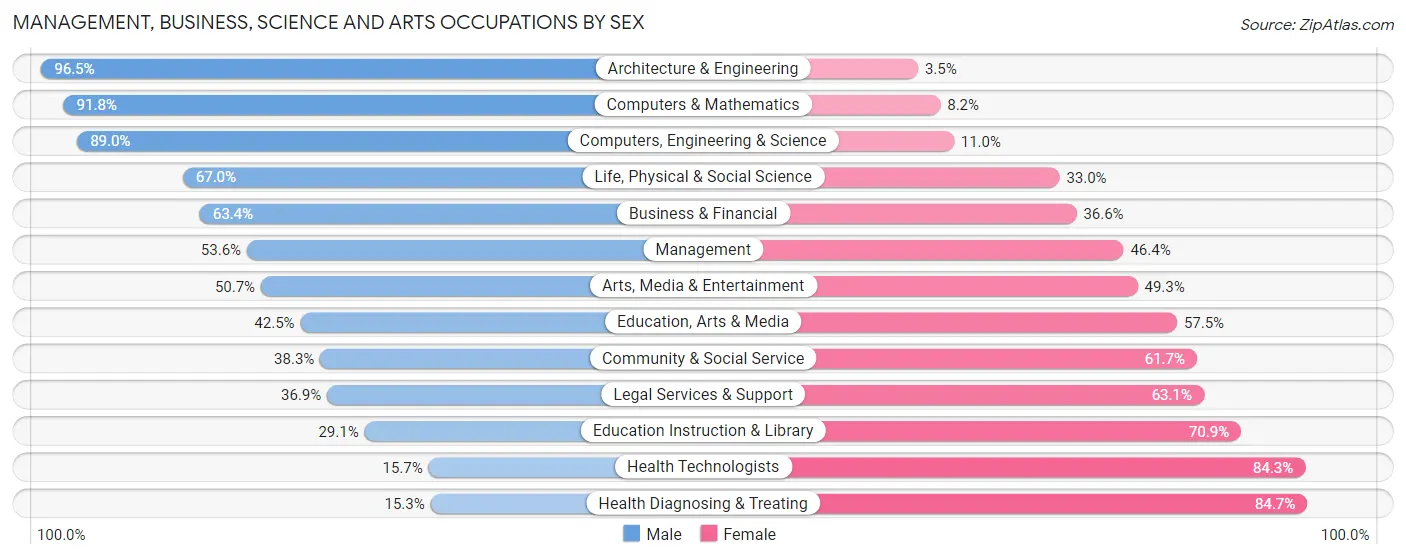
Management, Business, Science and Arts Occupations by Sex
Within the Management, Business, Science and Arts occupations in Signal Hill, the most male-oriented occupations are Architecture & Engineering (96.5%), Computers & Mathematics (91.8%), and Computers, Engineering & Science (89.0%), while the most female-oriented occupations are Health Diagnosing & Treating (84.7%), Health Technologists (84.3%), and Education Instruction & Library (70.9%).
| Occupation | Male | Female |
| Management | 384 (53.6%) | 332 (46.4%) |
| Business & Financial | 321 (63.4%) | 185 (36.6%) |
| Computers, Engineering & Science | 454 (89.0%) | 56 (11.0%) |
| Computers & Mathematics | 135 (91.8%) | 12 (8.2%) |
| Architecture & Engineering | 248 (96.5%) | 9 (3.5%) |
| Life, Physical & Social Science | 71 (67.0%) | 35 (33.0%) |
| Community & Social Service | 329 (38.3%) | 529 (61.7%) |
| Education, Arts & Media | 79 (42.5%) | 107 (57.5%) |
| Legal Services & Support | 38 (36.9%) | 65 (63.1%) |
| Education Instruction & Library | 103 (29.1%) | 251 (70.9%) |
| Arts, Media & Entertainment | 109 (50.7%) | 106 (49.3%) |
| Health Diagnosing & Treating | 91 (15.3%) | 503 (84.7%) |
| Health Technologists | 74 (15.7%) | 396 (84.3%) |
| Total (Category) | 1,579 (49.6%) | 1,605 (50.4%) |
| Total (Overall) | 3,573 (55.8%) | 2,824 (44.2%) |
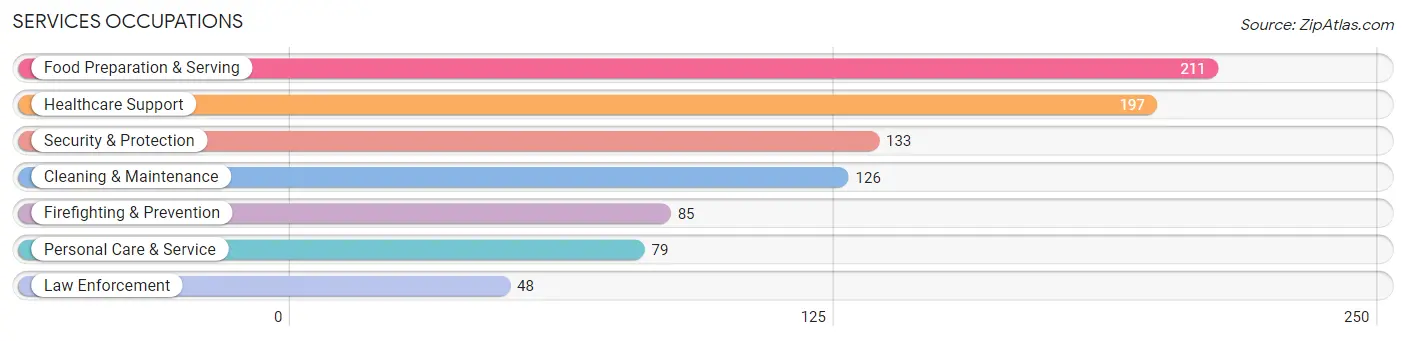
Services Occupations
The most common Services occupations in Signal Hill are Food Preparation & Serving (211 | 3.3%), Healthcare Support (197 | 3.1%), Security & Protection (133 | 2.1%), Cleaning & Maintenance (126 | 2.0%), and Firefighting & Prevention (85 | 1.3%).
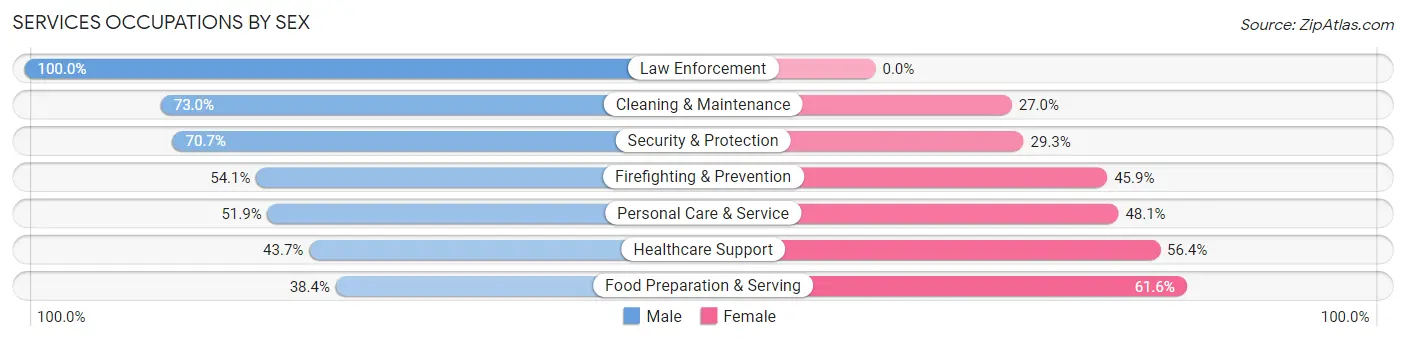
Services Occupations by Sex
Within the Services occupations in Signal Hill, the most male-oriented occupations are Law Enforcement (100.0%), Cleaning & Maintenance (73.0%), and Security & Protection (70.7%), while the most female-oriented occupations are Food Preparation & Serving (61.6%), Healthcare Support (56.4%), and Personal Care & Service (48.1%).
| Occupation | Male | Female |
| Healthcare Support | 86 (43.6%) | 111 (56.4%) |
| Security & Protection | 94 (70.7%) | 39 (29.3%) |
| Firefighting & Prevention | 46 (54.1%) | 39 (45.9%) |
| Law Enforcement | 48 (100.0%) | 0 (0.0%) |
| Food Preparation & Serving | 81 (38.4%) | 130 (61.6%) |
| Cleaning & Maintenance | 92 (73.0%) | 34 (27.0%) |
| Personal Care & Service | 41 (51.9%) | 38 (48.1%) |
| Total (Category) | 394 (52.8%) | 352 (47.2%) |
| Total (Overall) | 3,573 (55.8%) | 2,824 (44.2%) |
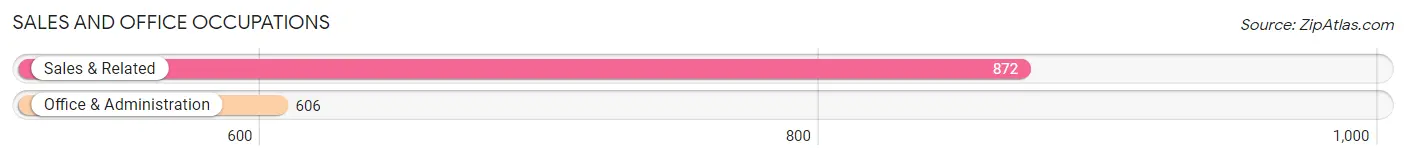
Sales and Office Occupations
The most common Sales and Office occupations in Signal Hill are Sales & Related (872 | 13.6%), and Office & Administration (606 | 9.5%).
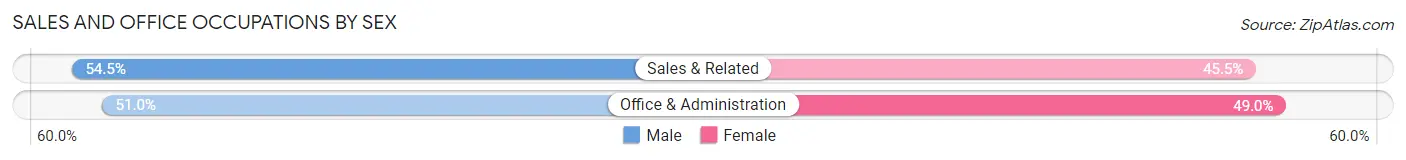
Sales and Office Occupations by Sex
| Occupation | Male | Female |
| Sales & Related | 475 (54.5%) | 397 (45.5%) |
| Office & Administration | 309 (51.0%) | 297 (49.0%) |
| Total (Category) | 784 (53.0%) | 694 (47.0%) |
| Total (Overall) | 3,573 (55.8%) | 2,824 (44.2%) |
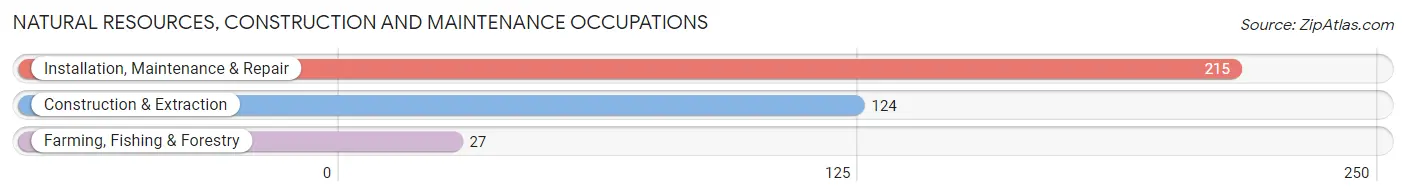
Natural Resources, Construction and Maintenance Occupations
The most common Natural Resources, Construction and Maintenance occupations in Signal Hill are Installation, Maintenance & Repair (215 | 3.4%), Construction & Extraction (124 | 1.9%), and Farming, Fishing & Forestry (27 | 0.4%).
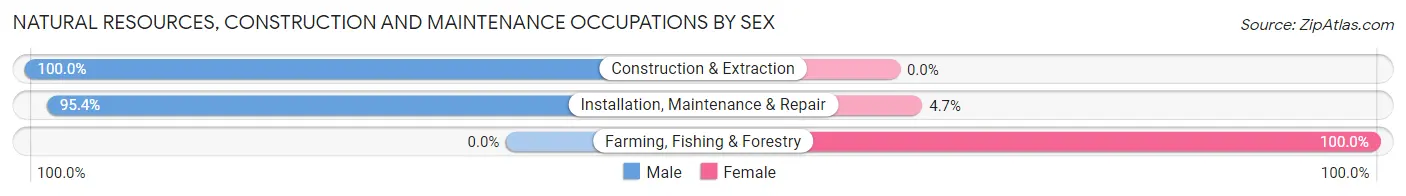
Natural Resources, Construction and Maintenance Occupations by Sex
| Occupation | Male | Female |
| Farming, Fishing & Forestry | 0 (0.0%) | 27 (100.0%) |
| Construction & Extraction | 124 (100.0%) | 0 (0.0%) |
| Installation, Maintenance & Repair | 205 (95.4%) | 10 (4.6%) |
| Total (Category) | 329 (89.9%) | 37 (10.1%) |
| Total (Overall) | 3,573 (55.8%) | 2,824 (44.2%) |
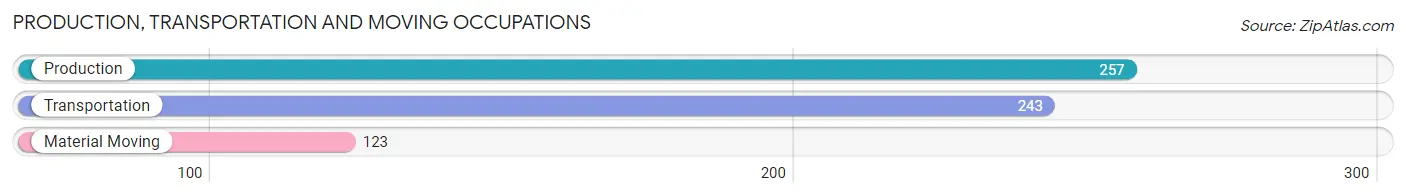
Production, Transportation and Moving Occupations
The most common Production, Transportation and Moving occupations in Signal Hill are Production (257 | 4.0%), Transportation (243 | 3.8%), and Material Moving (123 | 1.9%).
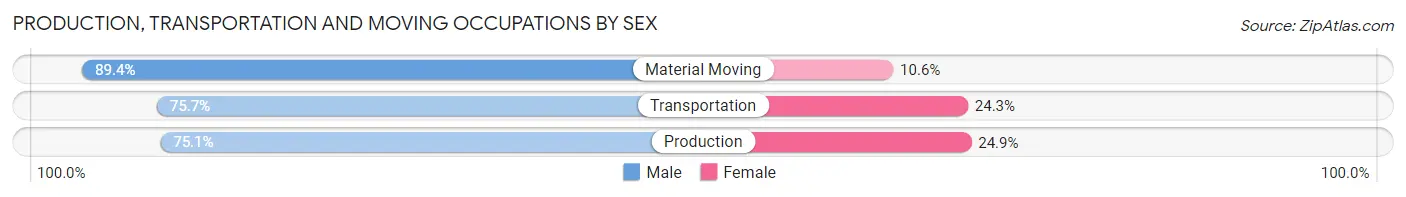
Production, Transportation and Moving Occupations by Sex
| Occupation | Male | Female |
| Production | 193 (75.1%) | 64 (24.9%) |
| Transportation | 184 (75.7%) | 59 (24.3%) |
| Material Moving | 110 (89.4%) | 13 (10.6%) |
| Total (Category) | 487 (78.2%) | 136 (21.8%) |
| Total (Overall) | 3,573 (55.8%) | 2,824 (44.2%) |
Employment Industries by Sex in Signal Hill
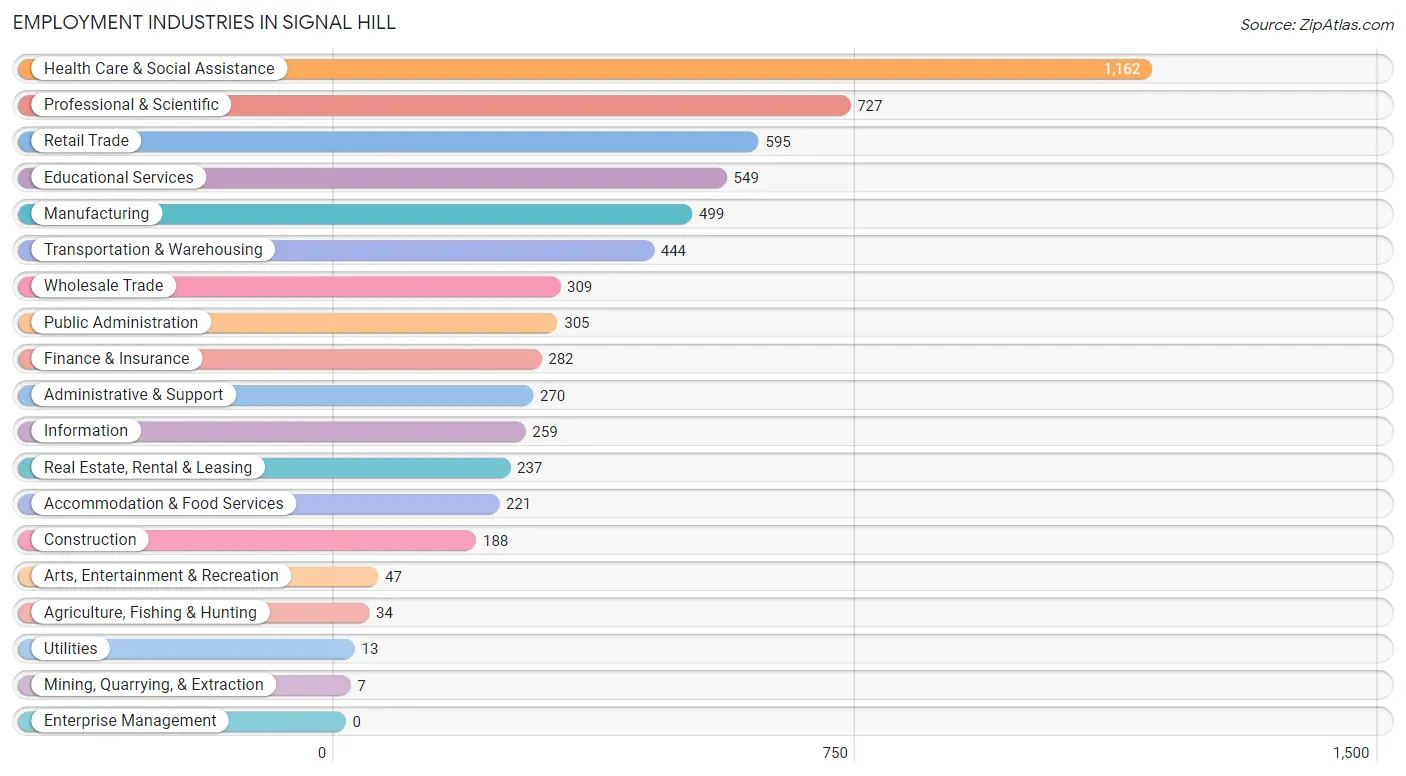
Employment Industries in Signal Hill
The major employment industries in Signal Hill include Health Care & Social Assistance (1,162 | 18.2%), Professional & Scientific (727 | 11.4%), Retail Trade (595 | 9.3%), Educational Services (549 | 8.6%), and Manufacturing (499 | 7.8%).
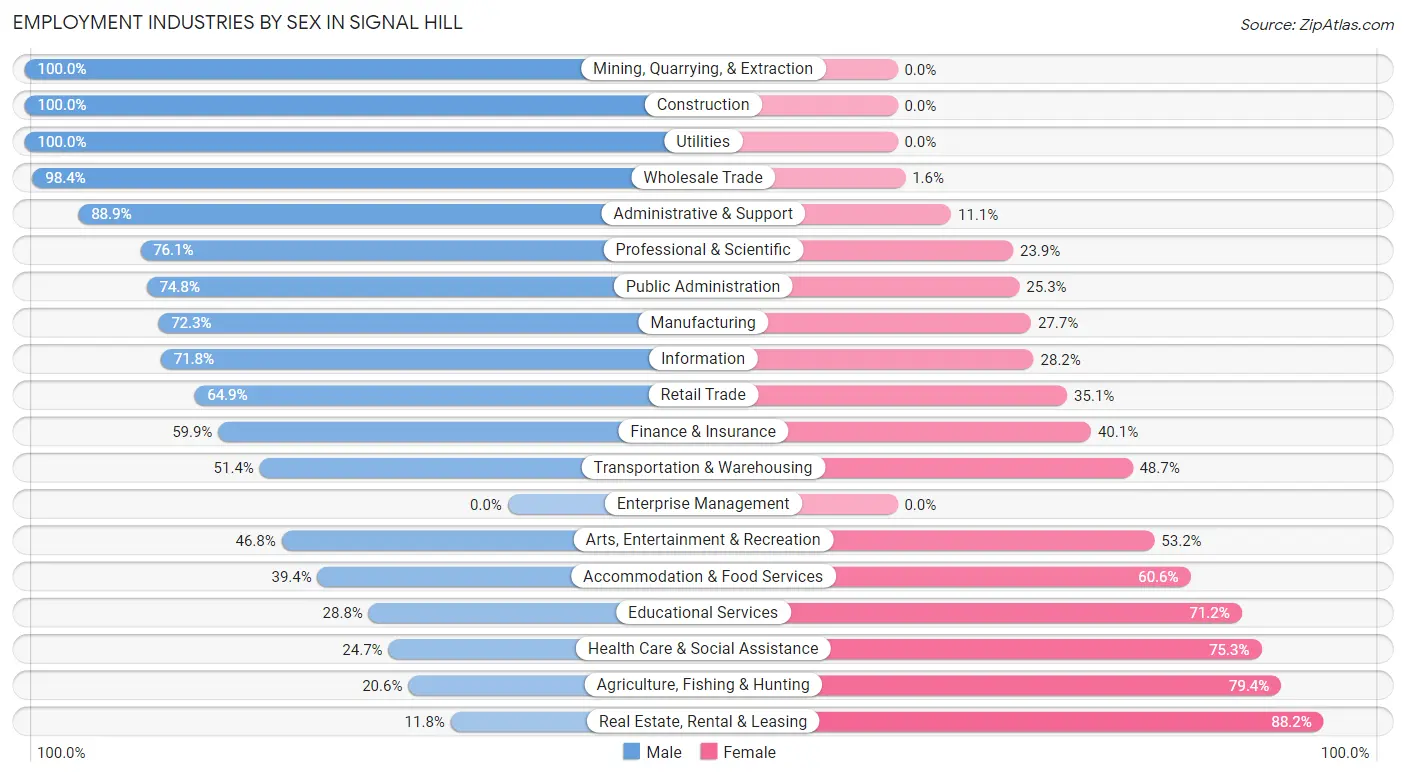
Employment Industries by Sex in Signal Hill
The Signal Hill industries that see more men than women are Mining, Quarrying, & Extraction (100.0%), Construction (100.0%), and Utilities (100.0%), whereas the industries that tend to have a higher number of women are Real Estate, Rental & Leasing (88.2%), Agriculture, Fishing & Hunting (79.4%), and Health Care & Social Assistance (75.3%).
| Industry | Male | Female |
| Agriculture, Fishing & Hunting | 7 (20.6%) | 27 (79.4%) |
| Mining, Quarrying, & Extraction | 7 (100.0%) | 0 (0.0%) |
| Construction | 188 (100.0%) | 0 (0.0%) |
| Manufacturing | 361 (72.3%) | 138 (27.7%) |
| Wholesale Trade | 304 (98.4%) | 5 (1.6%) |
| Retail Trade | 386 (64.9%) | 209 (35.1%) |
| Transportation & Warehousing | 228 (51.3%) | 216 (48.6%) |
| Utilities | 13 (100.0%) | 0 (0.0%) |
| Information | 186 (71.8%) | 73 (28.2%) |
| Finance & Insurance | 169 (59.9%) | 113 (40.1%) |
| Real Estate, Rental & Leasing | 28 (11.8%) | 209 (88.2%) |
| Professional & Scientific | 553 (76.1%) | 174 (23.9%) |
| Enterprise Management | 0 (0.0%) | 0 (0.0%) |
| Administrative & Support | 240 (88.9%) | 30 (11.1%) |
| Educational Services | 158 (28.8%) | 391 (71.2%) |
| Health Care & Social Assistance | 287 (24.7%) | 875 (75.3%) |
| Arts, Entertainment & Recreation | 22 (46.8%) | 25 (53.2%) |
| Accommodation & Food Services | 87 (39.4%) | 134 (60.6%) |
| Public Administration | 228 (74.8%) | 77 (25.3%) |
| Total | 3,573 (55.8%) | 2,824 (44.2%) |
Education in Signal Hill
School Enrollment in Signal Hill
The most common levels of schooling among the 2,666 students in Signal Hill are college / undergraduate (754 | 28.3%), middle school (641 | 24.0%), and high school (433 | 16.2%).
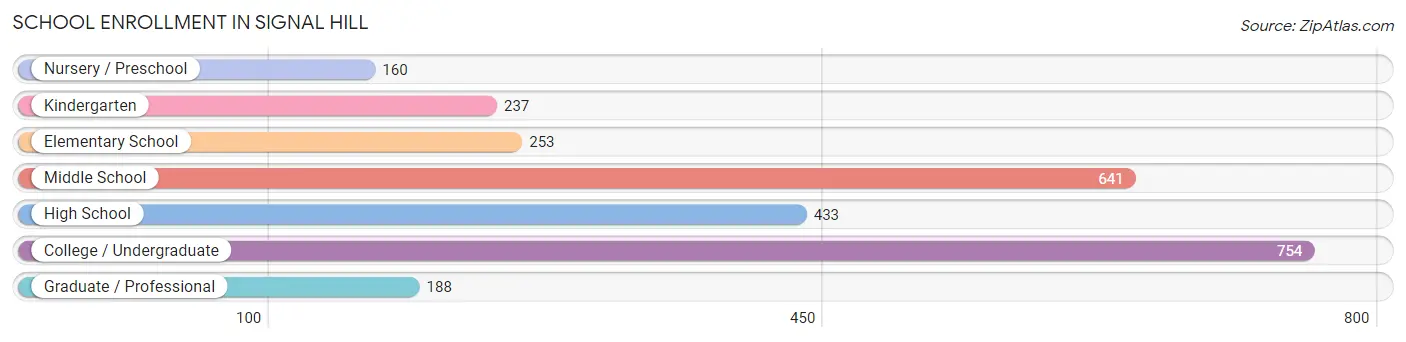
| School Level | # Students | % Students |
| Nursery / Preschool | 160 | 6.0% |
| Kindergarten | 237 | 8.9% |
| Elementary School | 253 | 9.5% |
| Middle School | 641 | 24.0% |
| High School | 433 | 16.2% |
| College / Undergraduate | 754 | 28.3% |
| Graduate / Professional | 188 | 7.0% |
| Total | 2,666 | 100.0% |
School Enrollment by Age by Funding Source in Signal Hill
Out of a total of 2,666 students who are enrolled in schools in Signal Hill, 371 (13.9%) attend a private institution, while the remaining 2,295 (86.1%) are enrolled in public schools. The age group of 3 to 4 year olds has the highest likelihood of being enrolled in private schools, with 62 (38.8% in the age bracket) enrolled. Conversely, the age group of 15 to 17 year olds has the lowest likelihood of being enrolled in a private school, with 256 (100.0% in the age bracket) attending a public institution.
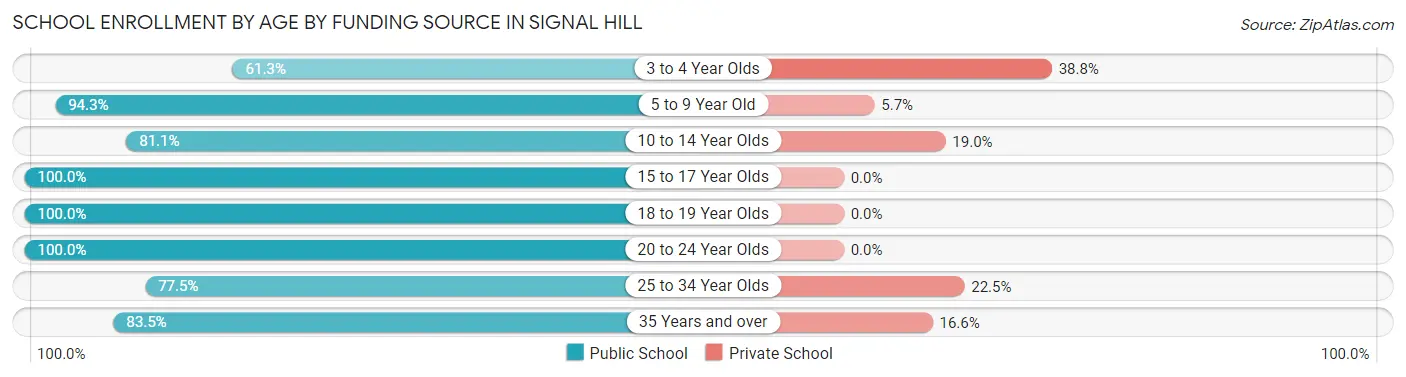
| Age Bracket | Public School | Private School |
| 3 to 4 Year Olds | 98 (61.3%) | 62 (38.8%) |
| 5 to 9 Year Old | 462 (94.3%) | 28 (5.7%) |
| 10 to 14 Year Olds | 603 (81.0%) | 141 (19.0%) |
| 15 to 17 Year Olds | 256 (100.0%) | 0 (0.0%) |
| 18 to 19 Year Olds | 141 (100.0%) | 0 (0.0%) |
| 20 to 24 Year Olds | 180 (100.0%) | 0 (0.0%) |
| 25 to 34 Year Olds | 314 (77.5%) | 91 (22.5%) |
| 35 Years and over | 242 (83.5%) | 48 (16.6%) |
| Total | 2,295 (86.1%) | 371 (13.9%) |
Educational Attainment by Field of Study in Signal Hill
Business (684 | 17.6%), visual & performing arts (451 | 11.6%), science & technology (436 | 11.2%), communications (369 | 9.5%), and social sciences (314 | 8.1%) are the most common fields of study among 3,896 individuals in Signal Hill who have obtained a bachelor's degree or higher.
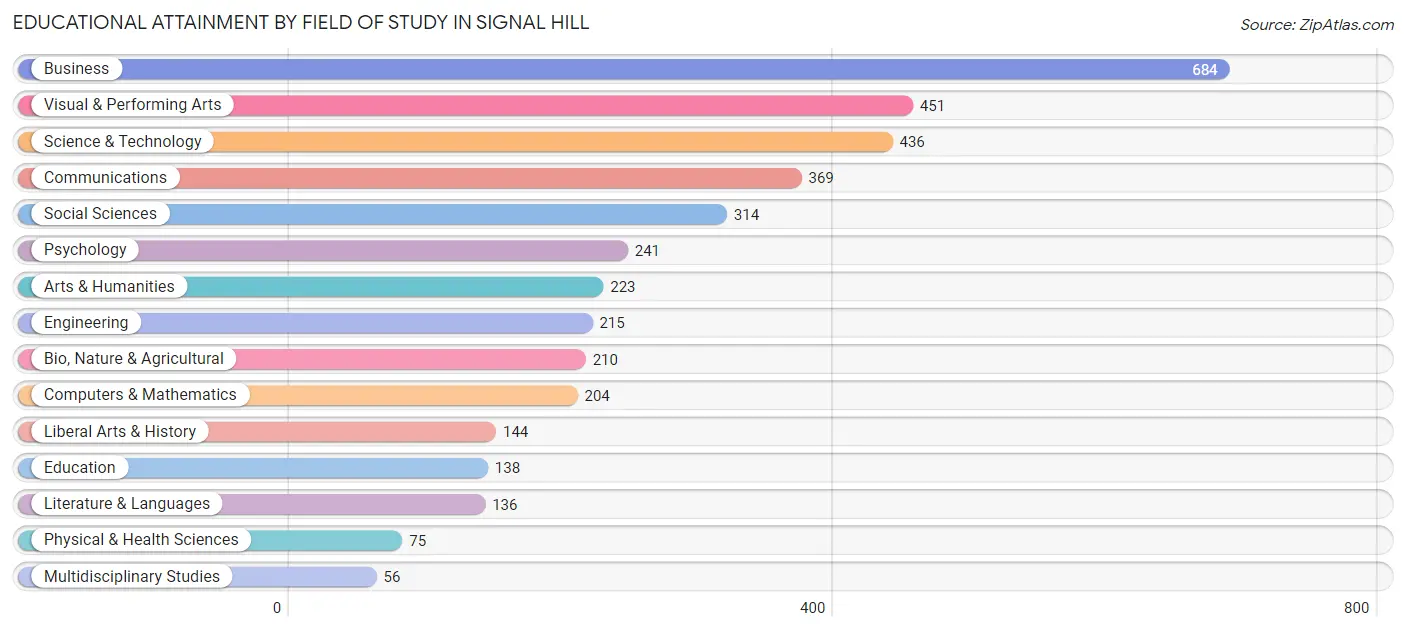
| Field of Study | # Graduates | % Graduates |
| Computers & Mathematics | 204 | 5.2% |
| Bio, Nature & Agricultural | 210 | 5.4% |
| Physical & Health Sciences | 75 | 1.9% |
| Psychology | 241 | 6.2% |
| Social Sciences | 314 | 8.1% |
| Engineering | 215 | 5.5% |
| Multidisciplinary Studies | 56 | 1.4% |
| Science & Technology | 436 | 11.2% |
| Business | 684 | 17.6% |
| Education | 138 | 3.5% |
| Literature & Languages | 136 | 3.5% |
| Liberal Arts & History | 144 | 3.7% |
| Visual & Performing Arts | 451 | 11.6% |
| Communications | 369 | 9.5% |
| Arts & Humanities | 223 | 5.7% |
| Total | 3,896 | 100.0% |
Transportation & Commute in Signal Hill
Vehicle Availability by Sex in Signal Hill
The most prevalent vehicle ownership categories in Signal Hill are males with 2 vehicles (1,928, accounting for 54.4%) and females with 2 vehicles (1,071, making up 69.5%).
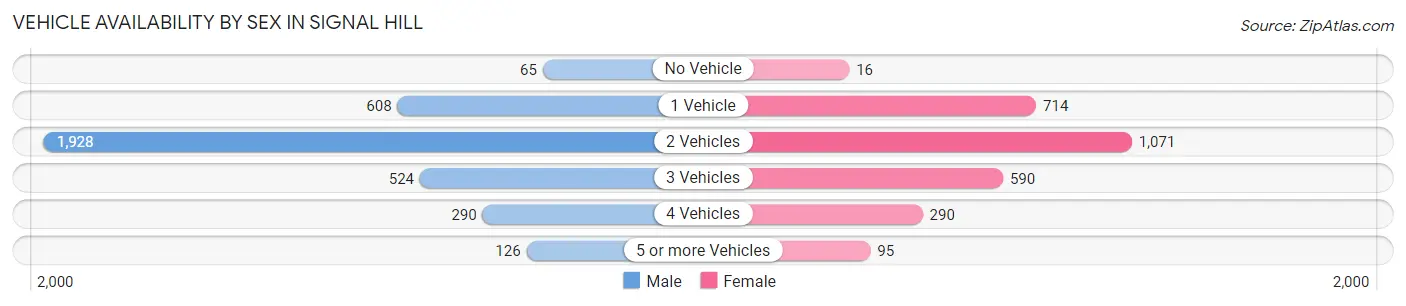
| Vehicles Available | Male | Female |
| No Vehicle | 65 (1.8%) | 16 (0.6%) |
| 1 Vehicle | 608 (17.2%) | 714 (25.7%) |
| 2 Vehicles | 1,928 (54.4%) | 1,071 (38.6%) |
| 3 Vehicles | 524 (14.8%) | 590 (21.2%) |
| 4 Vehicles | 290 (8.2%) | 290 (10.4%) |
| 5 or more Vehicles | 126 (3.6%) | 95 (3.4%) |
| Total | 3,541 (100.0%) | 2,776 (100.0%) |
Commute Time in Signal Hill
The most frequently occuring commute durations in Signal Hill are 30 to 34 minutes (977 commuters, 18.2%), 60 to 89 minutes (802 commuters, 14.9%), and 20 to 24 minutes (696 commuters, 13.0%).
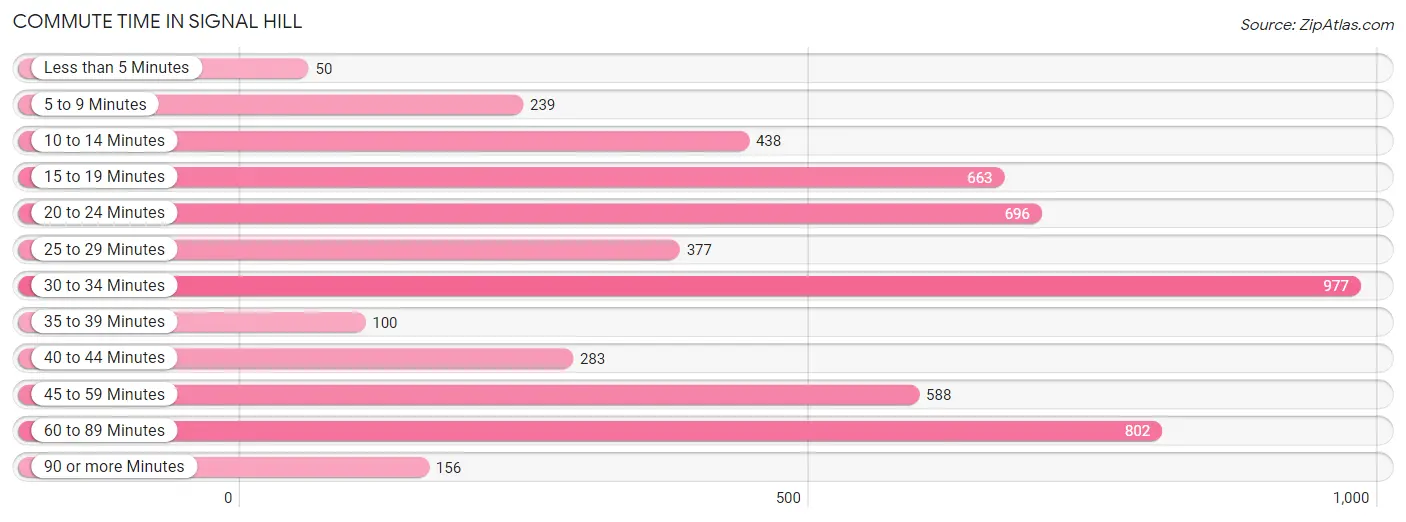
| Commute Time | # Commuters | % Commuters |
| Less than 5 Minutes | 50 | 0.9% |
| 5 to 9 Minutes | 239 | 4.4% |
| 10 to 14 Minutes | 438 | 8.2% |
| 15 to 19 Minutes | 663 | 12.3% |
| 20 to 24 Minutes | 696 | 13.0% |
| 25 to 29 Minutes | 377 | 7.0% |
| 30 to 34 Minutes | 977 | 18.2% |
| 35 to 39 Minutes | 100 | 1.9% |
| 40 to 44 Minutes | 283 | 5.3% |
| 45 to 59 Minutes | 588 | 11.0% |
| 60 to 89 Minutes | 802 | 14.9% |
| 90 or more Minutes | 156 | 2.9% |
Commute Time by Sex in Signal Hill
The most common commute times in Signal Hill are 30 to 34 minutes (615 commuters, 20.5%) for males and 30 to 34 minutes (362 commuters, 15.3%) for females.
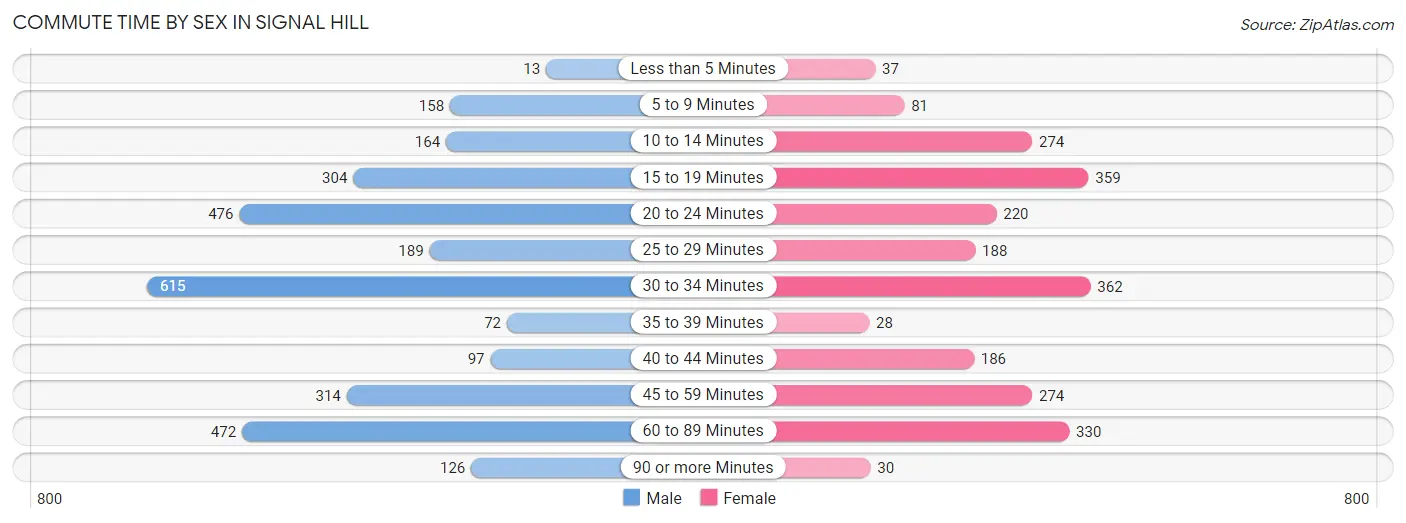
| Commute Time | Male | Female |
| Less than 5 Minutes | 13 (0.4%) | 37 (1.6%) |
| 5 to 9 Minutes | 158 (5.3%) | 81 (3.4%) |
| 10 to 14 Minutes | 164 (5.5%) | 274 (11.6%) |
| 15 to 19 Minutes | 304 (10.1%) | 359 (15.1%) |
| 20 to 24 Minutes | 476 (15.9%) | 220 (9.3%) |
| 25 to 29 Minutes | 189 (6.3%) | 188 (7.9%) |
| 30 to 34 Minutes | 615 (20.5%) | 362 (15.3%) |
| 35 to 39 Minutes | 72 (2.4%) | 28 (1.2%) |
| 40 to 44 Minutes | 97 (3.2%) | 186 (7.9%) |
| 45 to 59 Minutes | 314 (10.5%) | 274 (11.6%) |
| 60 to 89 Minutes | 472 (15.7%) | 330 (13.9%) |
| 90 or more Minutes | 126 (4.2%) | 30 (1.3%) |
Time of Departure to Work by Sex in Signal Hill
The most frequent times of departure to work in Signal Hill are 6:00 AM to 6:29 AM (575, 19.2%) for males and 8:00 AM to 8:29 AM (505, 21.3%) for females.
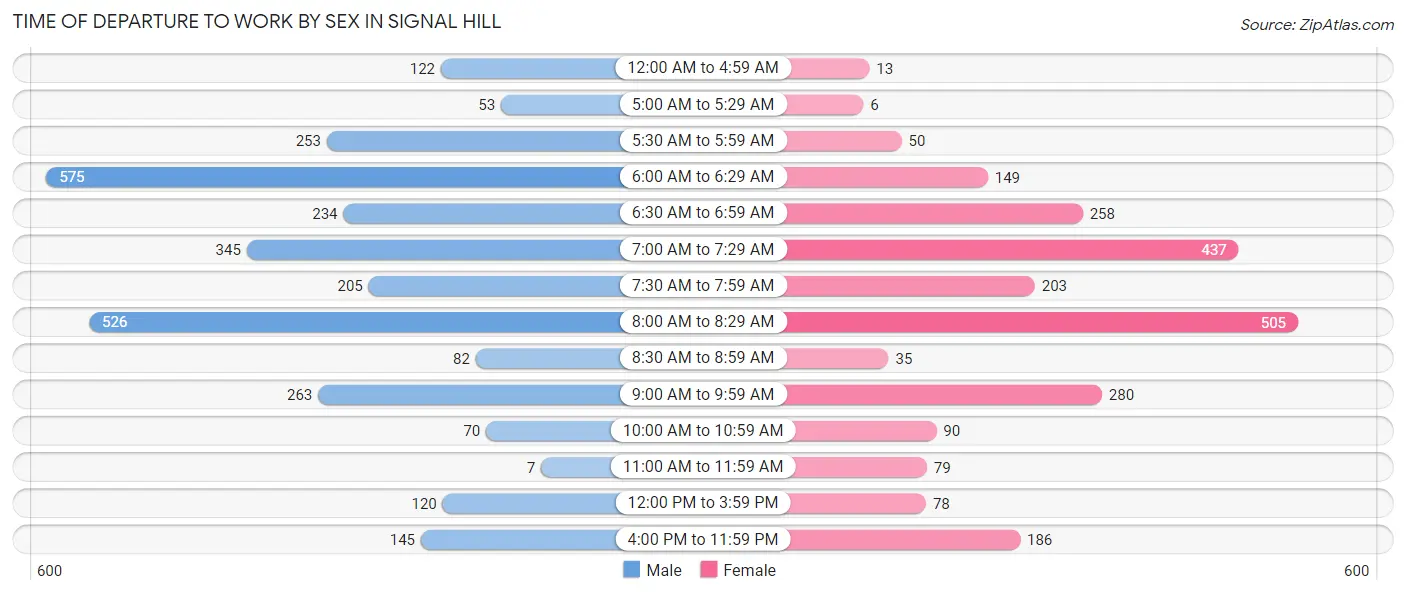
| Time of Departure | Male | Female |
| 12:00 AM to 4:59 AM | 122 (4.1%) | 13 (0.5%) |
| 5:00 AM to 5:29 AM | 53 (1.8%) | 6 (0.3%) |
| 5:30 AM to 5:59 AM | 253 (8.4%) | 50 (2.1%) |
| 6:00 AM to 6:29 AM | 575 (19.2%) | 149 (6.3%) |
| 6:30 AM to 6:59 AM | 234 (7.8%) | 258 (10.9%) |
| 7:00 AM to 7:29 AM | 345 (11.5%) | 437 (18.4%) |
| 7:30 AM to 7:59 AM | 205 (6.8%) | 203 (8.6%) |
| 8:00 AM to 8:29 AM | 526 (17.5%) | 505 (21.3%) |
| 8:30 AM to 8:59 AM | 82 (2.7%) | 35 (1.5%) |
| 9:00 AM to 9:59 AM | 263 (8.8%) | 280 (11.8%) |
| 10:00 AM to 10:59 AM | 70 (2.3%) | 90 (3.8%) |
| 11:00 AM to 11:59 AM | 7 (0.2%) | 79 (3.3%) |
| 12:00 PM to 3:59 PM | 120 (4.0%) | 78 (3.3%) |
| 4:00 PM to 11:59 PM | 145 (4.8%) | 186 (7.9%) |
| Total | 3,000 (100.0%) | 2,369 (100.0%) |
Housing Occupancy in Signal Hill
Occupancy by Ownership in Signal Hill
Of the total 4,563 dwellings in Signal Hill, owner-occupied units account for 2,398 (52.5%), while renter-occupied units make up 2,165 (47.4%).
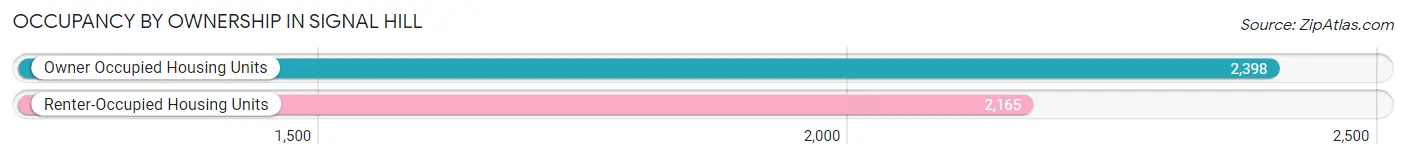
| Occupancy | # Housing Units | % Housing Units |
| Owner Occupied Housing Units | 2,398 | 52.5% |
| Renter-Occupied Housing Units | 2,165 | 47.4% |
| Total Occupied Housing Units | 4,563 | 100.0% |
Occupancy by Household Size in Signal Hill
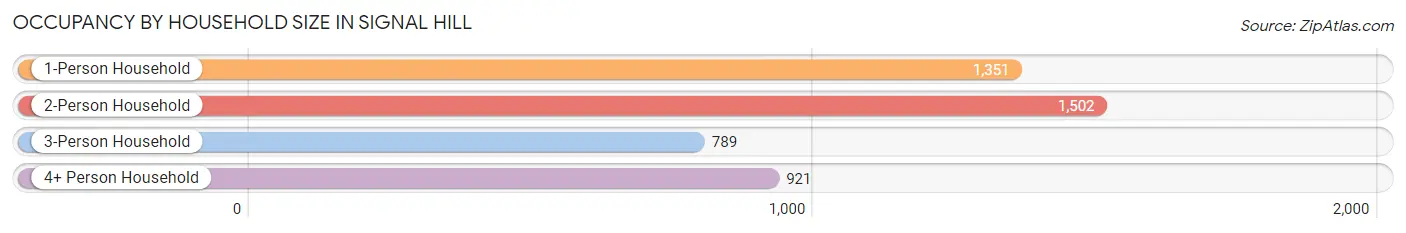
| Household Size | # Housing Units | % Housing Units |
| 1-Person Household | 1,351 | 29.6% |
| 2-Person Household | 1,502 | 32.9% |
| 3-Person Household | 789 | 17.3% |
| 4+ Person Household | 921 | 20.2% |
| Total Housing Units | 4,563 | 100.0% |
Occupancy by Ownership by Household Size in Signal Hill
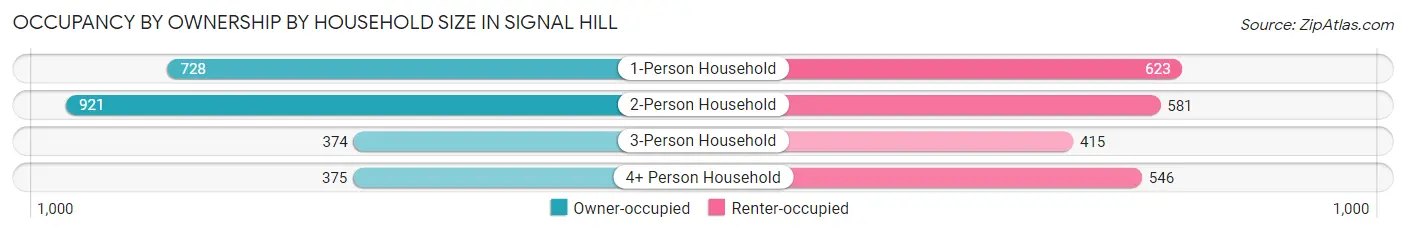
| Household Size | Owner-occupied | Renter-occupied |
| 1-Person Household | 728 (53.9%) | 623 (46.1%) |
| 2-Person Household | 921 (61.3%) | 581 (38.7%) |
| 3-Person Household | 374 (47.4%) | 415 (52.6%) |
| 4+ Person Household | 375 (40.7%) | 546 (59.3%) |
| Total Housing Units | 2,398 (52.5%) | 2,165 (47.4%) |
Occupancy by Educational Attainment in Signal Hill
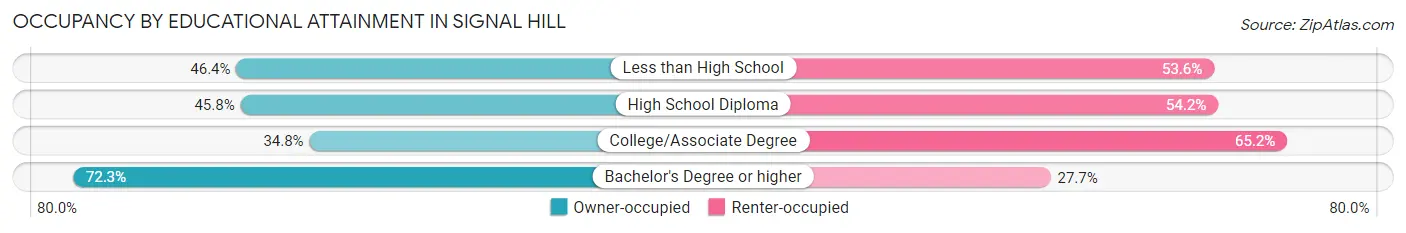
| Household Size | Owner-occupied | Renter-occupied |
| Less than High School | 168 (46.4%) | 194 (53.6%) |
| High School Diploma | 248 (45.8%) | 294 (54.2%) |
| College/Associate Degree | 617 (34.8%) | 1,155 (65.2%) |
| Bachelor's Degree or higher | 1,365 (72.3%) | 522 (27.7%) |
Occupancy by Age of Householder in Signal Hill
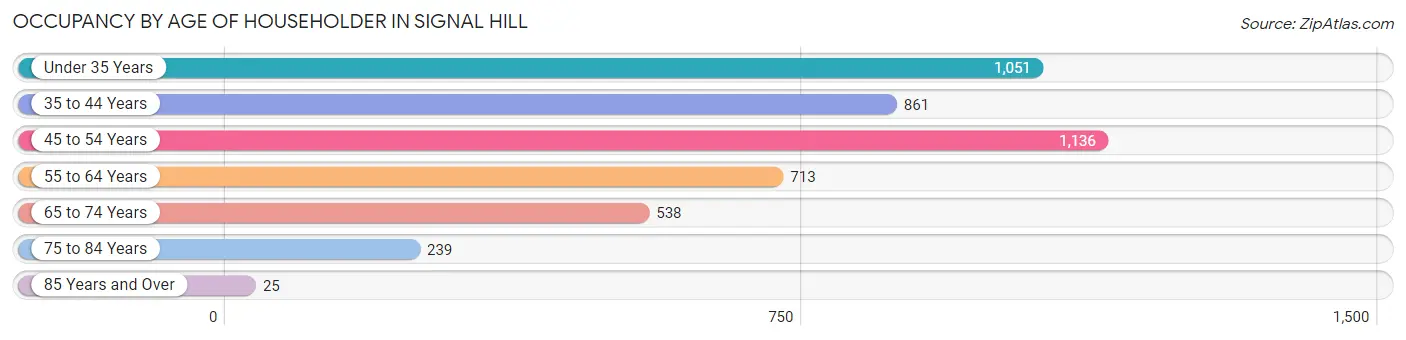
| Age Bracket | # Households | % Households |
| Under 35 Years | 1,051 | 23.0% |
| 35 to 44 Years | 861 | 18.9% |
| 45 to 54 Years | 1,136 | 24.9% |
| 55 to 64 Years | 713 | 15.6% |
| 65 to 74 Years | 538 | 11.8% |
| 75 to 84 Years | 239 | 5.2% |
| 85 Years and Over | 25 | 0.5% |
| Total | 4,563 | 100.0% |
Housing Finances in Signal Hill
Median Income by Occupancy in Signal Hill
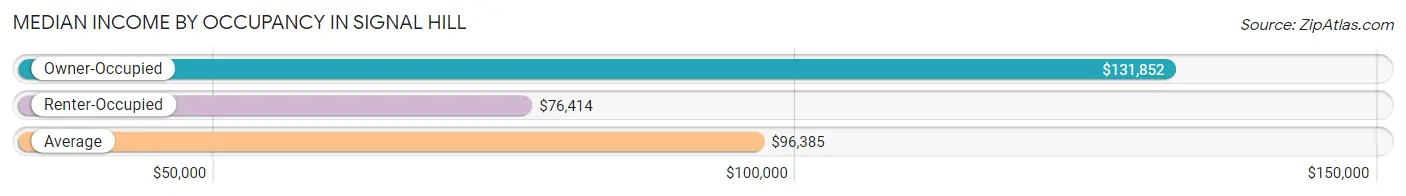
| Occupancy Type | # Households | Median Income |
| Owner-Occupied | 2,398 (52.5%) | $131,852 |
| Renter-Occupied | 2,165 (47.4%) | $76,414 |
| Average | 4,563 (100.0%) | $96,385 |
Occupancy by Householder Income Bracket in Signal Hill
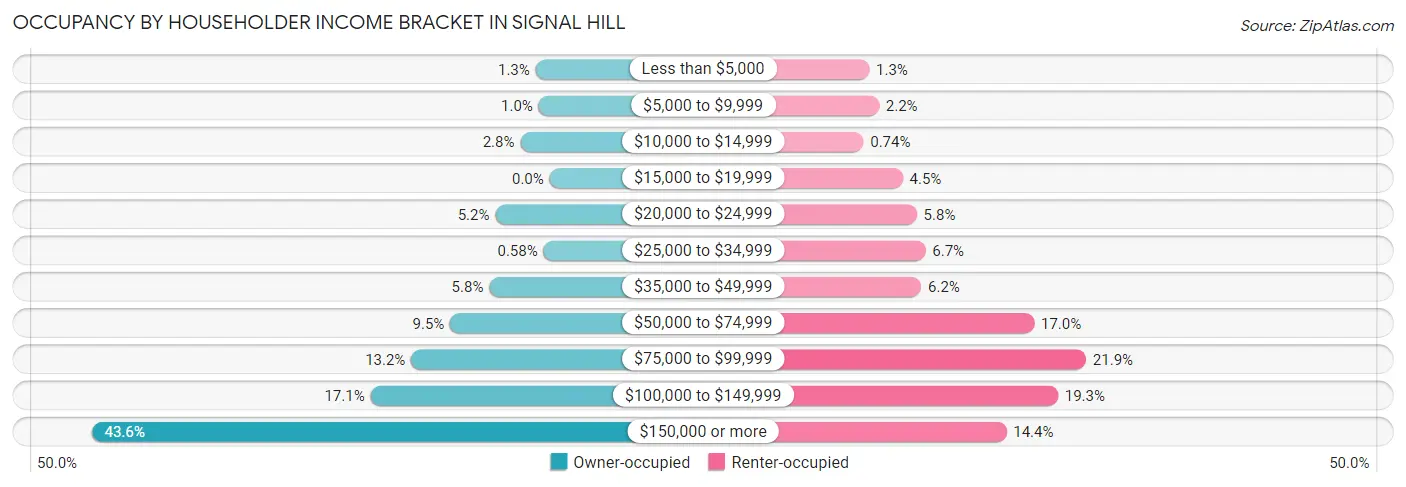
| Income Bracket | Owner-occupied | Renter-occupied |
| Less than $5,000 | 32 (1.3%) | 28 (1.3%) |
| $5,000 to $9,999 | 25 (1.0%) | 48 (2.2%) |
| $10,000 to $14,999 | 67 (2.8%) | 16 (0.7%) |
| $15,000 to $19,999 | 0 (0.0%) | 97 (4.5%) |
| $20,000 to $24,999 | 124 (5.2%) | 126 (5.8%) |
| $25,000 to $34,999 | 14 (0.6%) | 144 (6.7%) |
| $35,000 to $49,999 | 138 (5.8%) | 135 (6.2%) |
| $50,000 to $74,999 | 227 (9.5%) | 368 (17.0%) |
| $75,000 to $99,999 | 316 (13.2%) | 475 (21.9%) |
| $100,000 to $149,999 | 409 (17.1%) | 417 (19.3%) |
| $150,000 or more | 1,046 (43.6%) | 311 (14.4%) |
| Total | 2,398 (100.0%) | 2,165 (100.0%) |
Monthly Housing Cost Tiers in Signal Hill
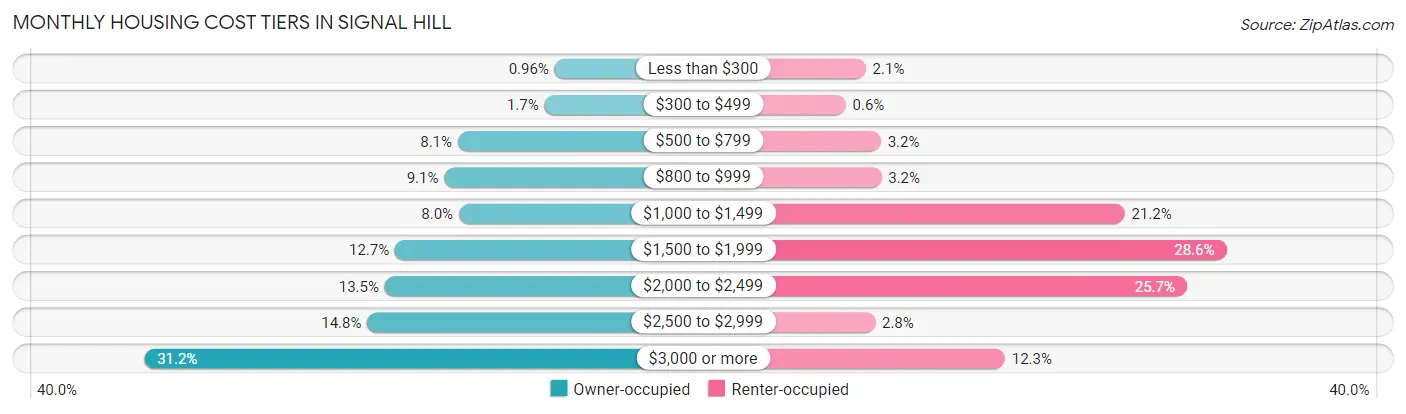
| Monthly Cost | Owner-occupied | Renter-occupied |
| Less than $300 | 23 (1.0%) | 45 (2.1%) |
| $300 to $499 | 41 (1.7%) | 13 (0.6%) |
| $500 to $799 | 194 (8.1%) | 69 (3.2%) |
| $800 to $999 | 218 (9.1%) | 70 (3.2%) |
| $1,000 to $1,499 | 192 (8.0%) | 458 (21.1%) |
| $1,500 to $1,999 | 305 (12.7%) | 620 (28.6%) |
| $2,000 to $2,499 | 323 (13.5%) | 557 (25.7%) |
| $2,500 to $2,999 | 354 (14.8%) | 60 (2.8%) |
| $3,000 or more | 748 (31.2%) | 267 (12.3%) |
| Total | 2,398 (100.0%) | 2,165 (100.0%) |
Physical Housing Characteristics in Signal Hill
Housing Structures in Signal Hill
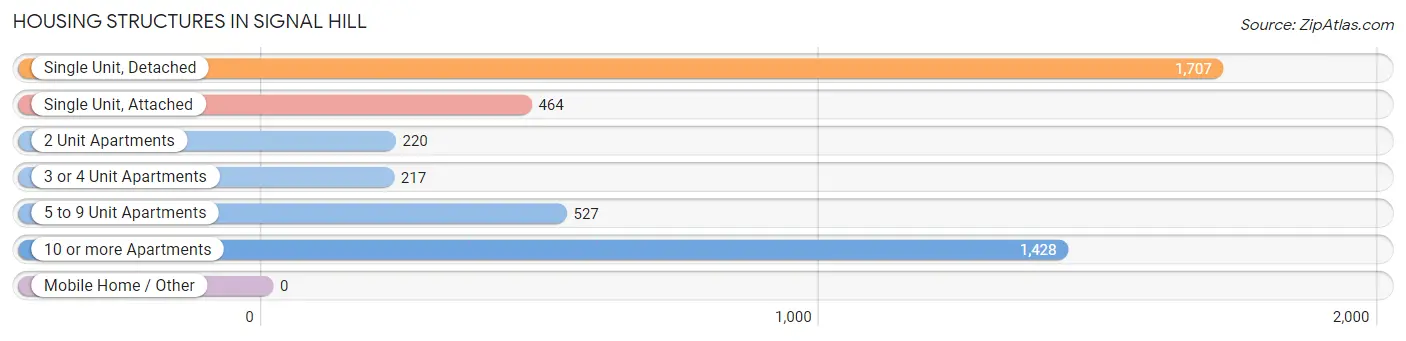
| Structure Type | # Housing Units | % Housing Units |
| Single Unit, Detached | 1,707 | 37.4% |
| Single Unit, Attached | 464 | 10.2% |
| 2 Unit Apartments | 220 | 4.8% |
| 3 or 4 Unit Apartments | 217 | 4.8% |
| 5 to 9 Unit Apartments | 527 | 11.6% |
| 10 or more Apartments | 1,428 | 31.3% |
| Mobile Home / Other | 0 | 0.0% |
| Total | 4,563 | 100.0% |
Housing Structures by Occupancy in Signal Hill
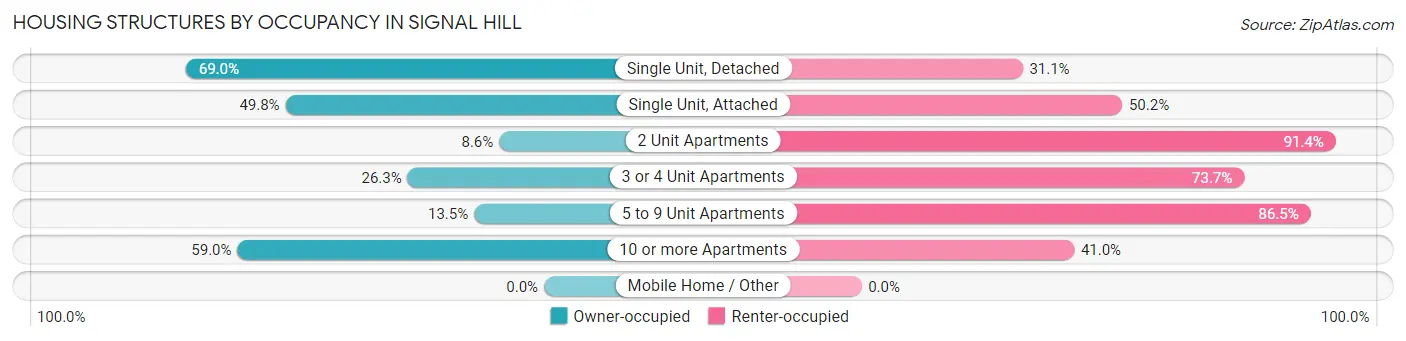
| Structure Type | Owner-occupied | Renter-occupied |
| Single Unit, Detached | 1,177 (69.0%) | 530 (31.0%) |
| Single Unit, Attached | 231 (49.8%) | 233 (50.2%) |
| 2 Unit Apartments | 19 (8.6%) | 201 (91.4%) |
| 3 or 4 Unit Apartments | 57 (26.3%) | 160 (73.7%) |
| 5 to 9 Unit Apartments | 71 (13.5%) | 456 (86.5%) |
| 10 or more Apartments | 843 (59.0%) | 585 (41.0%) |
| Mobile Home / Other | 0 (0.0%) | 0 (0.0%) |
| Total | 2,398 (52.5%) | 2,165 (47.4%) |
Housing Structures by Number of Rooms in Signal Hill
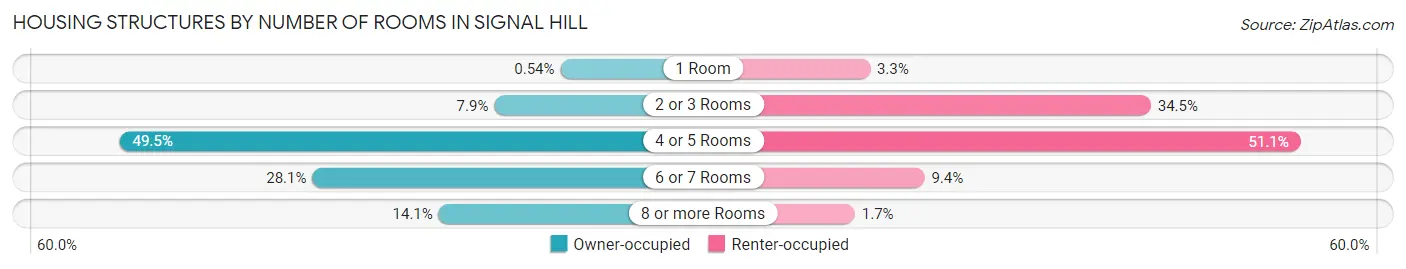
| Number of Rooms | Owner-occupied | Renter-occupied |
| 1 Room | 13 (0.5%) | 72 (3.3%) |
| 2 or 3 Rooms | 189 (7.9%) | 747 (34.5%) |
| 4 or 5 Rooms | 1,186 (49.5%) | 1,107 (51.1%) |
| 6 or 7 Rooms | 673 (28.1%) | 203 (9.4%) |
| 8 or more Rooms | 337 (14.1%) | 36 (1.7%) |
| Total | 2,398 (100.0%) | 2,165 (100.0%) |
Housing Structure by Heating Type in Signal Hill
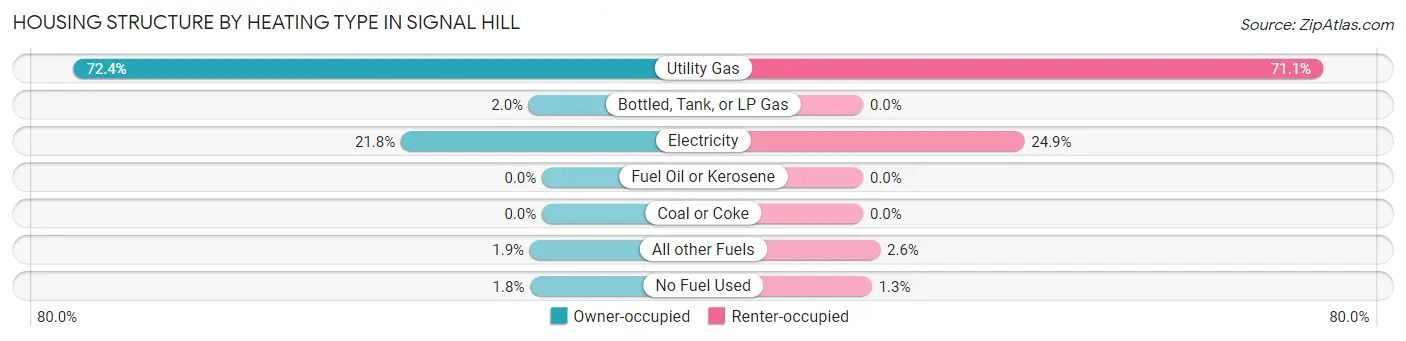
| Heating Type | Owner-occupied | Renter-occupied |
| Utility Gas | 1,737 (72.4%) | 1,539 (71.1%) |
| Bottled, Tank, or LP Gas | 49 (2.0%) | 0 (0.0%) |
| Electricity | 523 (21.8%) | 540 (24.9%) |
| Fuel Oil or Kerosene | 0 (0.0%) | 0 (0.0%) |
| Coal or Coke | 0 (0.0%) | 0 (0.0%) |
| All other Fuels | 45 (1.9%) | 57 (2.6%) |
| No Fuel Used | 44 (1.8%) | 29 (1.3%) |
| Total | 2,398 (100.0%) | 2,165 (100.0%) |
Household Vehicle Usage in Signal Hill
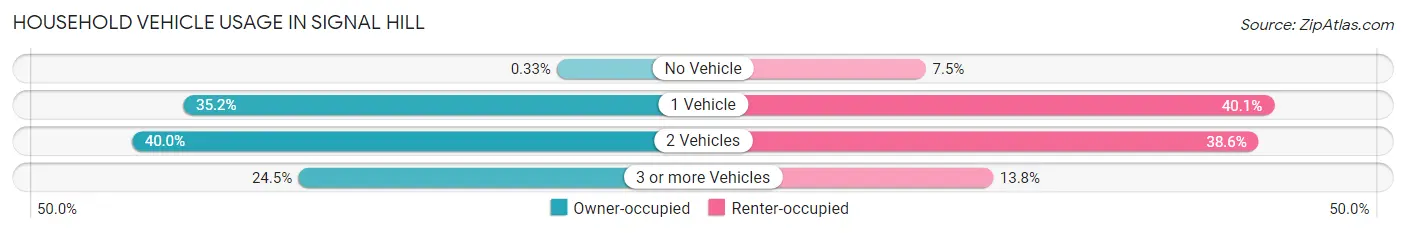
| Vehicles per Household | Owner-occupied | Renter-occupied |
| No Vehicle | 8 (0.3%) | 163 (7.5%) |
| 1 Vehicle | 844 (35.2%) | 867 (40.1%) |
| 2 Vehicles | 959 (40.0%) | 836 (38.6%) |
| 3 or more Vehicles | 587 (24.5%) | 299 (13.8%) |
| Total | 2,398 (100.0%) | 2,165 (100.0%) |
Real Estate & Mortgages in Signal Hill
Real Estate and Mortgage Overview in Signal Hill
| Characteristic | Without Mortgage | With Mortgage |
| Housing Units | 691 | 1,707 |
| Median Property Value | $829,100 | $652,600 |
| Median Household Income | $82,375 | $794 |
| Monthly Housing Costs | $944 | $681 |
| Real Estate Taxes | $7,056 | $32 |
Property Value by Mortgage Status in Signal Hill
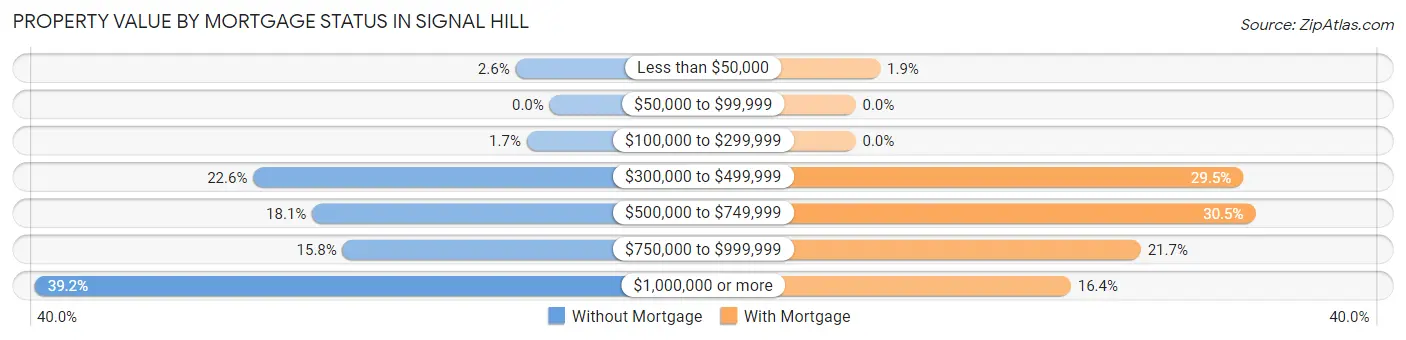
| Property Value | Without Mortgage | With Mortgage |
| Less than $50,000 | 18 (2.6%) | 32 (1.9%) |
| $50,000 to $99,999 | 0 (0.0%) | 0 (0.0%) |
| $100,000 to $299,999 | 12 (1.7%) | 0 (0.0%) |
| $300,000 to $499,999 | 156 (22.6%) | 504 (29.5%) |
| $500,000 to $749,999 | 125 (18.1%) | 520 (30.5%) |
| $750,000 to $999,999 | 109 (15.8%) | 371 (21.7%) |
| $1,000,000 or more | 271 (39.2%) | 280 (16.4%) |
| Total | 691 (100.0%) | 1,707 (100.0%) |
Household Income by Mortgage Status in Signal Hill
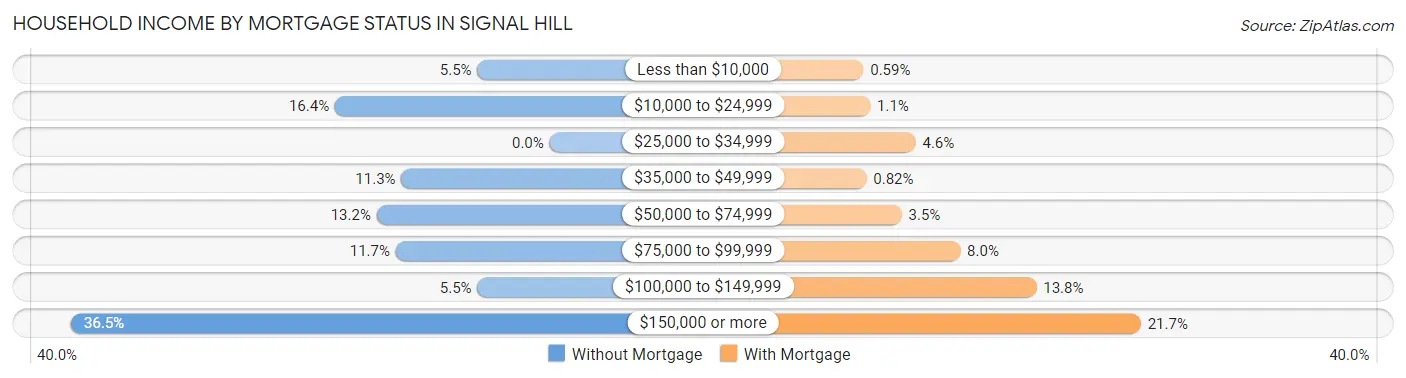
| Household Income | Without Mortgage | With Mortgage |
| Less than $10,000 | 38 (5.5%) | 10 (0.6%) |
| $10,000 to $24,999 | 113 (16.4%) | 19 (1.1%) |
| $25,000 to $34,999 | 0 (0.0%) | 78 (4.6%) |
| $35,000 to $49,999 | 78 (11.3%) | 14 (0.8%) |
| $50,000 to $74,999 | 91 (13.2%) | 60 (3.5%) |
| $75,000 to $99,999 | 81 (11.7%) | 136 (8.0%) |
| $100,000 to $149,999 | 38 (5.5%) | 235 (13.8%) |
| $150,000 or more | 252 (36.5%) | 371 (21.7%) |
| Total | 691 (100.0%) | 1,707 (100.0%) |
Property Value to Household Income Ratio in Signal Hill
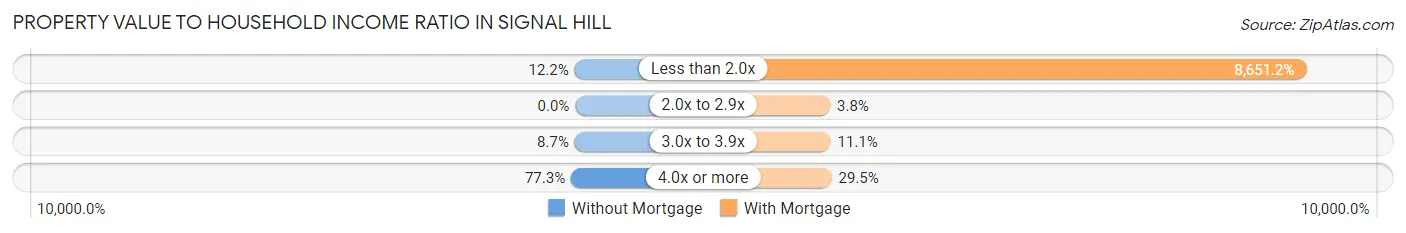
| Value-to-Income Ratio | Without Mortgage | With Mortgage |
| Less than 2.0x | 84 (12.2%) | 147,676 (8,651.2%) |
| 2.0x to 2.9x | 0 (0.0%) | 64 (3.7%) |
| 3.0x to 3.9x | 60 (8.7%) | 189 (11.1%) |
| 4.0x or more | 534 (77.3%) | 503 (29.5%) |
| Total | 691 (100.0%) | 1,707 (100.0%) |
Real Estate Taxes by Mortgage Status in Signal Hill
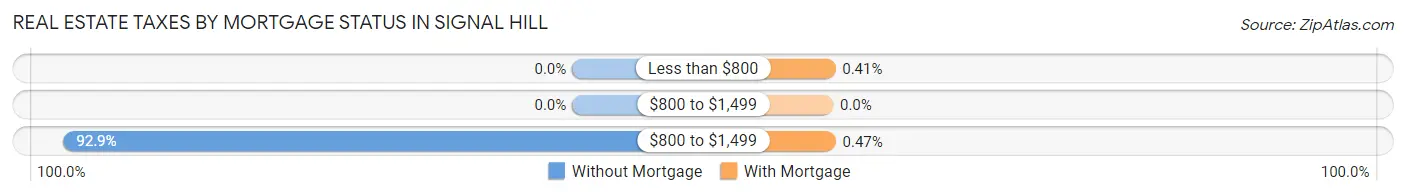
| Property Taxes | Without Mortgage | With Mortgage |
| Less than $800 | 0 (0.0%) | 7 (0.4%) |
| $800 to $1,499 | 0 (0.0%) | 0 (0.0%) |
| $800 to $1,499 | 642 (92.9%) | 8 (0.5%) |
| Total | 691 (100.0%) | 1,707 (100.0%) |
Health & Disability in Signal Hill
Health Insurance Coverage by Age in Signal Hill
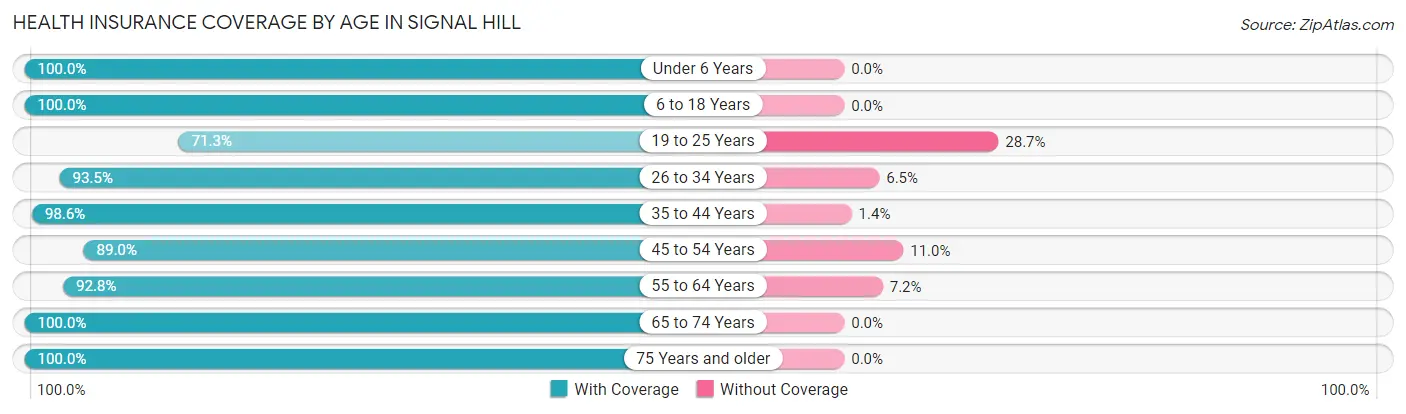
| Age Bracket | With Coverage | Without Coverage |
| Under 6 Years | 824 (100.0%) | 0 (0.0%) |
| 6 to 18 Years | 1,592 (100.0%) | 0 (0.0%) |
| 19 to 25 Years | 506 (71.3%) | 204 (28.7%) |
| 26 to 34 Years | 2,205 (93.5%) | 154 (6.5%) |
| 35 to 44 Years | 1,585 (98.6%) | 22 (1.4%) |
| 45 to 54 Years | 1,705 (89.0%) | 211 (11.0%) |
| 55 to 64 Years | 1,177 (92.8%) | 91 (7.2%) |
| 65 to 74 Years | 795 (100.0%) | 0 (0.0%) |
| 75 Years and older | 516 (100.0%) | 0 (0.0%) |
| Total | 10,905 (94.1%) | 682 (5.9%) |
Health Insurance Coverage by Citizenship Status in Signal Hill
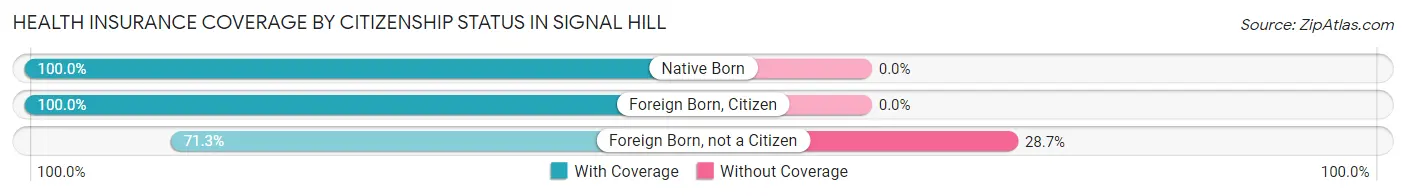
| Citizenship Status | With Coverage | Without Coverage |
| Native Born | 824 (100.0%) | 0 (0.0%) |
| Foreign Born, Citizen | 1,592 (100.0%) | 0 (0.0%) |
| Foreign Born, not a Citizen | 506 (71.3%) | 204 (28.7%) |
Health Insurance Coverage by Household Income in Signal Hill
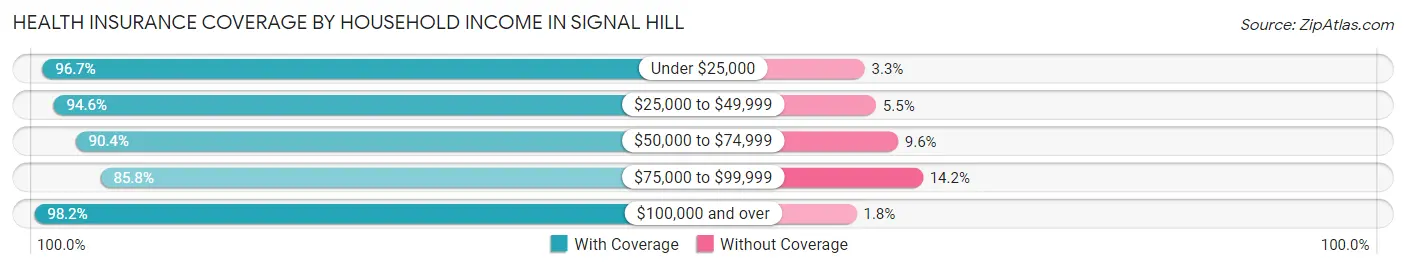
| Household Income | With Coverage | Without Coverage |
| Under $25,000 | 988 (96.7%) | 34 (3.3%) |
| $25,000 to $49,999 | 764 (94.6%) | 44 (5.4%) |
| $50,000 to $74,999 | 1,164 (90.4%) | 123 (9.6%) |
| $75,000 to $99,999 | 2,260 (85.8%) | 375 (14.2%) |
| $100,000 and over | 5,714 (98.2%) | 106 (1.8%) |
Public vs Private Health Insurance Coverage by Age in Signal Hill
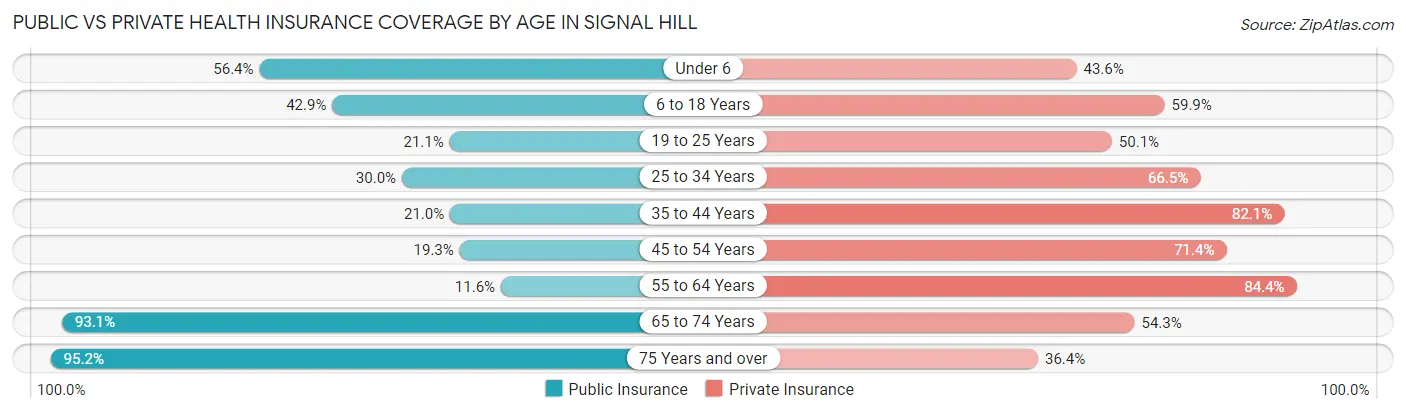
| Age Bracket | Public Insurance | Private Insurance |
| Under 6 | 465 (56.4%) | 359 (43.6%) |
| 6 to 18 Years | 683 (42.9%) | 954 (59.9%) |
| 19 to 25 Years | 150 (21.1%) | 356 (50.1%) |
| 25 to 34 Years | 707 (30.0%) | 1,569 (66.5%) |
| 35 to 44 Years | 338 (21.0%) | 1,319 (82.1%) |
| 45 to 54 Years | 369 (19.3%) | 1,367 (71.4%) |
| 55 to 64 Years | 147 (11.6%) | 1,070 (84.4%) |
| 65 to 74 Years | 740 (93.1%) | 432 (54.3%) |
| 75 Years and over | 491 (95.2%) | 188 (36.4%) |
| Total | 4,090 (35.3%) | 7,614 (65.7%) |
Disability Status by Sex by Age in Signal Hill
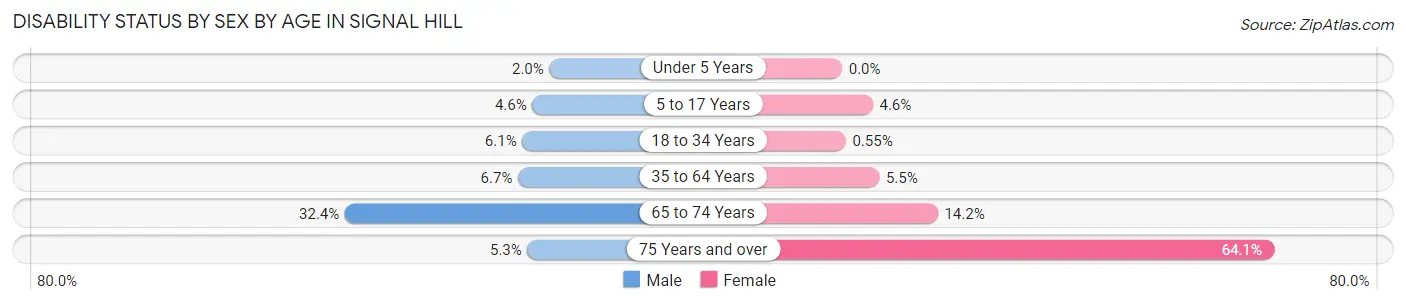
| Age Bracket | Male | Female |
| Under 5 Years | 11 (2.0%) | 0 (0.0%) |
| 5 to 17 Years | 31 (4.6%) | 38 (4.6%) |
| 18 to 34 Years | 95 (6.1%) | 9 (0.5%) |
| 35 to 64 Years | 168 (6.7%) | 126 (5.5%) |
| 65 to 74 Years | 82 (32.4%) | 77 (14.2%) |
| 75 Years and over | 12 (5.3%) | 186 (64.1%) |
Disability Class by Sex by Age in Signal Hill
Disability Class: Hearing Difficulty
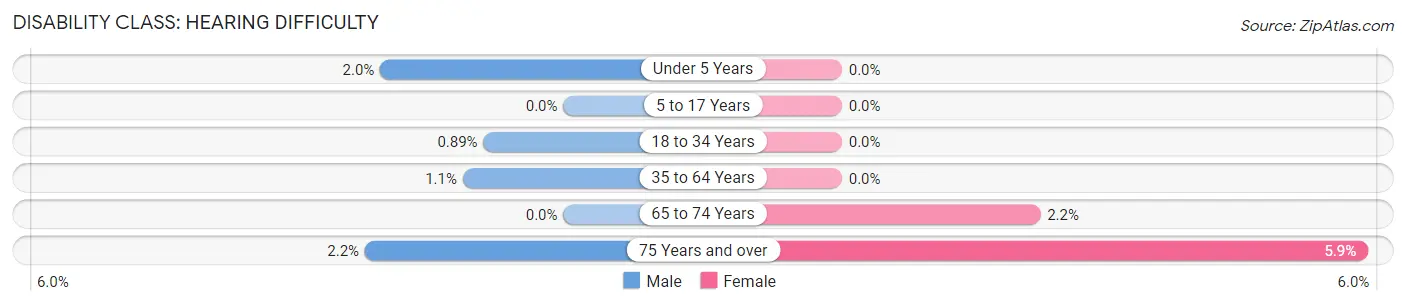
| Age Bracket | Male | Female |
| Under 5 Years | 11 (2.0%) | 0 (0.0%) |
| 5 to 17 Years | 0 (0.0%) | 0 (0.0%) |
| 18 to 34 Years | 14 (0.9%) | 0 (0.0%) |
| 35 to 64 Years | 28 (1.1%) | 0 (0.0%) |
| 65 to 74 Years | 0 (0.0%) | 12 (2.2%) |
| 75 Years and over | 5 (2.2%) | 17 (5.9%) |
Disability Class: Vision Difficulty
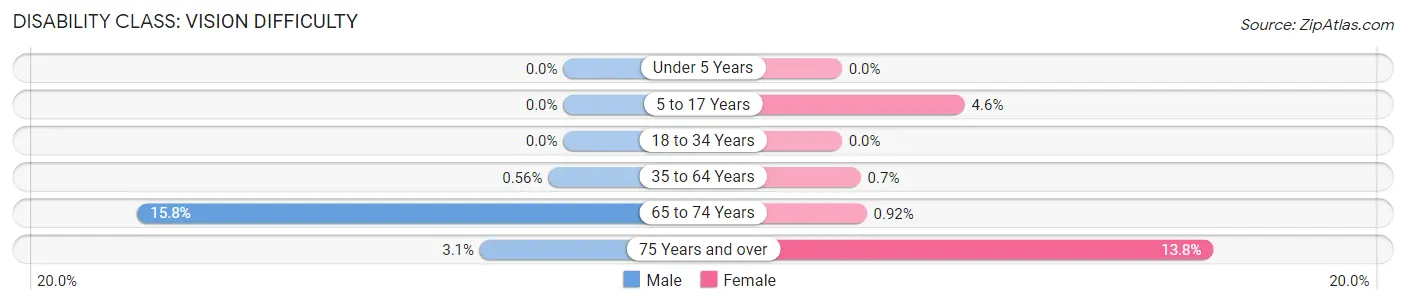
| Age Bracket | Male | Female |
| Under 5 Years | 0 (0.0%) | 0 (0.0%) |
| 5 to 17 Years | 0 (0.0%) | 38 (4.6%) |
| 18 to 34 Years | 0 (0.0%) | 0 (0.0%) |
| 35 to 64 Years | 14 (0.6%) | 16 (0.7%) |
| 65 to 74 Years | 40 (15.8%) | 5 (0.9%) |
| 75 Years and over | 7 (3.1%) | 40 (13.8%) |
Disability Class: Cognitive Difficulty
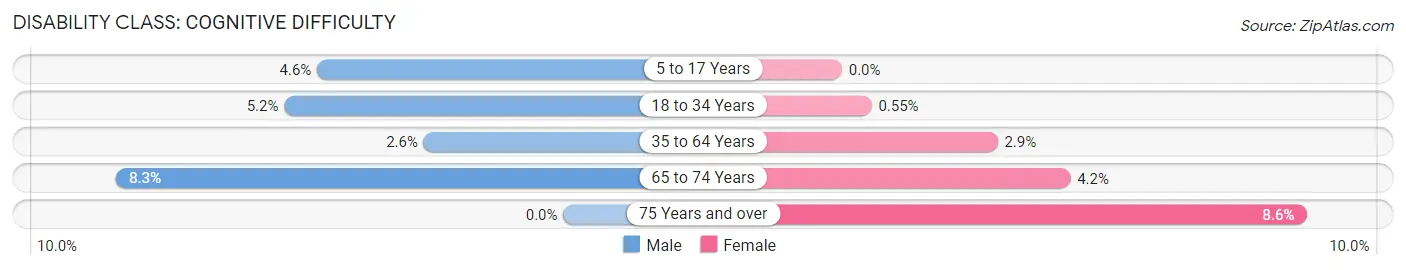
| Age Bracket | Male | Female |
| 5 to 17 Years | 31 (4.6%) | 0 (0.0%) |
| 18 to 34 Years | 81 (5.2%) | 9 (0.5%) |
| 35 to 64 Years | 65 (2.6%) | 66 (2.9%) |
| 65 to 74 Years | 21 (8.3%) | 23 (4.2%) |
| 75 Years and over | 0 (0.0%) | 25 (8.6%) |
Disability Class: Ambulatory Difficulty
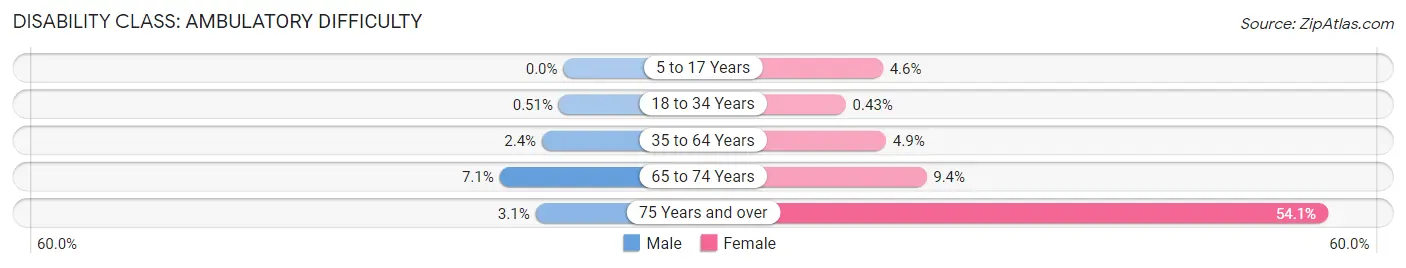
| Age Bracket | Male | Female |
| 5 to 17 Years | 0 (0.0%) | 38 (4.6%) |
| 18 to 34 Years | 8 (0.5%) | 7 (0.4%) |
| 35 to 64 Years | 60 (2.4%) | 112 (4.9%) |
| 65 to 74 Years | 18 (7.1%) | 51 (9.4%) |
| 75 Years and over | 7 (3.1%) | 157 (54.1%) |
Disability Class: Self-Care Difficulty
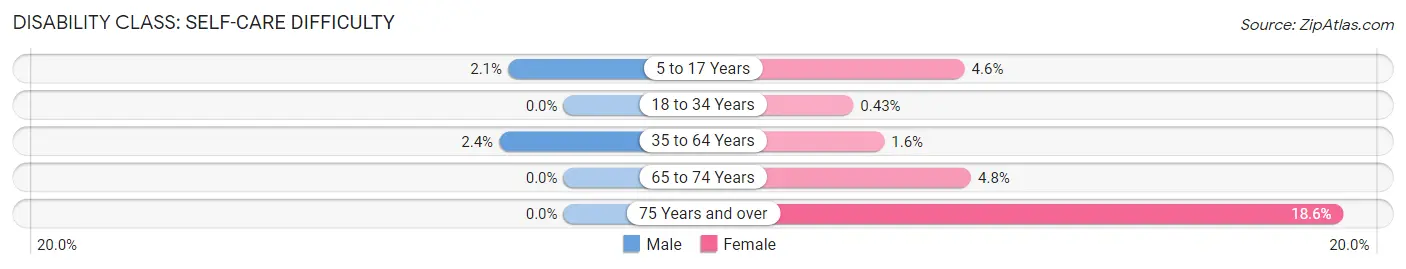
| Age Bracket | Male | Female |
| 5 to 17 Years | 14 (2.1%) | 38 (4.6%) |
| 18 to 34 Years | 0 (0.0%) | 7 (0.4%) |
| 35 to 64 Years | 60 (2.4%) | 36 (1.6%) |
| 65 to 74 Years | 0 (0.0%) | 26 (4.8%) |
| 75 Years and over | 0 (0.0%) | 54 (18.6%) |
Technology Access in Signal Hill
Computing Device Access in Signal Hill
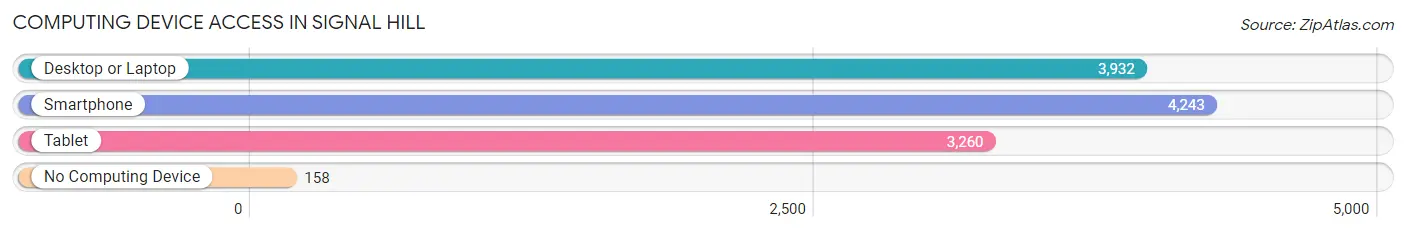
| Device Type | # Households | % Households |
| Desktop or Laptop | 3,932 | 86.2% |
| Smartphone | 4,243 | 93.0% |
| Tablet | 3,260 | 71.4% |
| No Computing Device | 158 | 3.5% |
| Total | 4,563 | 100.0% |
Internet Access in Signal Hill
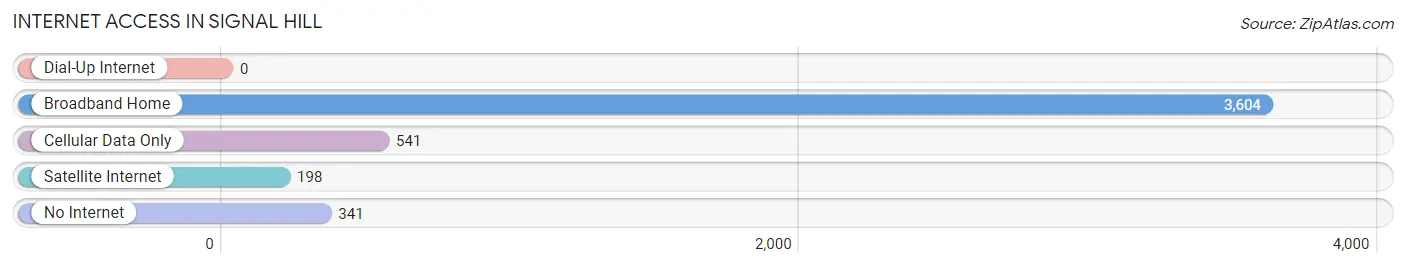
| Internet Type | # Households | % Households |
| Dial-Up Internet | 0 | 0.0% |
| Broadband Home | 3,604 | 79.0% |
| Cellular Data Only | 541 | 11.9% |
| Satellite Internet | 198 | 4.3% |
| No Internet | 341 | 7.5% |
| Total | 4,563 | 100.0% |
Signal Hill Summary
Signal Hill is a small city located in Los Angeles County, California. It is situated on a hilltop overlooking Long Beach and the Pacific Ocean. The city is bordered by Long Beach to the west, Lakewood to the east, and the cities of Seal Beach and Los Alamitos to the south. The population of Signal Hill was 11,016 at the 2010 census.
History
Signal Hill was originally part of the Rancho San Pedro land grant, which was granted to Juan Jose Dominguez in 1784. The area was first settled in the late 1800s by ranchers and farmers. In 1921, Signal Hill was incorporated as a city. The city was named for the hilltop where a signal was sent to notify ships of the presence of oil.
Geography
Signal Hill is located at 33°48'25"N 118°9'37"W (33.806944, -118.160278). It is situated on a hilltop overlooking Long Beach and the Pacific Ocean. The city has a total area of 2.2 square miles, all of which is land.
Economy
Signal Hill is home to a variety of businesses, including oil and gas production, manufacturing, retail, and professional services. The city is also home to several major oil companies, including Chevron, Occidental Petroleum, and Signal Hill Petroleum.
Demographics
As of the 2010 census, the population of Signal Hill was 11,016. The racial makeup of the city was 57.2% White, 11.2% African American, 0.7% Native American, 11.3% Asian, 0.3% Pacific Islander, and 19.3% from other races. Hispanic or Latino of any race were 33.2% of the population.
The median income for a household in Signal Hill was $50,945, and the median income for a family was $60,945. The per capita income for the city was $27,845. About 11.2% of families and 14.2% of the population were below the poverty line, including 19.2% of those under age 18 and 8.2% of those age 65 or over.
Common Questions
What is Per Capita Income in Signal Hill?
Per Capita income in Signal Hill is $46,714.
What is the Median Family Income in Signal Hill?
Median Family Income in Signal Hill is $106,023.
What is the Median Household income in Signal Hill?
Median Household Income in Signal Hill is $96,385.
What is Income or Wage Gap in Signal Hill?
Income or Wage Gap in Signal Hill is 1.7%.
Women in Signal Hill earn 98.3 cents for every dollar earned by a man.
What is Inequality or Gini Index in Signal Hill?
Inequality or Gini Index in Signal Hill is 0.39.
What is the Total Population of Signal Hill?
Total Population of Signal Hill is 11,678.
What is the Total Male Population of Signal Hill?
Total Male Population of Signal Hill is 5,827.
What is the Total Female Population of Signal Hill?
Total Female Population of Signal Hill is 5,851.
What is the Ratio of Males per 100 Females in Signal Hill?
There are 99.59 Males per 100 Females in Signal Hill.
What is the Ratio of Females per 100 Males in Signal Hill?
There are 100.41 Females per 100 Males in Signal Hill.
What is the Median Population Age in Signal Hill?
Median Population Age in Signal Hill is 36.8 Years.
What is the Average Family Size in Signal Hill
Average Family Size in Signal Hill is 3.4 People.
What is the Average Household Size in Signal Hill
Average Household Size in Signal Hill is 2.5 People.
How Large is the Labor Force in Signal Hill?
There are 6,742 People in the Labor Forcein in Signal Hill.
What is the Percentage of People in the Labor Force in Signal Hill?
70.6% of People are in the Labor Force in Signal Hill.
What is the Unemployment Rate in Signal Hill?
Unemployment Rate in Signal Hill is 4.6%.