Diamond Springs, CA Map & Demographics
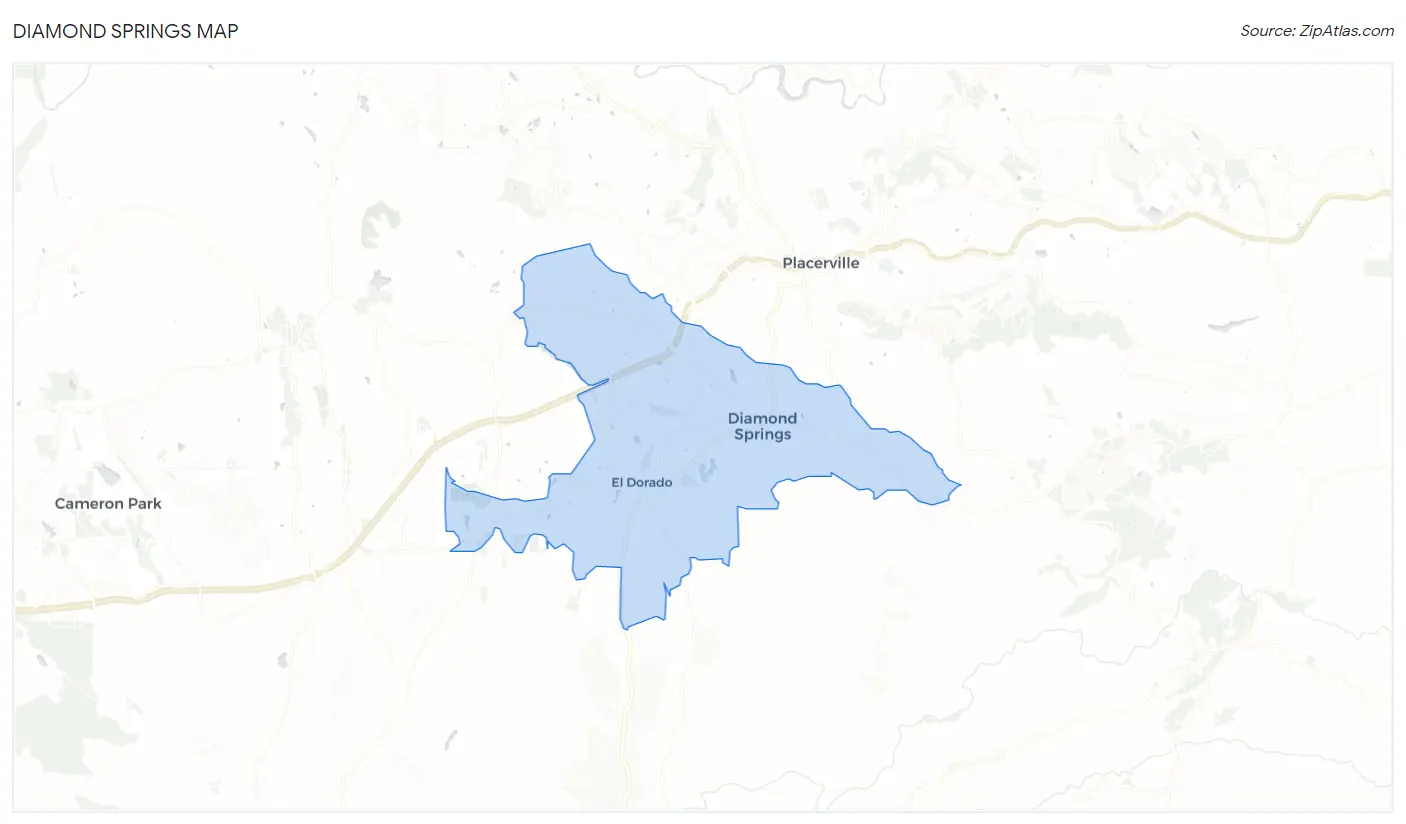
Diamond Springs Map
Diamond Springs Overview
$39,148
PER CAPITA INCOME
$93,279
AVG FAMILY INCOME
$71,279
AVG HOUSEHOLD INCOME
10.2%
WAGE / INCOME GAP [ % ]
89.8¢/ $1
WAGE / INCOME GAP [ $ ]
$7,907
FAMILY INCOME DEFICIT
0.43
INEQUALITY / GINI INDEX
12,197
TOTAL POPULATION
6,153
MALE POPULATION
6,044
FEMALE POPULATION
101.80
MALES / 100 FEMALES
98.23
FEMALES / 100 MALES
43.7
MEDIAN AGE
2.9
AVG FAMILY SIZE
2.4
AVG HOUSEHOLD SIZE
5,470
LABOR FORCE [ PEOPLE ]
55.9%
PERCENT IN LABOR FORCE
5.4%
UNEMPLOYMENT RATE
Diamond Springs Zip Codes
Diamond Springs Area Codes
Income in Diamond Springs
Income Overview in Diamond Springs
Per Capita Income in Diamond Springs is $39,148, while median incomes of families and households are $93,279 and $71,279 respectively.
| Characteristic | Number | Measure |
| Per Capita Income | 12,197 | $39,148 |
| Median Family Income | 3,242 | $93,279 |
| Mean Family Income | 3,242 | $107,878 |
| Median Household Income | 5,100 | $71,279 |
| Mean Household Income | 5,100 | $92,755 |
| Income Deficit | 3,242 | $7,907 |
| Wage / Income Gap (%) | 12,197 | 10.18% |
| Wage / Income Gap ($) | 12,197 | 89.82¢ per $1 |
| Gini / Inequality Index | 12,197 | 0.43 |
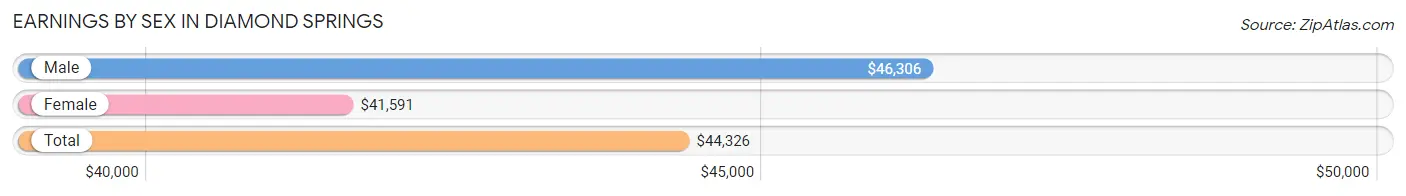
Earnings by Sex in Diamond Springs
Average Earnings in Diamond Springs are $44,326, $46,306 for men and $41,591 for women, a difference of 10.2%.
| Sex | Number | Average Earnings |
| Male | 3,165 (55.6%) | $46,306 |
| Female | 2,532 (44.4%) | $41,591 |
| Total | 5,697 (100.0%) | $44,326 |
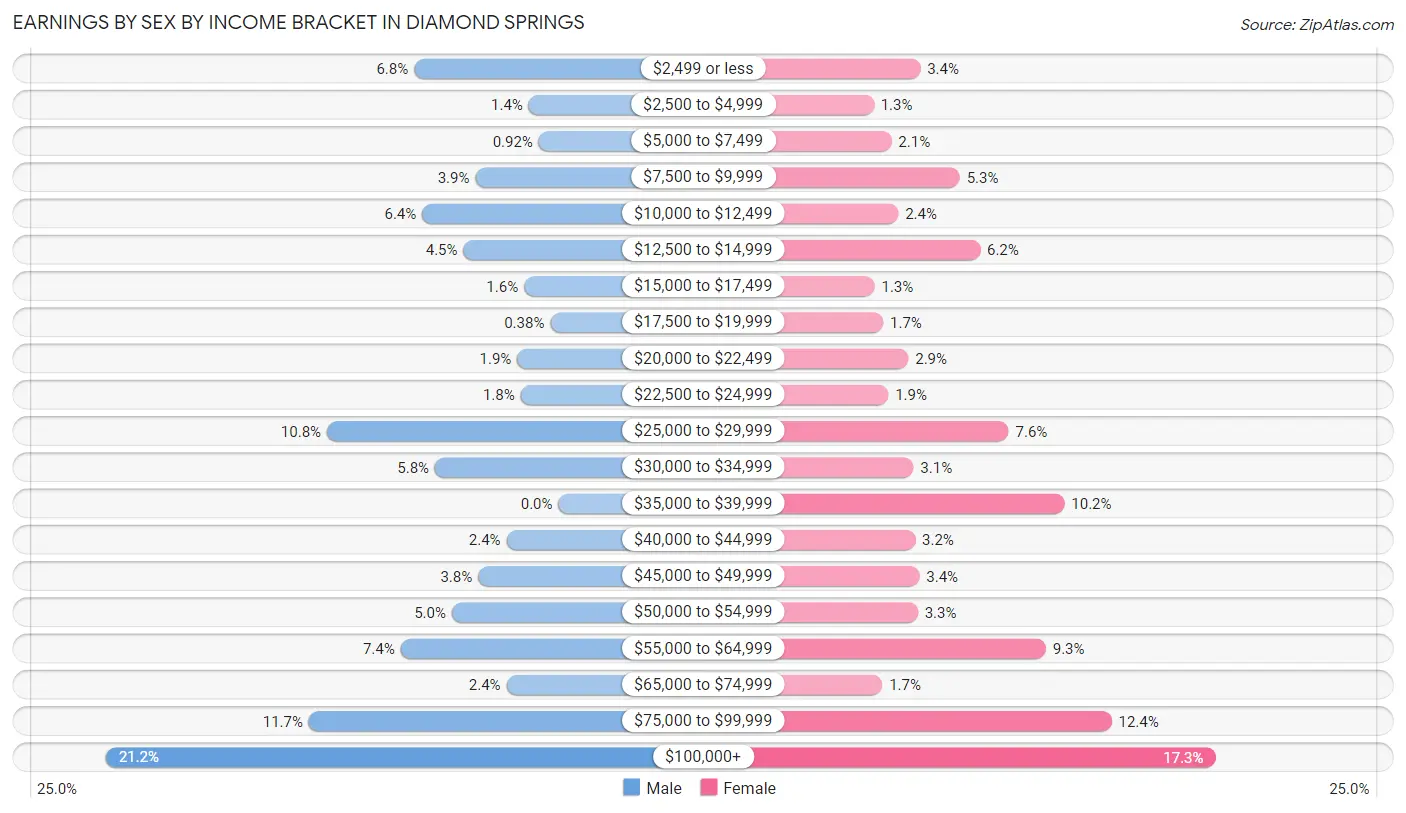
Earnings by Sex by Income Bracket in Diamond Springs
The most common earnings brackets in Diamond Springs are $100,000+ for men (671 | 21.2%) and $100,000+ for women (437 | 17.3%).
| Income | Male | Female |
| $2,499 or less | 214 (6.8%) | 87 (3.4%) |
| $2,500 to $4,999 | 44 (1.4%) | 32 (1.3%) |
| $5,000 to $7,499 | 29 (0.9%) | 53 (2.1%) |
| $7,500 to $9,999 | 123 (3.9%) | 134 (5.3%) |
| $10,000 to $12,499 | 202 (6.4%) | 61 (2.4%) |
| $12,500 to $14,999 | 141 (4.4%) | 158 (6.2%) |
| $15,000 to $17,499 | 51 (1.6%) | 33 (1.3%) |
| $17,500 to $19,999 | 12 (0.4%) | 43 (1.7%) |
| $20,000 to $22,499 | 61 (1.9%) | 73 (2.9%) |
| $22,500 to $24,999 | 56 (1.8%) | 49 (1.9%) |
| $25,000 to $29,999 | 343 (10.8%) | 192 (7.6%) |
| $30,000 to $34,999 | 183 (5.8%) | 79 (3.1%) |
| $35,000 to $39,999 | 0 (0.0%) | 258 (10.2%) |
| $40,000 to $44,999 | 77 (2.4%) | 81 (3.2%) |
| $45,000 to $49,999 | 119 (3.8%) | 86 (3.4%) |
| $50,000 to $54,999 | 158 (5.0%) | 84 (3.3%) |
| $55,000 to $64,999 | 234 (7.4%) | 236 (9.3%) |
| $65,000 to $74,999 | 77 (2.4%) | 42 (1.7%) |
| $75,000 to $99,999 | 370 (11.7%) | 314 (12.4%) |
| $100,000+ | 671 (21.2%) | 437 (17.3%) |
| Total | 3,165 (100.0%) | 2,532 (100.0%) |
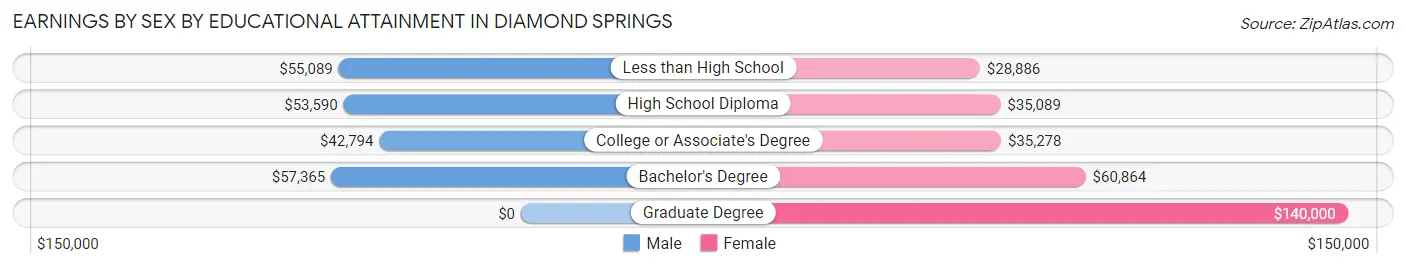
Earnings by Sex by Educational Attainment in Diamond Springs
Average earnings in Diamond Springs are $54,308 for men and $44,725 for women, a difference of 17.6%. Men with an educational attainment of bachelor's degree enjoy the highest average annual earnings of $57,365, while those with college or associate's degree education earn the least with $42,794. Women with an educational attainment of graduate degree earn the most with the average annual earnings of $140,000, while those with less than high school education have the smallest earnings of $28,886.
| Educational Attainment | Male Income | Female Income |
| Less than High School | $55,089 | $28,886 |
| High School Diploma | $53,590 | $35,089 |
| College or Associate's Degree | $42,794 | $35,278 |
| Bachelor's Degree | $57,365 | $60,864 |
| Graduate Degree | - | - |
| Total | $54,308 | $44,725 |
Family Income in Diamond Springs
Family Income Brackets in Diamond Springs
According to the Diamond Springs family income data, there are 755 families falling into the $100,000 to $149,999 income range, which is the most common income bracket and makes up 23.3% of all families. Conversely, the $10,000 to $14,999 income bracket is the least frequent group with only 26 families (0.8%) belonging to this category.
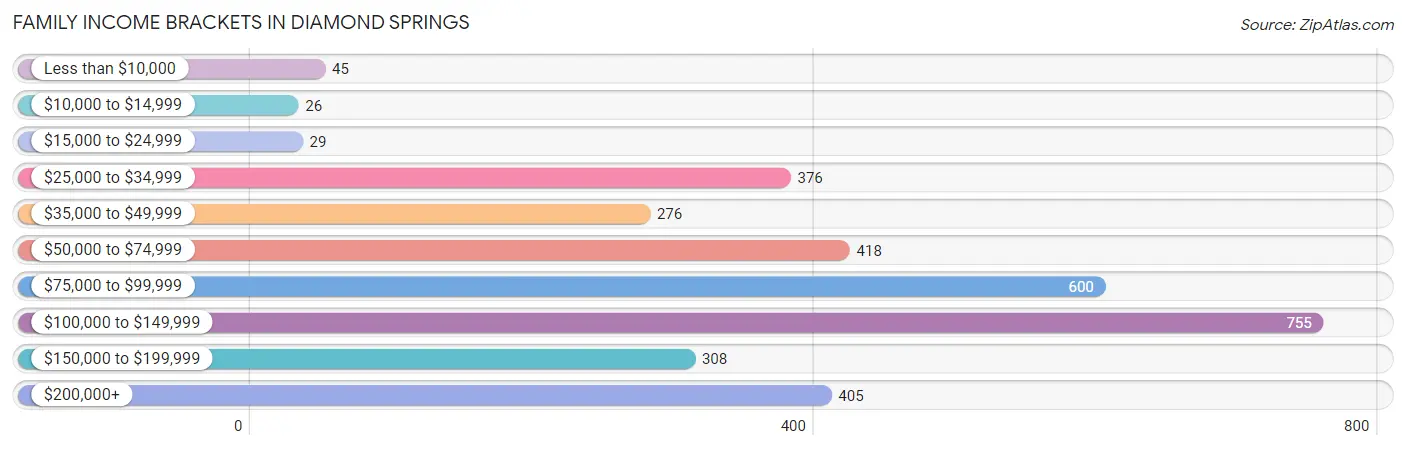
| Income Bracket | # Families | % Families |
| Less than $10,000 | 45 | 1.4% |
| $10,000 to $14,999 | 26 | 0.8% |
| $15,000 to $24,999 | 29 | 0.9% |
| $25,000 to $34,999 | 376 | 11.6% |
| $35,000 to $49,999 | 276 | 8.5% |
| $50,000 to $74,999 | 418 | 12.9% |
| $75,000 to $99,999 | 600 | 18.5% |
| $100,000 to $149,999 | 755 | 23.3% |
| $150,000 to $199,999 | 308 | 9.5% |
| $200,000+ | 405 | 12.5% |
Family Income by Famaliy Size in Diamond Springs
4-person families (497 | 15.3%) account for the highest median family income in Diamond Springs with $130,521 per family, while 2-person families (1,574 | 48.5%) have the highest median income of $41,898 per family member.
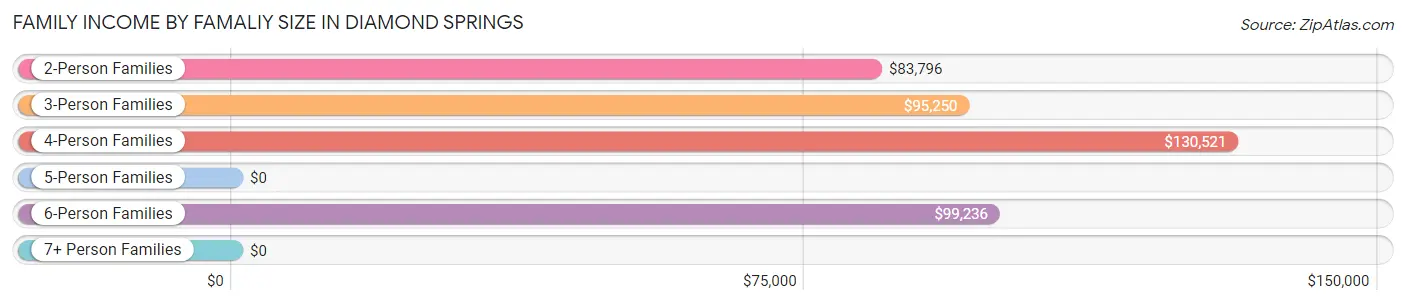
| Income Bracket | # Families | Median Income |
| 2-Person Families | 1,574 (48.5%) | $83,796 |
| 3-Person Families | 652 (20.1%) | $95,250 |
| 4-Person Families | 497 (15.3%) | $130,521 |
| 5-Person Families | 396 (12.2%) | $0 |
| 6-Person Families | 123 (3.8%) | $99,236 |
| 7+ Person Families | 0 (0.0%) | $0 |
| Total | 3,242 (100.0%) | $93,279 |
Family Income by Number of Earners in Diamond Springs
The median family income in Diamond Springs is $93,279, with families comprising 3+ earners (359) having the highest median family income of $133,750, while families with no earners (666) have the lowest median family income of $60,333, accounting for 11.1% and 20.5% of families, respectively.
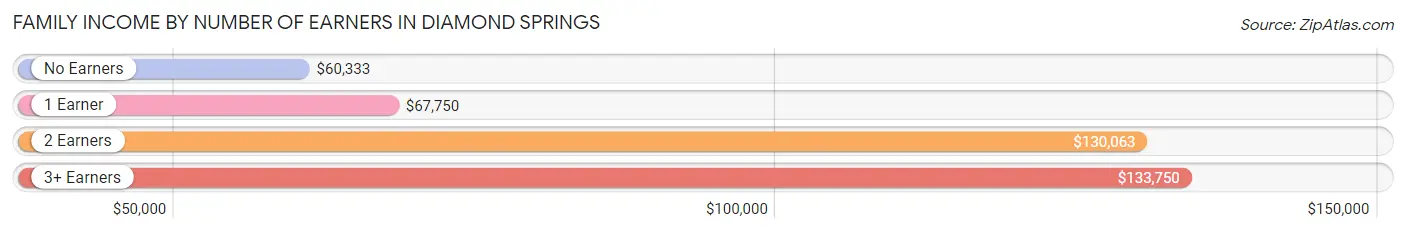
| Number of Earners | # Families | Median Income |
| No Earners | 666 (20.5%) | $60,333 |
| 1 Earner | 1,161 (35.8%) | $67,750 |
| 2 Earners | 1,056 (32.6%) | $130,063 |
| 3+ Earners | 359 (11.1%) | $133,750 |
| Total | 3,242 (100.0%) | $93,279 |
Household Income in Diamond Springs
Household Income Brackets in Diamond Springs
With 882 households falling in the category, the $100,000 to $149,999 income range is the most frequent in Diamond Springs, accounting for 17.3% of all households. In contrast, only 138 households (2.7%) fall into the $10,000 to $14,999 income bracket, making it the least populous group.
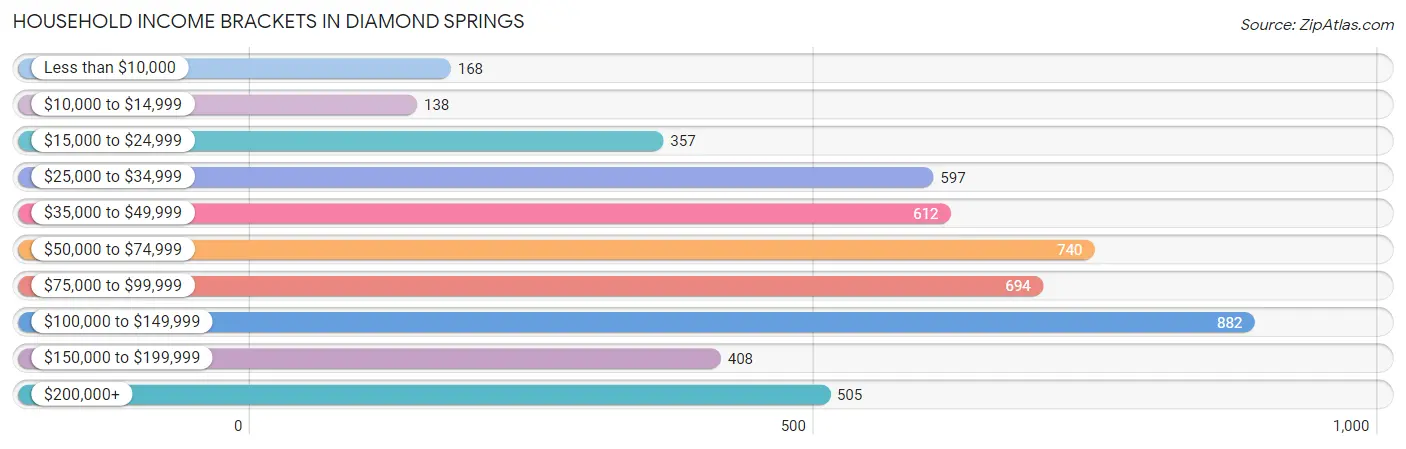
| Income Bracket | # Households | % Households |
| Less than $10,000 | 168 | 3.3% |
| $10,000 to $14,999 | 138 | 2.7% |
| $15,000 to $24,999 | 357 | 7.0% |
| $25,000 to $34,999 | 597 | 11.7% |
| $35,000 to $49,999 | 612 | 12.0% |
| $50,000 to $74,999 | 740 | 14.5% |
| $75,000 to $99,999 | 694 | 13.6% |
| $100,000 to $149,999 | 882 | 17.3% |
| $150,000 to $199,999 | 408 | 8.0% |
| $200,000+ | 505 | 9.9% |
Household Income by Householder Age in Diamond Springs
The median household income in Diamond Springs is $71,279, with the highest median household income of $98,333 found in the 25 to 44 years age bracket for the primary householder. A total of 1,476 households (28.9%) fall into this category. Meanwhile, the 15 to 24 years age bracket for the primary householder has the lowest median household income of $0, with 53 households (1.0%) in this group.
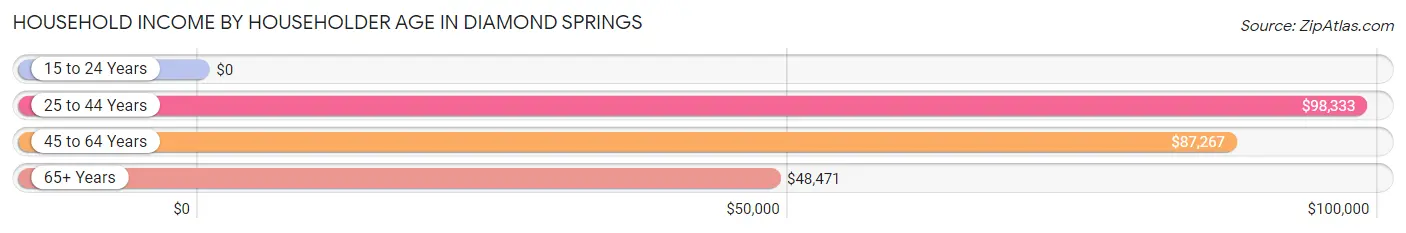
| Income Bracket | # Households | Median Income |
| 15 to 24 Years | 53 (1.0%) | $0 |
| 25 to 44 Years | 1,476 (28.9%) | $98,333 |
| 45 to 64 Years | 1,560 (30.6%) | $87,267 |
| 65+ Years | 2,011 (39.4%) | $48,471 |
| Total | 5,100 (100.0%) | $71,279 |
Poverty in Diamond Springs
Income Below Poverty by Sex and Age in Diamond Springs
With 13.5% poverty level for males and 10.0% for females among the residents of Diamond Springs, under 5 year old males and 18 to 24 year old females are the most vulnerable to poverty, with 220 males (57.3%) and 37 females (27.4%) in their respective age groups living below the poverty level.
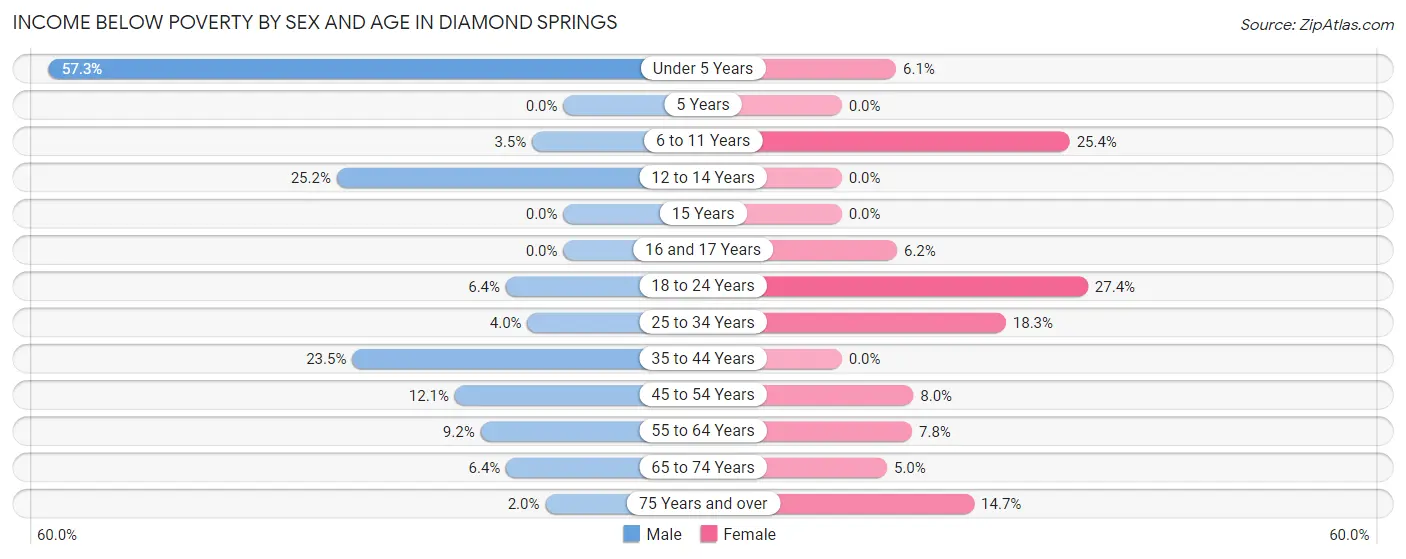
| Age Bracket | Male | Female |
| Under 5 Years | 220 (57.3%) | 19 (6.0%) |
| 5 Years | 0 (0.0%) | 0 (0.0%) |
| 6 to 11 Years | 12 (3.5%) | 133 (25.4%) |
| 12 to 14 Years | 78 (25.2%) | 0 (0.0%) |
| 15 Years | 0 (0.0%) | 0 (0.0%) |
| 16 and 17 Years | 0 (0.0%) | 8 (6.1%) |
| 18 to 24 Years | 26 (6.4%) | 37 (27.4%) |
| 25 to 34 Years | 25 (4.0%) | 118 (18.3%) |
| 35 to 44 Years | 249 (23.5%) | 0 (0.0%) |
| 45 to 54 Years | 68 (12.1%) | 48 (8.0%) |
| 55 to 64 Years | 70 (9.2%) | 81 (7.8%) |
| 65 to 74 Years | 53 (6.4%) | 37 (5.0%) |
| 75 Years and over | 11 (2.0%) | 116 (14.7%) |
| Total | 812 (13.5%) | 597 (10.0%) |
Income Above Poverty by Sex and Age in Diamond Springs
According to the poverty statistics in Diamond Springs, males aged 5 years and females aged 5 years are the age groups that are most secure financially, with 100.0% of males and 100.0% of females in these age groups living above the poverty line.
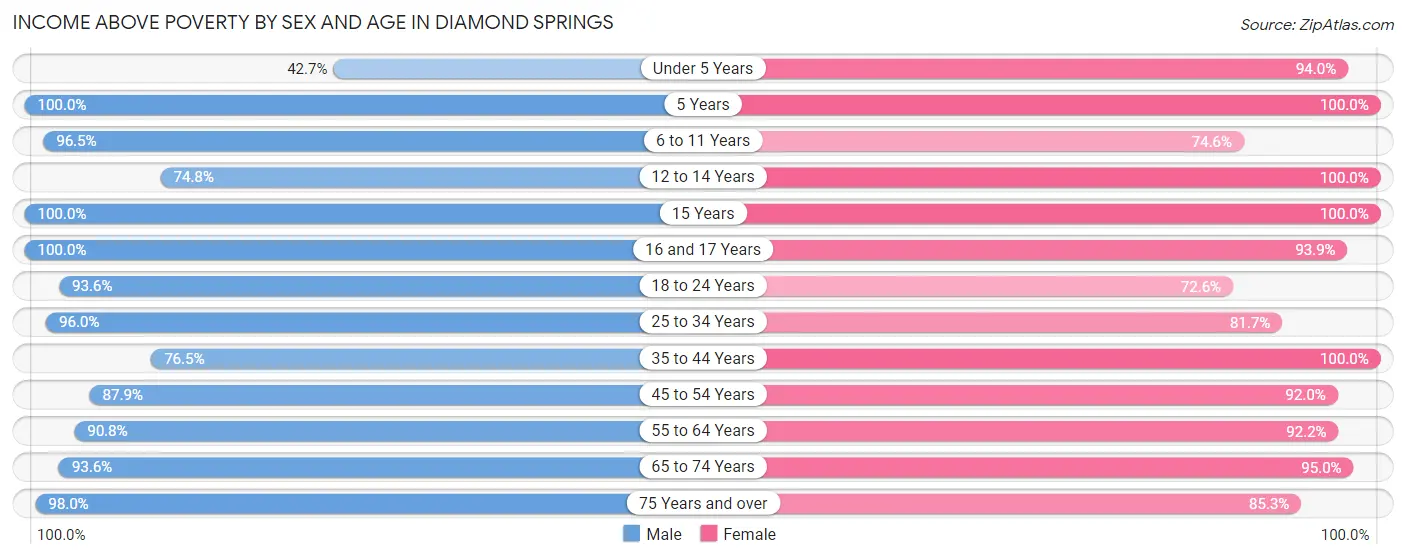
| Age Bracket | Male | Female |
| Under 5 Years | 164 (42.7%) | 295 (94.0%) |
| 5 Years | 29 (100.0%) | 39 (100.0%) |
| 6 to 11 Years | 333 (96.5%) | 391 (74.6%) |
| 12 to 14 Years | 231 (74.8%) | 150 (100.0%) |
| 15 Years | 97 (100.0%) | 88 (100.0%) |
| 16 and 17 Years | 67 (100.0%) | 122 (93.9%) |
| 18 to 24 Years | 380 (93.6%) | 98 (72.6%) |
| 25 to 34 Years | 600 (96.0%) | 528 (81.7%) |
| 35 to 44 Years | 810 (76.5%) | 786 (100.0%) |
| 45 to 54 Years | 495 (87.9%) | 554 (92.0%) |
| 55 to 64 Years | 688 (90.8%) | 954 (92.2%) |
| 65 to 74 Years | 779 (93.6%) | 697 (95.0%) |
| 75 Years and over | 535 (98.0%) | 671 (85.3%) |
| Total | 5,208 (86.5%) | 5,373 (90.0%) |
Income Below Poverty Among Married-Couple Families in Diamond Springs
The poverty statistics for married-couple families in Diamond Springs show that 11.8% or 314 of the total 2,663 families live below the poverty line. Families with 3 or 4 children have the highest poverty rate of 55.9%, comprising of 213 families. On the other hand, families with no children have the lowest poverty rate of 2.0%, which includes 33 families.
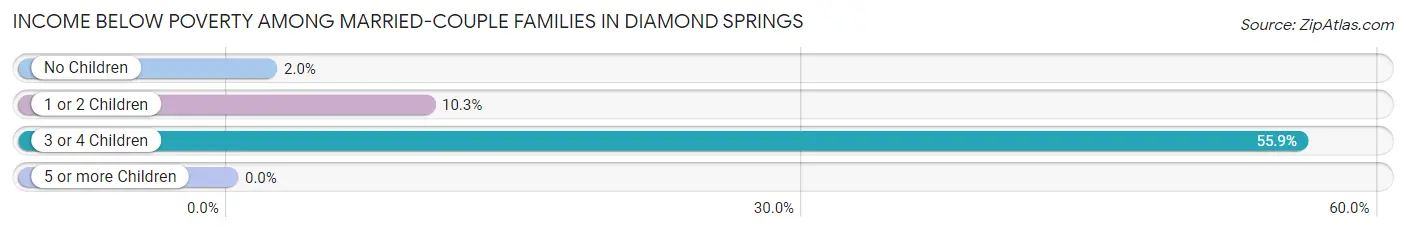
| Children | Above Poverty | Below Poverty |
| No Children | 1,588 (98.0%) | 33 (2.0%) |
| 1 or 2 Children | 593 (89.7%) | 68 (10.3%) |
| 3 or 4 Children | 168 (44.1%) | 213 (55.9%) |
| 5 or more Children | 0 (0.0%) | 0 (0.0%) |
| Total | 2,349 (88.2%) | 314 (11.8%) |
Income Below Poverty Among Single-Parent Households in Diamond Springs
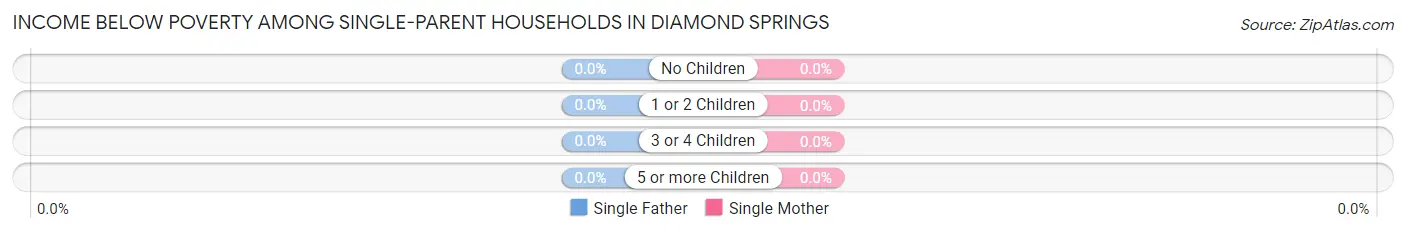
| Children | Single Father | Single Mother |
| No Children | 0 (0.0%) | 0 (0.0%) |
| 1 or 2 Children | 0 (0.0%) | 0 (0.0%) |
| 3 or 4 Children | 0 (0.0%) | 0 (0.0%) |
| 5 or more Children | 0 (0.0%) | 0 (0.0%) |
| Total | 0 (0.0%) | 0 (0.0%) |
Income Below Poverty Among Married-Couple vs Single-Parent Households in Diamond Springs
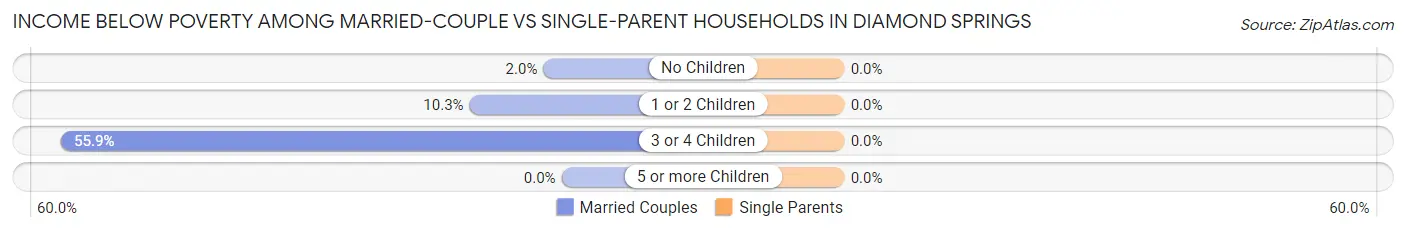
| Children | Married-Couple Families | Single-Parent Households |
| No Children | 33 (2.0%) | 0 (0.0%) |
| 1 or 2 Children | 68 (10.3%) | 0 (0.0%) |
| 3 or 4 Children | 213 (55.9%) | 0 (0.0%) |
| 5 or more Children | 0 (0.0%) | 0 (0.0%) |
| Total | 314 (11.8%) | 0 (0.0%) |
Race in Diamond Springs
The most populous races in Diamond Springs are White / Caucasian (10,595 | 86.9%), Hispanic or Latino (2,167 | 17.8%), and Two or more Races (752 | 6.2%).
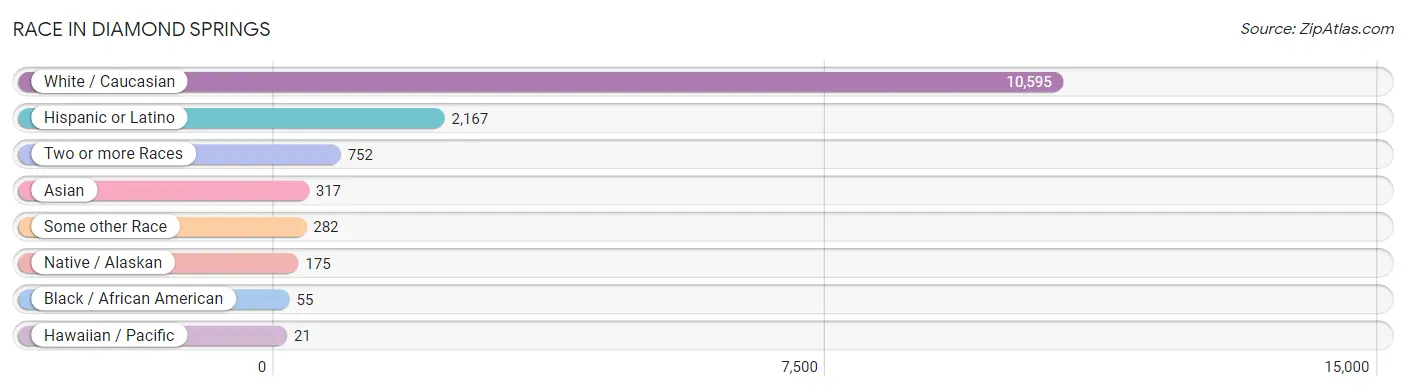
| Race | # Population | % Population |
| Asian | 317 | 2.6% |
| Black / African American | 55 | 0.4% |
| Hawaiian / Pacific | 21 | 0.2% |
| Hispanic or Latino | 2,167 | 17.8% |
| Native / Alaskan | 175 | 1.4% |
| White / Caucasian | 10,595 | 86.9% |
| Two or more Races | 752 | 6.2% |
| Some other Race | 282 | 2.3% |
| Total | 12,197 | 100.0% |
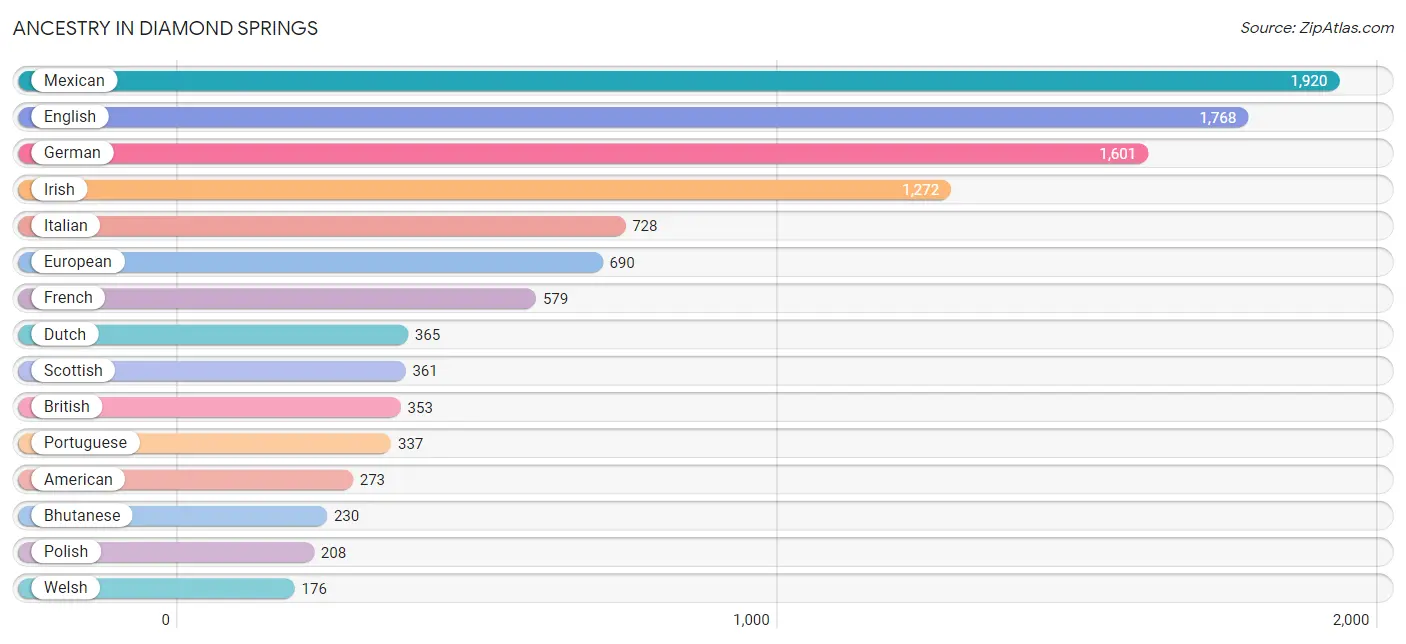
Ancestry in Diamond Springs
The most populous ancestries reported in Diamond Springs are Mexican (1,920 | 15.7%), English (1,768 | 14.5%), German (1,601 | 13.1%), Irish (1,272 | 10.4%), and Italian (728 | 6.0%), together accounting for 59.8% of all Diamond Springs residents.
| Ancestry | # Population | % Population |
| Aleut | 23 | 0.2% |
| American | 273 | 2.2% |
| Apache | 17 | 0.1% |
| Arab | 12 | 0.1% |
| Austrian | 12 | 0.1% |
| Barbadian | 10 | 0.1% |
| Bhutanese | 230 | 1.9% |
| British | 353 | 2.9% |
| Burmese | 122 | 1.0% |
| Canadian | 11 | 0.1% |
| Central American | 12 | 0.1% |
| Central American Indian | 43 | 0.4% |
| Cherokee | 45 | 0.4% |
| Choctaw | 12 | 0.1% |
| Colombian | 6 | 0.1% |
| Croatian | 32 | 0.3% |
| Czech | 18 | 0.2% |
| Danish | 128 | 1.1% |
| Dutch | 365 | 3.0% |
| Eastern European | 131 | 1.1% |
| English | 1,768 | 14.5% |
| European | 690 | 5.7% |
| Finnish | 25 | 0.2% |
| French | 579 | 4.8% |
| French American Indian | 37 | 0.3% |
| French Canadian | 50 | 0.4% |
| German | 1,601 | 13.1% |
| Greek | 60 | 0.5% |
| Guatemalan | 12 | 0.1% |
| Hungarian | 21 | 0.2% |
| Indian (Asian) | 75 | 0.6% |
| Irish | 1,272 | 10.4% |
| Italian | 728 | 6.0% |
| Korean | 164 | 1.3% |
| Lithuanian | 16 | 0.1% |
| Mexican | 1,920 | 15.7% |
| Mexican American Indian | 34 | 0.3% |
| Navajo | 12 | 0.1% |
| Northern European | 19 | 0.2% |
| Norwegian | 140 | 1.1% |
| Polish | 208 | 1.7% |
| Portuguese | 337 | 2.8% |
| Potawatomi | 18 | 0.2% |
| Puerto Rican | 16 | 0.1% |
| Romanian | 47 | 0.4% |
| Russian | 41 | 0.3% |
| Samoan | 21 | 0.2% |
| Scandinavian | 17 | 0.1% |
| Scotch-Irish | 132 | 1.1% |
| Scottish | 361 | 3.0% |
| Slovak | 8 | 0.1% |
| South American | 6 | 0.1% |
| Spaniard | 20 | 0.2% |
| Spanish | 102 | 0.8% |
| Sri Lankan | 3 | 0.0% |
| Swedish | 134 | 1.1% |
| Swiss | 37 | 0.3% |
| Welsh | 176 | 1.4% |
| Yugoslavian | 5 | 0.0% | View All 59 Rows |
Immigrants in Diamond Springs
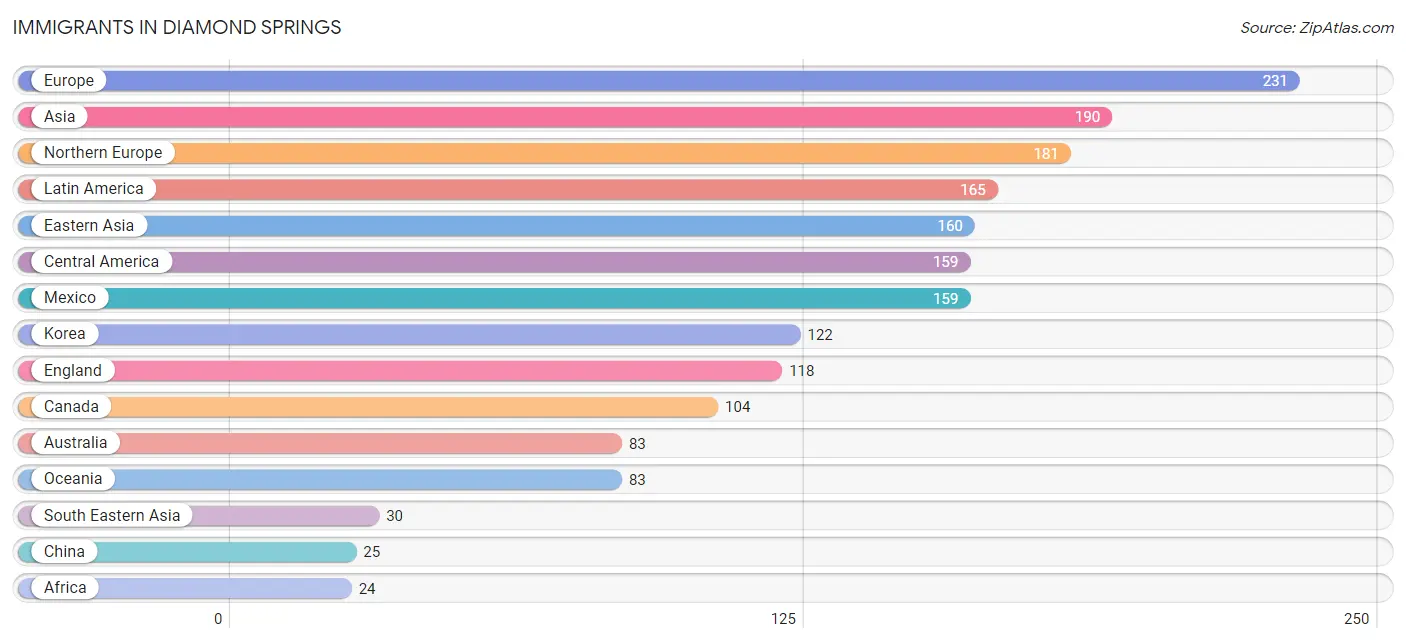
The most numerous immigrant groups reported in Diamond Springs came from Europe (231 | 1.9%), Asia (190 | 1.6%), Northern Europe (181 | 1.5%), Latin America (165 | 1.3%), and Eastern Asia (160 | 1.3%), together accounting for 7.6% of all Diamond Springs residents.
| Immigration Origin | # Population | % Population |
| Africa | 24 | 0.2% |
| Asia | 190 | 1.6% |
| Australia | 83 | 0.7% |
| Cambodia | 14 | 0.1% |
| Canada | 104 | 0.9% |
| Central America | 159 | 1.3% |
| China | 25 | 0.2% |
| Colombia | 6 | 0.1% |
| Eastern Africa | 12 | 0.1% |
| Eastern Asia | 160 | 1.3% |
| Eastern Europe | 15 | 0.1% |
| Egypt | 12 | 0.1% |
| England | 118 | 1.0% |
| Europe | 231 | 1.9% |
| Germany | 20 | 0.2% |
| Ireland | 15 | 0.1% |
| Italy | 15 | 0.1% |
| Japan | 13 | 0.1% |
| Kenya | 12 | 0.1% |
| Korea | 122 | 1.0% |
| Latin America | 165 | 1.3% |
| Mexico | 159 | 1.3% |
| Northern Africa | 12 | 0.1% |
| Northern Europe | 181 | 1.5% |
| Oceania | 83 | 0.7% |
| Philippines | 13 | 0.1% |
| Romania | 15 | 0.1% |
| South America | 6 | 0.1% |
| South Eastern Asia | 30 | 0.3% |
| Southern Europe | 15 | 0.1% |
| Vietnam | 3 | 0.0% |
| Western Europe | 20 | 0.2% | View All 32 Rows |
Sex and Age in Diamond Springs
Sex and Age in Diamond Springs
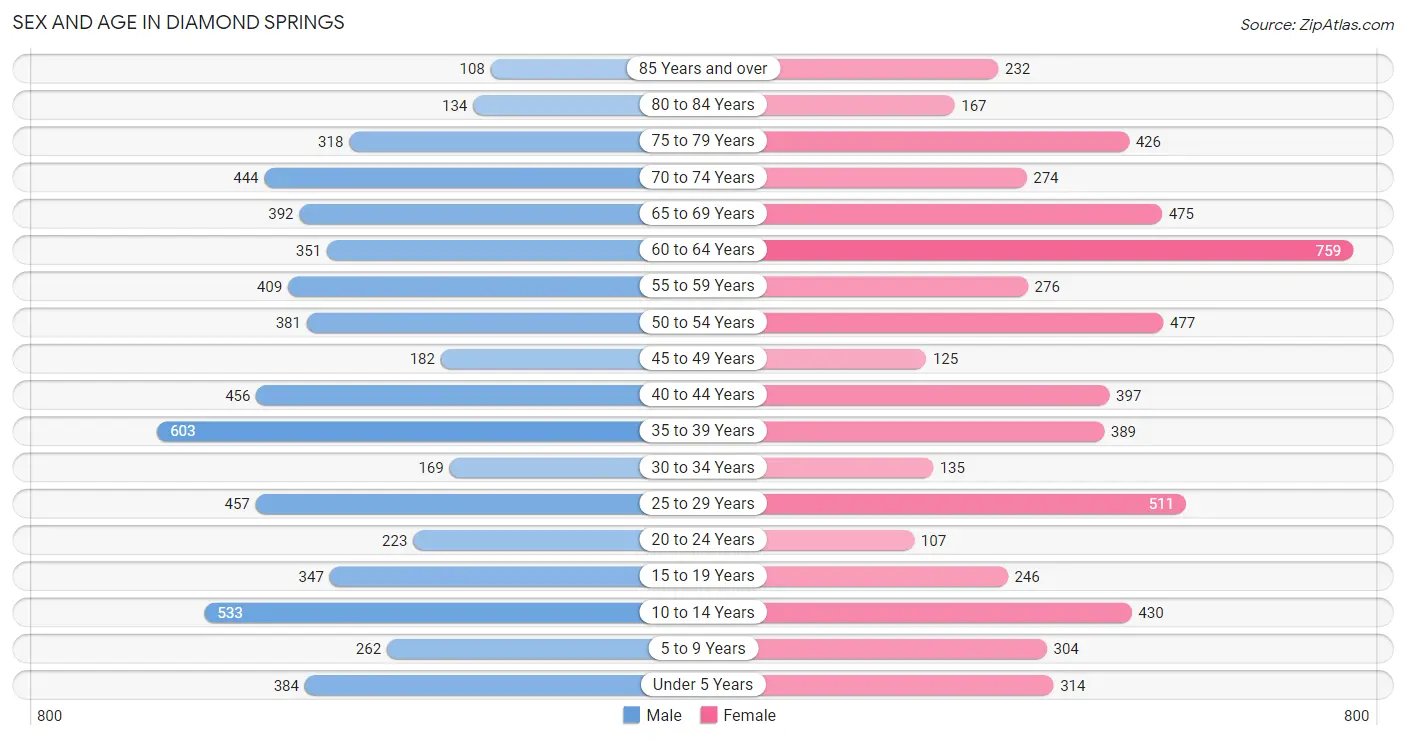
The most populous age groups in Diamond Springs are 35 to 39 Years (603 | 9.8%) for men and 60 to 64 Years (759 | 12.6%) for women.
| Age Bracket | Male | Female |
| Under 5 Years | 384 (6.2%) | 314 (5.2%) |
| 5 to 9 Years | 262 (4.3%) | 304 (5.0%) |
| 10 to 14 Years | 533 (8.7%) | 430 (7.1%) |
| 15 to 19 Years | 347 (5.6%) | 246 (4.1%) |
| 20 to 24 Years | 223 (3.6%) | 107 (1.8%) |
| 25 to 29 Years | 457 (7.4%) | 511 (8.5%) |
| 30 to 34 Years | 169 (2.8%) | 135 (2.2%) |
| 35 to 39 Years | 603 (9.8%) | 389 (6.4%) |
| 40 to 44 Years | 456 (7.4%) | 397 (6.6%) |
| 45 to 49 Years | 182 (3.0%) | 125 (2.1%) |
| 50 to 54 Years | 381 (6.2%) | 477 (7.9%) |
| 55 to 59 Years | 409 (6.7%) | 276 (4.6%) |
| 60 to 64 Years | 351 (5.7%) | 759 (12.6%) |
| 65 to 69 Years | 392 (6.4%) | 475 (7.9%) |
| 70 to 74 Years | 444 (7.2%) | 274 (4.5%) |
| 75 to 79 Years | 318 (5.2%) | 426 (7.0%) |
| 80 to 84 Years | 134 (2.2%) | 167 (2.8%) |
| 85 Years and over | 108 (1.8%) | 232 (3.8%) |
| Total | 6,153 (100.0%) | 6,044 (100.0%) |
Families and Households in Diamond Springs
Median Family Size in Diamond Springs
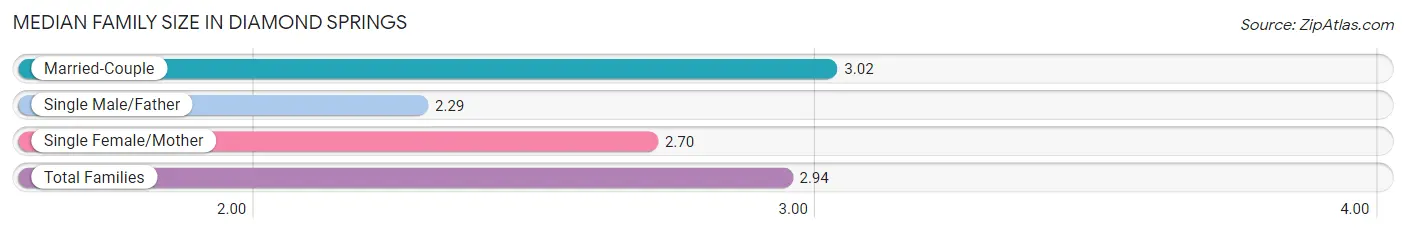
The median family size in Diamond Springs is 2.94 persons per family, with married-couple families (2,663 | 82.1%) accounting for the largest median family size of 3.02 persons per family. On the other hand, single male/father families (195 | 6.0%) represent the smallest median family size with 2.29 persons per family.
| Family Type | # Families | Family Size |
| Married-Couple | 2,663 (82.1%) | 3.02 |
| Single Male/Father | 195 (6.0%) | 2.29 |
| Single Female/Mother | 384 (11.8%) | 2.70 |
| Total Families | 3,242 (100.0%) | 2.94 |
Median Household Size in Diamond Springs
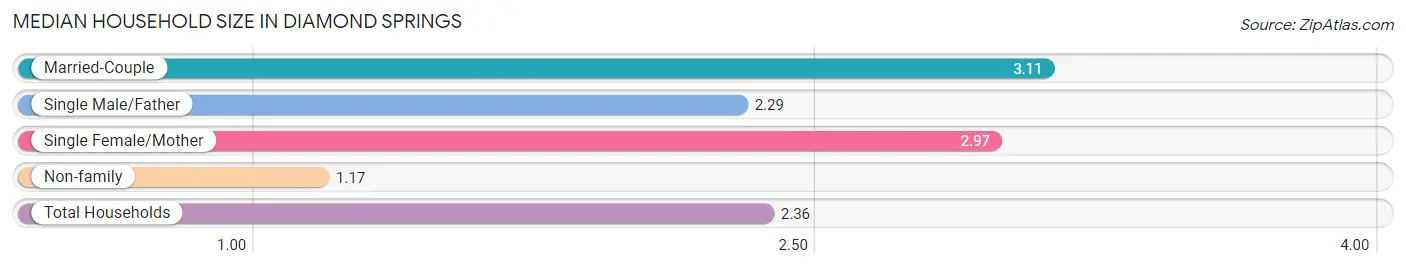
The median household size in Diamond Springs is 2.36 persons per household, with married-couple households (2,663 | 52.2%) accounting for the largest median household size of 3.11 persons per household. non-family households (1,858 | 36.4%) represent the smallest median household size with 1.17 persons per household.
| Household Type | # Households | Household Size |
| Married-Couple | 2,663 (52.2%) | 3.11 |
| Single Male/Father | 195 (3.8%) | 2.29 |
| Single Female/Mother | 384 (7.5%) | 2.97 |
| Non-family | 1,858 (36.4%) | 1.17 |
| Total Households | 5,100 (100.0%) | 2.36 |
Household Size by Marriage Status in Diamond Springs
Out of a total of 5,100 households in Diamond Springs, 3,242 (63.6%) are family households, while 1,858 (36.4%) are nonfamily households. The most numerous type of family households are 2-person households, comprising 1,458, and the most common type of nonfamily households are 1-person households, comprising 1,601.
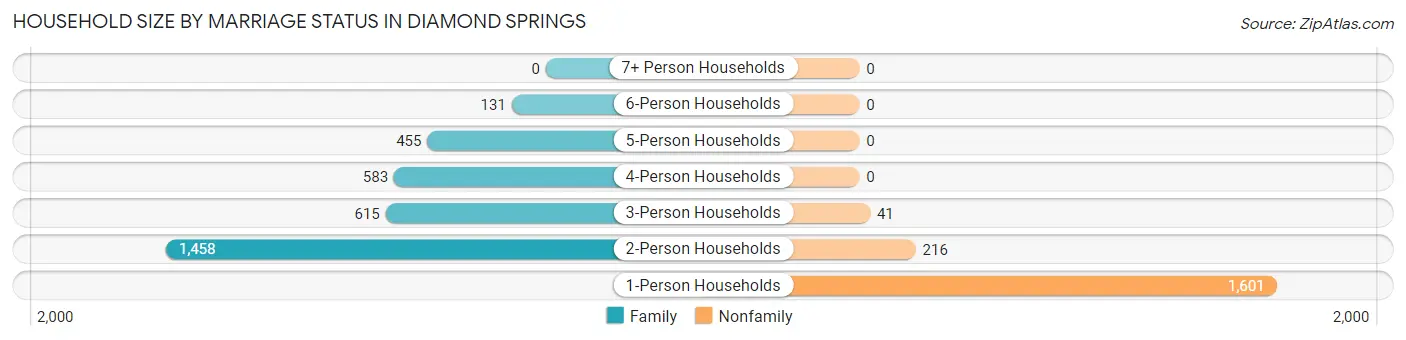
| Household Size | Family Households | Nonfamily Households |
| 1-Person Households | - | 1,601 (31.4%) |
| 2-Person Households | 1,458 (28.6%) | 216 (4.2%) |
| 3-Person Households | 615 (12.1%) | 41 (0.8%) |
| 4-Person Households | 583 (11.4%) | 0 (0.0%) |
| 5-Person Households | 455 (8.9%) | 0 (0.0%) |
| 6-Person Households | 131 (2.6%) | 0 (0.0%) |
| 7+ Person Households | 0 (0.0%) | 0 (0.0%) |
| Total | 3,242 (63.6%) | 1,858 (36.4%) |
Female Fertility in Diamond Springs
Fertility by Age in Diamond Springs
Average fertility rate in Diamond Springs is 65.0 births per 1,000 women. Women in the age bracket of 20 to 34 years have the highest fertility rate with 165.0 births per 1,000 women. Women in the age bracket of 20 to 34 years acount for 100.0% of all women with births.
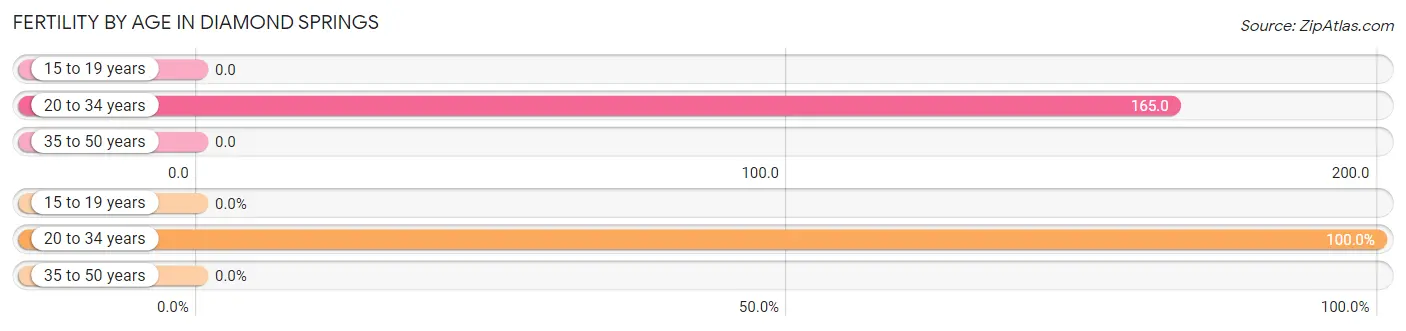
| Age Bracket | Women with Births | Births / 1,000 Women |
| 15 to 19 years | 0 (0.0%) | 0.0 |
| 20 to 34 years | 124 (100.0%) | 165.0 |
| 35 to 50 years | 0 (0.0%) | 0.0 |
| Total | 124 (100.0%) | 65.0 |
Fertility by Age by Marriage Status in Diamond Springs
46.0% of women with births (124) in Diamond Springs are married. The highest percentage of unmarried women with births falls into 20 to 34 years age bracket with 54.0% of them unmarried at the time of birth, while the lowest percentage of unmarried women with births belong to 20 to 34 years age bracket with 54.0% of them unmarried.
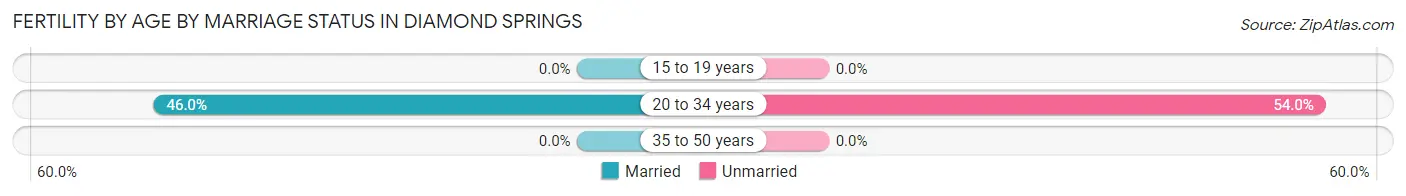
| Age Bracket | Married | Unmarried |
| 15 to 19 years | 0 (0.0%) | 0 (0.0%) |
| 20 to 34 years | 57 (46.0%) | 67 (54.0%) |
| 35 to 50 years | 0 (0.0%) | 0 (0.0%) |
| Total | 57 (46.0%) | 67 (54.0%) |
Fertility by Education in Diamond Springs

| Educational Attainment | Women with Births | Births / 1,000 Women |
| Less than High School | 0 (0.0%) | 0.0 |
| High School Diploma | 0 (0.0%) | 0.0 |
| College or Associate's Degree | 57 (46.0%) | 98.0 |
| Bachelor's Degree | 67 (54.0%) | 137.0 |
| Graduate Degree | 0 (0.0%) | 0.0 |
| Total | 124 (100.0%) | 65.0 |
Fertility by Education by Marriage Status in Diamond Springs
54.0% of women with births in Diamond Springs are unmarried. Women with the educational attainment of college or associate's degree are most likely to be married with 100.0% of them married at childbirth, while women with the educational attainment of bachelor's degree are least likely to be married with 100.0% of them unmarried at childbirth.
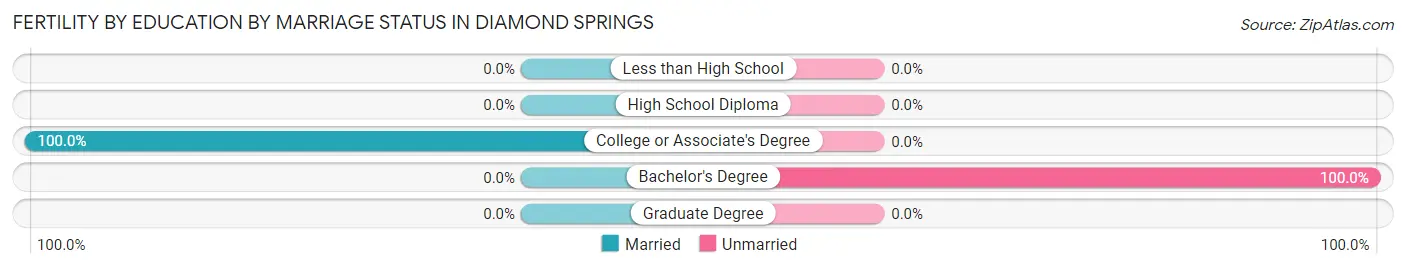
| Educational Attainment | Married | Unmarried |
| Less than High School | 0 (0.0%) | 0 (0.0%) |
| High School Diploma | 0 (0.0%) | 0 (0.0%) |
| College or Associate's Degree | 57 (100.0%) | 0 (0.0%) |
| Bachelor's Degree | 0 (0.0%) | 67 (100.0%) |
| Graduate Degree | 0 (0.0%) | 0 (0.0%) |
| Total | 57 (46.0%) | 67 (54.0%) |
Employment Characteristics in Diamond Springs
Employment by Class of Employer in Diamond Springs
Among the 5,159 employed individuals in Diamond Springs, private company employees (2,624 | 50.9%), local government employees (720 | 14.0%), and self-employed (not incorporated) (636 | 12.3%) make up the most common classes of employment.
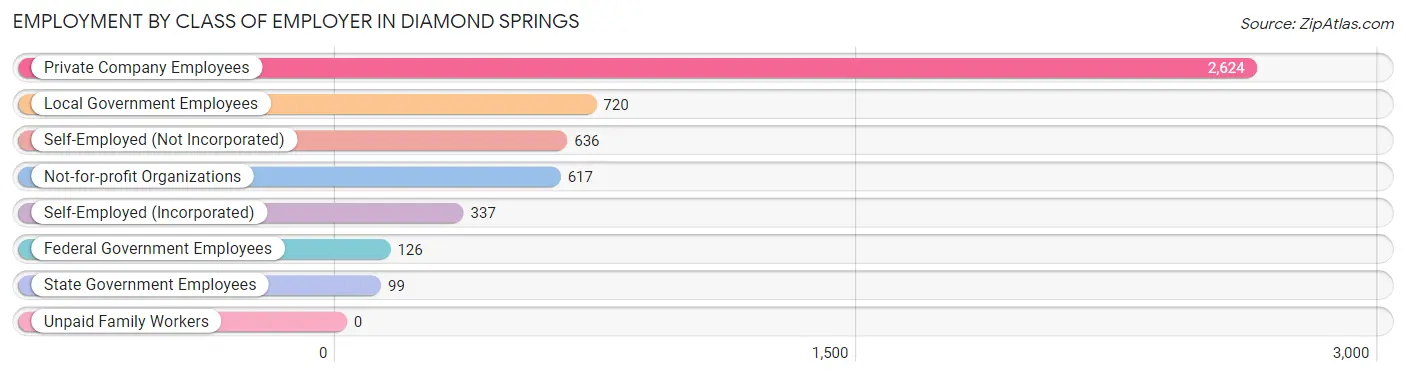
| Employer Class | # Employees | % Employees |
| Private Company Employees | 2,624 | 50.9% |
| Self-Employed (Incorporated) | 337 | 6.5% |
| Self-Employed (Not Incorporated) | 636 | 12.3% |
| Not-for-profit Organizations | 617 | 12.0% |
| Local Government Employees | 720 | 14.0% |
| State Government Employees | 99 | 1.9% |
| Federal Government Employees | 126 | 2.4% |
| Unpaid Family Workers | 0 | 0.0% |
| Total | 5,159 | 100.0% |
Employment Status by Age in Diamond Springs
According to the labor force statistics for Diamond Springs, out of the total population over 16 years of age (9,785), 55.9% or 5,470 individuals are in the labor force, with 5.4% or 295 of them unemployed. The age group with the highest labor force participation rate is 35 to 44 years, with 85.2% or 1,572 individuals in the labor force. Within the labor force, the 20 to 24 years age range has the highest percentage of unemployed individuals, with 25.2% or 68 of them being unemployed.
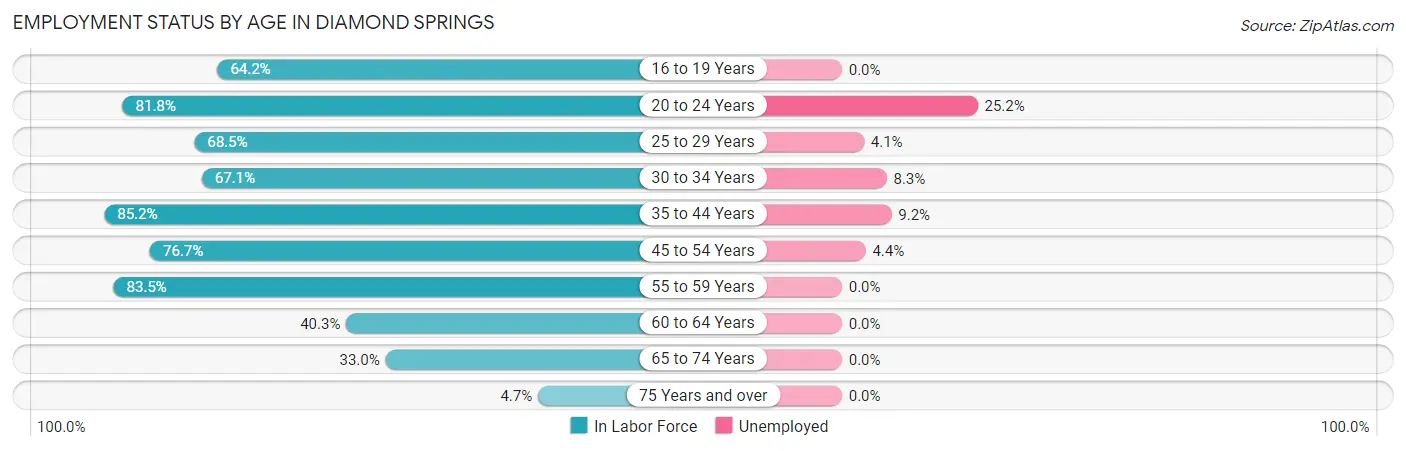
| Age Bracket | In Labor Force | Unemployed |
| 16 to 19 Years | 262 (64.2%) | 0 (0.0%) |
| 20 to 24 Years | 270 (81.8%) | 68 (25.2%) |
| 25 to 29 Years | 663 (68.5%) | 27 (4.1%) |
| 30 to 34 Years | 204 (67.1%) | 17 (8.3%) |
| 35 to 44 Years | 1,572 (85.2%) | 145 (9.2%) |
| 45 to 54 Years | 894 (76.7%) | 39 (4.4%) |
| 55 to 59 Years | 572 (83.5%) | 0 (0.0%) |
| 60 to 64 Years | 447 (40.3%) | 0 (0.0%) |
| 65 to 74 Years | 523 (33.0%) | 0 (0.0%) |
| 75 Years and over | 65 (4.7%) | 0 (0.0%) |
| Total | 5,470 (55.9%) | 295 (5.4%) |
Employment Status by Educational Attainment in Diamond Springs
According to labor force statistics for Diamond Springs, 71.6% of individuals (4,351) out of the total population between 25 and 64 years of age (6,077) are in the labor force, with 5.2% or 226 of them being unemployed. The group with the highest labor force participation rate are those with the educational attainment of bachelor's degree or higher, with 82.9% or 1,346 individuals in the labor force. Within the labor force, individuals with college / associate degree education have the highest percentage of unemployment, with 9.8% or 189 of them being unemployed.
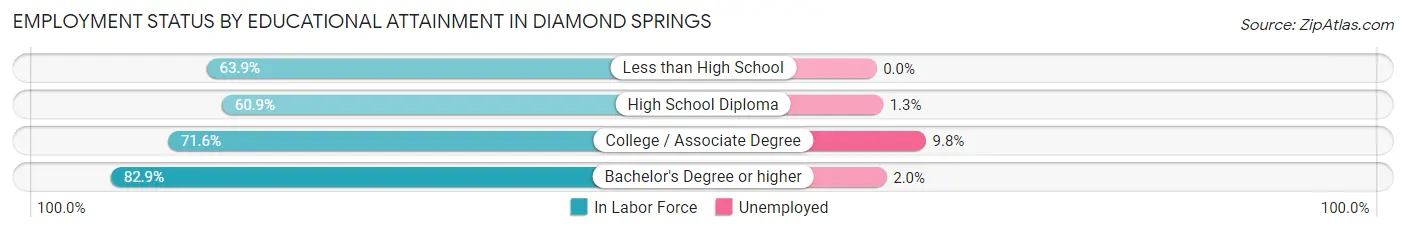
| Educational Attainment | In Labor Force | Unemployed |
| Less than High School | 129 (63.9%) | 0 (0.0%) |
| High School Diploma | 952 (60.9%) | 20 (1.3%) |
| College / Associate Degree | 1,924 (71.6%) | 263 (9.8%) |
| Bachelor's Degree or higher | 1,346 (82.9%) | 32 (2.0%) |
| Total | 4,351 (71.6%) | 316 (5.2%) |
Employment Occupations by Sex in Diamond Springs
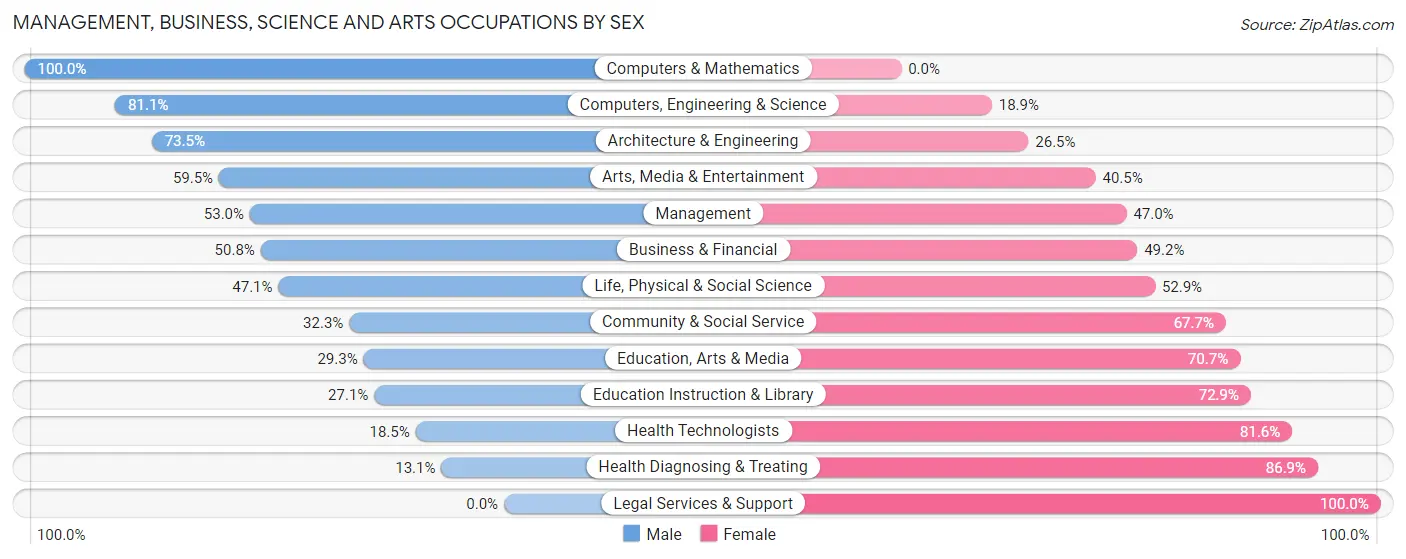
Management, Business, Science and Arts Occupations
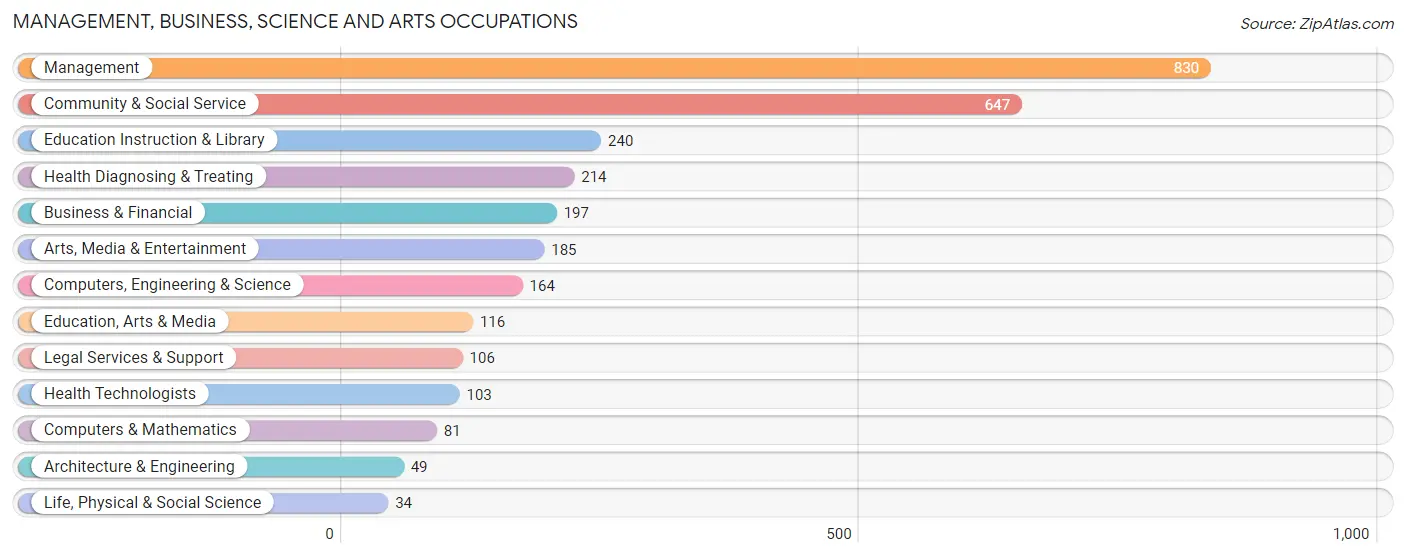
The most common Management, Business, Science and Arts occupations in Diamond Springs are Management (830 | 16.0%), Community & Social Service (647 | 12.5%), Education Instruction & Library (240 | 4.6%), Health Diagnosing & Treating (214 | 4.1%), and Business & Financial (197 | 3.8%).
Management, Business, Science and Arts Occupations by Sex
Within the Management, Business, Science and Arts occupations in Diamond Springs, the most male-oriented occupations are Computers & Mathematics (100.0%), Computers, Engineering & Science (81.1%), and Architecture & Engineering (73.5%), while the most female-oriented occupations are Legal Services & Support (100.0%), Health Diagnosing & Treating (86.9%), and Health Technologists (81.6%).
| Occupation | Male | Female |
| Management | 440 (53.0%) | 390 (47.0%) |
| Business & Financial | 100 (50.8%) | 97 (49.2%) |
| Computers, Engineering & Science | 133 (81.1%) | 31 (18.9%) |
| Computers & Mathematics | 81 (100.0%) | 0 (0.0%) |
| Architecture & Engineering | 36 (73.5%) | 13 (26.5%) |
| Life, Physical & Social Science | 16 (47.1%) | 18 (52.9%) |
| Community & Social Service | 209 (32.3%) | 438 (67.7%) |
| Education, Arts & Media | 34 (29.3%) | 82 (70.7%) |
| Legal Services & Support | 0 (0.0%) | 106 (100.0%) |
| Education Instruction & Library | 65 (27.1%) | 175 (72.9%) |
| Arts, Media & Entertainment | 110 (59.5%) | 75 (40.5%) |
| Health Diagnosing & Treating | 28 (13.1%) | 186 (86.9%) |
| Health Technologists | 19 (18.4%) | 84 (81.6%) |
| Total (Category) | 910 (44.4%) | 1,142 (55.6%) |
| Total (Overall) | 2,831 (54.7%) | 2,345 (45.3%) |
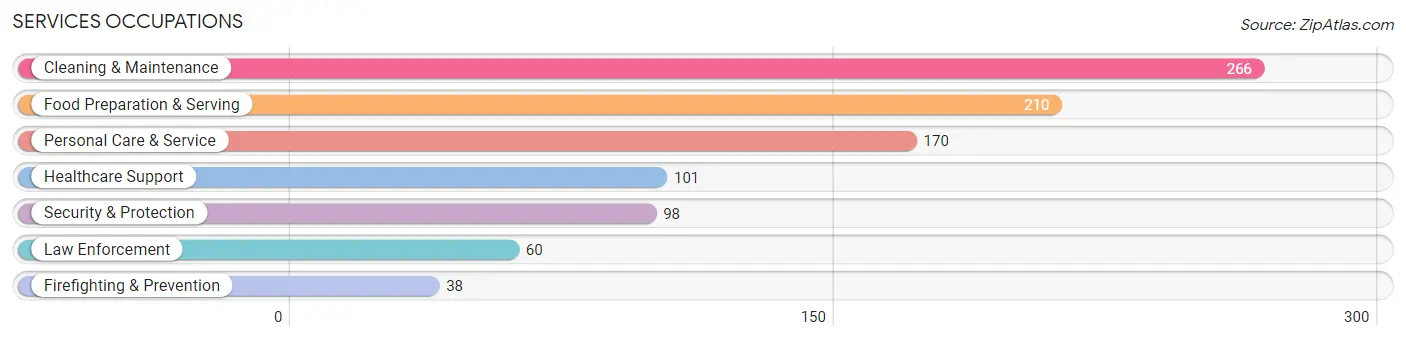
Services Occupations
The most common Services occupations in Diamond Springs are Cleaning & Maintenance (266 | 5.1%), Food Preparation & Serving (210 | 4.1%), Personal Care & Service (170 | 3.3%), Healthcare Support (101 | 1.9%), and Security & Protection (98 | 1.9%).
Services Occupations by Sex
Within the Services occupations in Diamond Springs, the most male-oriented occupations are Law Enforcement (100.0%), Cleaning & Maintenance (92.1%), and Security & Protection (76.5%), while the most female-oriented occupations are Food Preparation & Serving (78.6%), Healthcare Support (70.3%), and Personal Care & Service (65.3%).
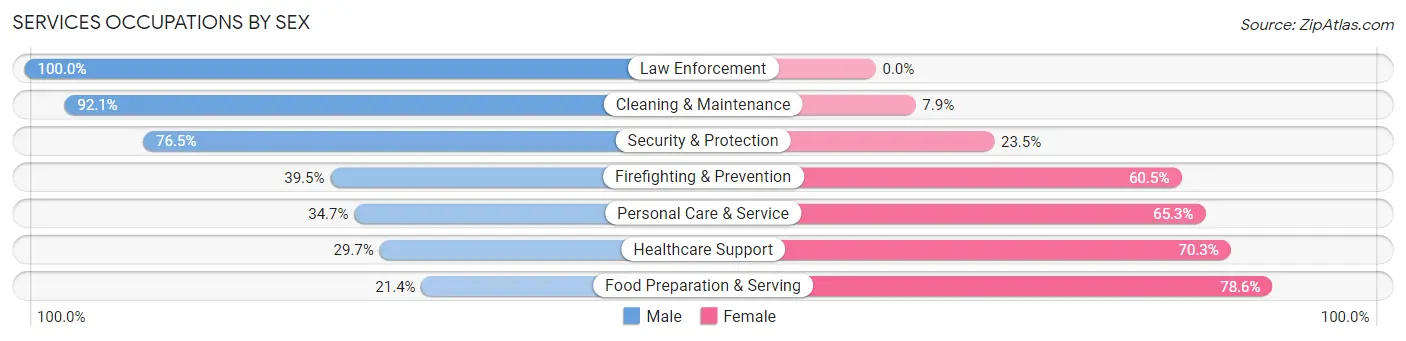
| Occupation | Male | Female |
| Healthcare Support | 30 (29.7%) | 71 (70.3%) |
| Security & Protection | 75 (76.5%) | 23 (23.5%) |
| Firefighting & Prevention | 15 (39.5%) | 23 (60.5%) |
| Law Enforcement | 60 (100.0%) | 0 (0.0%) |
| Food Preparation & Serving | 45 (21.4%) | 165 (78.6%) |
| Cleaning & Maintenance | 245 (92.1%) | 21 (7.9%) |
| Personal Care & Service | 59 (34.7%) | 111 (65.3%) |
| Total (Category) | 454 (53.7%) | 391 (46.3%) |
| Total (Overall) | 2,831 (54.7%) | 2,345 (45.3%) |
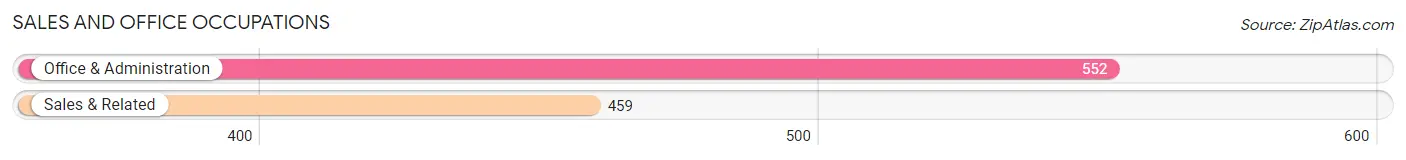
Sales and Office Occupations
The most common Sales and Office occupations in Diamond Springs are Office & Administration (552 | 10.7%), and Sales & Related (459 | 8.9%).
Sales and Office Occupations by Sex
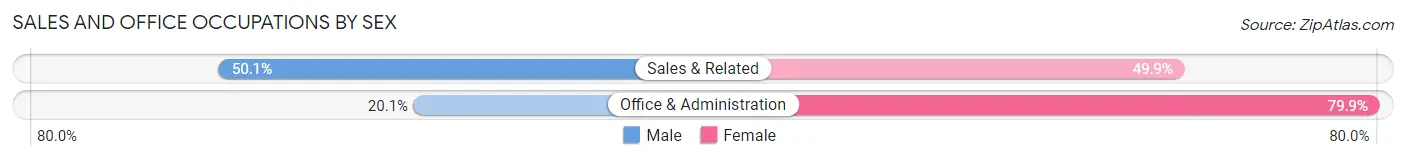
| Occupation | Male | Female |
| Sales & Related | 230 (50.1%) | 229 (49.9%) |
| Office & Administration | 111 (20.1%) | 441 (79.9%) |
| Total (Category) | 341 (33.7%) | 670 (66.3%) |
| Total (Overall) | 2,831 (54.7%) | 2,345 (45.3%) |
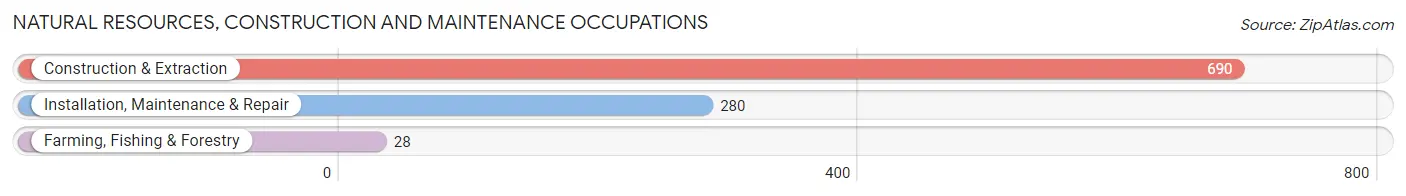
Natural Resources, Construction and Maintenance Occupations
The most common Natural Resources, Construction and Maintenance occupations in Diamond Springs are Construction & Extraction (690 | 13.3%), Installation, Maintenance & Repair (280 | 5.4%), and Farming, Fishing & Forestry (28 | 0.5%).
Natural Resources, Construction and Maintenance Occupations by Sex
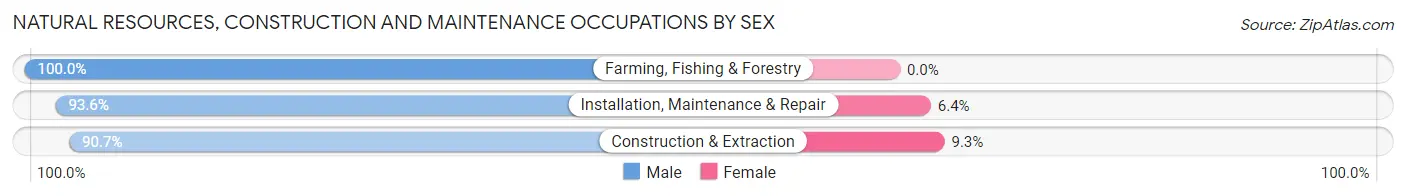
| Occupation | Male | Female |
| Farming, Fishing & Forestry | 28 (100.0%) | 0 (0.0%) |
| Construction & Extraction | 626 (90.7%) | 64 (9.3%) |
| Installation, Maintenance & Repair | 262 (93.6%) | 18 (6.4%) |
| Total (Category) | 916 (91.8%) | 82 (8.2%) |
| Total (Overall) | 2,831 (54.7%) | 2,345 (45.3%) |
Production, Transportation and Moving Occupations
The most common Production, Transportation and Moving occupations in Diamond Springs are Transportation (143 | 2.8%), Production (82 | 1.6%), and Material Moving (45 | 0.9%).
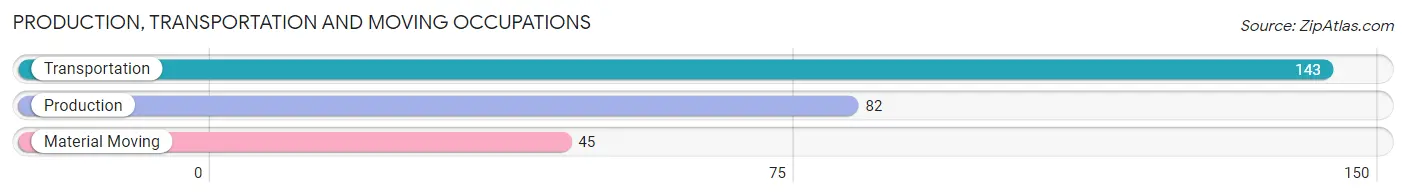
Production, Transportation and Moving Occupations by Sex
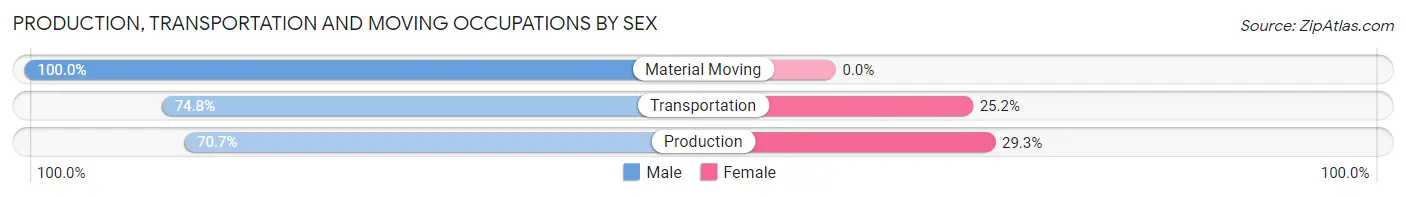
| Occupation | Male | Female |
| Production | 58 (70.7%) | 24 (29.3%) |
| Transportation | 107 (74.8%) | 36 (25.2%) |
| Material Moving | 45 (100.0%) | 0 (0.0%) |
| Total (Category) | 210 (77.8%) | 60 (22.2%) |
| Total (Overall) | 2,831 (54.7%) | 2,345 (45.3%) |
Employment Industries by Sex in Diamond Springs
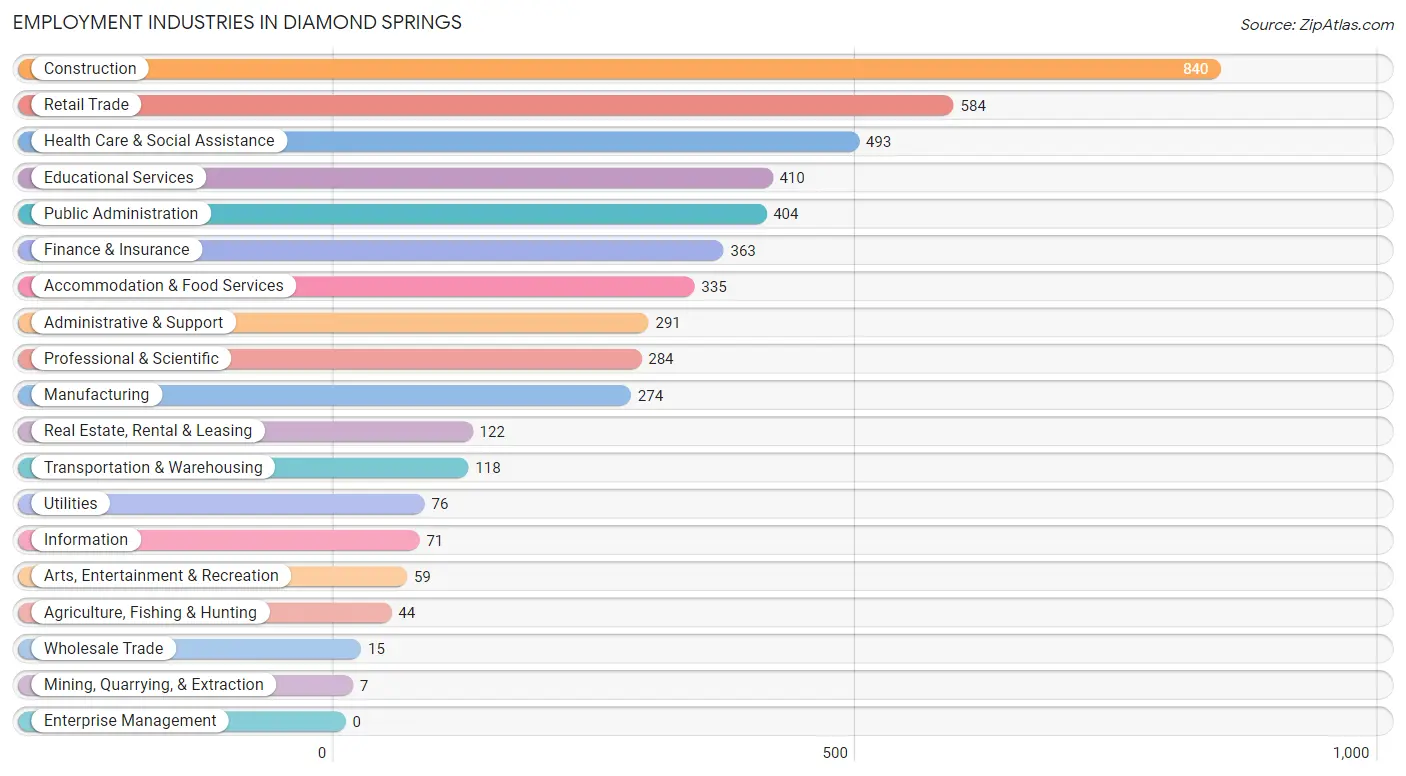
Employment Industries in Diamond Springs
The major employment industries in Diamond Springs include Construction (840 | 16.2%), Retail Trade (584 | 11.3%), Health Care & Social Assistance (493 | 9.5%), Educational Services (410 | 7.9%), and Public Administration (404 | 7.8%).
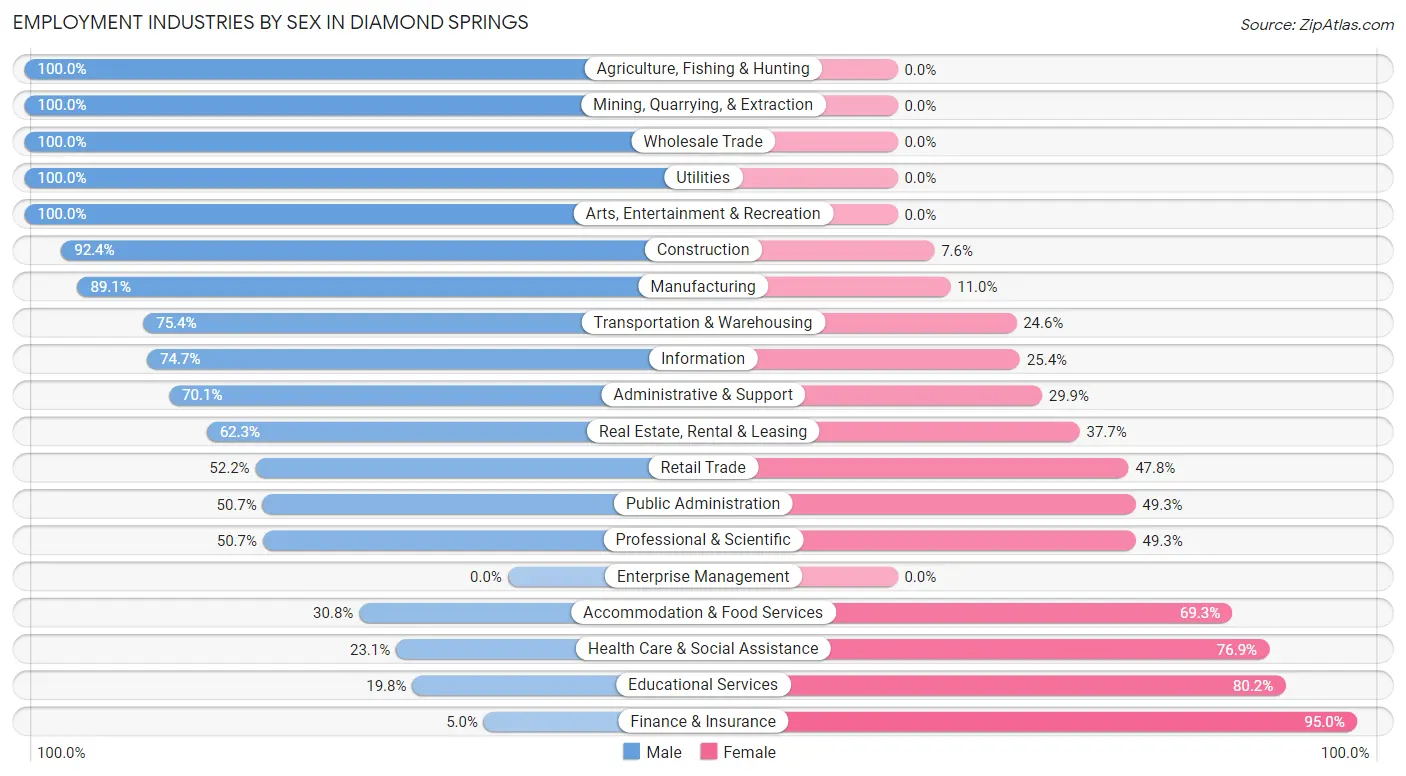
Employment Industries by Sex in Diamond Springs
The Diamond Springs industries that see more men than women are Agriculture, Fishing & Hunting (100.0%), Mining, Quarrying, & Extraction (100.0%), and Wholesale Trade (100.0%), whereas the industries that tend to have a higher number of women are Finance & Insurance (95.0%), Educational Services (80.2%), and Health Care & Social Assistance (76.9%).
| Industry | Male | Female |
| Agriculture, Fishing & Hunting | 44 (100.0%) | 0 (0.0%) |
| Mining, Quarrying, & Extraction | 7 (100.0%) | 0 (0.0%) |
| Construction | 776 (92.4%) | 64 (7.6%) |
| Manufacturing | 244 (89.0%) | 30 (11.0%) |
| Wholesale Trade | 15 (100.0%) | 0 (0.0%) |
| Retail Trade | 305 (52.2%) | 279 (47.8%) |
| Transportation & Warehousing | 89 (75.4%) | 29 (24.6%) |
| Utilities | 76 (100.0%) | 0 (0.0%) |
| Information | 53 (74.7%) | 18 (25.4%) |
| Finance & Insurance | 18 (5.0%) | 345 (95.0%) |
| Real Estate, Rental & Leasing | 76 (62.3%) | 46 (37.7%) |
| Professional & Scientific | 144 (50.7%) | 140 (49.3%) |
| Enterprise Management | 0 (0.0%) | 0 (0.0%) |
| Administrative & Support | 204 (70.1%) | 87 (29.9%) |
| Educational Services | 81 (19.8%) | 329 (80.2%) |
| Health Care & Social Assistance | 114 (23.1%) | 379 (76.9%) |
| Arts, Entertainment & Recreation | 59 (100.0%) | 0 (0.0%) |
| Accommodation & Food Services | 103 (30.7%) | 232 (69.3%) |
| Public Administration | 205 (50.7%) | 199 (49.3%) |
| Total | 2,831 (54.7%) | 2,345 (45.3%) |
Education in Diamond Springs
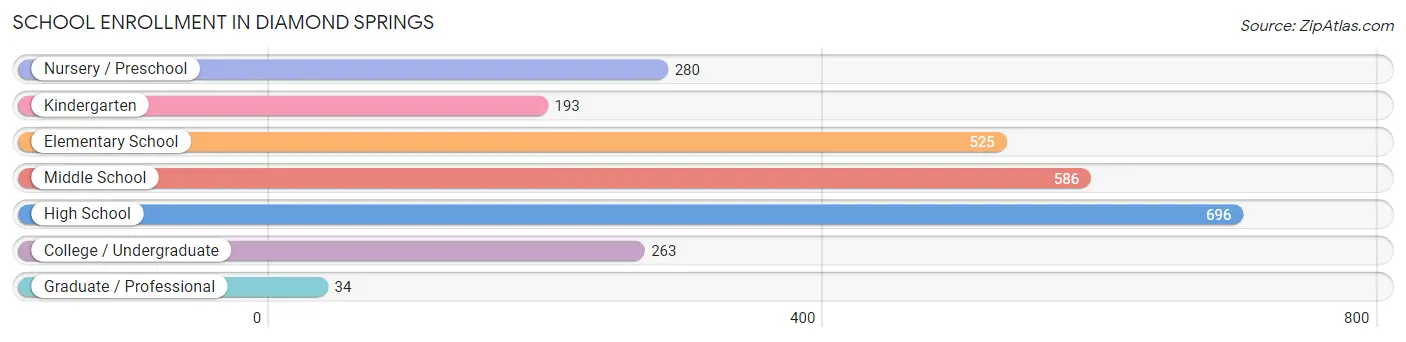
School Enrollment in Diamond Springs
The most common levels of schooling among the 2,577 students in Diamond Springs are high school (696 | 27.0%), middle school (586 | 22.7%), and elementary school (525 | 20.4%).
| School Level | # Students | % Students |
| Nursery / Preschool | 280 | 10.9% |
| Kindergarten | 193 | 7.5% |
| Elementary School | 525 | 20.4% |
| Middle School | 586 | 22.7% |
| High School | 696 | 27.0% |
| College / Undergraduate | 263 | 10.2% |
| Graduate / Professional | 34 | 1.3% |
| Total | 2,577 | 100.0% |
School Enrollment by Age by Funding Source in Diamond Springs
Out of a total of 2,577 students who are enrolled in schools in Diamond Springs, 374 (14.5%) attend a private institution, while the remaining 2,203 (85.5%) are enrolled in public schools. The age group of 3 to 4 year olds has the highest likelihood of being enrolled in private schools, with 230 (84.6% in the age bracket) enrolled. Conversely, the age group of 18 to 19 year olds has the lowest likelihood of being enrolled in a private school, with 85 (100.0% in the age bracket) attending a public institution.
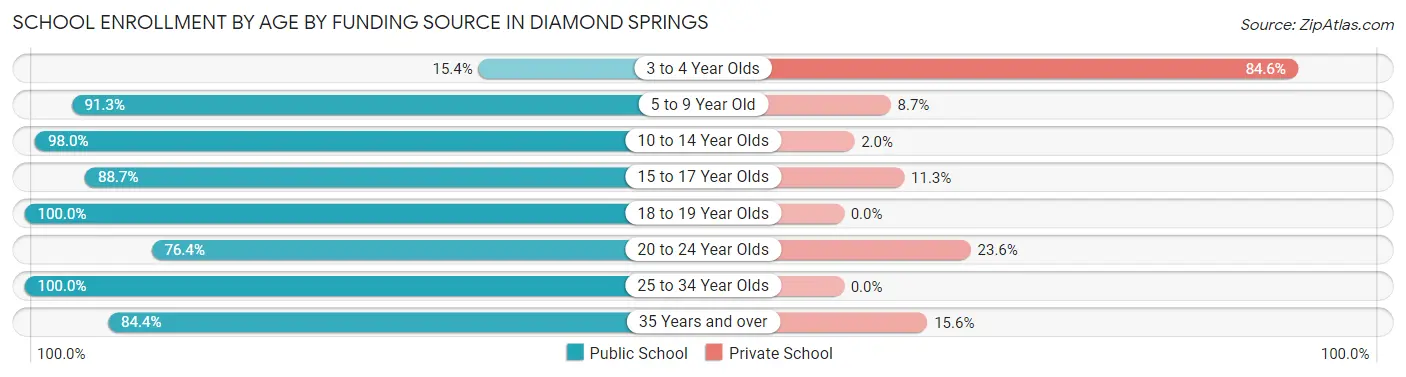
| Age Bracket | Public School | Private School |
| 3 to 4 Year Olds | 42 (15.4%) | 230 (84.6%) |
| 5 to 9 Year Old | 501 (91.3%) | 48 (8.7%) |
| 10 to 14 Year Olds | 944 (98.0%) | 19 (2.0%) |
| 15 to 17 Year Olds | 339 (88.7%) | 43 (11.3%) |
| 18 to 19 Year Olds | 85 (100.0%) | 0 (0.0%) |
| 20 to 24 Year Olds | 42 (76.4%) | 13 (23.6%) |
| 25 to 34 Year Olds | 136 (100.0%) | 0 (0.0%) |
| 35 Years and over | 114 (84.4%) | 21 (15.6%) |
| Total | 2,203 (85.5%) | 374 (14.5%) |
Educational Attainment by Field of Study in Diamond Springs
Business (354 | 14.8%), social sciences (306 | 12.8%), education (295 | 12.3%), arts & humanities (259 | 10.8%), and bio, nature & agricultural (192 | 8.0%) are the most common fields of study among 2,399 individuals in Diamond Springs who have obtained a bachelor's degree or higher.
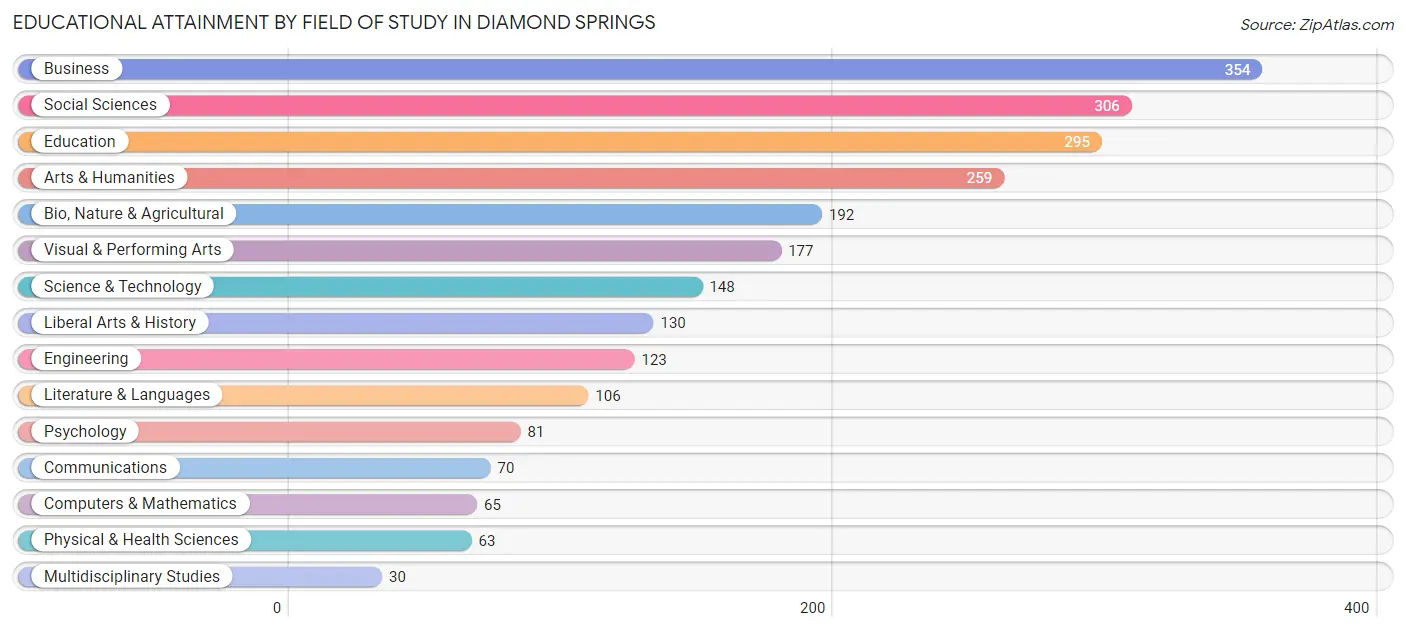
| Field of Study | # Graduates | % Graduates |
| Computers & Mathematics | 65 | 2.7% |
| Bio, Nature & Agricultural | 192 | 8.0% |
| Physical & Health Sciences | 63 | 2.6% |
| Psychology | 81 | 3.4% |
| Social Sciences | 306 | 12.8% |
| Engineering | 123 | 5.1% |
| Multidisciplinary Studies | 30 | 1.3% |
| Science & Technology | 148 | 6.2% |
| Business | 354 | 14.8% |
| Education | 295 | 12.3% |
| Literature & Languages | 106 | 4.4% |
| Liberal Arts & History | 130 | 5.4% |
| Visual & Performing Arts | 177 | 7.4% |
| Communications | 70 | 2.9% |
| Arts & Humanities | 259 | 10.8% |
| Total | 2,399 | 100.0% |
Transportation & Commute in Diamond Springs
Vehicle Availability by Sex in Diamond Springs
The most prevalent vehicle ownership categories in Diamond Springs are males with 2 vehicles (940, accounting for 33.4%) and females with 2 vehicles (622, making up 40.6%).
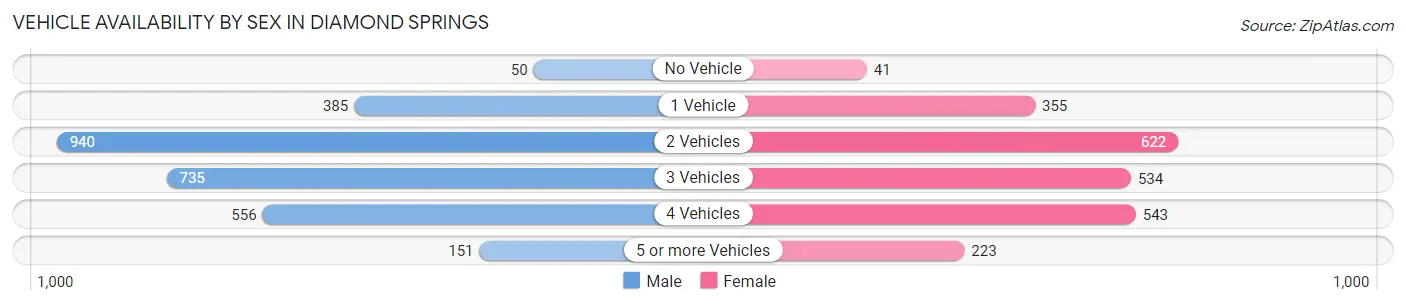
| Vehicles Available | Male | Female |
| No Vehicle | 50 (1.8%) | 41 (1.8%) |
| 1 Vehicle | 385 (13.7%) | 355 (15.3%) |
| 2 Vehicles | 940 (33.4%) | 622 (26.8%) |
| 3 Vehicles | 735 (26.1%) | 534 (23.0%) |
| 4 Vehicles | 556 (19.7%) | 543 (23.4%) |
| 5 or more Vehicles | 151 (5.4%) | 223 (9.6%) |
| Total | 2,817 (100.0%) | 2,318 (100.0%) |
Commute Time in Diamond Springs
The most frequently occuring commute durations in Diamond Springs are 5 to 9 minutes (926 commuters, 21.5%), 10 to 14 minutes (698 commuters, 16.2%), and 15 to 19 minutes (584 commuters, 13.6%).
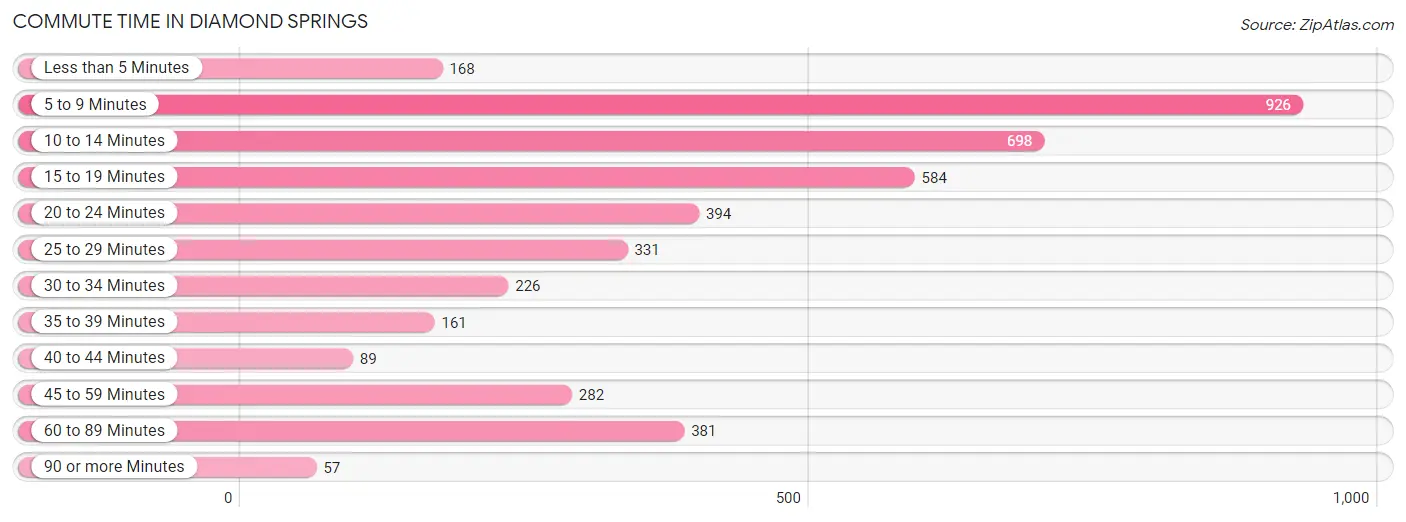
| Commute Time | # Commuters | % Commuters |
| Less than 5 Minutes | 168 | 3.9% |
| 5 to 9 Minutes | 926 | 21.5% |
| 10 to 14 Minutes | 698 | 16.2% |
| 15 to 19 Minutes | 584 | 13.6% |
| 20 to 24 Minutes | 394 | 9.2% |
| 25 to 29 Minutes | 331 | 7.7% |
| 30 to 34 Minutes | 226 | 5.3% |
| 35 to 39 Minutes | 161 | 3.7% |
| 40 to 44 Minutes | 89 | 2.1% |
| 45 to 59 Minutes | 282 | 6.6% |
| 60 to 89 Minutes | 381 | 8.9% |
| 90 or more Minutes | 57 | 1.3% |
Commute Time by Sex in Diamond Springs
The most common commute times in Diamond Springs are 5 to 9 minutes (505 commuters, 21.3%) for males and 5 to 9 minutes (421 commuters, 21.9%) for females.
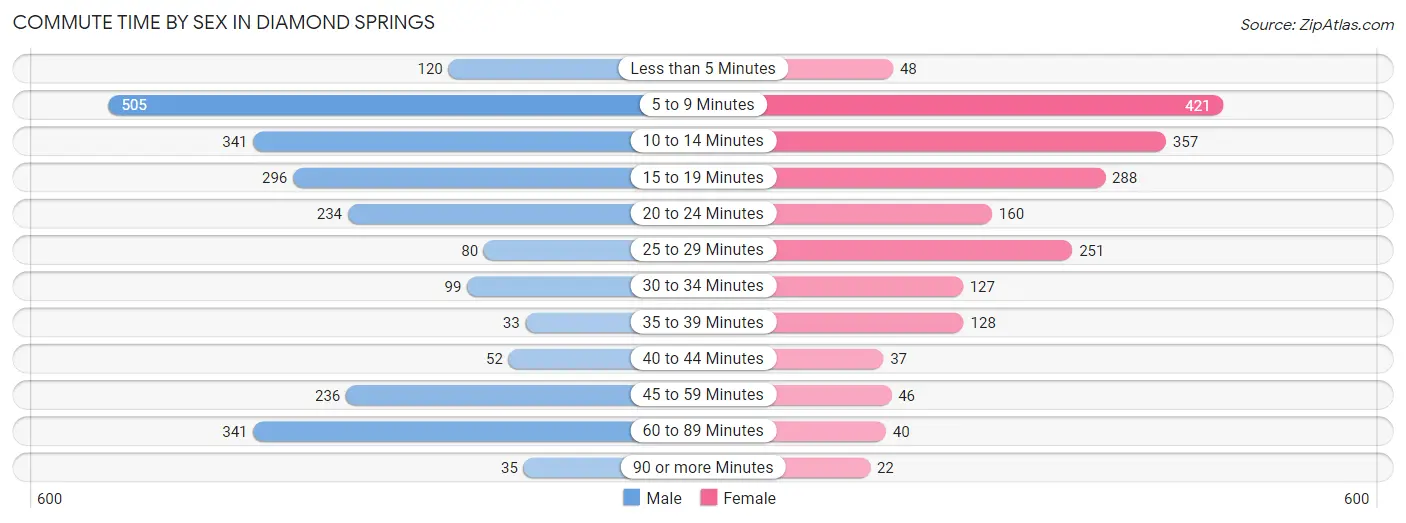
| Commute Time | Male | Female |
| Less than 5 Minutes | 120 (5.1%) | 48 (2.5%) |
| 5 to 9 Minutes | 505 (21.3%) | 421 (21.9%) |
| 10 to 14 Minutes | 341 (14.4%) | 357 (18.5%) |
| 15 to 19 Minutes | 296 (12.5%) | 288 (15.0%) |
| 20 to 24 Minutes | 234 (9.9%) | 160 (8.3%) |
| 25 to 29 Minutes | 80 (3.4%) | 251 (13.0%) |
| 30 to 34 Minutes | 99 (4.2%) | 127 (6.6%) |
| 35 to 39 Minutes | 33 (1.4%) | 128 (6.7%) |
| 40 to 44 Minutes | 52 (2.2%) | 37 (1.9%) |
| 45 to 59 Minutes | 236 (10.0%) | 46 (2.4%) |
| 60 to 89 Minutes | 341 (14.4%) | 40 (2.1%) |
| 90 or more Minutes | 35 (1.5%) | 22 (1.1%) |
Time of Departure to Work by Sex in Diamond Springs
The most frequent times of departure to work in Diamond Springs are 5:30 AM to 5:59 AM (310, 13.1%) for males and 8:00 AM to 8:29 AM (358, 18.6%) for females.
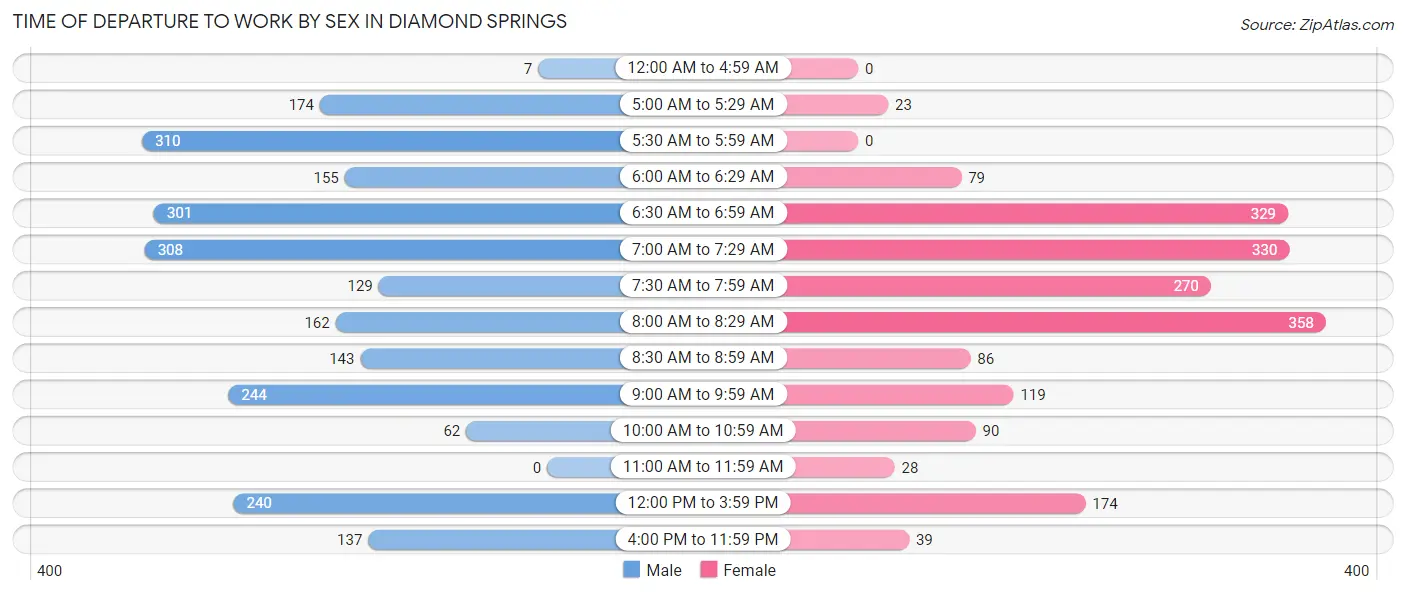
| Time of Departure | Male | Female |
| 12:00 AM to 4:59 AM | 7 (0.3%) | 0 (0.0%) |
| 5:00 AM to 5:29 AM | 174 (7.3%) | 23 (1.2%) |
| 5:30 AM to 5:59 AM | 310 (13.1%) | 0 (0.0%) |
| 6:00 AM to 6:29 AM | 155 (6.5%) | 79 (4.1%) |
| 6:30 AM to 6:59 AM | 301 (12.7%) | 329 (17.1%) |
| 7:00 AM to 7:29 AM | 308 (13.0%) | 330 (17.1%) |
| 7:30 AM to 7:59 AM | 129 (5.4%) | 270 (14.0%) |
| 8:00 AM to 8:29 AM | 162 (6.8%) | 358 (18.6%) |
| 8:30 AM to 8:59 AM | 143 (6.0%) | 86 (4.5%) |
| 9:00 AM to 9:59 AM | 244 (10.3%) | 119 (6.2%) |
| 10:00 AM to 10:59 AM | 62 (2.6%) | 90 (4.7%) |
| 11:00 AM to 11:59 AM | 0 (0.0%) | 28 (1.5%) |
| 12:00 PM to 3:59 PM | 240 (10.1%) | 174 (9.0%) |
| 4:00 PM to 11:59 PM | 137 (5.8%) | 39 (2.0%) |
| Total | 2,372 (100.0%) | 1,925 (100.0%) |
Housing Occupancy in Diamond Springs
Occupancy by Ownership in Diamond Springs
Of the total 5,100 dwellings in Diamond Springs, owner-occupied units account for 3,416 (67.0%), while renter-occupied units make up 1,684 (33.0%).
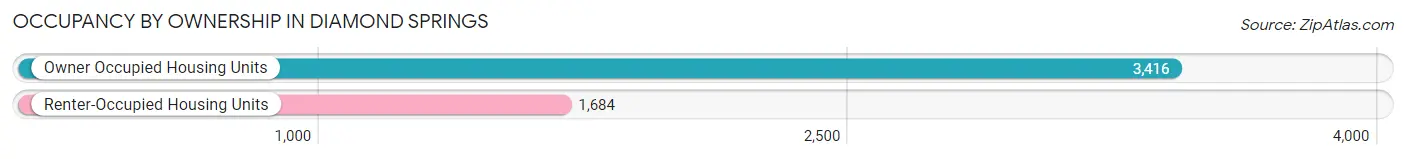
| Occupancy | # Housing Units | % Housing Units |
| Owner Occupied Housing Units | 3,416 | 67.0% |
| Renter-Occupied Housing Units | 1,684 | 33.0% |
| Total Occupied Housing Units | 5,100 | 100.0% |
Occupancy by Household Size in Diamond Springs
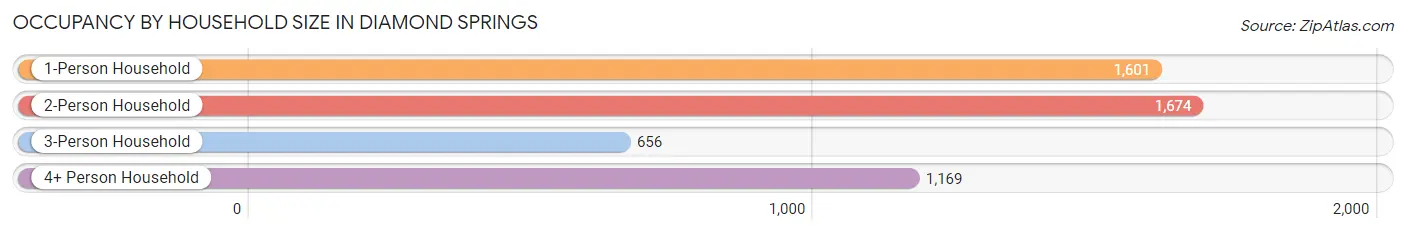
| Household Size | # Housing Units | % Housing Units |
| 1-Person Household | 1,601 | 31.4% |
| 2-Person Household | 1,674 | 32.8% |
| 3-Person Household | 656 | 12.9% |
| 4+ Person Household | 1,169 | 22.9% |
| Total Housing Units | 5,100 | 100.0% |
Occupancy by Ownership by Household Size in Diamond Springs
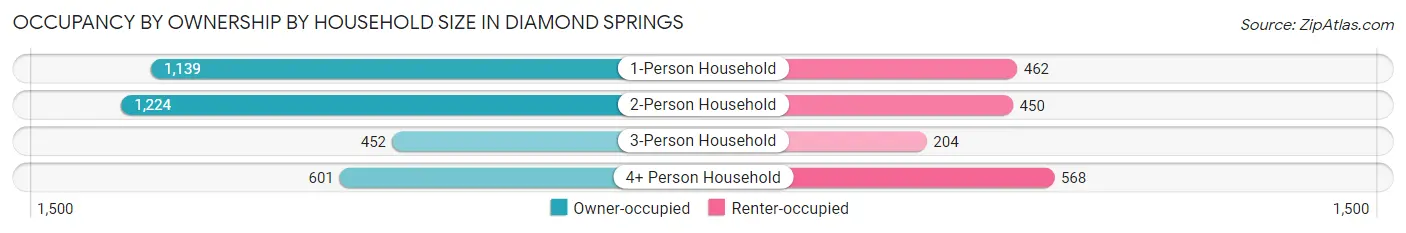
| Household Size | Owner-occupied | Renter-occupied |
| 1-Person Household | 1,139 (71.1%) | 462 (28.9%) |
| 2-Person Household | 1,224 (73.1%) | 450 (26.9%) |
| 3-Person Household | 452 (68.9%) | 204 (31.1%) |
| 4+ Person Household | 601 (51.4%) | 568 (48.6%) |
| Total Housing Units | 3,416 (67.0%) | 1,684 (33.0%) |
Occupancy by Educational Attainment in Diamond Springs
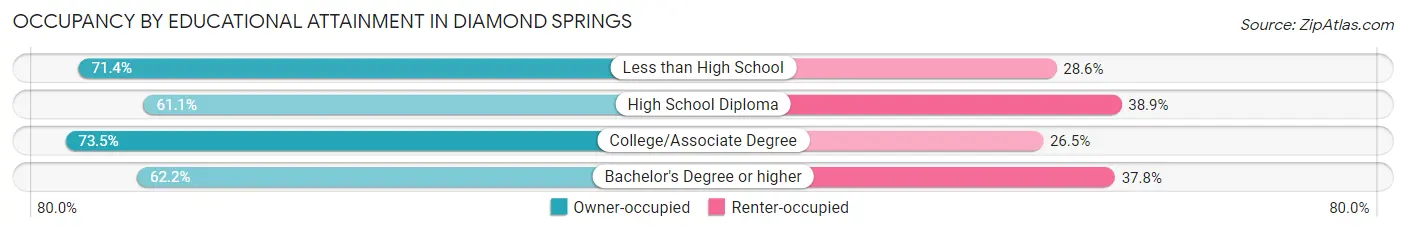
| Household Size | Owner-occupied | Renter-occupied |
| Less than High School | 95 (71.4%) | 38 (28.6%) |
| High School Diploma | 866 (61.1%) | 551 (38.9%) |
| College/Associate Degree | 1,604 (73.5%) | 577 (26.5%) |
| Bachelor's Degree or higher | 851 (62.2%) | 518 (37.8%) |
Occupancy by Age of Householder in Diamond Springs
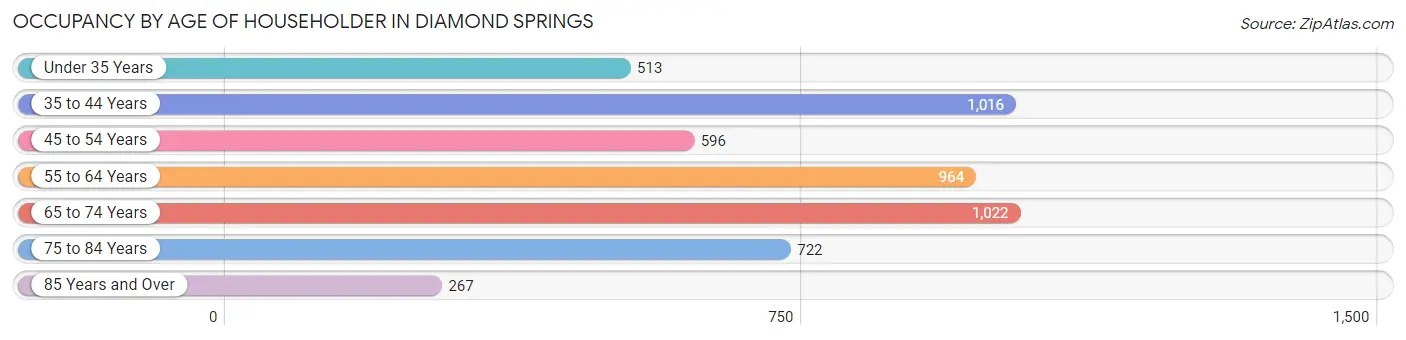
| Age Bracket | # Households | % Households |
| Under 35 Years | 513 | 10.1% |
| 35 to 44 Years | 1,016 | 19.9% |
| 45 to 54 Years | 596 | 11.7% |
| 55 to 64 Years | 964 | 18.9% |
| 65 to 74 Years | 1,022 | 20.0% |
| 75 to 84 Years | 722 | 14.2% |
| 85 Years and Over | 267 | 5.2% |
| Total | 5,100 | 100.0% |
Housing Finances in Diamond Springs
Median Income by Occupancy in Diamond Springs
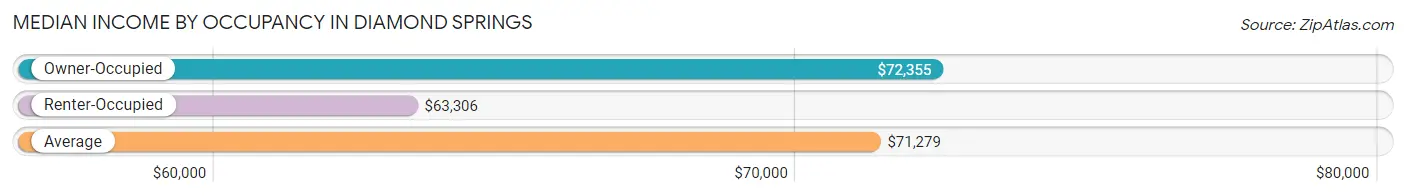
| Occupancy Type | # Households | Median Income |
| Owner-Occupied | 3,416 (67.0%) | $72,355 |
| Renter-Occupied | 1,684 (33.0%) | $63,306 |
| Average | 5,100 (100.0%) | $71,279 |
Occupancy by Householder Income Bracket in Diamond Springs
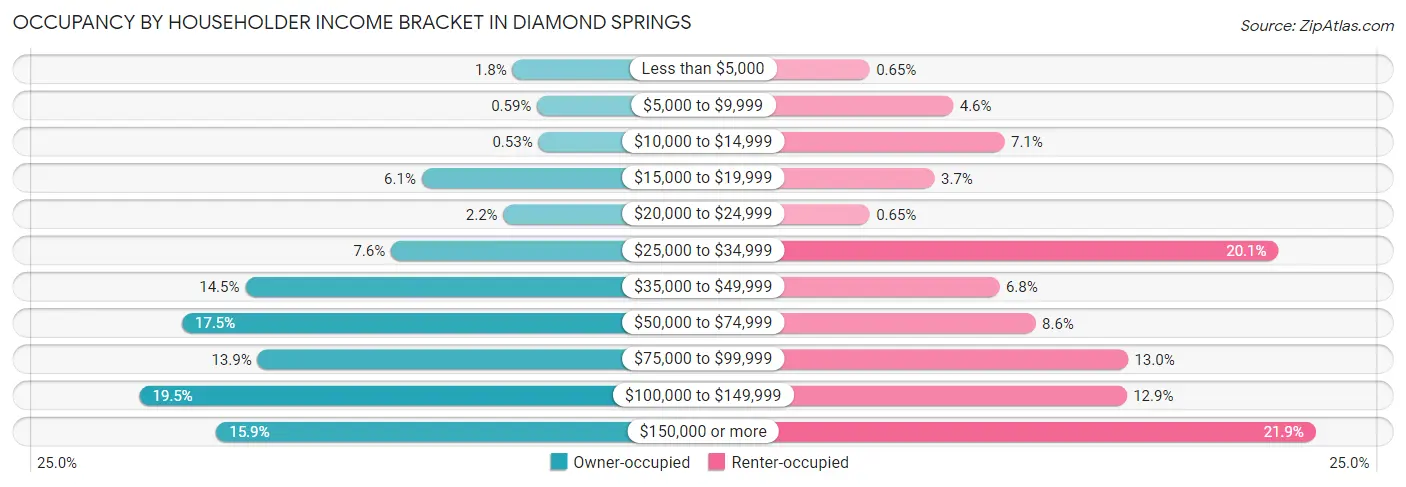
| Income Bracket | Owner-occupied | Renter-occupied |
| Less than $5,000 | 60 (1.8%) | 11 (0.6%) |
| $5,000 to $9,999 | 20 (0.6%) | 78 (4.6%) |
| $10,000 to $14,999 | 18 (0.5%) | 119 (7.1%) |
| $15,000 to $19,999 | 208 (6.1%) | 63 (3.7%) |
| $20,000 to $24,999 | 75 (2.2%) | 11 (0.6%) |
| $25,000 to $34,999 | 258 (7.5%) | 339 (20.1%) |
| $35,000 to $49,999 | 495 (14.5%) | 115 (6.8%) |
| $50,000 to $74,999 | 598 (17.5%) | 144 (8.6%) |
| $75,000 to $99,999 | 475 (13.9%) | 218 (13.0%) |
| $100,000 to $149,999 | 667 (19.5%) | 217 (12.9%) |
| $150,000 or more | 542 (15.9%) | 369 (21.9%) |
| Total | 3,416 (100.0%) | 1,684 (100.0%) |
Monthly Housing Cost Tiers in Diamond Springs
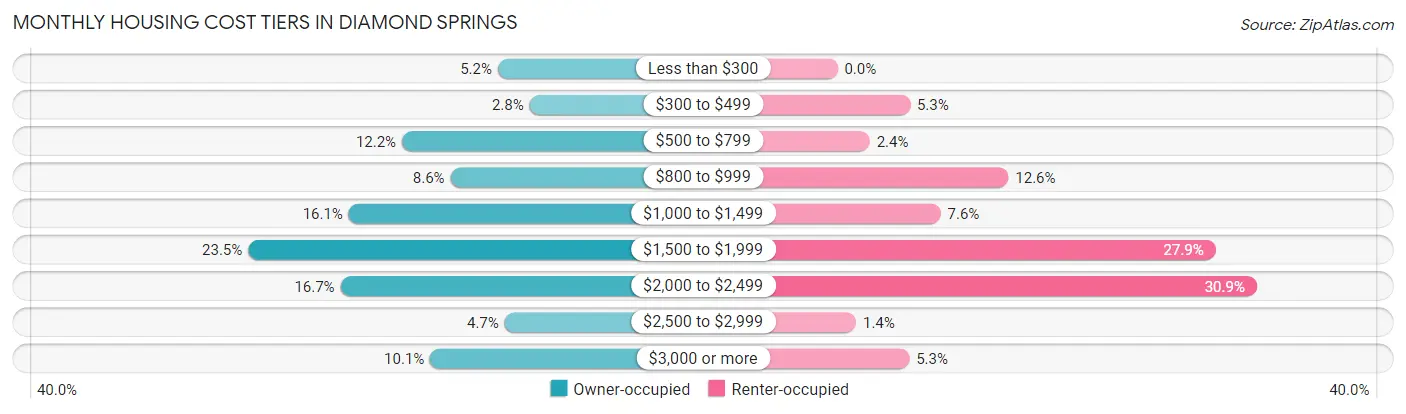
| Monthly Cost | Owner-occupied | Renter-occupied |
| Less than $300 | 176 (5.1%) | 0 (0.0%) |
| $300 to $499 | 96 (2.8%) | 90 (5.3%) |
| $500 to $799 | 417 (12.2%) | 40 (2.4%) |
| $800 to $999 | 295 (8.6%) | 212 (12.6%) |
| $1,000 to $1,499 | 551 (16.1%) | 128 (7.6%) |
| $1,500 to $1,999 | 804 (23.5%) | 469 (27.9%) |
| $2,000 to $2,499 | 572 (16.7%) | 520 (30.9%) |
| $2,500 to $2,999 | 159 (4.6%) | 23 (1.4%) |
| $3,000 or more | 346 (10.1%) | 89 (5.3%) |
| Total | 3,416 (100.0%) | 1,684 (100.0%) |
Physical Housing Characteristics in Diamond Springs
Housing Structures in Diamond Springs
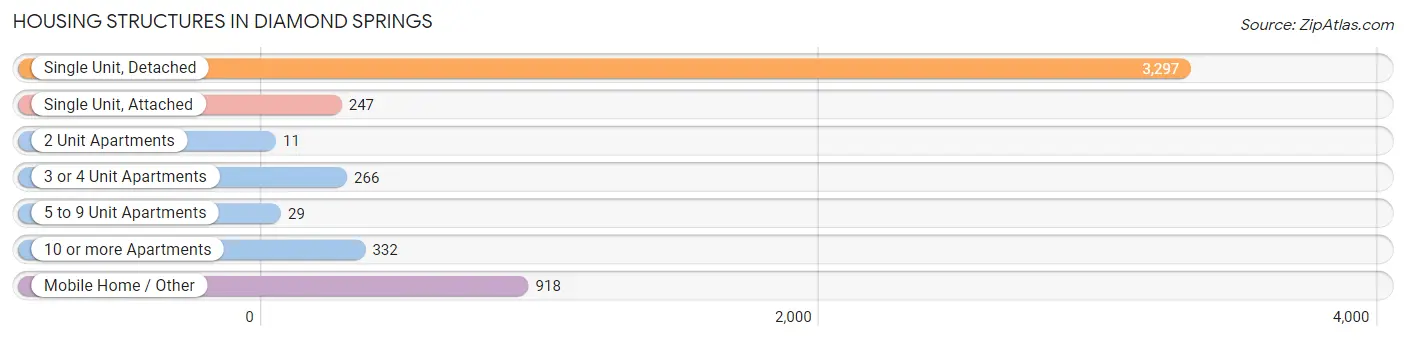
| Structure Type | # Housing Units | % Housing Units |
| Single Unit, Detached | 3,297 | 64.6% |
| Single Unit, Attached | 247 | 4.8% |
| 2 Unit Apartments | 11 | 0.2% |
| 3 or 4 Unit Apartments | 266 | 5.2% |
| 5 to 9 Unit Apartments | 29 | 0.6% |
| 10 or more Apartments | 332 | 6.5% |
| Mobile Home / Other | 918 | 18.0% |
| Total | 5,100 | 100.0% |
Housing Structures by Occupancy in Diamond Springs
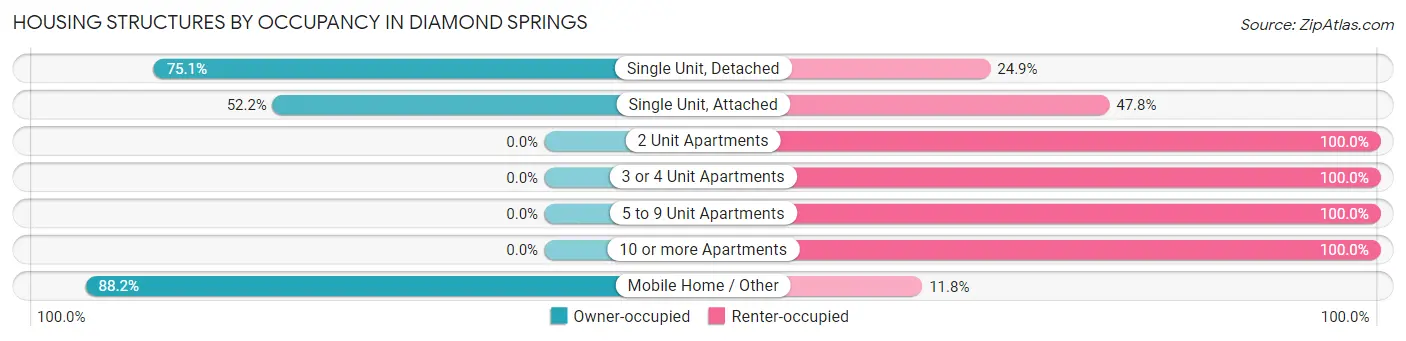
| Structure Type | Owner-occupied | Renter-occupied |
| Single Unit, Detached | 2,477 (75.1%) | 820 (24.9%) |
| Single Unit, Attached | 129 (52.2%) | 118 (47.8%) |
| 2 Unit Apartments | 0 (0.0%) | 11 (100.0%) |
| 3 or 4 Unit Apartments | 0 (0.0%) | 266 (100.0%) |
| 5 to 9 Unit Apartments | 0 (0.0%) | 29 (100.0%) |
| 10 or more Apartments | 0 (0.0%) | 332 (100.0%) |
| Mobile Home / Other | 810 (88.2%) | 108 (11.8%) |
| Total | 3,416 (67.0%) | 1,684 (33.0%) |
Housing Structures by Number of Rooms in Diamond Springs
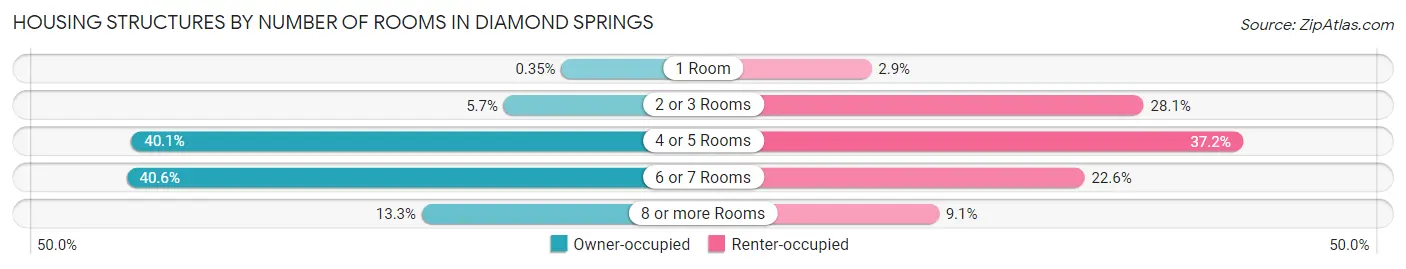
| Number of Rooms | Owner-occupied | Renter-occupied |
| 1 Room | 12 (0.4%) | 49 (2.9%) |
| 2 or 3 Rooms | 194 (5.7%) | 473 (28.1%) |
| 4 or 5 Rooms | 1,371 (40.1%) | 627 (37.2%) |
| 6 or 7 Rooms | 1,386 (40.6%) | 381 (22.6%) |
| 8 or more Rooms | 453 (13.3%) | 154 (9.1%) |
| Total | 3,416 (100.0%) | 1,684 (100.0%) |
Housing Structure by Heating Type in Diamond Springs
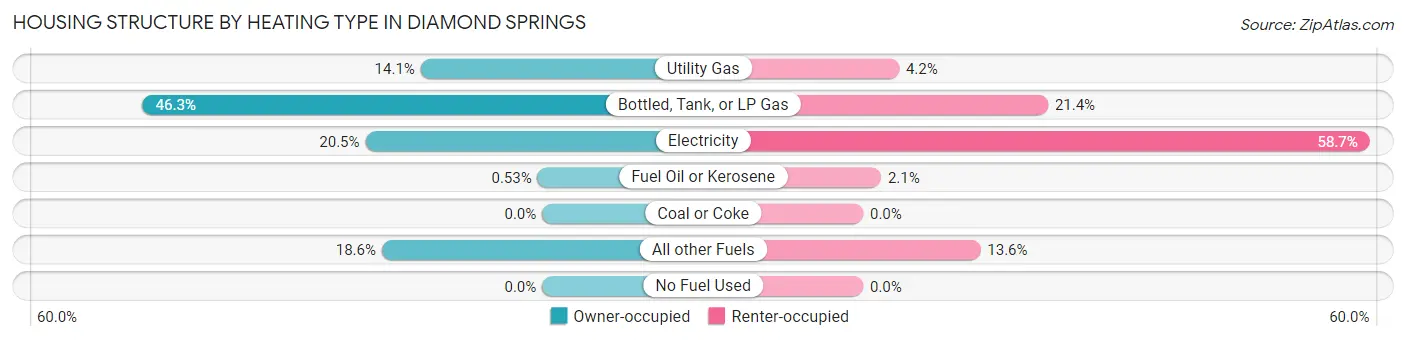
| Heating Type | Owner-occupied | Renter-occupied |
| Utility Gas | 481 (14.1%) | 70 (4.2%) |
| Bottled, Tank, or LP Gas | 1,582 (46.3%) | 361 (21.4%) |
| Electricity | 700 (20.5%) | 989 (58.7%) |
| Fuel Oil or Kerosene | 18 (0.5%) | 35 (2.1%) |
| Coal or Coke | 0 (0.0%) | 0 (0.0%) |
| All other Fuels | 635 (18.6%) | 229 (13.6%) |
| No Fuel Used | 0 (0.0%) | 0 (0.0%) |
| Total | 3,416 (100.0%) | 1,684 (100.0%) |
Household Vehicle Usage in Diamond Springs
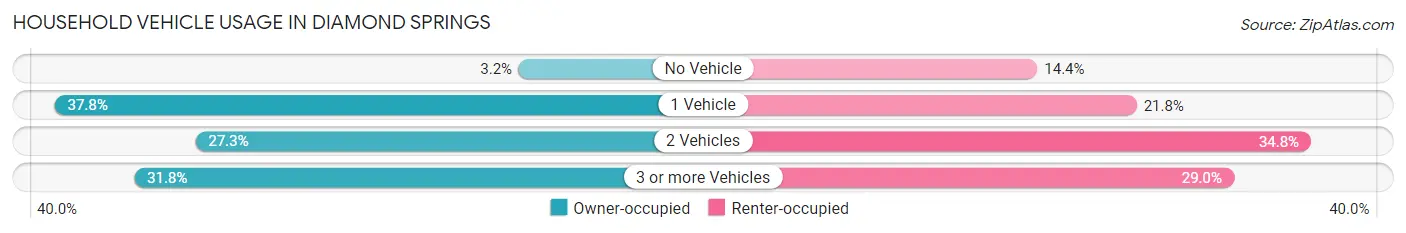
| Vehicles per Household | Owner-occupied | Renter-occupied |
| No Vehicle | 108 (3.2%) | 242 (14.4%) |
| 1 Vehicle | 1,290 (37.8%) | 367 (21.8%) |
| 2 Vehicles | 931 (27.3%) | 586 (34.8%) |
| 3 or more Vehicles | 1,087 (31.8%) | 489 (29.0%) |
| Total | 3,416 (100.0%) | 1,684 (100.0%) |
Real Estate & Mortgages in Diamond Springs
Real Estate and Mortgage Overview in Diamond Springs
| Characteristic | Without Mortgage | With Mortgage |
| Housing Units | 1,264 | 2,152 |
| Median Property Value | $303,700 | $427,700 |
| Median Household Income | $47,333 | $506 |
| Monthly Housing Costs | $836 | $346 |
| Real Estate Taxes | $1,287 | $19 |
Property Value by Mortgage Status in Diamond Springs
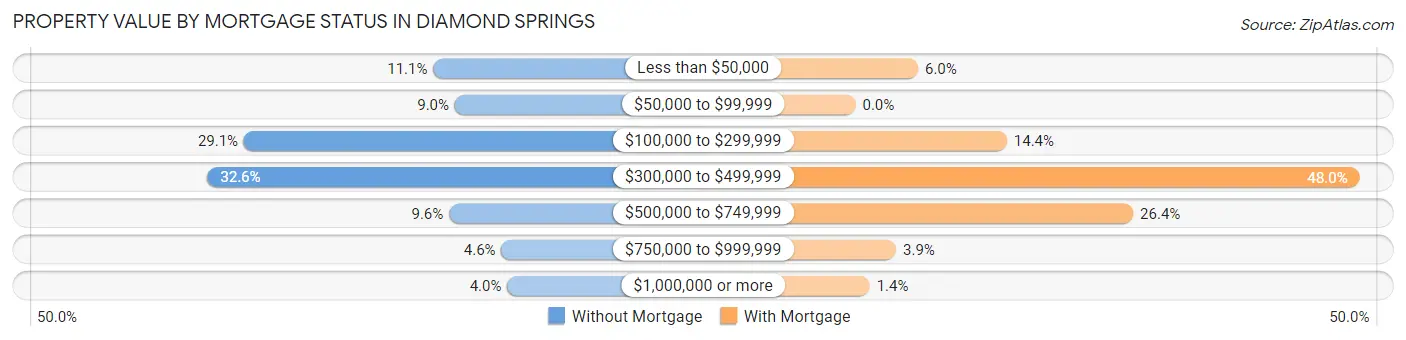
| Property Value | Without Mortgage | With Mortgage |
| Less than $50,000 | 140 (11.1%) | 128 (5.9%) |
| $50,000 to $99,999 | 114 (9.0%) | 0 (0.0%) |
| $100,000 to $299,999 | 368 (29.1%) | 310 (14.4%) |
| $300,000 to $499,999 | 412 (32.6%) | 1,033 (48.0%) |
| $500,000 to $749,999 | 121 (9.6%) | 569 (26.4%) |
| $750,000 to $999,999 | 58 (4.6%) | 83 (3.9%) |
| $1,000,000 or more | 51 (4.0%) | 29 (1.3%) |
| Total | 1,264 (100.0%) | 2,152 (100.0%) |
Household Income by Mortgage Status in Diamond Springs
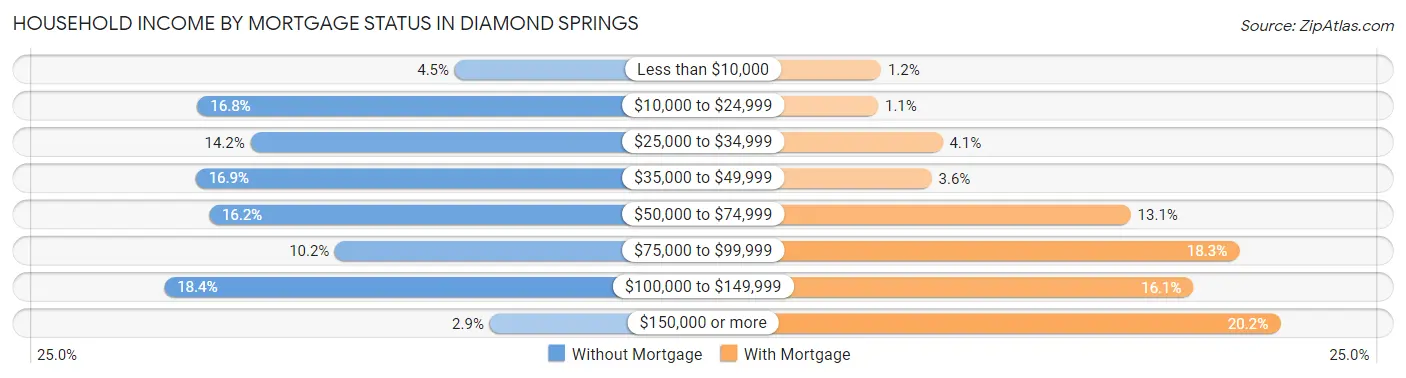
| Household Income | Without Mortgage | With Mortgage |
| Less than $10,000 | 57 (4.5%) | 26 (1.2%) |
| $10,000 to $24,999 | 212 (16.8%) | 23 (1.1%) |
| $25,000 to $34,999 | 180 (14.2%) | 89 (4.1%) |
| $35,000 to $49,999 | 213 (16.9%) | 78 (3.6%) |
| $50,000 to $74,999 | 205 (16.2%) | 282 (13.1%) |
| $75,000 to $99,999 | 129 (10.2%) | 393 (18.3%) |
| $100,000 to $149,999 | 232 (18.3%) | 346 (16.1%) |
| $150,000 or more | 36 (2.9%) | 435 (20.2%) |
| Total | 1,264 (100.0%) | 2,152 (100.0%) |
Property Value to Household Income Ratio in Diamond Springs
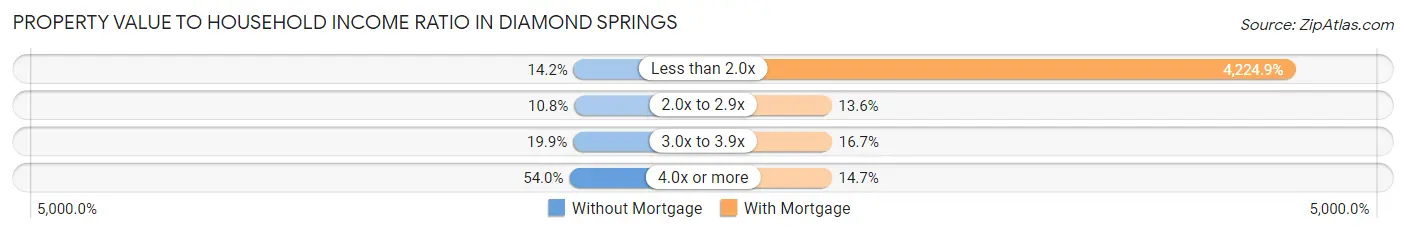
| Value-to-Income Ratio | Without Mortgage | With Mortgage |
| Less than 2.0x | 180 (14.2%) | 90,920 (4,224.9%) |
| 2.0x to 2.9x | 136 (10.8%) | 293 (13.6%) |
| 3.0x to 3.9x | 252 (19.9%) | 360 (16.7%) |
| 4.0x or more | 683 (54.0%) | 316 (14.7%) |
| Total | 1,264 (100.0%) | 2,152 (100.0%) |
Real Estate Taxes by Mortgage Status in Diamond Springs
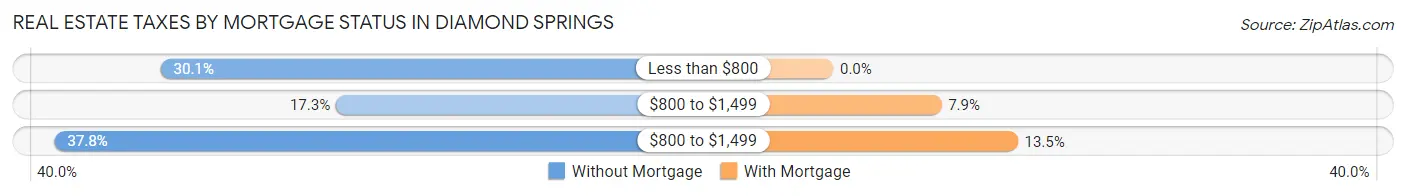
| Property Taxes | Without Mortgage | With Mortgage |
| Less than $800 | 380 (30.1%) | 0 (0.0%) |
| $800 to $1,499 | 218 (17.2%) | 170 (7.9%) |
| $800 to $1,499 | 478 (37.8%) | 290 (13.5%) |
| Total | 1,264 (100.0%) | 2,152 (100.0%) |
Health & Disability in Diamond Springs
Health Insurance Coverage by Age in Diamond Springs
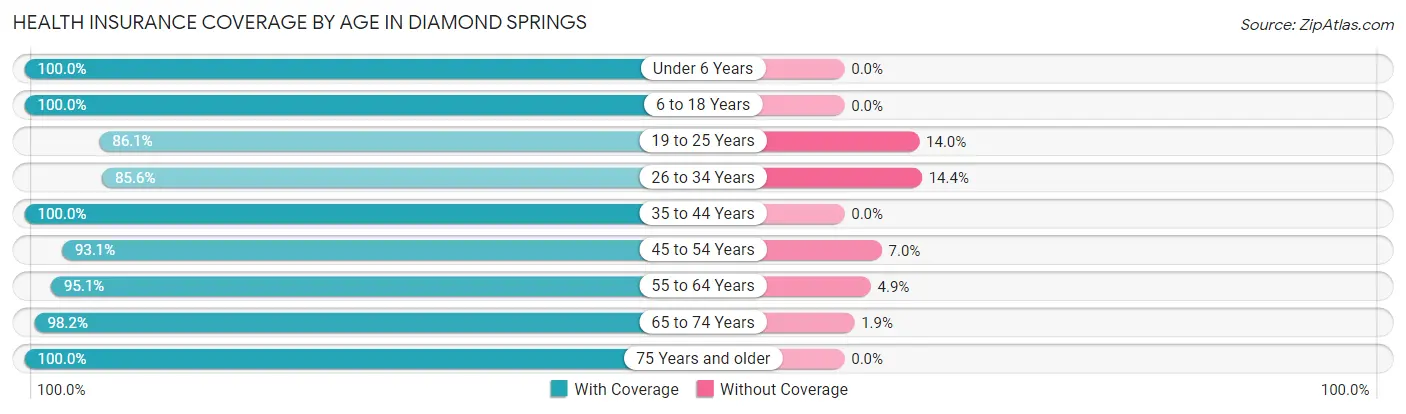
| Age Bracket | With Coverage | Without Coverage |
| Under 6 Years | 766 (100.0%) | 0 (0.0%) |
| 6 to 18 Years | 1,935 (100.0%) | 0 (0.0%) |
| 19 to 25 Years | 543 (86.1%) | 88 (14.0%) |
| 26 to 34 Years | 930 (85.6%) | 157 (14.4%) |
| 35 to 44 Years | 1,845 (100.0%) | 0 (0.0%) |
| 45 to 54 Years | 1,084 (93.0%) | 81 (7.0%) |
| 55 to 64 Years | 1,705 (95.1%) | 88 (4.9%) |
| 65 to 74 Years | 1,537 (98.2%) | 29 (1.8%) |
| 75 Years and older | 1,333 (100.0%) | 0 (0.0%) |
| Total | 11,678 (96.4%) | 443 (3.6%) |
Health Insurance Coverage by Citizenship Status in Diamond Springs
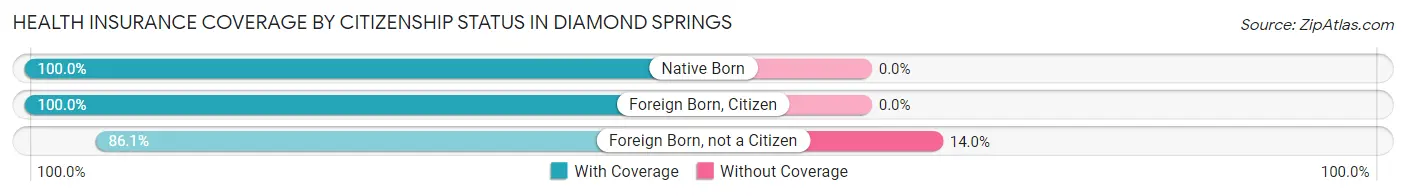
| Citizenship Status | With Coverage | Without Coverage |
| Native Born | 766 (100.0%) | 0 (0.0%) |
| Foreign Born, Citizen | 1,935 (100.0%) | 0 (0.0%) |
| Foreign Born, not a Citizen | 543 (86.1%) | 88 (14.0%) |
Health Insurance Coverage by Household Income in Diamond Springs
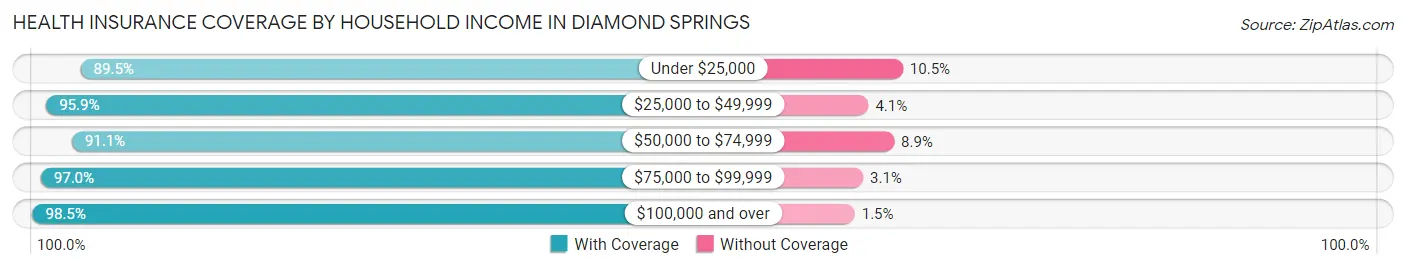
| Household Income | With Coverage | Without Coverage |
| Under $25,000 | 732 (89.5%) | 86 (10.5%) |
| $25,000 to $49,999 | 2,385 (95.9%) | 101 (4.1%) |
| $50,000 to $74,999 | 1,161 (91.1%) | 113 (8.9%) |
| $75,000 to $99,999 | 1,938 (97.0%) | 61 (3.0%) |
| $100,000 and over | 5,383 (98.5%) | 82 (1.5%) |
Public vs Private Health Insurance Coverage by Age in Diamond Springs
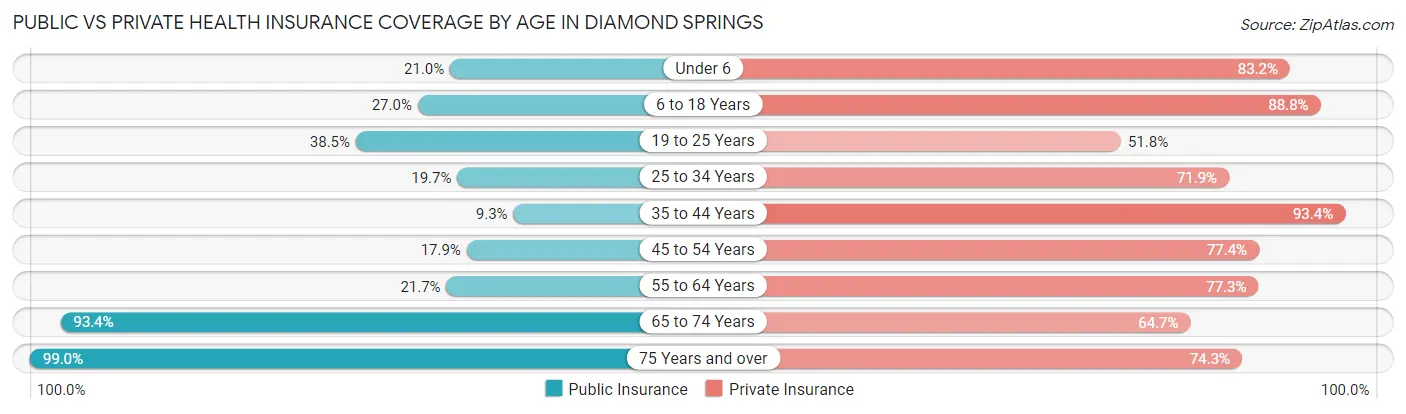
| Age Bracket | Public Insurance | Private Insurance |
| Under 6 | 161 (21.0%) | 637 (83.2%) |
| 6 to 18 Years | 523 (27.0%) | 1,719 (88.8%) |
| 19 to 25 Years | 243 (38.5%) | 327 (51.8%) |
| 25 to 34 Years | 214 (19.7%) | 781 (71.9%) |
| 35 to 44 Years | 171 (9.3%) | 1,723 (93.4%) |
| 45 to 54 Years | 209 (17.9%) | 902 (77.4%) |
| 55 to 64 Years | 389 (21.7%) | 1,386 (77.3%) |
| 65 to 74 Years | 1,462 (93.4%) | 1,013 (64.7%) |
| 75 Years and over | 1,320 (99.0%) | 990 (74.3%) |
| Total | 4,692 (38.7%) | 9,478 (78.2%) |
Disability Status by Sex by Age in Diamond Springs
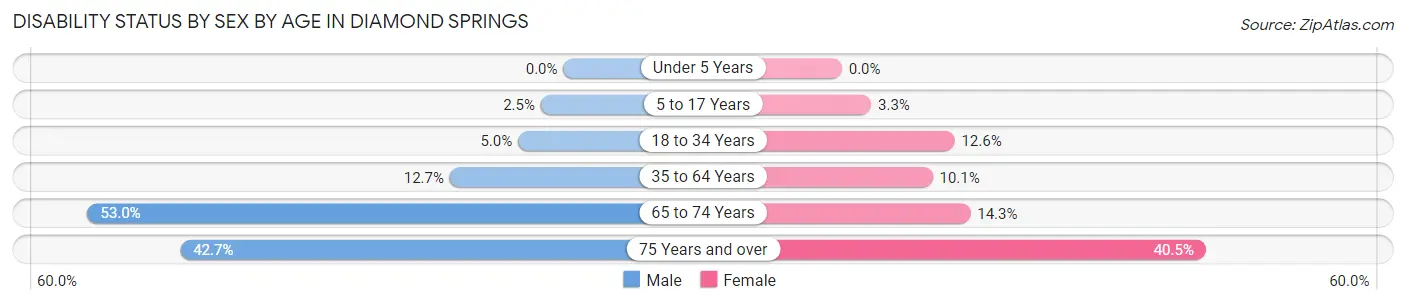
| Age Bracket | Male | Female |
| Under 5 Years | 0 (0.0%) | 0 (0.0%) |
| 5 to 17 Years | 24 (2.5%) | 31 (3.3%) |
| 18 to 34 Years | 52 (5.0%) | 98 (12.6%) |
| 35 to 64 Years | 301 (12.7%) | 245 (10.1%) |
| 65 to 74 Years | 441 (53.0%) | 105 (14.3%) |
| 75 Years and over | 233 (42.7%) | 319 (40.5%) |
Disability Class by Sex by Age in Diamond Springs
Disability Class: Hearing Difficulty
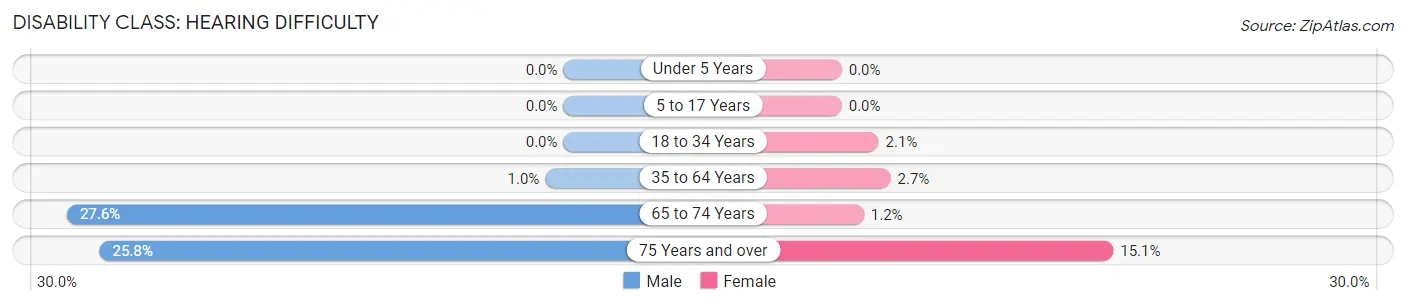
| Age Bracket | Male | Female |
| Under 5 Years | 0 (0.0%) | 0 (0.0%) |
| 5 to 17 Years | 0 (0.0%) | 0 (0.0%) |
| 18 to 34 Years | 0 (0.0%) | 16 (2.1%) |
| 35 to 64 Years | 24 (1.0%) | 66 (2.7%) |
| 65 to 74 Years | 230 (27.6%) | 9 (1.2%) |
| 75 Years and over | 141 (25.8%) | 119 (15.1%) |
Disability Class: Vision Difficulty
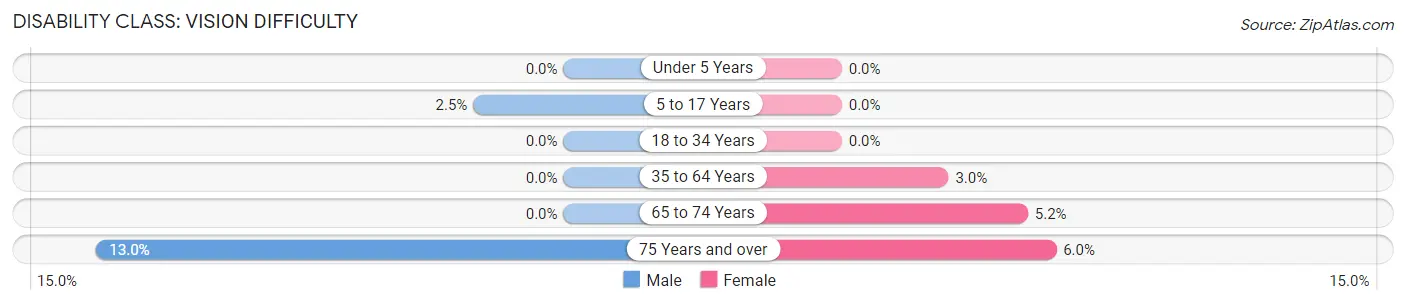
| Age Bracket | Male | Female |
| Under 5 Years | 0 (0.0%) | 0 (0.0%) |
| 5 to 17 Years | 24 (2.5%) | 0 (0.0%) |
| 18 to 34 Years | 0 (0.0%) | 0 (0.0%) |
| 35 to 64 Years | 0 (0.0%) | 72 (3.0%) |
| 65 to 74 Years | 0 (0.0%) | 38 (5.2%) |
| 75 Years and over | 71 (13.0%) | 47 (6.0%) |
Disability Class: Cognitive Difficulty
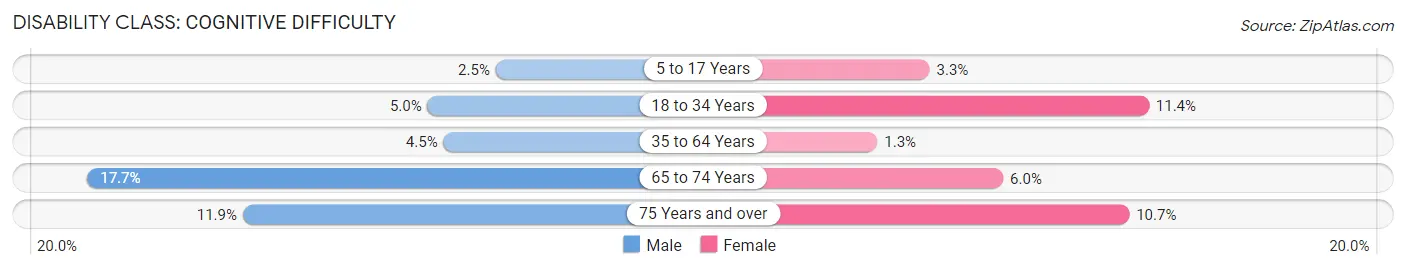
| Age Bracket | Male | Female |
| 5 to 17 Years | 24 (2.5%) | 31 (3.3%) |
| 18 to 34 Years | 52 (5.0%) | 89 (11.4%) |
| 35 to 64 Years | 106 (4.4%) | 32 (1.3%) |
| 65 to 74 Years | 147 (17.7%) | 44 (6.0%) |
| 75 Years and over | 65 (11.9%) | 84 (10.7%) |
Disability Class: Ambulatory Difficulty
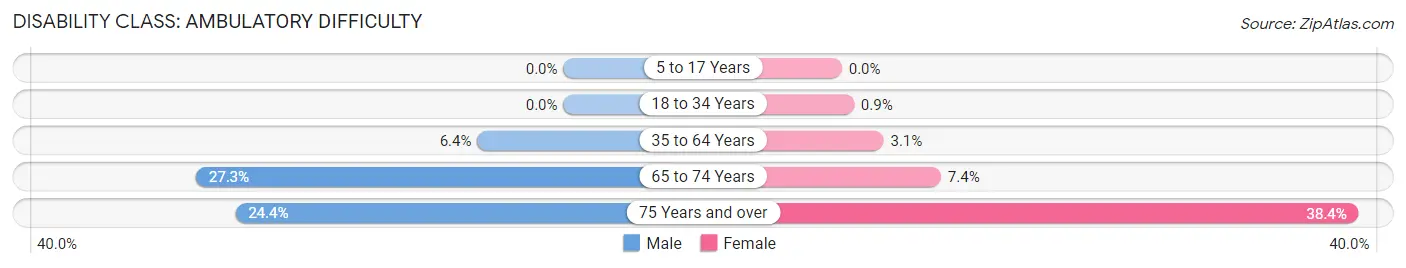
| Age Bracket | Male | Female |
| 5 to 17 Years | 0 (0.0%) | 0 (0.0%) |
| 18 to 34 Years | 0 (0.0%) | 7 (0.9%) |
| 35 to 64 Years | 152 (6.4%) | 75 (3.1%) |
| 65 to 74 Years | 227 (27.3%) | 54 (7.4%) |
| 75 Years and over | 133 (24.4%) | 302 (38.4%) |
Disability Class: Self-Care Difficulty
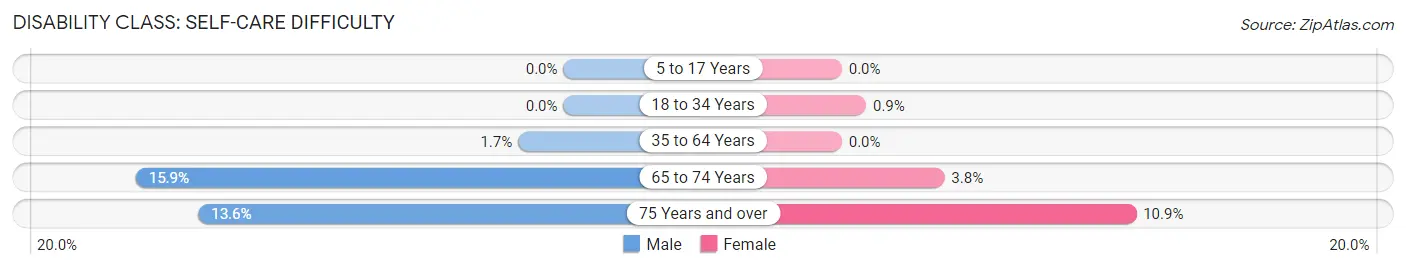
| Age Bracket | Male | Female |
| 5 to 17 Years | 0 (0.0%) | 0 (0.0%) |
| 18 to 34 Years | 0 (0.0%) | 7 (0.9%) |
| 35 to 64 Years | 40 (1.7%) | 0 (0.0%) |
| 65 to 74 Years | 132 (15.9%) | 28 (3.8%) |
| 75 Years and over | 74 (13.6%) | 86 (10.9%) |
Technology Access in Diamond Springs
Computing Device Access in Diamond Springs
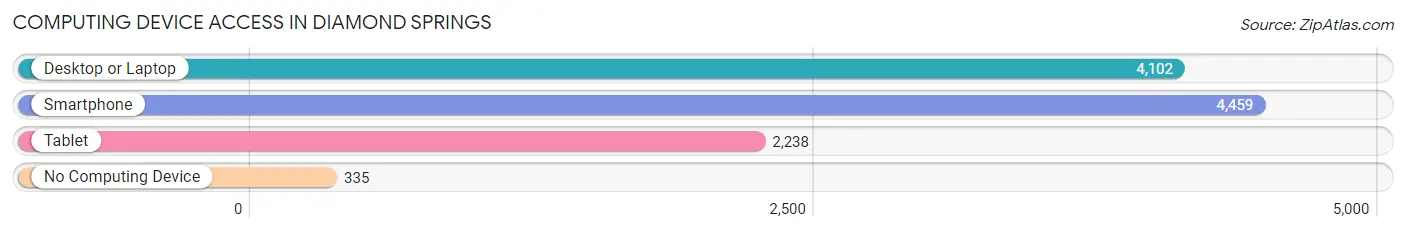
| Device Type | # Households | % Households |
| Desktop or Laptop | 4,102 | 80.4% |
| Smartphone | 4,459 | 87.4% |
| Tablet | 2,238 | 43.9% |
| No Computing Device | 335 | 6.6% |
| Total | 5,100 | 100.0% |
Internet Access in Diamond Springs
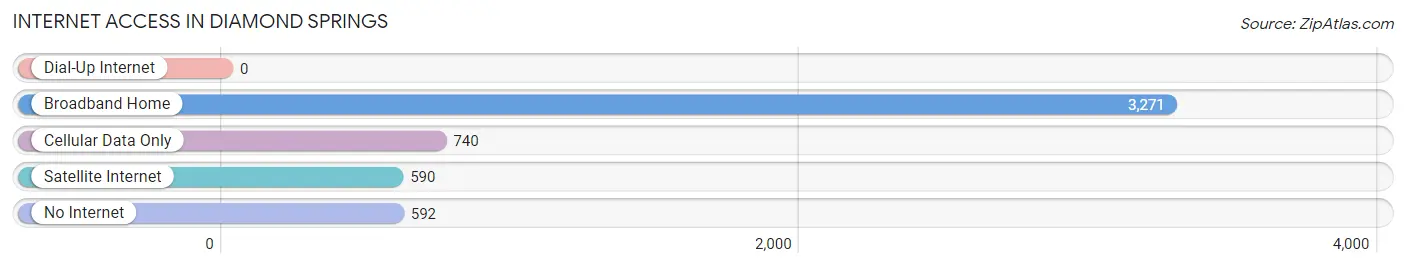
| Internet Type | # Households | % Households |
| Dial-Up Internet | 0 | 0.0% |
| Broadband Home | 3,271 | 64.1% |
| Cellular Data Only | 740 | 14.5% |
| Satellite Internet | 590 | 11.6% |
| No Internet | 592 | 11.6% |
| Total | 5,100 | 100.0% |
Diamond Springs Summary
History
Diamond Springs is a small unincorporated community located in El Dorado County, California. It is situated in the Sierra Nevada foothills, approximately 25 miles east of Sacramento. The area was originally inhabited by the Maidu and Miwok Native American tribes, who lived in the area for thousands of years before the arrival of European settlers.
The first European settlers arrived in the area in the early 1850s, and the town of Diamond Springs was officially established in 1854. The town was named after the nearby Diamond Springs, which was a popular destination for travelers and settlers. The springs were said to have healing properties, and the town quickly became a popular destination for those seeking health and relaxation.
In the late 1800s, Diamond Springs was a bustling town with a variety of businesses, including a hotel, saloon, general store, and post office. The town was also home to a number of churches, including the Methodist Episcopal Church, which was established in 1871.
In the early 1900s, Diamond Springs began to decline as the population shifted to larger cities. The town was bypassed by the railroad, and many of the businesses closed. By the 1950s, the town was largely abandoned.
In the late 1970s, the town began to experience a resurgence as people began to move back to the area. The town was incorporated in 1982, and today it is a popular destination for tourists and outdoor enthusiasts.
Geography
Diamond Springs is located in El Dorado County, California, in the Sierra Nevada foothills. The town is situated at an elevation of 1,845 feet, and is surrounded by rolling hills and oak woodlands. The town is located approximately 25 miles east of Sacramento, and is accessible via Highway 50.
The climate in Diamond Springs is mild and temperate, with hot summers and cool winters. The average high temperature in the summer is around 90 degrees Fahrenheit, and the average low temperature in the winter is around 40 degrees Fahrenheit.
Economy
The economy of Diamond Springs is largely based on tourism and outdoor recreation. The town is home to a number of wineries, and is a popular destination for wine tasting and tours. The town is also home to a number of restaurants, cafes, and shops, as well as a variety of outdoor activities, such as hiking, biking, and horseback riding.
The town is also home to a number of businesses, including a lumber mill, a furniture store, and a number of small businesses. The town is also home to a number of government offices, including the El Dorado County Sheriff’s Office and the El Dorado County Health Department.
Demographics
As of the 2010 census, the population of Diamond Springs was 2,845. The population is largely white (90.2%), with a small percentage of African Americans (2.2%), Asians (2.1%), and Native Americans (0.7%). The median household income in the town is $50,945, and the median age is 44.7 years.
Common Questions
What is Per Capita Income in Diamond Springs?
Per Capita income in Diamond Springs is $39,148.
What is the Median Family Income in Diamond Springs?
Median Family Income in Diamond Springs is $93,279.
What is the Median Household income in Diamond Springs?
Median Household Income in Diamond Springs is $71,279.
What is Income or Wage Gap in Diamond Springs?
Income or Wage Gap in Diamond Springs is 10.2%.
Women in Diamond Springs earn 89.8 cents for every dollar earned by a man.
What is Family Income Deficit in Diamond Springs?
Family Income Deficit in Diamond Springs is $7,907.
Families that are below poverty line in Diamond Springs earn $7,907 less on average than the poverty threshold level.
What is Inequality or Gini Index in Diamond Springs?
Inequality or Gini Index in Diamond Springs is 0.43.
What is the Total Population of Diamond Springs?
Total Population of Diamond Springs is 12,197.
What is the Total Male Population of Diamond Springs?
Total Male Population of Diamond Springs is 6,153.
What is the Total Female Population of Diamond Springs?
Total Female Population of Diamond Springs is 6,044.
What is the Ratio of Males per 100 Females in Diamond Springs?
There are 101.80 Males per 100 Females in Diamond Springs.
What is the Ratio of Females per 100 Males in Diamond Springs?
There are 98.23 Females per 100 Males in Diamond Springs.
What is the Median Population Age in Diamond Springs?
Median Population Age in Diamond Springs is 43.7 Years.
What is the Average Family Size in Diamond Springs
Average Family Size in Diamond Springs is 2.9 People.
What is the Average Household Size in Diamond Springs
Average Household Size in Diamond Springs is 2.4 People.
How Large is the Labor Force in Diamond Springs?
There are 5,470 People in the Labor Forcein in Diamond Springs.
What is the Percentage of People in the Labor Force in Diamond Springs?
55.9% of People are in the Labor Force in Diamond Springs.
What is the Unemployment Rate in Diamond Springs?
Unemployment Rate in Diamond Springs is 5.4%.