Cities with the Highest Percentage of Population Taking Public Transit to Work in Massachusetts
RELATED REPORTS & OPTIONS
Public Transit
Massachusetts
Compare Cities
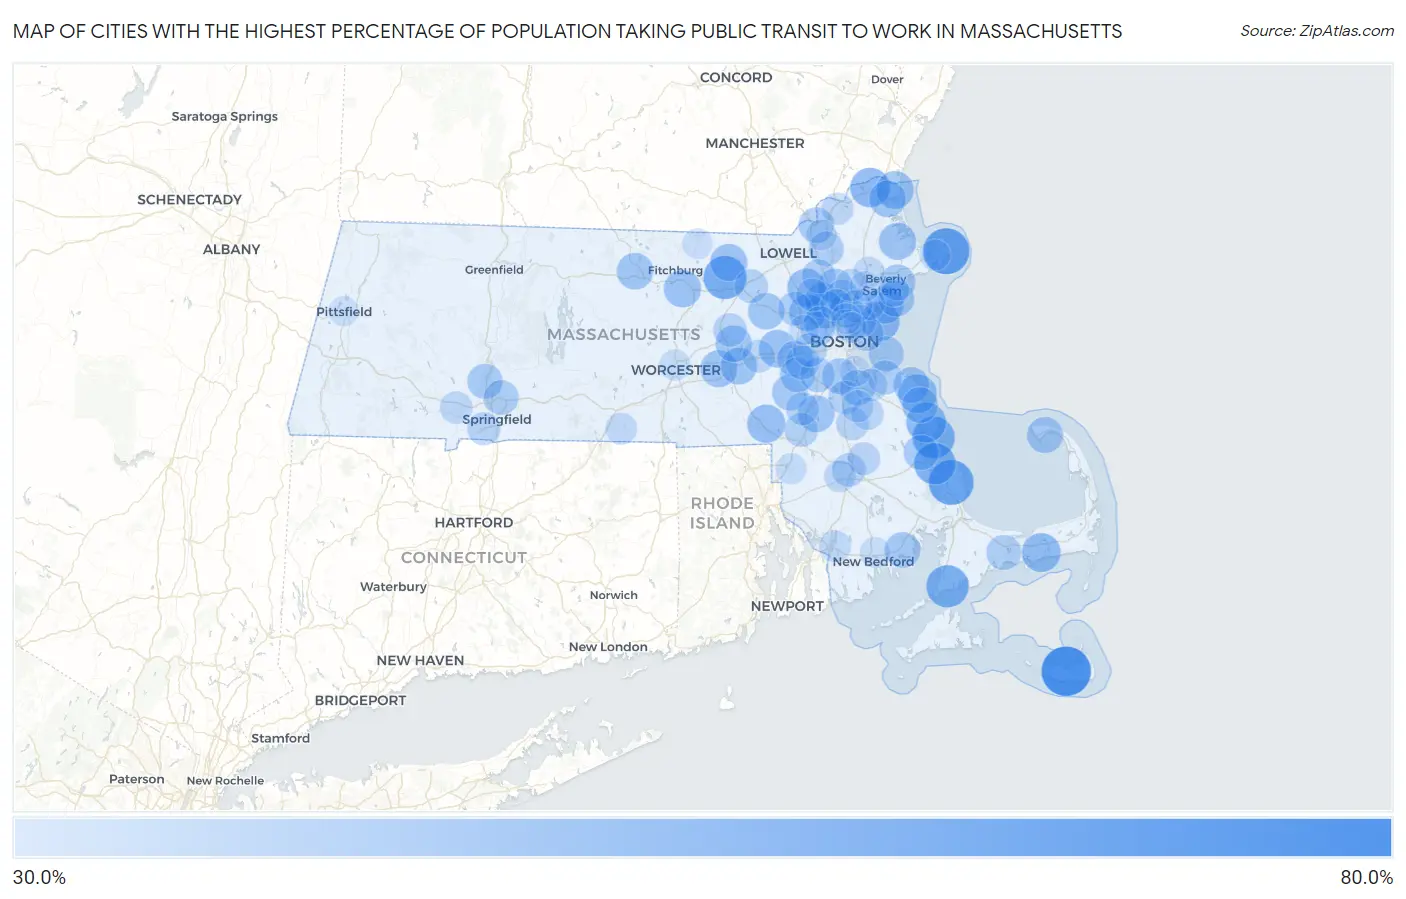
Map of Cities with the Highest Percentage of Population Taking Public Transit to Work in Massachusetts
0.0%
80.0%
Cities with the Highest Percentage of Population Taking Public Transit to Work in Massachusetts
| City | % Public Transit | vs State | vs National | |
| 1. | Nantucket | 72.5% | 35.9%(+36.6)#1 | 38.5%(+34.0)#12 |
| 2. | Rockport | 65.7% | 35.9%(+29.8)#2 | 38.5%(+27.2)#39 |
| 3. | The Pinehills | 63.1% | 35.9%(+27.2)#3 | 38.5%(+24.6)#85 |
| 4. | Ayer | 59.3% | 35.9%(+23.4)#4 | 38.5%(+20.8)#193 |
| 5. | Falmouth | 57.9% | 35.9%(+22.0)#5 | 38.5%(+19.4)#267 |
| 6. | Duxbury | 57.6% | 35.9%(+21.7)#6 | 38.5%(+19.1)#277 |
| 7. | Plymouth | 56.4% | 35.9%(+20.5)#7 | 38.5%(+17.9)#348 |
| 8. | Marshfield | 53.1% | 35.9%(+17.2)#8 | 38.5%(+14.6)#604 |
| 9. | Amesbury Town | 52.4% | 35.9%(+16.5)#9 | 38.5%(+13.9)#659 |
| 10. | Nahant | 51.7% | 35.9%(+15.8)#10 | 38.5%(+13.2)#705 |
| 11. | South Yarmouth | 51.1% | 35.9%(+15.2)#11 | 38.5%(+12.6)#765 |
| 12. | Scituate | 50.8% | 35.9%(+14.9)#12 | 38.5%(+12.3)#792 |
| 13. | Franklin Town | 49.5% | 35.9%(+13.6)#13 | 38.5%(+11.0)#951 |
| 14. | Pinehurst | 49.1% | 35.9%(+13.2)#14 | 38.5%(+10.6)#1,031 |
| 15. | Cochituate | 48.4% | 35.9%(+12.5)#15 | 38.5%(+9.90)#1,120 |
| 16. | Salisbury | 48.3% | 35.9%(+12.4)#16 | 38.5%(+9.80)#1,145 |
| 17. | North Attleborough | 48.2% | 35.9%(+12.3)#17 | 38.5%(+9.70)#1,152 |
| 18. | Swampscott | 48.1% | 35.9%(+12.2)#18 | 38.5%(+9.60)#1,167 |
| 19. | Leominster | 48.0% | 35.9%(+12.1)#19 | 38.5%(+9.50)#1,182 |
| 20. | Winchester | 47.7% | 35.9%(+11.8)#20 | 38.5%(+9.20)#1,215 |
| 21. | Groton | 47.6% | 35.9%(+11.7)#21 | 38.5%(+9.10)#1,243 |
| 22. | Ipswich | 47.5% | 35.9%(+11.6)#22 | 38.5%(+9.00)#1,260 |
| 23. | Westborough | 47.1% | 35.9%(+11.2)#23 | 38.5%(+8.60)#1,338 |
| 24. | Lexington | 46.8% | 35.9%(+10.9)#24 | 38.5%(+8.30)#1,371 |
| 25. | Sharon | 46.8% | 35.9%(+10.9)#25 | 38.5%(+8.30)#1,378 |
| 26. | Newburyport | 46.7% | 35.9%(+10.8)#26 | 38.5%(+8.20)#1,383 |
| 27. | Gardner | 46.4% | 35.9%(+10.5)#27 | 38.5%(+7.90)#1,438 |
| 28. | Cordaville | 46.4% | 35.9%(+10.5)#28 | 38.5%(+7.90)#1,445 |
| 29. | West Concord | 46.3% | 35.9%(+10.4)#29 | 38.5%(+7.80)#1,457 |
| 30. | Marlborough | 46.0% | 35.9%(+10.1)#30 | 38.5%(+7.50)#1,500 |
| 31. | Provincetown | 45.8% | 35.9%(+9.90)#31 | 38.5%(+7.30)#1,524 |
| 32. | North Scituate | 45.3% | 35.9%(+9.40)#32 | 38.5%(+6.80)#1,621 |
| 33. | Marblehead | 45.2% | 35.9%(+9.30)#33 | 38.5%(+6.70)#1,635 |
| 34. | Medfield | 45.2% | 35.9%(+9.30)#34 | 38.5%(+6.70)#1,638 |
| 35. | Beverly | 45.1% | 35.9%(+9.20)#35 | 38.5%(+6.60)#1,645 |
| 36. | Marshfield Hills | 45.0% | 35.9%(+9.10)#36 | 38.5%(+6.50)#1,673 |
| 37. | Wellesley | 44.9% | 35.9%(+9.00)#37 | 38.5%(+6.40)#1,679 |
| 38. | Milton | 44.9% | 35.9%(+9.00)#38 | 38.5%(+6.40)#1,680 |
| 39. | Mattapoisett Center | 44.8% | 35.9%(+8.90)#39 | 38.5%(+6.30)#1,699 |
| 40. | Methuen Town | 44.0% | 35.9%(+8.10)#40 | 38.5%(+5.50)#1,836 |
| 41. | Woburn | 43.8% | 35.9%(+7.90)#41 | 38.5%(+5.30)#1,857 |
| 42. | Braintree Town | 43.8% | 35.9%(+7.90)#42 | 38.5%(+5.30)#1,858 |
| 43. | Reading | 43.8% | 35.9%(+7.90)#43 | 38.5%(+5.30)#1,861 |
| 44. | Holyoke | 43.6% | 35.9%(+7.70)#44 | 38.5%(+5.10)#1,886 |
| 45. | Kingston | 43.5% | 35.9%(+7.60)#45 | 38.5%(+5.00)#1,919 |
| 46. | Hull | 43.4% | 35.9%(+7.50)#46 | 38.5%(+4.90)#1,926 |
| 47. | Barnstable Town | 43.3% | 35.9%(+7.40)#47 | 38.5%(+4.80)#1,938 |
| 48. | Dover | 43.3% | 35.9%(+7.40)#48 | 38.5%(+4.80)#1,958 |
| 49. | Andover | 42.9% | 35.9%(+7.00)#49 | 38.5%(+4.40)#2,028 |
| 50. | Chicopee | 42.8% | 35.9%(+6.90)#50 | 38.5%(+4.30)#2,042 |
| 51. | Winthrop Town | 42.7% | 35.9%(+6.80)#51 | 38.5%(+4.20)#2,076 |
| 52. | Belmont | 42.6% | 35.9%(+6.70)#52 | 38.5%(+4.10)#2,088 |
| 53. | Dedham | 42.4% | 35.9%(+6.50)#53 | 38.5%(+3.90)#2,128 |
| 54. | Melrose | 42.1% | 35.9%(+6.20)#54 | 38.5%(+3.60)#2,177 |
| 55. | Needham | 41.9% | 35.9%(+6.00)#55 | 38.5%(+3.40)#2,202 |
| 56. | Hingham | 41.6% | 35.9%(+5.70)#56 | 38.5%(+3.10)#2,255 |
| 57. | Wilmington | 41.5% | 35.9%(+5.60)#57 | 38.5%(+3.00)#2,267 |
| 58. | Hanscom Afb | 41.5% | 35.9%(+5.60)#58 | 38.5%(+3.00)#2,273 |
| 59. | Newton | 41.1% | 35.9%(+5.20)#59 | 38.5%(+2.60)#2,322 |
| 60. | Littleton Common | 41.1% | 35.9%(+5.20)#60 | 38.5%(+2.60)#2,332 |
| 61. | Foxborough | 41.0% | 35.9%(+5.10)#61 | 38.5%(+2.50)#2,348 |
| 62. | Hudson | 40.6% | 35.9%(+4.70)#62 | 38.5%(+2.10)#2,415 |
| 63. | Randolph Town | 40.5% | 35.9%(+4.60)#63 | 38.5%(+2.00)#2,436 |
| 64. | Raynham Center | 40.5% | 35.9%(+4.60)#64 | 38.5%(+2.00)#2,450 |
| 65. | Wakefield | 40.4% | 35.9%(+4.50)#65 | 38.5%(+1.90)#2,463 |
| 66. | Walpole | 39.7% | 35.9%(+3.80)#66 | 38.5%(+1.20)#2,593 |
| 67. | Brockton | 39.5% | 35.9%(+3.60)#67 | 38.5%(+1.00)#2,622 |
| 68. | Agawam Town | 39.5% | 35.9%(+3.60)#68 | 38.5%(+1.00)#2,626 |
| 69. | Lynn | 39.3% | 35.9%(+3.40)#69 | 38.5%(+0.800)#2,656 |
| 70. | Burlington | 39.3% | 35.9%(+3.40)#70 | 38.5%(+0.800)#2,662 |
| 71. | Bridgewater Town | 39.2% | 35.9%(+3.30)#71 | 38.5%(+0.700)#2,680 |
| 72. | Revere | 39.0% | 35.9%(+3.10)#72 | 38.5%(+0.500)#2,703 |
| 73. | Framingham | 38.7% | 35.9%(+2.80)#73 | 38.5%(+0.200)#2,760 |
| 74. | Westfield | 38.7% | 35.9%(+2.80)#74 | 38.5%(+0.200)#2,762 |
| 75. | Weymouth Town | 38.5% | 35.9%(+2.60)#75 | 38.5%(=0.000)#2,795 |
| 76. | Arlington | 38.4% | 35.9%(+2.50)#76 | 38.5%(-0.100)#2,815 |
| 77. | Abington | 38.4% | 35.9%(+2.50)#77 | 38.5%(-0.100)#2,817 |
| 78. | Saugus | 38.3% | 35.9%(+2.40)#78 | 38.5%(-0.200)#2,831 |
| 79. | Haverhill | 38.0% | 35.9%(+2.10)#79 | 38.5%(-0.500)#2,864 |
| 80. | Lynnfield | 37.9% | 35.9%(+2.00)#80 | 38.5%(-0.600)#2,881 |
| 81. | Holbrook | 37.9% | 35.9%(+2.00)#81 | 38.5%(-0.600)#2,882 |
| 82. | Taunton | 37.5% | 35.9%(+1.60)#82 | 38.5%(-1.00)#2,928 |
| 83. | Fall River | 37.4% | 35.9%(+1.50)#83 | 38.5%(-1.10)#2,947 |
| 84. | Stoneham | 37.4% | 35.9%(+1.50)#84 | 38.5%(-1.10)#2,954 |
| 85. | Southbridge Town | 37.3% | 35.9%(+1.40)#85 | 38.5%(-1.20)#2,975 |
| 86. | Danvers | 36.9% | 35.9%(+1.00)#86 | 38.5%(-1.60)#3,023 |
| 87. | Worcester | 36.0% | 35.9%(+0.100)#87 | 38.5%(-2.50)#3,157 |
| 88. | Gloucester | 35.9% | 35.9%(=0.000)#88 | 38.5%(-2.60)#3,168 |
| 89. | Attleboro | 35.8% | 35.9%(-0.100)#89 | 38.5%(-2.70)#3,182 |
| 90. | Lawrence | 35.4% | 35.9%(-0.500)#90 | 38.5%(-3.10)#3,251 |
| 91. | Everett | 35.4% | 35.9%(-0.500)#91 | 38.5%(-3.10)#3,254 |
| 92. | Salem | 35.3% | 35.9%(-0.600)#92 | 38.5%(-3.20)#3,268 |
| 93. | New Bedford | 35.2% | 35.9%(-0.700)#93 | 38.5%(-3.30)#3,282 |
| 94. | Malden | 35.2% | 35.9%(-0.700)#94 | 38.5%(-3.30)#3,283 |
| 95. | Chelsea | 35.1% | 35.9%(-0.800)#95 | 38.5%(-3.40)#3,304 |
| 96. | Quincy | 35.0% | 35.9%(-0.900)#96 | 38.5%(-3.50)#3,314 |
| 97. | Townsend | 34.8% | 35.9%(-1.10)#97 | 38.5%(-3.70)#3,355 |
| 98. | Peabody | 34.5% | 35.9%(-1.40)#98 | 38.5%(-4.00)#3,391 |
| 99. | Pittsfield | 34.1% | 35.9%(-1.80)#99 | 38.5%(-4.40)#3,440 |
| 100. | Waltham | 34.0% | 35.9%(-1.90)#100 | 38.5%(-4.50)#3,449 |
Common Questions
What are the Top 10 Cities with the Highest Percentage of Population Taking Public Transit to Work in Massachusetts?
Top 10 Cities with the Highest Percentage of Population Taking Public Transit to Work in Massachusetts are:
#1
72.5%
#2
65.7%
#3
63.1%
#4
59.3%
#5
57.9%
#6
57.6%
#7
56.4%
#8
53.1%
#9
52.4%
#10
51.7%
What city has the Highest Percentage of Population Taking Public Transit to Work in Massachusetts?
Nantucket has the Highest Percentage of Population Taking Public Transit to Work in Massachusetts with 72.5%.
What is the Percentage of Population Taking Public Transit to Work in the State of Massachusetts?
Percentage of Population Taking Public Transit to Work in Massachusetts is 35.9%.
What is the Percentage of Population Taking Public Transit to Work in the United States?
Percentage of Population Taking Public Transit to Work in the United States is 38.5%.