South Monrovia Island, CA Map & Demographics
South Monrovia Island Map
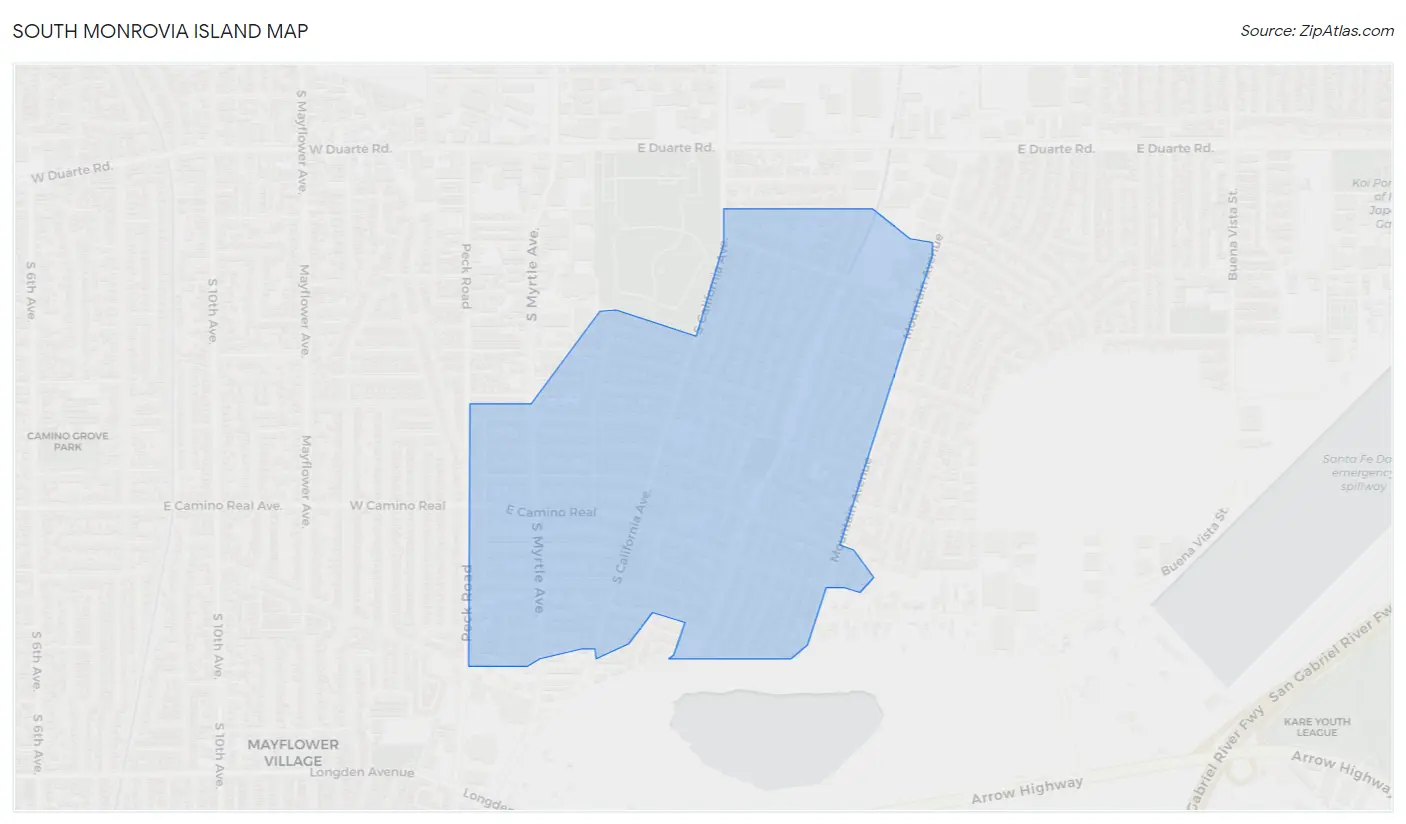
South Monrovia Island Overview
$28,977
PER CAPITA INCOME
$110,506
AVG FAMILY INCOME
$110,000
AVG HOUSEHOLD INCOME
11.9%
WAGE / INCOME GAP [ % ]
88.1¢/ $1
WAGE / INCOME GAP [ $ ]
$8,901
FAMILY INCOME DEFICIT
0.37
INEQUALITY / GINI INDEX
6,833
TOTAL POPULATION
3,804
MALE POPULATION
3,029
FEMALE POPULATION
125.59
MALES / 100 FEMALES
79.63
FEMALES / 100 MALES
35.8
MEDIAN AGE
4.1
AVG FAMILY SIZE
3.9
AVG HOUSEHOLD SIZE
3,379
LABOR FORCE [ PEOPLE ]
62.8%
PERCENT IN LABOR FORCE
5.8%
UNEMPLOYMENT RATE
Income in South Monrovia Island
Income Overview in South Monrovia Island
Per Capita Income in South Monrovia Island is $28,977, while median incomes of families and households are $110,506 and $110,000 respectively.
| Characteristic | Number | Measure |
| Per Capita Income | 6,833 | $28,977 |
| Median Family Income | 1,524 | $110,506 |
| Mean Family Income | 1,524 | $116,415 |
| Median Household Income | 1,686 | $110,000 |
| Mean Household Income | 1,686 | $112,294 |
| Income Deficit | 1,524 | $8,901 |
| Wage / Income Gap (%) | 6,833 | 11.90% |
| Wage / Income Gap ($) | 6,833 | 88.10¢ per $1 |
| Gini / Inequality Index | 6,833 | 0.37 |
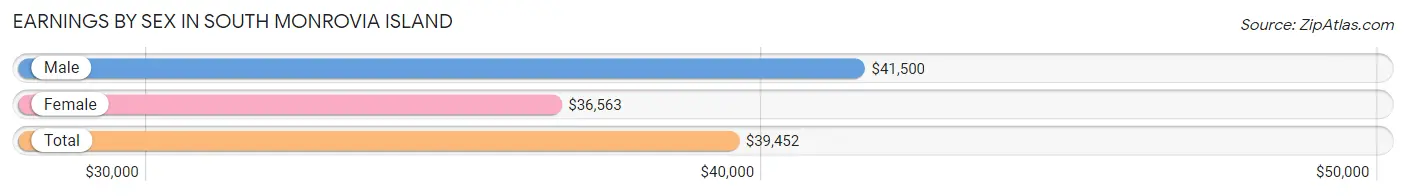
Earnings by Sex in South Monrovia Island
Average Earnings in South Monrovia Island are $39,452, $41,500 for men and $36,563 for women, a difference of 11.9%.
| Sex | Number | Average Earnings |
| Male | 1,866 (56.0%) | $41,500 |
| Female | 1,467 (44.0%) | $36,563 |
| Total | 3,333 (100.0%) | $39,452 |
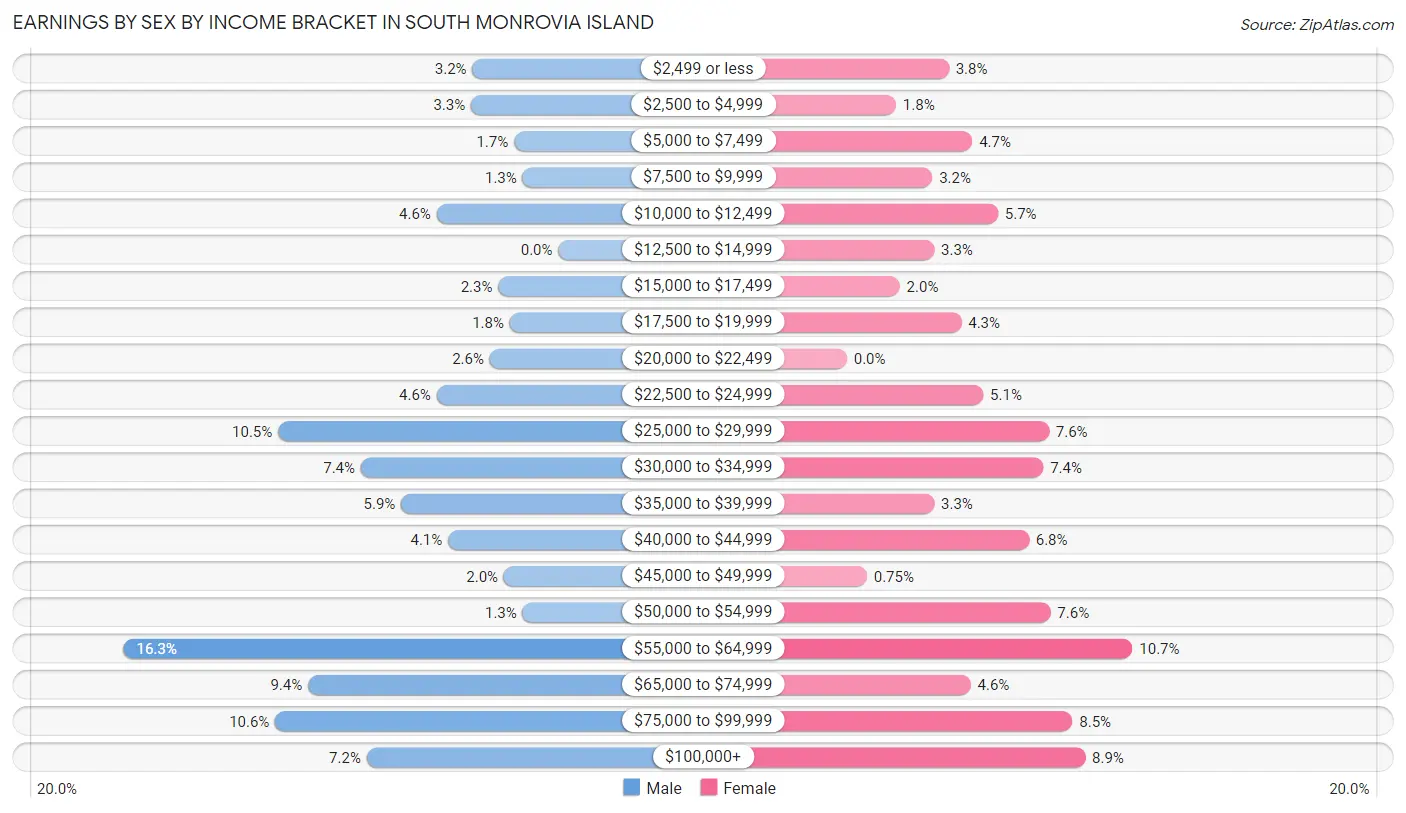
Earnings by Sex by Income Bracket in South Monrovia Island
The most common earnings brackets in South Monrovia Island are $55,000 to $64,999 for men (304 | 16.3%) and $55,000 to $64,999 for women (157 | 10.7%).
| Income | Male | Female |
| $2,499 or less | 60 (3.2%) | 56 (3.8%) |
| $2,500 to $4,999 | 61 (3.3%) | 27 (1.8%) |
| $5,000 to $7,499 | 31 (1.7%) | 69 (4.7%) |
| $7,500 to $9,999 | 25 (1.3%) | 47 (3.2%) |
| $10,000 to $12,499 | 85 (4.6%) | 83 (5.7%) |
| $12,500 to $14,999 | 0 (0.0%) | 48 (3.3%) |
| $15,000 to $17,499 | 42 (2.2%) | 29 (2.0%) |
| $17,500 to $19,999 | 34 (1.8%) | 63 (4.3%) |
| $20,000 to $22,499 | 48 (2.6%) | 0 (0.0%) |
| $22,500 to $24,999 | 85 (4.6%) | 75 (5.1%) |
| $25,000 to $29,999 | 196 (10.5%) | 111 (7.6%) |
| $30,000 to $34,999 | 138 (7.4%) | 108 (7.4%) |
| $35,000 to $39,999 | 110 (5.9%) | 48 (3.3%) |
| $40,000 to $44,999 | 77 (4.1%) | 100 (6.8%) |
| $45,000 to $49,999 | 38 (2.0%) | 11 (0.7%) |
| $50,000 to $54,999 | 25 (1.3%) | 112 (7.6%) |
| $55,000 to $64,999 | 304 (16.3%) | 157 (10.7%) |
| $65,000 to $74,999 | 175 (9.4%) | 68 (4.6%) |
| $75,000 to $99,999 | 198 (10.6%) | 124 (8.5%) |
| $100,000+ | 134 (7.2%) | 131 (8.9%) |
| Total | 1,866 (100.0%) | 1,467 (100.0%) |
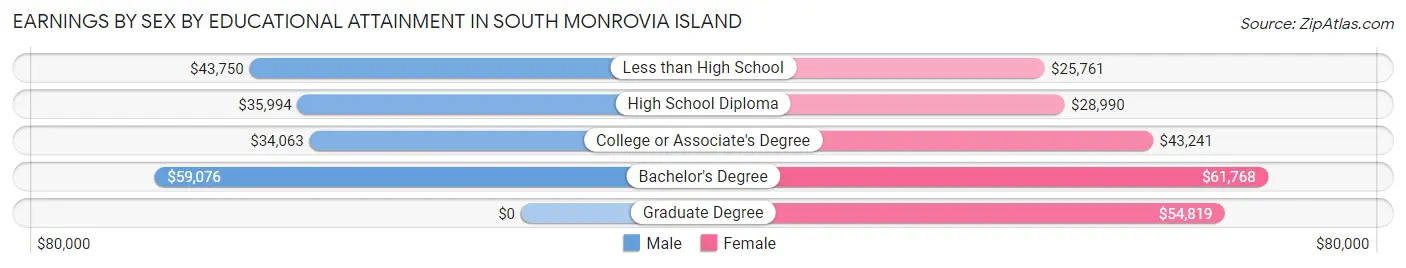
Earnings by Sex by Educational Attainment in South Monrovia Island
Average earnings in South Monrovia Island are $44,894 for men and $41,575 for women, a difference of 7.4%. Men with an educational attainment of bachelor's degree enjoy the highest average annual earnings of $59,076, while those with college or associate's degree education earn the least with $34,063. Women with an educational attainment of bachelor's degree earn the most with the average annual earnings of $61,768, while those with less than high school education have the smallest earnings of $25,761.
| Educational Attainment | Male Income | Female Income |
| Less than High School | $43,750 | $25,761 |
| High School Diploma | $35,994 | $28,990 |
| College or Associate's Degree | $34,063 | $43,241 |
| Bachelor's Degree | $59,076 | $61,768 |
| Graduate Degree | - | - |
| Total | $44,894 | $41,575 |
Family Income in South Monrovia Island
Family Income Brackets in South Monrovia Island
According to the South Monrovia Island family income data, there are 384 families falling into the $150,000 to $199,999 income range, which is the most common income bracket and makes up 25.2% of all families. Conversely, the $10,000 to $14,999 income bracket is the least frequent group with only 14 families (0.9%) belonging to this category.
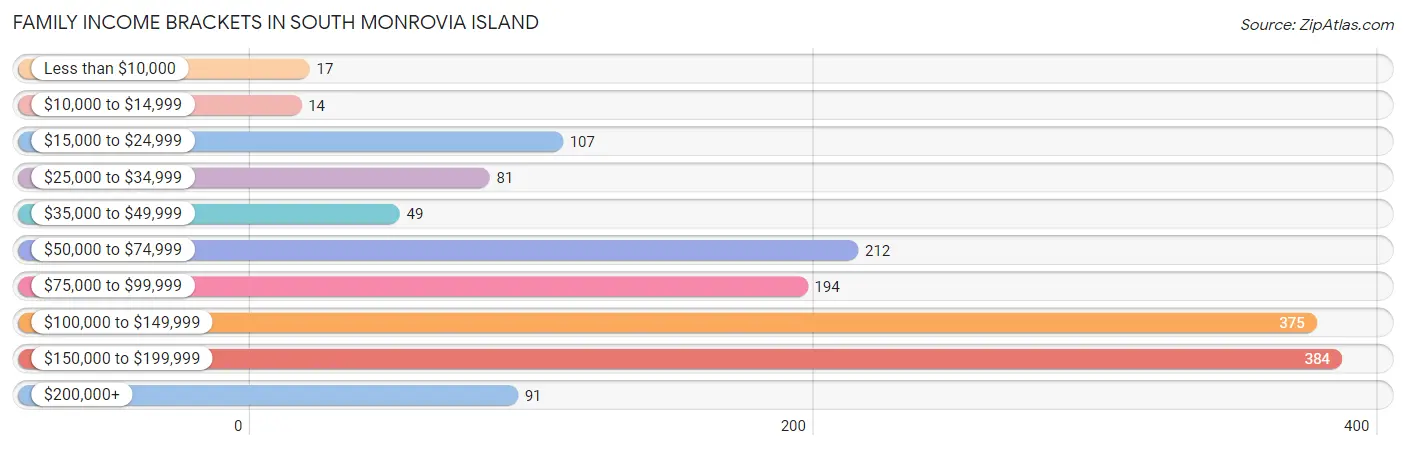
| Income Bracket | # Families | % Families |
| Less than $10,000 | 17 | 1.1% |
| $10,000 to $14,999 | 14 | 0.9% |
| $15,000 to $24,999 | 107 | 7.0% |
| $25,000 to $34,999 | 81 | 5.3% |
| $35,000 to $49,999 | 49 | 3.2% |
| $50,000 to $74,999 | 212 | 13.9% |
| $75,000 to $99,999 | 194 | 12.7% |
| $100,000 to $149,999 | 375 | 24.6% |
| $150,000 to $199,999 | 384 | 25.2% |
| $200,000+ | 91 | 6.0% |
Family Income by Famaliy Size in South Monrovia Island
7+ person families (102 | 6.7%) account for the highest median family income in South Monrovia Island with $167,353 per family, while 2-person families (361 | 23.7%) have the highest median income of $37,986 per family member.
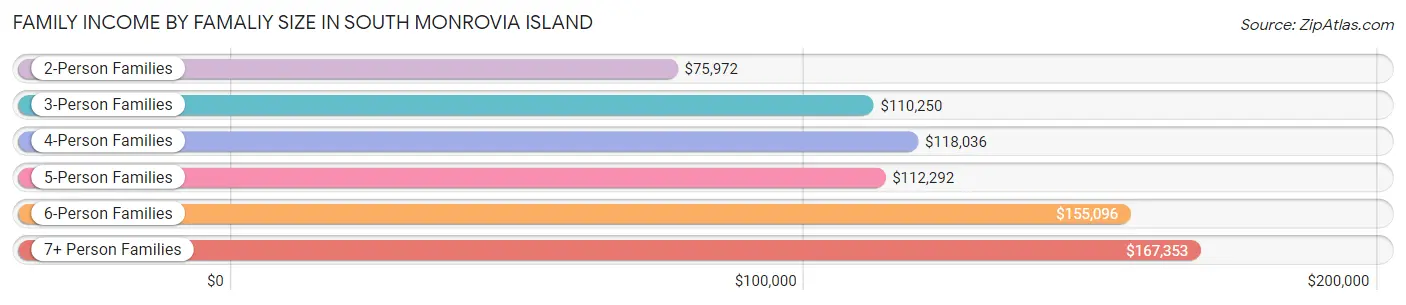
| Income Bracket | # Families | Median Income |
| 2-Person Families | 361 (23.7%) | $75,972 |
| 3-Person Families | 453 (29.7%) | $110,250 |
| 4-Person Families | 259 (17.0%) | $118,036 |
| 5-Person Families | 286 (18.8%) | $112,292 |
| 6-Person Families | 63 (4.1%) | $155,096 |
| 7+ Person Families | 102 (6.7%) | $167,353 |
| Total | 1,524 (100.0%) | $110,506 |
Family Income by Number of Earners in South Monrovia Island
The median family income in South Monrovia Island is $110,506, with families comprising 3+ earners (368) having the highest median family income of $153,176, while families with no earners (155) have the lowest median family income of $31,328, accounting for 24.1% and 10.2% of families, respectively.
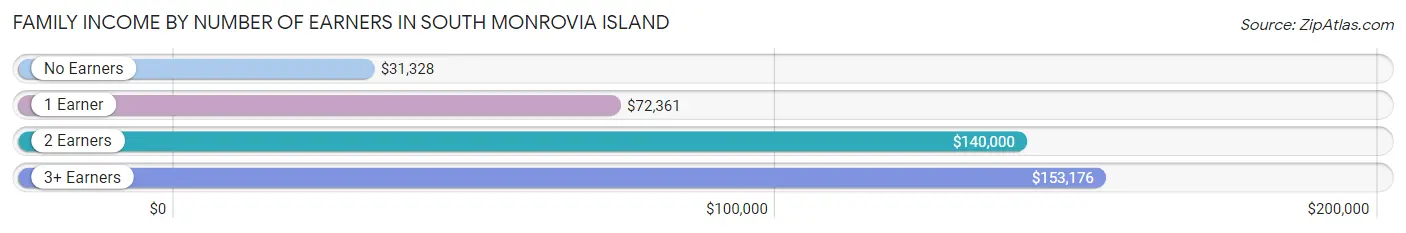
| Number of Earners | # Families | Median Income |
| No Earners | 155 (10.2%) | $31,328 |
| 1 Earner | 469 (30.8%) | $72,361 |
| 2 Earners | 532 (34.9%) | $140,000 |
| 3+ Earners | 368 (24.1%) | $153,176 |
| Total | 1,524 (100.0%) | $110,506 |
Household Income in South Monrovia Island
Household Income Brackets in South Monrovia Island
With 413 households falling in the category, the $100,000 to $149,999 income range is the most frequent in South Monrovia Island, accounting for 24.5% of all households. In contrast, only 17 households (1.0%) fall into the less than $10,000 income bracket, making it the least populous group.
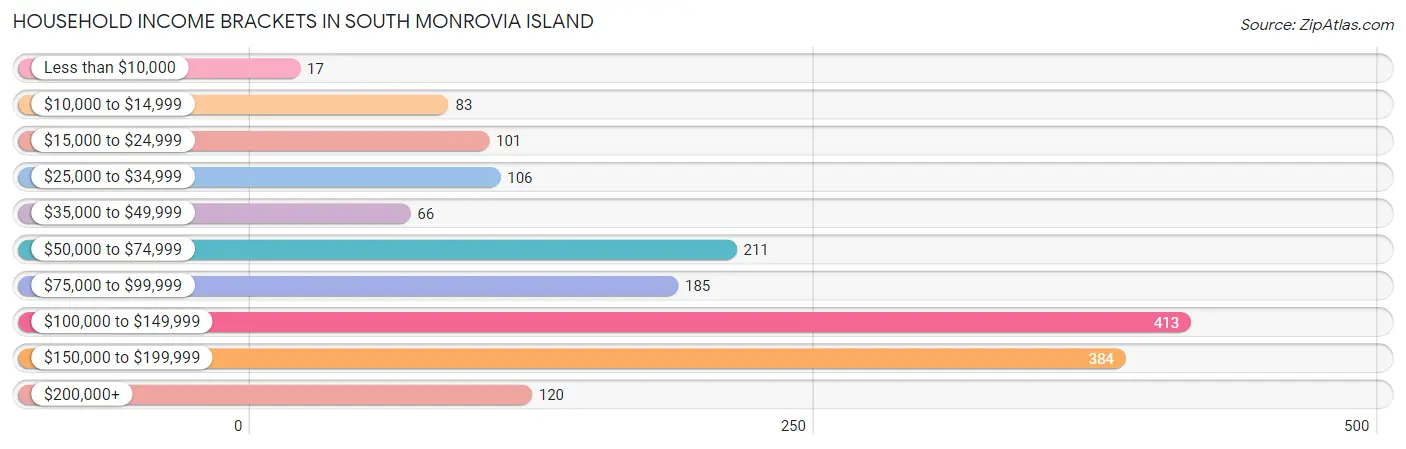
| Income Bracket | # Households | % Households |
| Less than $10,000 | 17 | 1.0% |
| $10,000 to $14,999 | 83 | 4.9% |
| $15,000 to $24,999 | 101 | 6.0% |
| $25,000 to $34,999 | 106 | 6.3% |
| $35,000 to $49,999 | 66 | 3.9% |
| $50,000 to $74,999 | 211 | 12.5% |
| $75,000 to $99,999 | 185 | 11.0% |
| $100,000 to $149,999 | 413 | 24.5% |
| $150,000 to $199,999 | 384 | 22.8% |
| $200,000+ | 120 | 7.1% |
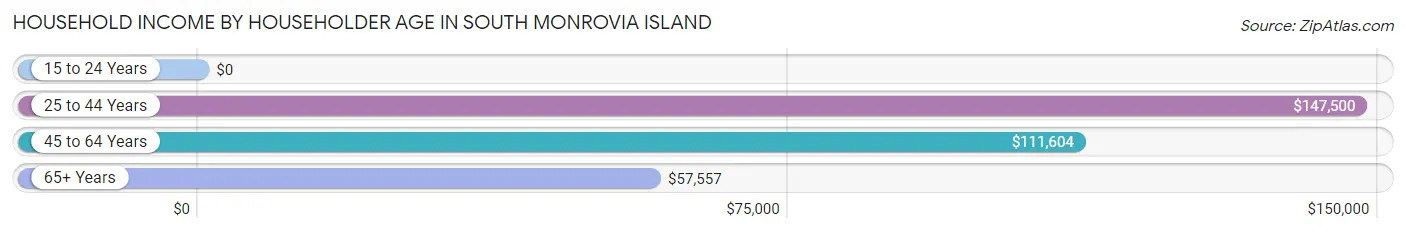
Household Income by Householder Age in South Monrovia Island
The median household income in South Monrovia Island is $110,000, with the highest median household income of $147,500 found in the 25 to 44 years age bracket for the primary householder. A total of 552 households (32.7%) fall into this category.
| Income Bracket | # Households | Median Income |
| 15 to 24 Years | 0 (0.0%) | $0 |
| 25 to 44 Years | 552 (32.7%) | $147,500 |
| 45 to 64 Years | 799 (47.4%) | $111,604 |
| 65+ Years | 335 (19.9%) | $57,557 |
| Total | 1,686 (100.0%) | $110,000 |
Poverty in South Monrovia Island
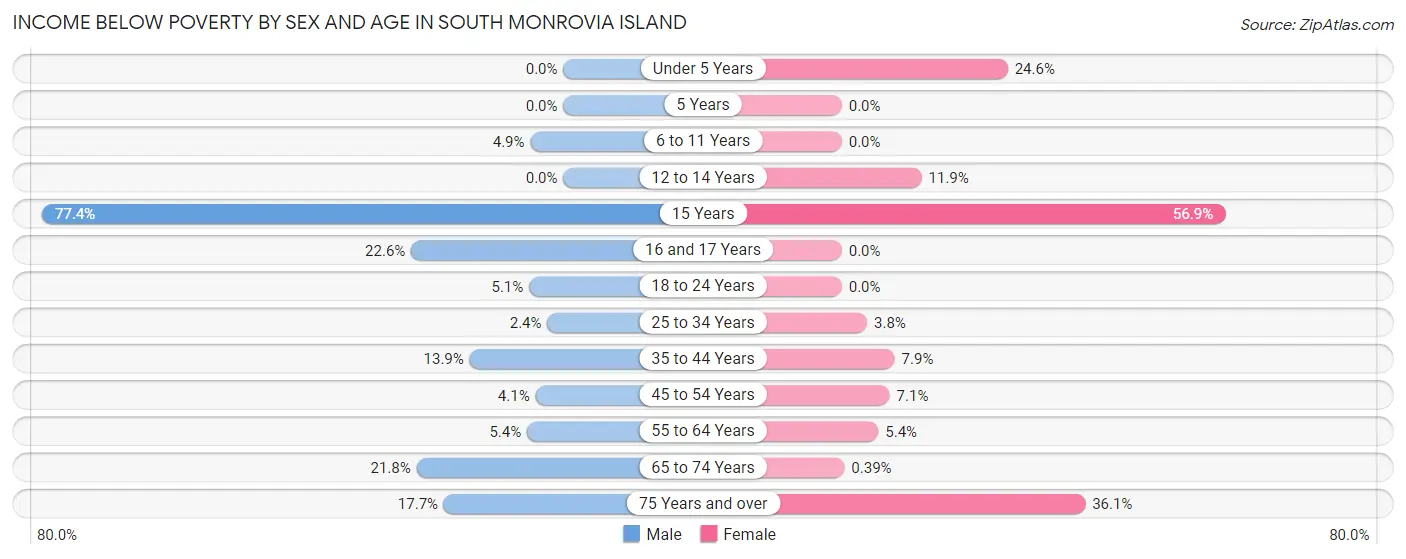
Income Below Poverty by Sex and Age in South Monrovia Island
With 8.7% poverty level for males and 8.4% for females among the residents of South Monrovia Island, 15 year old males and 15 year old females are the most vulnerable to poverty, with 48 males (77.4%) and 33 females (56.9%) in their respective age groups living below the poverty level.
| Age Bracket | Male | Female |
| Under 5 Years | 0 (0.0%) | 34 (24.6%) |
| 5 Years | 0 (0.0%) | 0 (0.0%) |
| 6 to 11 Years | 15 (4.9%) | 0 (0.0%) |
| 12 to 14 Years | 0 (0.0%) | 16 (11.8%) |
| 15 Years | 48 (77.4%) | 33 (56.9%) |
| 16 and 17 Years | 47 (22.6%) | 0 (0.0%) |
| 18 to 24 Years | 13 (5.1%) | 0 (0.0%) |
| 25 to 34 Years | 15 (2.4%) | 14 (3.8%) |
| 35 to 44 Years | 82 (13.9%) | 38 (7.9%) |
| 45 to 54 Years | 17 (4.1%) | 30 (7.1%) |
| 55 to 64 Years | 20 (5.4%) | 22 (5.4%) |
| 65 to 74 Years | 29 (21.8%) | 1 (0.4%) |
| 75 Years and over | 33 (17.7%) | 60 (36.1%) |
| Total | 319 (8.7%) | 248 (8.4%) |
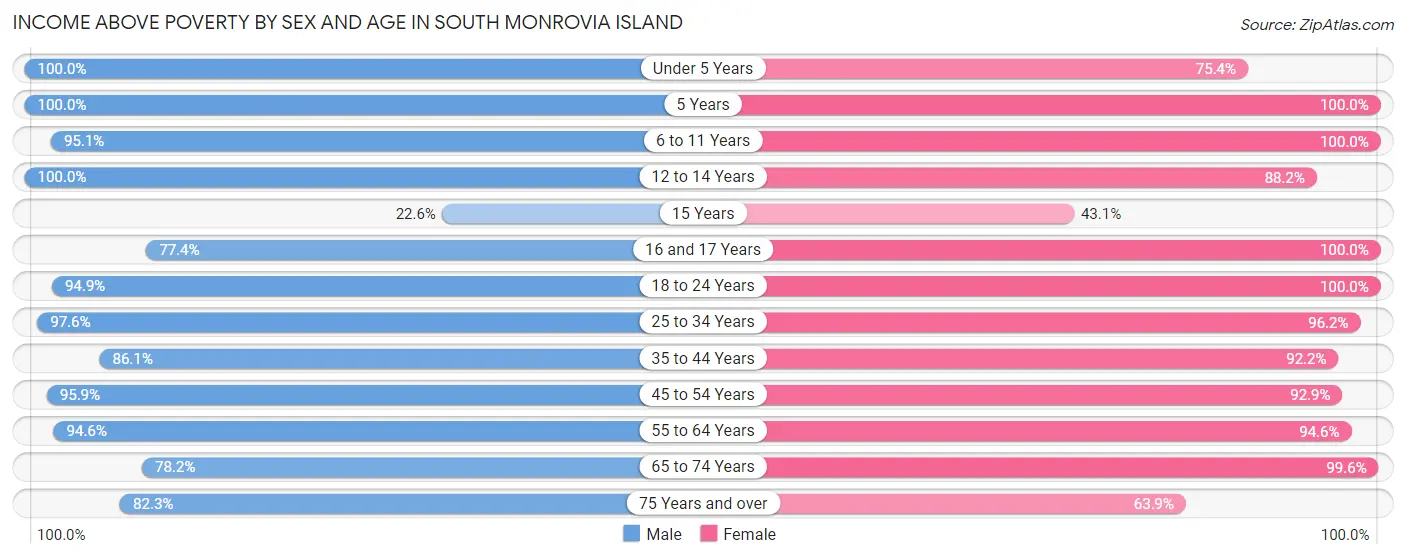
Income Above Poverty by Sex and Age in South Monrovia Island
According to the poverty statistics in South Monrovia Island, males aged under 5 years and females aged 5 years are the age groups that are most secure financially, with 100.0% of males and 100.0% of females in these age groups living above the poverty line.
| Age Bracket | Male | Female |
| Under 5 Years | 233 (100.0%) | 104 (75.4%) |
| 5 Years | 34 (100.0%) | 9 (100.0%) |
| 6 to 11 Years | 291 (95.1%) | 196 (100.0%) |
| 12 to 14 Years | 262 (100.0%) | 119 (88.1%) |
| 15 Years | 14 (22.6%) | 25 (43.1%) |
| 16 and 17 Years | 161 (77.4%) | 53 (100.0%) |
| 18 to 24 Years | 243 (94.9%) | 266 (100.0%) |
| 25 to 34 Years | 617 (97.6%) | 358 (96.2%) |
| 35 to 44 Years | 507 (86.1%) | 446 (92.1%) |
| 45 to 54 Years | 394 (95.9%) | 392 (92.9%) |
| 55 to 64 Years | 351 (94.6%) | 383 (94.6%) |
| 65 to 74 Years | 104 (78.2%) | 254 (99.6%) |
| 75 Years and over | 153 (82.3%) | 106 (63.9%) |
| Total | 3,364 (91.3%) | 2,711 (91.6%) |
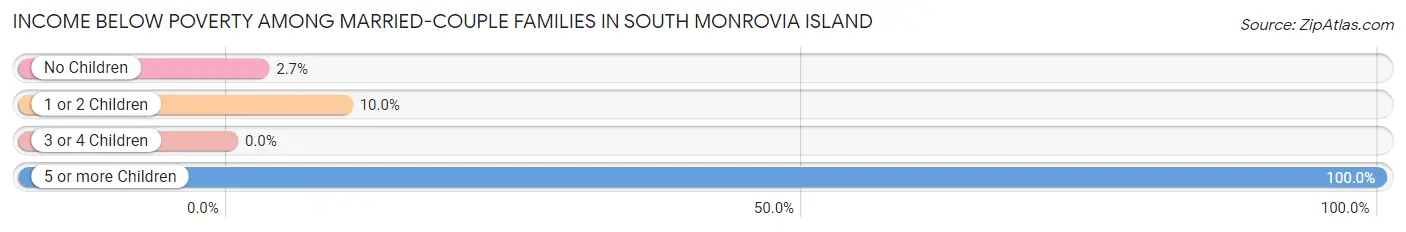
Income Below Poverty Among Married-Couple Families in South Monrovia Island
The poverty statistics for married-couple families in South Monrovia Island show that 7.1% or 69 of the total 966 families live below the poverty line. Families with 5 or more children have the highest poverty rate of 100.0%, comprising of 15 families. On the other hand, families with 3 or 4 children have the lowest poverty rate of 0.0%, which includes 0 families.
| Children | Above Poverty | Below Poverty |
| No Children | 358 (97.3%) | 10 (2.7%) |
| 1 or 2 Children | 397 (90.0%) | 44 (10.0%) |
| 3 or 4 Children | 142 (100.0%) | 0 (0.0%) |
| 5 or more Children | 0 (0.0%) | 15 (100.0%) |
| Total | 897 (92.9%) | 69 (7.1%) |
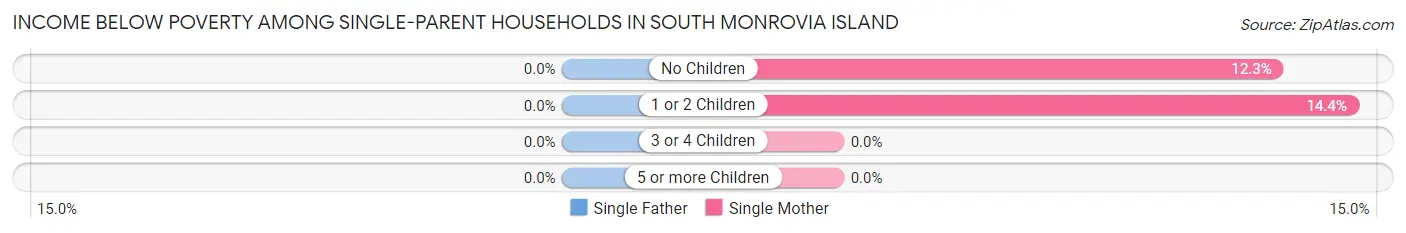
Income Below Poverty Among Single-Parent Households in South Monrovia Island
| Children | Single Father | Single Mother |
| No Children | 0 (0.0%) | 37 (12.3%) |
| 1 or 2 Children | 0 (0.0%) | 20 (14.4%) |
| 3 or 4 Children | 0 (0.0%) | 0 (0.0%) |
| 5 or more Children | 0 (0.0%) | 0 (0.0%) |
| Total | 0 (0.0%) | 57 (12.6%) |
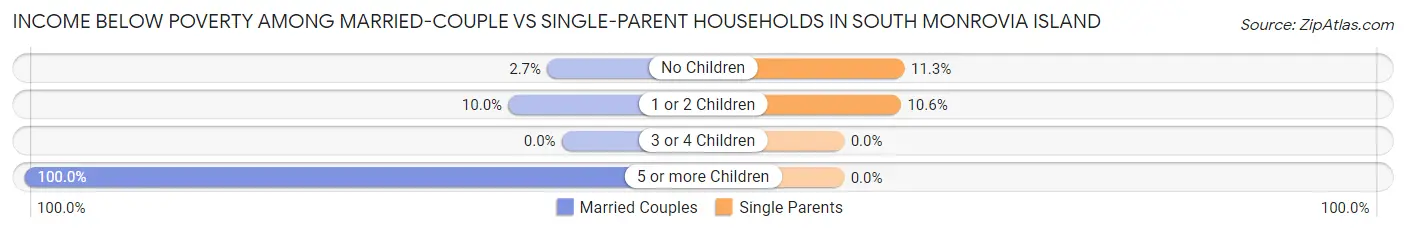
Income Below Poverty Among Married-Couple vs Single-Parent Households in South Monrovia Island
The poverty data for South Monrovia Island shows that 69 of the married-couple family households (7.1%) and 57 of the single-parent households (10.2%) are living below the poverty level. Within the married-couple family households, those with 5 or more children have the highest poverty rate, with 15 households (100.0%) falling below the poverty line. Among the single-parent households, those with no children have the highest poverty rate, with 37 household (11.3%) living below poverty.
| Children | Married-Couple Families | Single-Parent Households |
| No Children | 10 (2.7%) | 37 (11.3%) |
| 1 or 2 Children | 44 (10.0%) | 20 (10.6%) |
| 3 or 4 Children | 0 (0.0%) | 0 (0.0%) |
| 5 or more Children | 15 (100.0%) | 0 (0.0%) |
| Total | 69 (7.1%) | 57 (10.2%) |
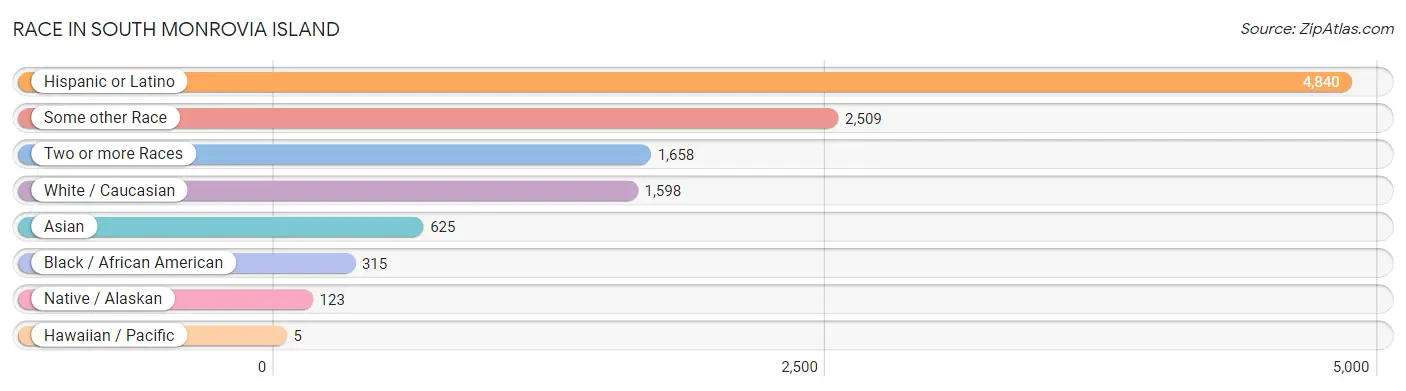
Race in South Monrovia Island
The most populous races in South Monrovia Island are Hispanic or Latino (4,840 | 70.8%), Some other Race (2,509 | 36.7%), and Two or more Races (1,658 | 24.3%).
| Race | # Population | % Population |
| Asian | 625 | 9.1% |
| Black / African American | 315 | 4.6% |
| Hawaiian / Pacific | 5 | 0.1% |
| Hispanic or Latino | 4,840 | 70.8% |
| Native / Alaskan | 123 | 1.8% |
| White / Caucasian | 1,598 | 23.4% |
| Two or more Races | 1,658 | 24.3% |
| Some other Race | 2,509 | 36.7% |
| Total | 6,833 | 100.0% |
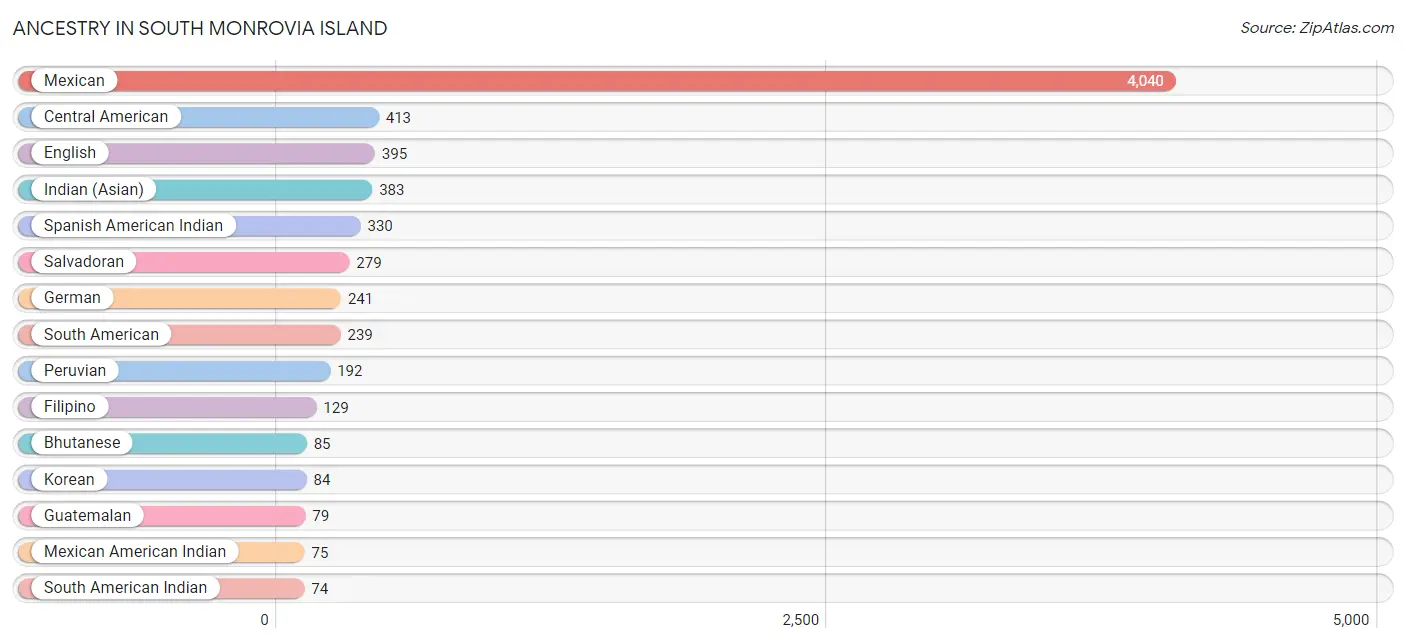
Ancestry in South Monrovia Island
The most populous ancestries reported in South Monrovia Island are Mexican (4,040 | 59.1%), Central American (413 | 6.0%), English (395 | 5.8%), Indian (Asian) (383 | 5.6%), and Spanish American Indian (330 | 4.8%), together accounting for 81.4% of all South Monrovia Island residents.
| Ancestry | # Population | % Population |
| African | 1 | 0.0% |
| Argentinean | 28 | 0.4% |
| Armenian | 9 | 0.1% |
| Bhutanese | 85 | 1.2% |
| Bolivian | 10 | 0.2% |
| Burmese | 10 | 0.2% |
| Central American | 413 | 6.0% |
| Central American Indian | 26 | 0.4% |
| Dutch | 8 | 0.1% |
| Ecuadorian | 2 | 0.0% |
| English | 395 | 5.8% |
| Filipino | 129 | 1.9% |
| French | 42 | 0.6% |
| German | 241 | 3.5% |
| Greek | 4 | 0.1% |
| Guatemalan | 79 | 1.2% |
| Honduran | 55 | 0.8% |
| Hungarian | 37 | 0.5% |
| Indian (Asian) | 383 | 5.6% |
| Irish | 42 | 0.6% |
| Italian | 52 | 0.8% |
| Korean | 84 | 1.2% |
| Laotian | 31 | 0.4% |
| Mexican | 4,040 | 59.1% |
| Mexican American Indian | 75 | 1.1% |
| Native Hawaiian | 5 | 0.1% |
| Northern European | 66 | 1.0% |
| Peruvian | 192 | 2.8% |
| Romanian | 4 | 0.1% |
| Salvadoran | 279 | 4.1% |
| Scandinavian | 9 | 0.1% |
| Scottish | 70 | 1.0% |
| Seminole | 8 | 0.1% |
| South American | 239 | 3.5% |
| South American Indian | 74 | 1.1% |
| Spanish American Indian | 330 | 4.8% |
| Sri Lankan | 33 | 0.5% |
| Subsaharan African | 1 | 0.0% |
| Swedish | 21 | 0.3% |
| Ukrainian | 4 | 0.1% |
| Venezuelan | 7 | 0.1% |
| Welsh | 23 | 0.3% | View All 42 Rows |
Immigrants in South Monrovia Island
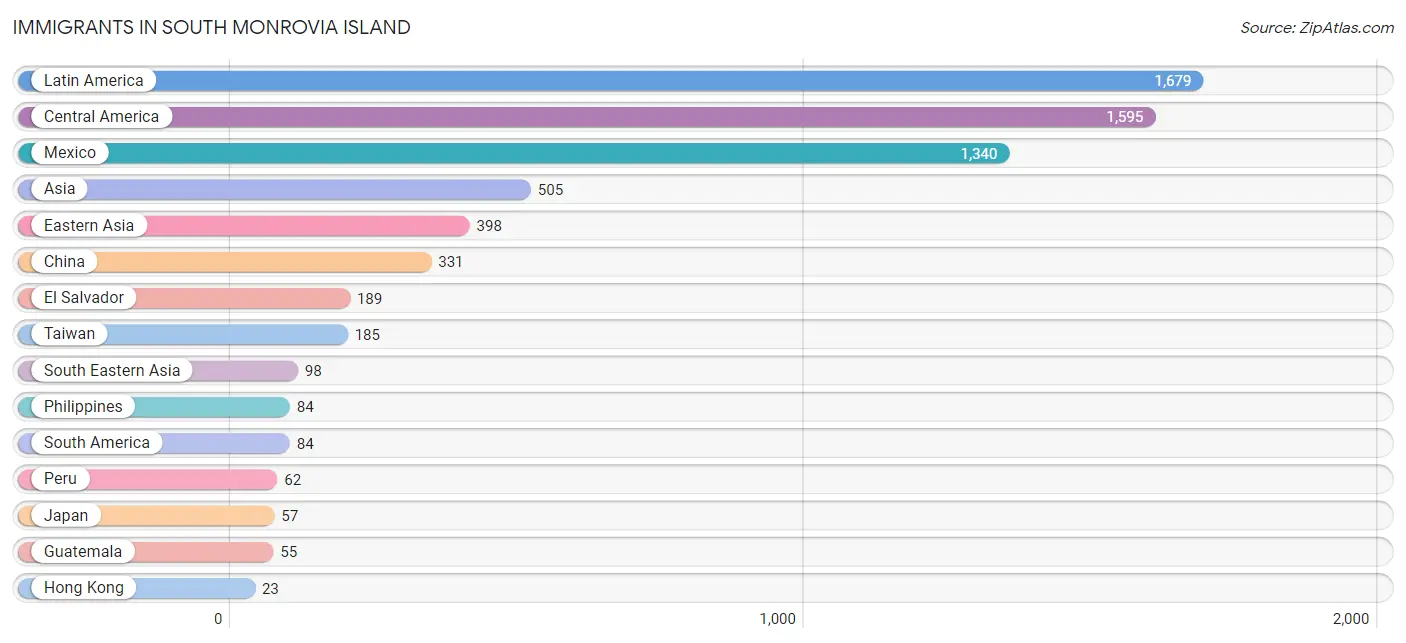
The most numerous immigrant groups reported in South Monrovia Island came from Latin America (1,679 | 24.6%), Central America (1,595 | 23.3%), Mexico (1,340 | 19.6%), Asia (505 | 7.4%), and Eastern Asia (398 | 5.8%), together accounting for 80.7% of all South Monrovia Island residents.
| Immigration Origin | # Population | % Population |
| Argentina | 13 | 0.2% |
| Armenia | 9 | 0.1% |
| Asia | 505 | 7.4% |
| Austria | 16 | 0.2% |
| Central America | 1,595 | 23.3% |
| China | 331 | 4.8% |
| Eastern Asia | 398 | 5.8% |
| Ecuador | 2 | 0.0% |
| El Salvador | 189 | 2.8% |
| Europe | 20 | 0.3% |
| Greece | 4 | 0.1% |
| Guatemala | 55 | 0.8% |
| Honduras | 11 | 0.2% |
| Hong Kong | 23 | 0.3% |
| Indonesia | 9 | 0.1% |
| Japan | 57 | 0.8% |
| Korea | 10 | 0.2% |
| Latin America | 1,679 | 24.6% |
| Mexico | 1,340 | 19.6% |
| Peru | 62 | 0.9% |
| Philippines | 84 | 1.2% |
| South America | 84 | 1.2% |
| South Eastern Asia | 98 | 1.4% |
| Southern Europe | 4 | 0.1% |
| Taiwan | 185 | 2.7% |
| Venezuela | 7 | 0.1% |
| Vietnam | 5 | 0.1% |
| Western Asia | 9 | 0.1% |
| Western Europe | 16 | 0.2% | View All 29 Rows |
Sex and Age in South Monrovia Island
Sex and Age in South Monrovia Island
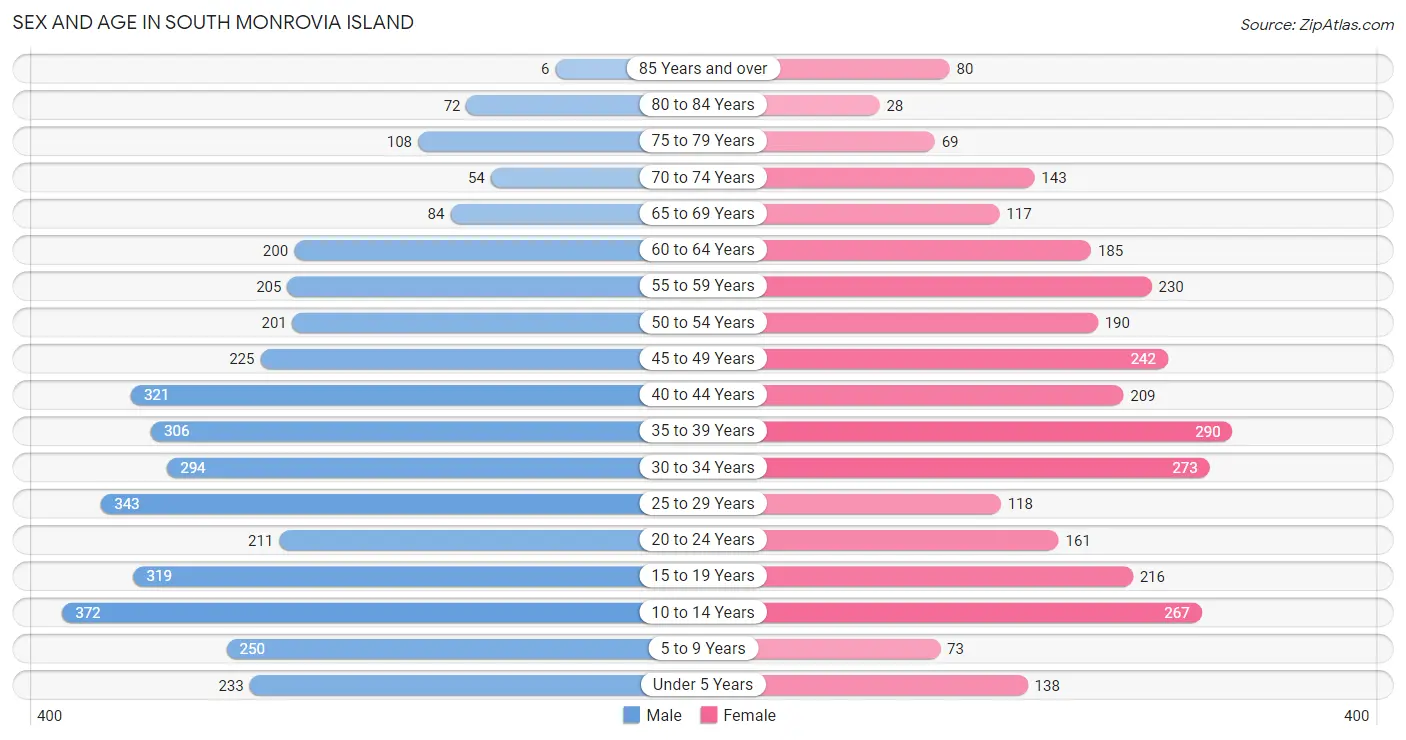
The most populous age groups in South Monrovia Island are 10 to 14 Years (372 | 9.8%) for men and 35 to 39 Years (290 | 9.6%) for women.
| Age Bracket | Male | Female |
| Under 5 Years | 233 (6.1%) | 138 (4.6%) |
| 5 to 9 Years | 250 (6.6%) | 73 (2.4%) |
| 10 to 14 Years | 372 (9.8%) | 267 (8.8%) |
| 15 to 19 Years | 319 (8.4%) | 216 (7.1%) |
| 20 to 24 Years | 211 (5.6%) | 161 (5.3%) |
| 25 to 29 Years | 343 (9.0%) | 118 (3.9%) |
| 30 to 34 Years | 294 (7.7%) | 273 (9.0%) |
| 35 to 39 Years | 306 (8.0%) | 290 (9.6%) |
| 40 to 44 Years | 321 (8.4%) | 209 (6.9%) |
| 45 to 49 Years | 225 (5.9%) | 242 (8.0%) |
| 50 to 54 Years | 201 (5.3%) | 190 (6.3%) |
| 55 to 59 Years | 205 (5.4%) | 230 (7.6%) |
| 60 to 64 Years | 200 (5.3%) | 185 (6.1%) |
| 65 to 69 Years | 84 (2.2%) | 117 (3.9%) |
| 70 to 74 Years | 54 (1.4%) | 143 (4.7%) |
| 75 to 79 Years | 108 (2.8%) | 69 (2.3%) |
| 80 to 84 Years | 72 (1.9%) | 28 (0.9%) |
| 85 Years and over | 6 (0.2%) | 80 (2.6%) |
| Total | 3,804 (100.0%) | 3,029 (100.0%) |
Families and Households in South Monrovia Island
Median Family Size in South Monrovia Island
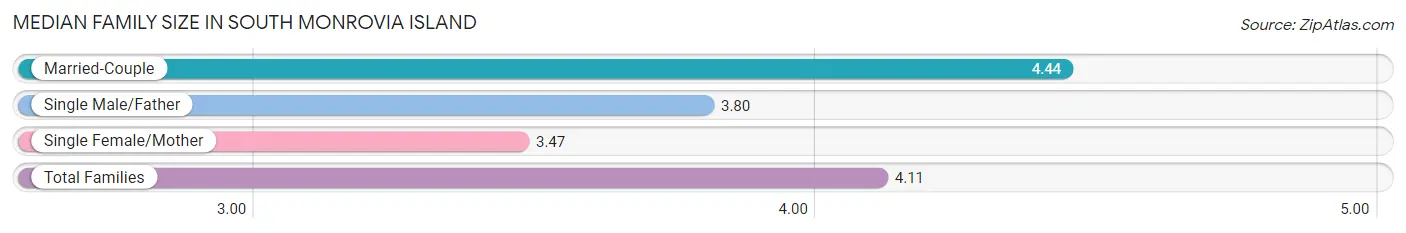
The median family size in South Monrovia Island is 4.11 persons per family, with married-couple families (966 | 63.4%) accounting for the largest median family size of 4.44 persons per family. On the other hand, single female/mother families (452 | 29.7%) represent the smallest median family size with 3.47 persons per family.
| Family Type | # Families | Family Size |
| Married-Couple | 966 (63.4%) | 4.44 |
| Single Male/Father | 106 (7.0%) | 3.80 |
| Single Female/Mother | 452 (29.7%) | 3.47 |
| Total Families | 1,524 (100.0%) | 4.11 |
Median Household Size in South Monrovia Island
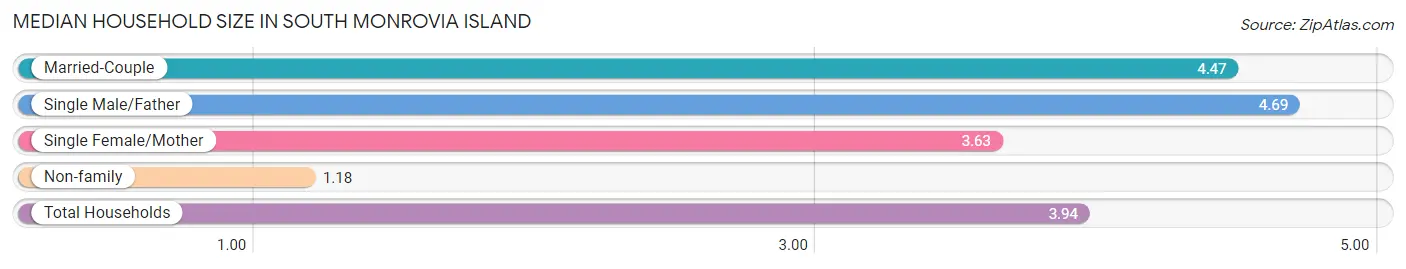
The median household size in South Monrovia Island is 3.94 persons per household, with single male/father households (106 | 6.3%) accounting for the largest median household size of 4.69 persons per household. non-family households (162 | 9.6%) represent the smallest median household size with 1.18 persons per household.
| Household Type | # Households | Household Size |
| Married-Couple | 966 (57.3%) | 4.47 |
| Single Male/Father | 106 (6.3%) | 4.69 |
| Single Female/Mother | 452 (26.8%) | 3.63 |
| Non-family | 162 (9.6%) | 1.18 |
| Total Households | 1,686 (100.0%) | 3.94 |
Household Size by Marriage Status in South Monrovia Island
Out of a total of 1,686 households in South Monrovia Island, 1,524 (90.4%) are family households, while 162 (9.6%) are nonfamily households. The most numerous type of family households are 3-person households, comprising 452, and the most common type of nonfamily households are 1-person households, comprising 138.
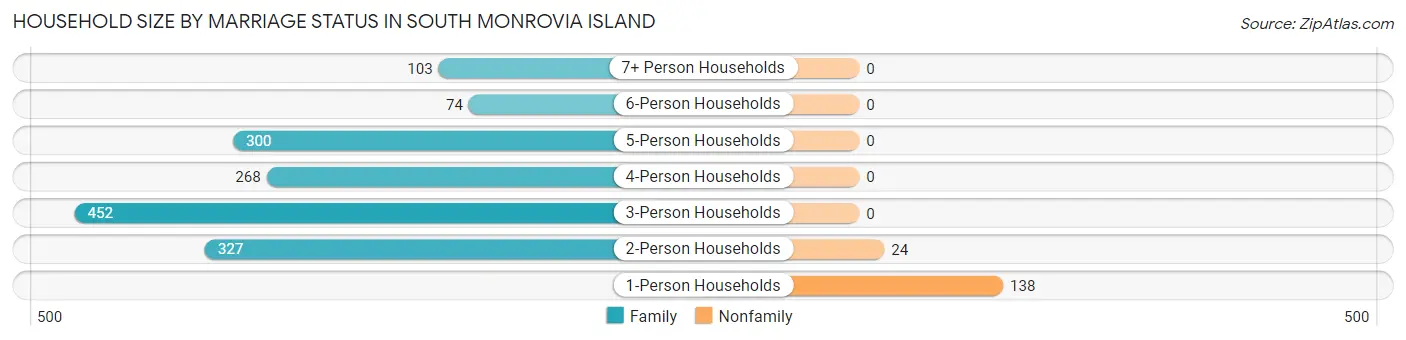
| Household Size | Family Households | Nonfamily Households |
| 1-Person Households | - | 138 (8.2%) |
| 2-Person Households | 327 (19.4%) | 24 (1.4%) |
| 3-Person Households | 452 (26.8%) | 0 (0.0%) |
| 4-Person Households | 268 (15.9%) | 0 (0.0%) |
| 5-Person Households | 300 (17.8%) | 0 (0.0%) |
| 6-Person Households | 74 (4.4%) | 0 (0.0%) |
| 7+ Person Households | 103 (6.1%) | 0 (0.0%) |
| Total | 1,524 (90.4%) | 162 (9.6%) |
Female Fertility in South Monrovia Island
Fertility by Age in South Monrovia Island
Average fertility rate in South Monrovia Island is 32.0 births per 1,000 women. Women in the age bracket of 20 to 34 years have the highest fertility rate with 91.0 births per 1,000 women. Women in the age bracket of 20 to 34 years acount for 100.0% of all women with births.
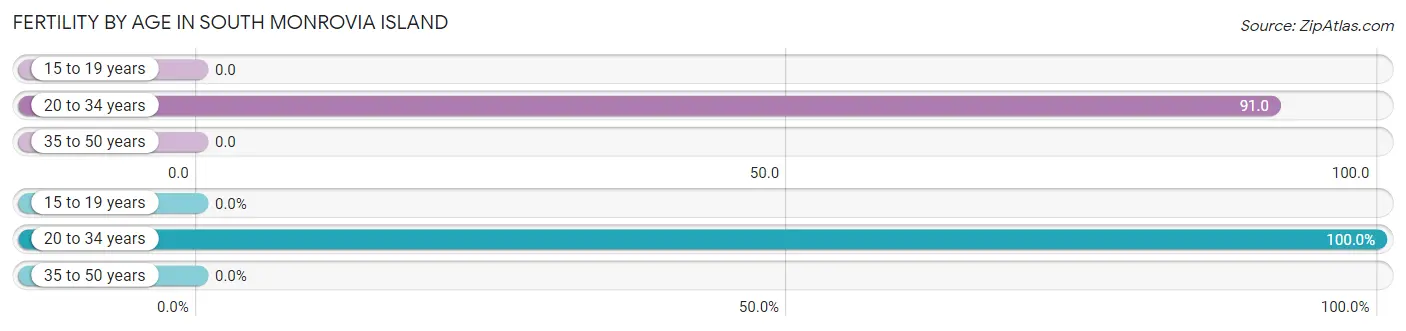
| Age Bracket | Women with Births | Births / 1,000 Women |
| 15 to 19 years | 0 (0.0%) | 0.0 |
| 20 to 34 years | 50 (100.0%) | 91.0 |
| 35 to 50 years | 0 (0.0%) | 0.0 |
| Total | 50 (100.0%) | 32.0 |
Fertility by Age by Marriage Status in South Monrovia Island
20.0% of women with births (50) in South Monrovia Island are married. The highest percentage of unmarried women with births falls into 20 to 34 years age bracket with 80.0% of them unmarried at the time of birth, while the lowest percentage of unmarried women with births belong to 20 to 34 years age bracket with 80.0% of them unmarried.
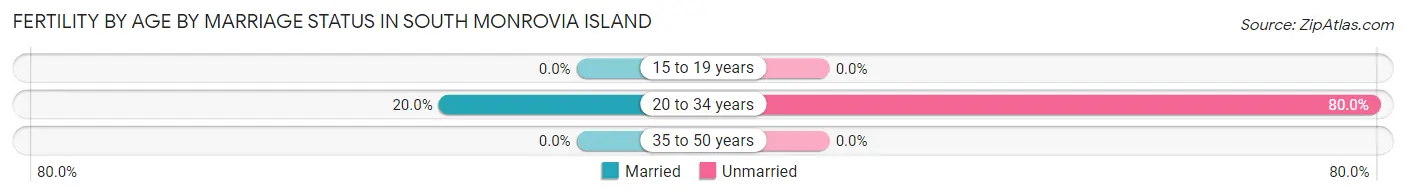
| Age Bracket | Married | Unmarried |
| 15 to 19 years | 0 (0.0%) | 0 (0.0%) |
| 20 to 34 years | 10 (20.0%) | 40 (80.0%) |
| 35 to 50 years | 0 (0.0%) | 0 (0.0%) |
| Total | 10 (20.0%) | 40 (80.0%) |
Fertility by Education in South Monrovia Island
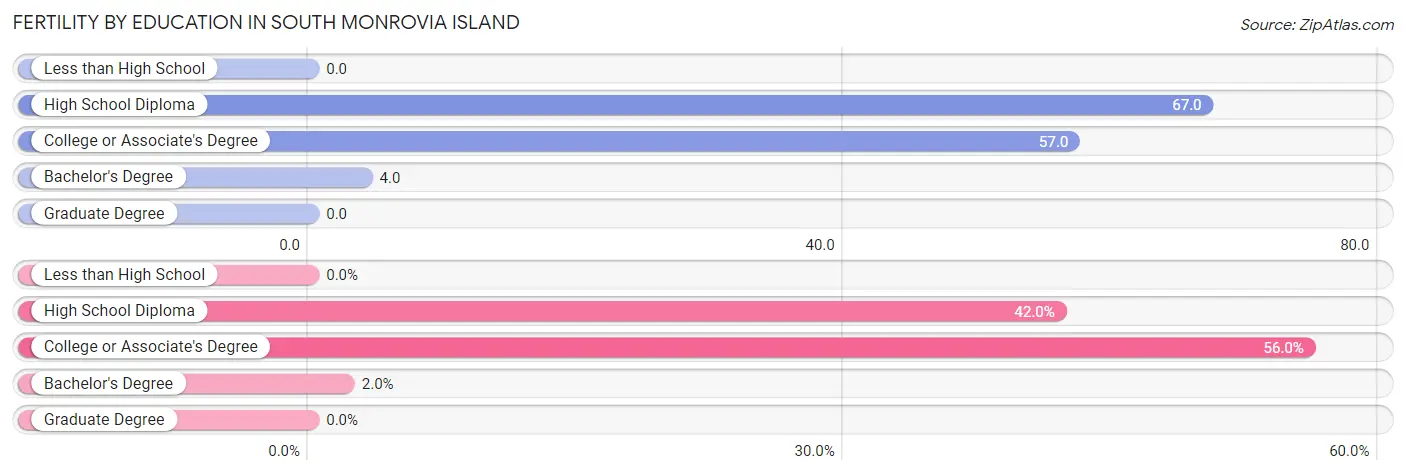
| Educational Attainment | Women with Births | Births / 1,000 Women |
| Less than High School | 0 (0.0%) | 0.0 |
| High School Diploma | 21 (42.0%) | 67.0 |
| College or Associate's Degree | 28 (56.0%) | 57.0 |
| Bachelor's Degree | 1 (2.0%) | 4.0 |
| Graduate Degree | 0 (0.0%) | 0.0 |
| Total | 50 (100.0%) | 32.0 |
Fertility by Education by Marriage Status in South Monrovia Island
80.0% of women with births in South Monrovia Island are unmarried. Women with the educational attainment of bachelor's degree are most likely to be married with 100.0% of them married at childbirth, while women with the educational attainment of college or associate's degree are least likely to be married with 100.0% of them unmarried at childbirth.
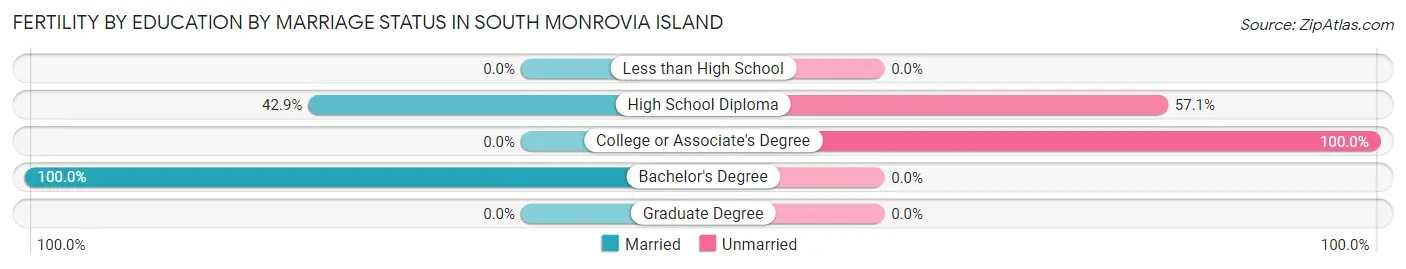
| Educational Attainment | Married | Unmarried |
| Less than High School | 0 (0.0%) | 0 (0.0%) |
| High School Diploma | 9 (42.9%) | 12 (57.1%) |
| College or Associate's Degree | 0 (0.0%) | 28 (100.0%) |
| Bachelor's Degree | 1 (100.0%) | 0 (0.0%) |
| Graduate Degree | 0 (0.0%) | 0 (0.0%) |
| Total | 10 (20.0%) | 40 (80.0%) |
Employment Characteristics in South Monrovia Island
Employment by Class of Employer in South Monrovia Island
Among the 3,151 employed individuals in South Monrovia Island, private company employees (2,150 | 68.2%), not-for-profit organizations (369 | 11.7%), and local government employees (288 | 9.1%) make up the most common classes of employment.
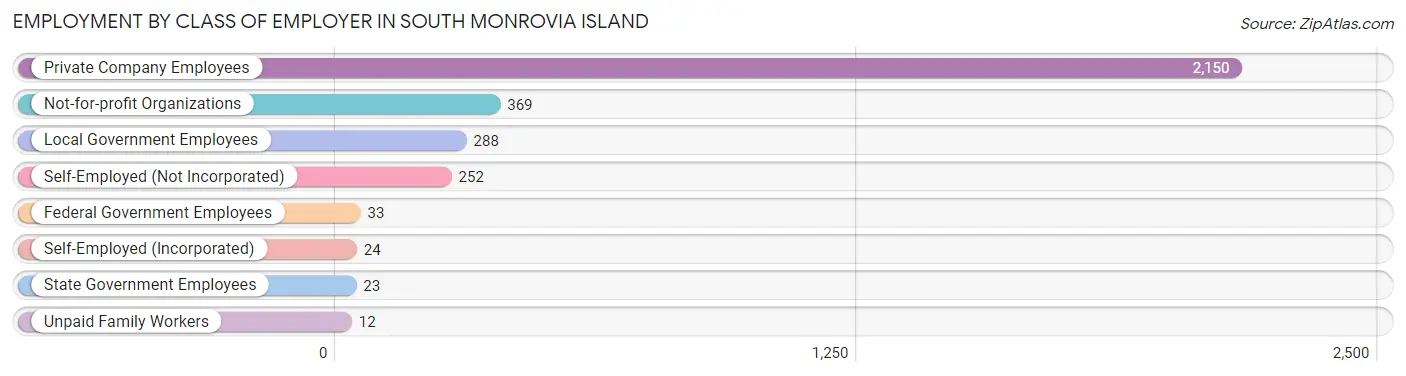
| Employer Class | # Employees | % Employees |
| Private Company Employees | 2,150 | 68.2% |
| Self-Employed (Incorporated) | 24 | 0.8% |
| Self-Employed (Not Incorporated) | 252 | 8.0% |
| Not-for-profit Organizations | 369 | 11.7% |
| Local Government Employees | 288 | 9.1% |
| State Government Employees | 23 | 0.7% |
| Federal Government Employees | 33 | 1.1% |
| Unpaid Family Workers | 12 | 0.4% |
| Total | 3,151 | 100.0% |
Employment Status by Age in South Monrovia Island
According to the labor force statistics for South Monrovia Island, out of the total population over 16 years of age (5,380), 62.8% or 3,379 individuals are in the labor force, with 5.8% or 196 of them unemployed. The age group with the highest labor force participation rate is 20 to 24 years, with 85.2% or 317 individuals in the labor force. Within the labor force, the 20 to 24 years age range has the highest percentage of unemployed individuals, with 15.8% or 50 of them being unemployed.
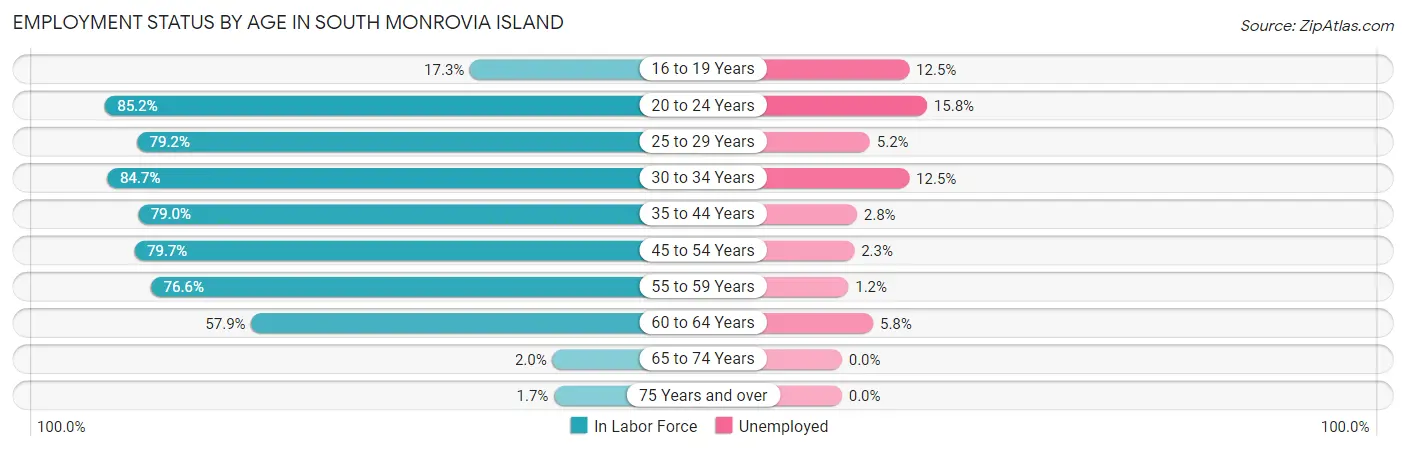
| Age Bracket | In Labor Force | Unemployed |
| 16 to 19 Years | 72 (17.3%) | 9 (12.5%) |
| 20 to 24 Years | 317 (85.2%) | 50 (15.8%) |
| 25 to 29 Years | 365 (79.2%) | 19 (5.2%) |
| 30 to 34 Years | 480 (84.7%) | 60 (12.5%) |
| 35 to 44 Years | 890 (79.0%) | 25 (2.8%) |
| 45 to 54 Years | 684 (79.7%) | 16 (2.3%) |
| 55 to 59 Years | 333 (76.6%) | 4 (1.2%) |
| 60 to 64 Years | 223 (57.9%) | 13 (5.8%) |
| 65 to 74 Years | 8 (2.0%) | 0 (0.0%) |
| 75 Years and over | 6 (1.7%) | 0 (0.0%) |
| Total | 3,379 (62.8%) | 196 (5.8%) |
Employment Status by Educational Attainment in South Monrovia Island
According to labor force statistics for South Monrovia Island, 77.6% of individuals (2,974) out of the total population between 25 and 64 years of age (3,832) are in the labor force, with 4.6% or 137 of them being unemployed. The group with the highest labor force participation rate are those with the educational attainment of bachelor's degree or higher, with 89.7% or 982 individuals in the labor force. Within the labor force, individuals with less than high school education have the highest percentage of unemployment, with 8.8% or 61 of them being unemployed.
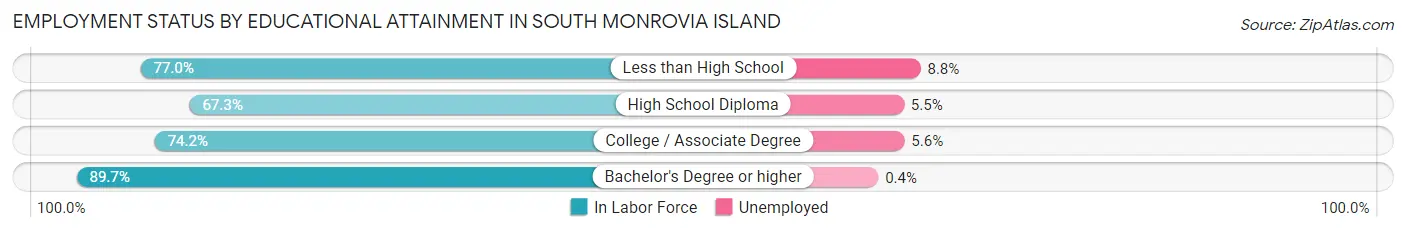
| Educational Attainment | In Labor Force | Unemployed |
| Less than High School | 697 (77.0%) | 80 (8.8%) |
| High School Diploma | 616 (67.3%) | 50 (5.5%) |
| College / Associate Degree | 680 (74.2%) | 51 (5.6%) |
| Bachelor's Degree or higher | 982 (89.7%) | 4 (0.4%) |
| Total | 2,974 (77.6%) | 176 (4.6%) |
Employment Occupations by Sex in South Monrovia Island
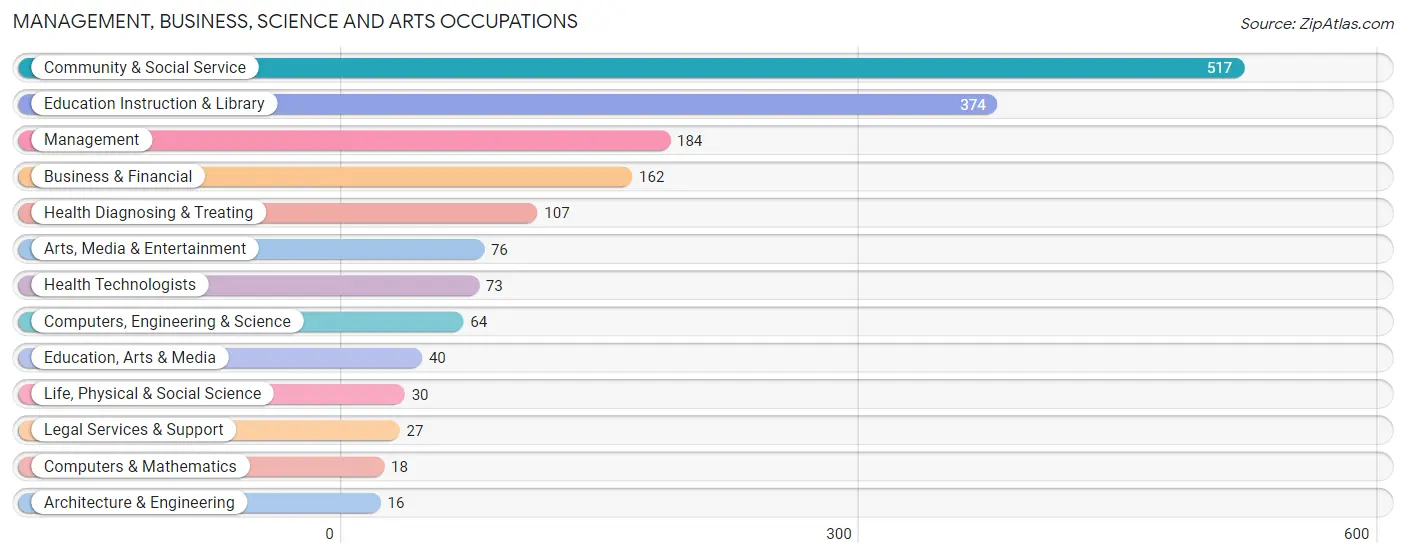
Management, Business, Science and Arts Occupations
The most common Management, Business, Science and Arts occupations in South Monrovia Island are Community & Social Service (517 | 16.3%), Education Instruction & Library (374 | 11.7%), Management (184 | 5.8%), Business & Financial (162 | 5.1%), and Health Diagnosing & Treating (107 | 3.4%).
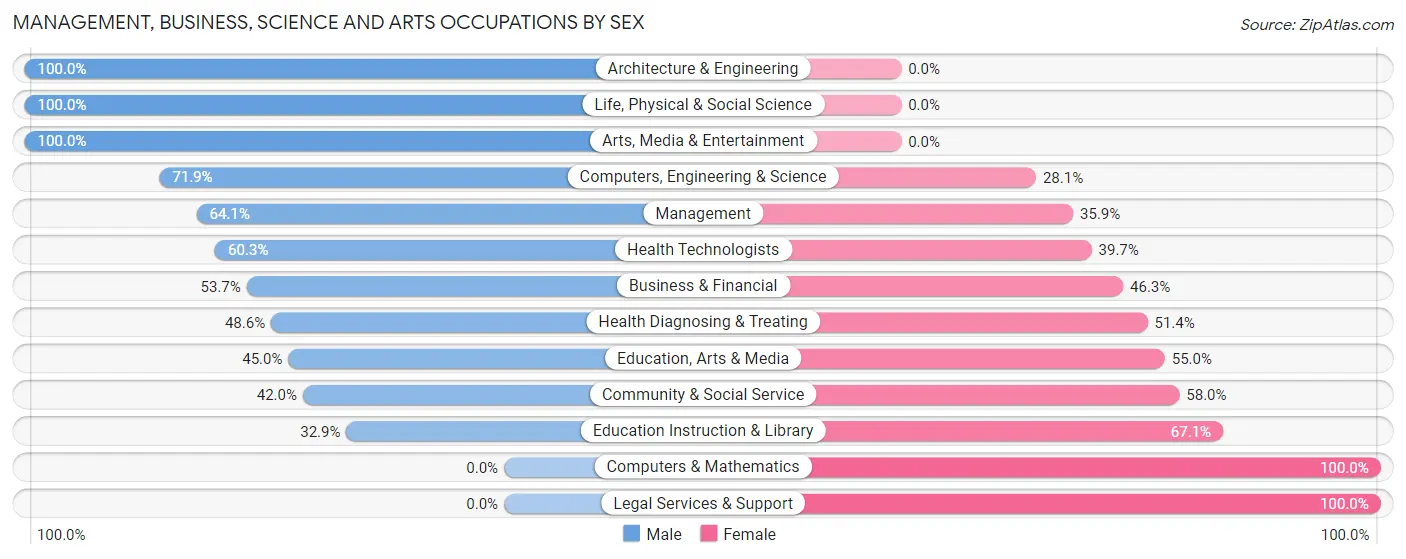
Management, Business, Science and Arts Occupations by Sex
Within the Management, Business, Science and Arts occupations in South Monrovia Island, the most male-oriented occupations are Architecture & Engineering (100.0%), Life, Physical & Social Science (100.0%), and Arts, Media & Entertainment (100.0%), while the most female-oriented occupations are Computers & Mathematics (100.0%), Legal Services & Support (100.0%), and Education Instruction & Library (67.1%).
| Occupation | Male | Female |
| Management | 118 (64.1%) | 66 (35.9%) |
| Business & Financial | 87 (53.7%) | 75 (46.3%) |
| Computers, Engineering & Science | 46 (71.9%) | 18 (28.1%) |
| Computers & Mathematics | 0 (0.0%) | 18 (100.0%) |
| Architecture & Engineering | 16 (100.0%) | 0 (0.0%) |
| Life, Physical & Social Science | 30 (100.0%) | 0 (0.0%) |
| Community & Social Service | 217 (42.0%) | 300 (58.0%) |
| Education, Arts & Media | 18 (45.0%) | 22 (55.0%) |
| Legal Services & Support | 0 (0.0%) | 27 (100.0%) |
| Education Instruction & Library | 123 (32.9%) | 251 (67.1%) |
| Arts, Media & Entertainment | 76 (100.0%) | 0 (0.0%) |
| Health Diagnosing & Treating | 52 (48.6%) | 55 (51.4%) |
| Health Technologists | 44 (60.3%) | 29 (39.7%) |
| Total (Category) | 520 (50.3%) | 514 (49.7%) |
| Total (Overall) | 1,758 (55.2%) | 1,424 (44.8%) |
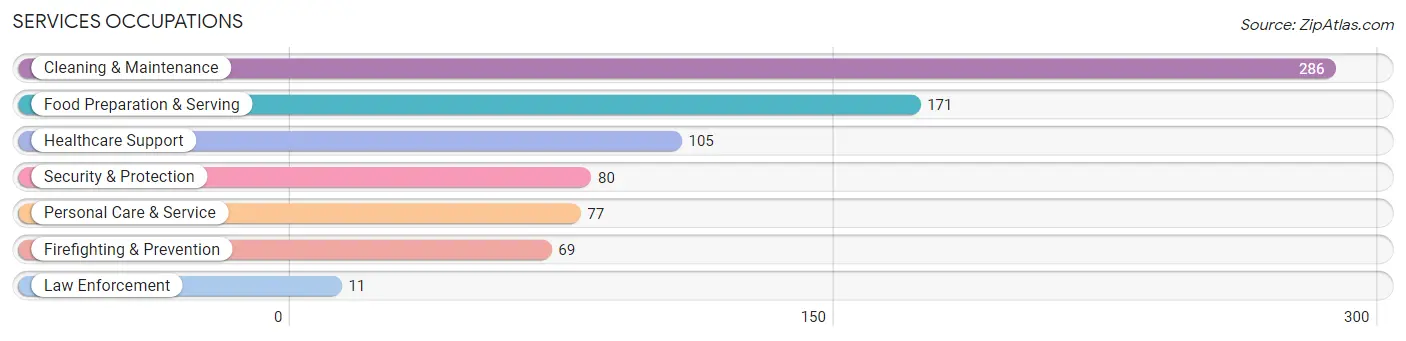
Services Occupations
The most common Services occupations in South Monrovia Island are Cleaning & Maintenance (286 | 9.0%), Food Preparation & Serving (171 | 5.4%), Healthcare Support (105 | 3.3%), Security & Protection (80 | 2.5%), and Personal Care & Service (77 | 2.4%).
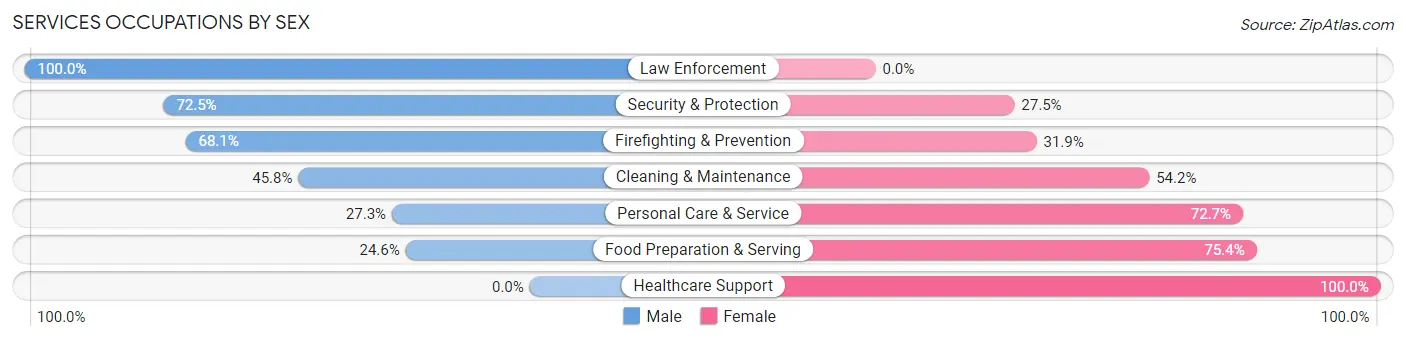
Services Occupations by Sex
Within the Services occupations in South Monrovia Island, the most male-oriented occupations are Law Enforcement (100.0%), Security & Protection (72.5%), and Firefighting & Prevention (68.1%), while the most female-oriented occupations are Healthcare Support (100.0%), Food Preparation & Serving (75.4%), and Personal Care & Service (72.7%).
| Occupation | Male | Female |
| Healthcare Support | 0 (0.0%) | 105 (100.0%) |
| Security & Protection | 58 (72.5%) | 22 (27.5%) |
| Firefighting & Prevention | 47 (68.1%) | 22 (31.9%) |
| Law Enforcement | 11 (100.0%) | 0 (0.0%) |
| Food Preparation & Serving | 42 (24.6%) | 129 (75.4%) |
| Cleaning & Maintenance | 131 (45.8%) | 155 (54.2%) |
| Personal Care & Service | 21 (27.3%) | 56 (72.7%) |
| Total (Category) | 252 (35.0%) | 467 (64.9%) |
| Total (Overall) | 1,758 (55.2%) | 1,424 (44.8%) |
Sales and Office Occupations
The most common Sales and Office occupations in South Monrovia Island are Office & Administration (370 | 11.6%), and Sales & Related (140 | 4.4%).
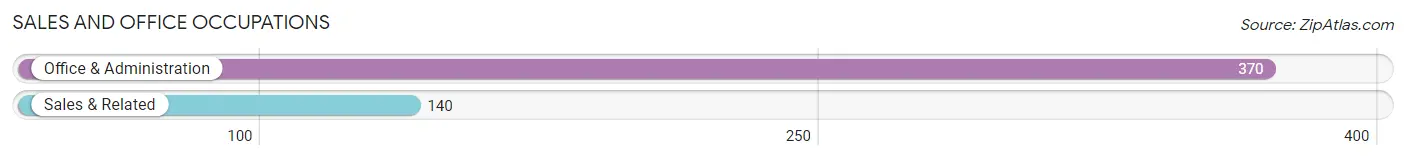
Sales and Office Occupations by Sex
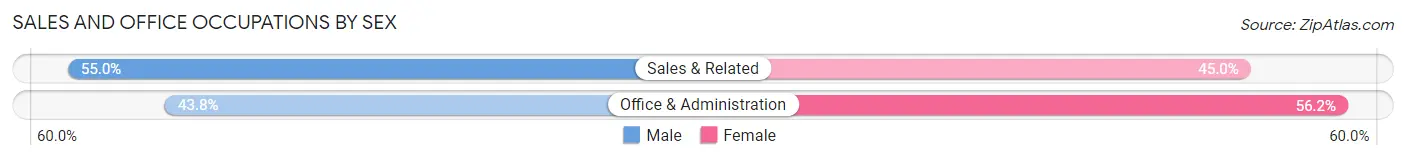
| Occupation | Male | Female |
| Sales & Related | 77 (55.0%) | 63 (45.0%) |
| Office & Administration | 162 (43.8%) | 208 (56.2%) |
| Total (Category) | 239 (46.9%) | 271 (53.1%) |
| Total (Overall) | 1,758 (55.2%) | 1,424 (44.8%) |
Natural Resources, Construction and Maintenance Occupations
The most common Natural Resources, Construction and Maintenance occupations in South Monrovia Island are Construction & Extraction (297 | 9.3%), Installation, Maintenance & Repair (109 | 3.4%), and Farming, Fishing & Forestry (22 | 0.7%).
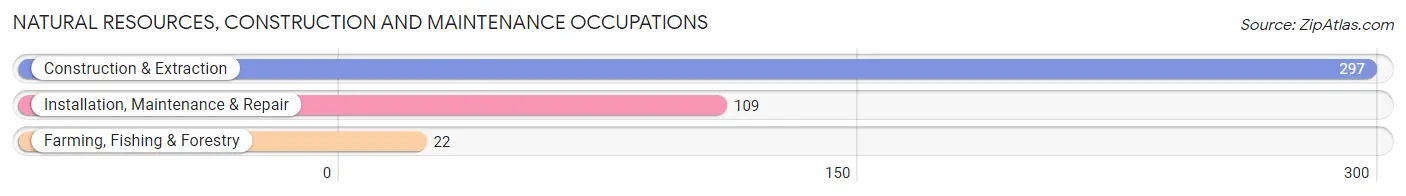
Natural Resources, Construction and Maintenance Occupations by Sex
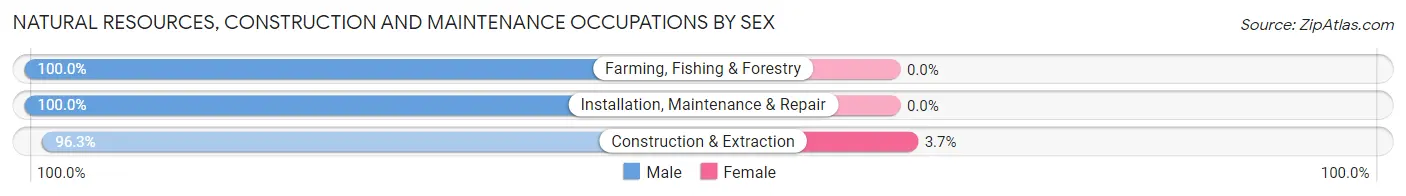
| Occupation | Male | Female |
| Farming, Fishing & Forestry | 22 (100.0%) | 0 (0.0%) |
| Construction & Extraction | 286 (96.3%) | 11 (3.7%) |
| Installation, Maintenance & Repair | 109 (100.0%) | 0 (0.0%) |
| Total (Category) | 417 (97.4%) | 11 (2.6%) |
| Total (Overall) | 1,758 (55.2%) | 1,424 (44.8%) |
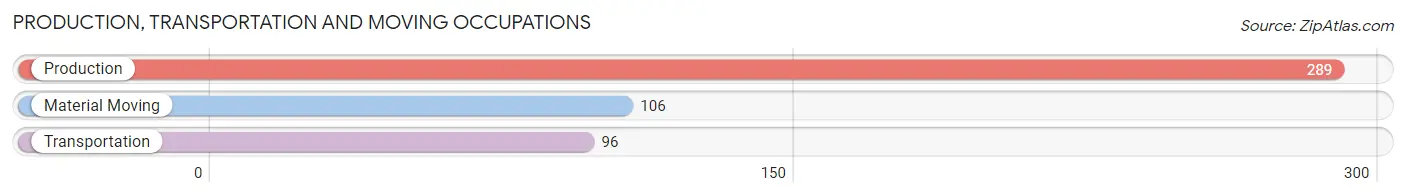
Production, Transportation and Moving Occupations
The most common Production, Transportation and Moving occupations in South Monrovia Island are Production (289 | 9.1%), Material Moving (106 | 3.3%), and Transportation (96 | 3.0%).
Production, Transportation and Moving Occupations by Sex
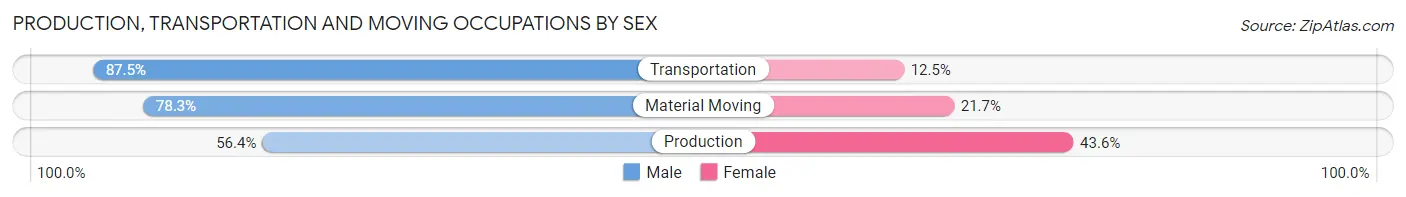
| Occupation | Male | Female |
| Production | 163 (56.4%) | 126 (43.6%) |
| Transportation | 84 (87.5%) | 12 (12.5%) |
| Material Moving | 83 (78.3%) | 23 (21.7%) |
| Total (Category) | 330 (67.2%) | 161 (32.8%) |
| Total (Overall) | 1,758 (55.2%) | 1,424 (44.8%) |
Employment Industries by Sex in South Monrovia Island
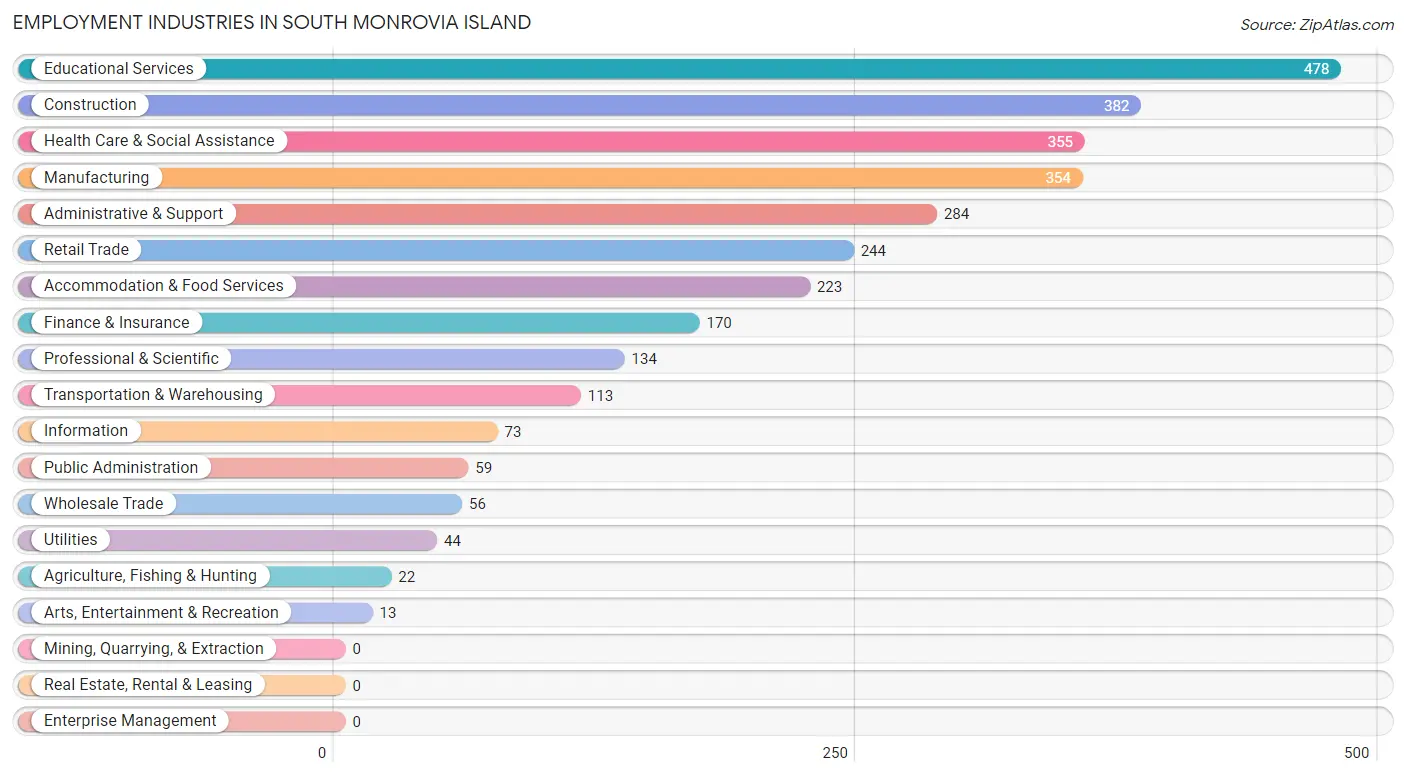
Employment Industries in South Monrovia Island
The major employment industries in South Monrovia Island include Educational Services (478 | 15.0%), Construction (382 | 12.0%), Health Care & Social Assistance (355 | 11.2%), Manufacturing (354 | 11.1%), and Administrative & Support (284 | 8.9%).
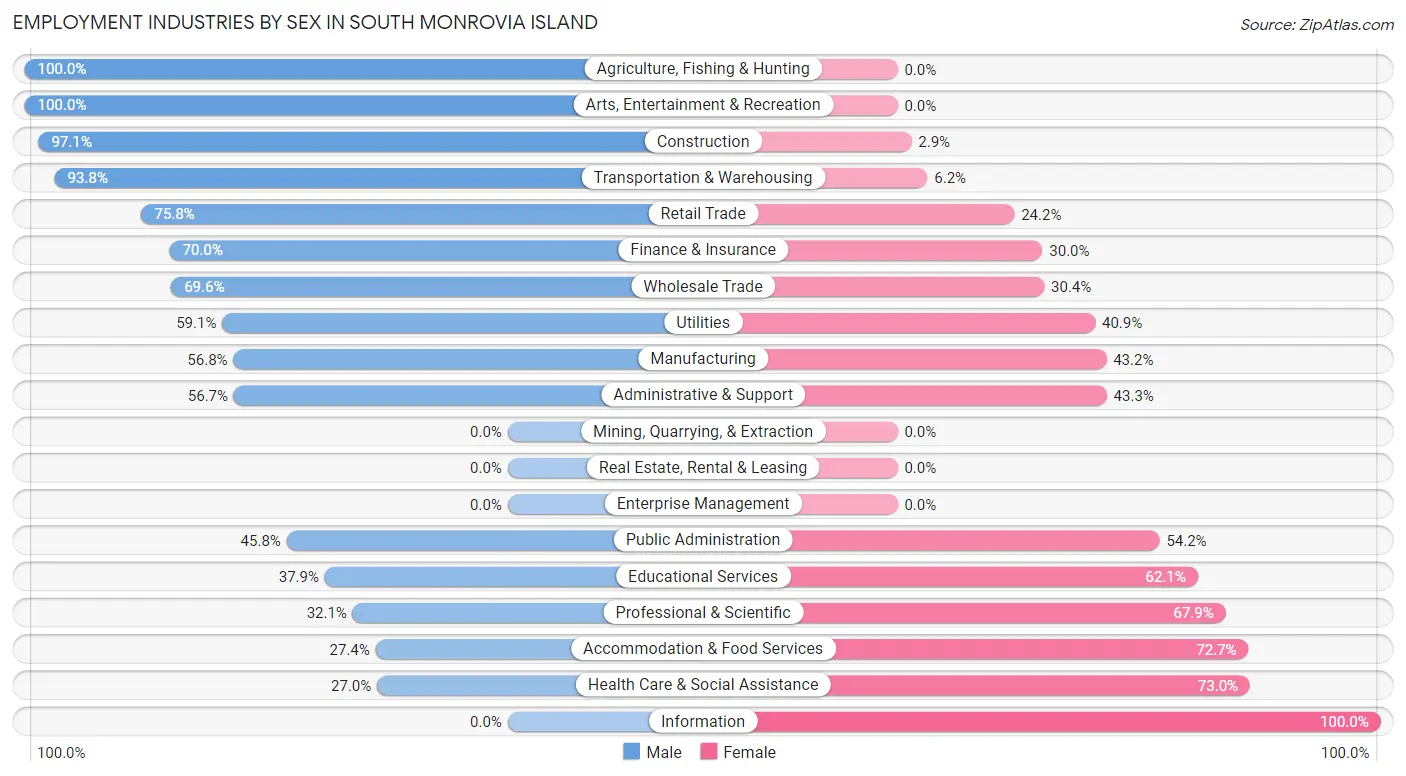
Employment Industries by Sex in South Monrovia Island
The South Monrovia Island industries that see more men than women are Agriculture, Fishing & Hunting (100.0%), Arts, Entertainment & Recreation (100.0%), and Construction (97.1%), whereas the industries that tend to have a higher number of women are Information (100.0%), Health Care & Social Assistance (73.0%), and Accommodation & Food Services (72.7%).
| Industry | Male | Female |
| Agriculture, Fishing & Hunting | 22 (100.0%) | 0 (0.0%) |
| Mining, Quarrying, & Extraction | 0 (0.0%) | 0 (0.0%) |
| Construction | 371 (97.1%) | 11 (2.9%) |
| Manufacturing | 201 (56.8%) | 153 (43.2%) |
| Wholesale Trade | 39 (69.6%) | 17 (30.4%) |
| Retail Trade | 185 (75.8%) | 59 (24.2%) |
| Transportation & Warehousing | 106 (93.8%) | 7 (6.2%) |
| Utilities | 26 (59.1%) | 18 (40.9%) |
| Information | 0 (0.0%) | 73 (100.0%) |
| Finance & Insurance | 119 (70.0%) | 51 (30.0%) |
| Real Estate, Rental & Leasing | 0 (0.0%) | 0 (0.0%) |
| Professional & Scientific | 43 (32.1%) | 91 (67.9%) |
| Enterprise Management | 0 (0.0%) | 0 (0.0%) |
| Administrative & Support | 161 (56.7%) | 123 (43.3%) |
| Educational Services | 181 (37.9%) | 297 (62.1%) |
| Health Care & Social Assistance | 96 (27.0%) | 259 (73.0%) |
| Arts, Entertainment & Recreation | 13 (100.0%) | 0 (0.0%) |
| Accommodation & Food Services | 61 (27.4%) | 162 (72.7%) |
| Public Administration | 27 (45.8%) | 32 (54.2%) |
| Total | 1,758 (55.2%) | 1,424 (44.8%) |
Education in South Monrovia Island
School Enrollment in South Monrovia Island
The most common levels of schooling among the 1,945 students in South Monrovia Island are high school (529 | 27.2%), middle school (462 | 23.7%), and college / undergraduate (361 | 18.6%).
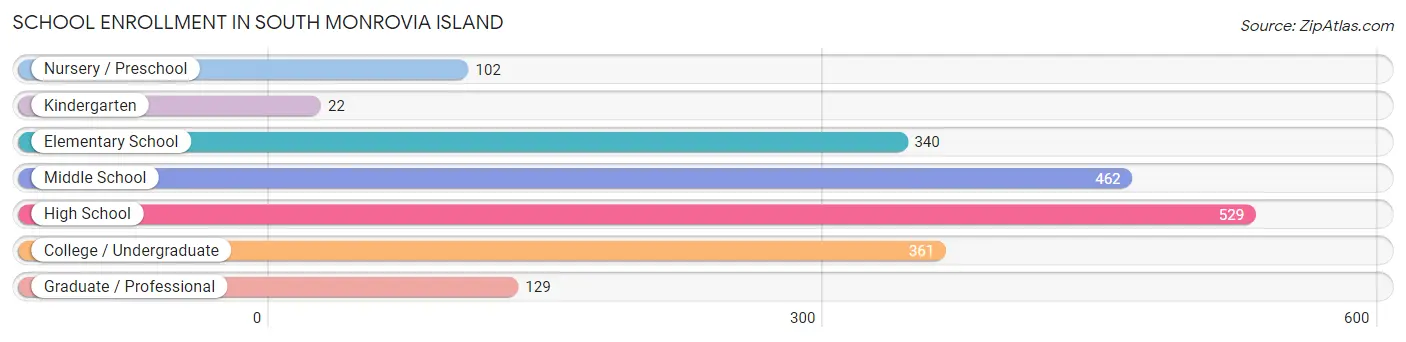
| School Level | # Students | % Students |
| Nursery / Preschool | 102 | 5.2% |
| Kindergarten | 22 | 1.1% |
| Elementary School | 340 | 17.5% |
| Middle School | 462 | 23.7% |
| High School | 529 | 27.2% |
| College / Undergraduate | 361 | 18.6% |
| Graduate / Professional | 129 | 6.6% |
| Total | 1,945 | 100.0% |
School Enrollment by Age by Funding Source in South Monrovia Island
Out of a total of 1,945 students who are enrolled in schools in South Monrovia Island, 210 (10.8%) attend a private institution, while the remaining 1,735 (89.2%) are enrolled in public schools. The age group of 20 to 24 year olds has the highest likelihood of being enrolled in private schools, with 58 (32.2% in the age bracket) enrolled. Conversely, the age group of 3 to 4 year olds has the lowest likelihood of being enrolled in a private school, with 81 (100.0% in the age bracket) attending a public institution.
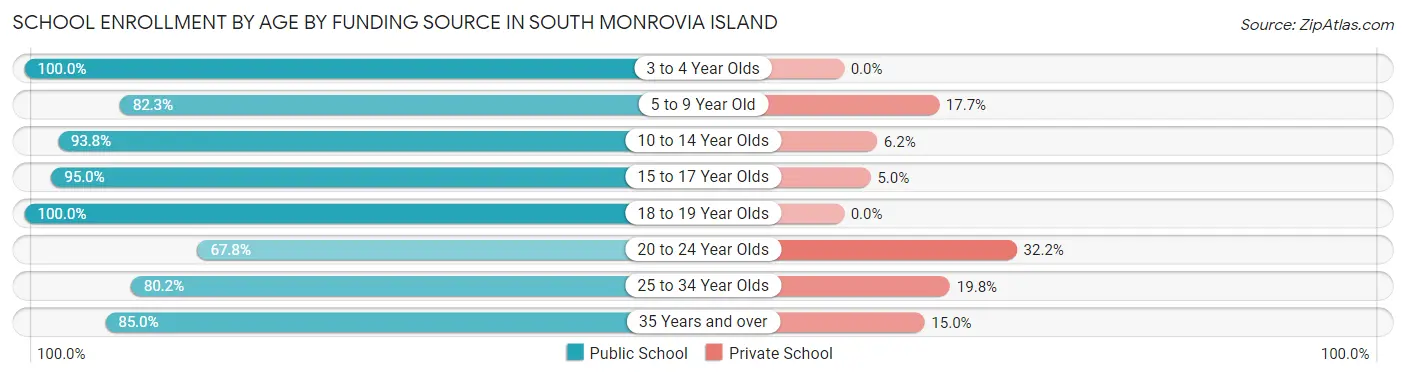
| Age Bracket | Public School | Private School |
| 3 to 4 Year Olds | 81 (100.0%) | 0 (0.0%) |
| 5 to 9 Year Old | 255 (82.3%) | 55 (17.7%) |
| 10 to 14 Year Olds | 591 (93.8%) | 39 (6.2%) |
| 15 to 17 Year Olds | 362 (95.0%) | 19 (5.0%) |
| 18 to 19 Year Olds | 134 (100.0%) | 0 (0.0%) |
| 20 to 24 Year Olds | 122 (67.8%) | 58 (32.2%) |
| 25 to 34 Year Olds | 77 (80.2%) | 19 (19.8%) |
| 35 Years and over | 113 (85.0%) | 20 (15.0%) |
| Total | 1,735 (89.2%) | 210 (10.8%) |
Educational Attainment by Field of Study in South Monrovia Island
Business (500 | 37.7%), arts & humanities (156 | 11.7%), science & technology (148 | 11.1%), social sciences (103 | 7.8%), and literature & languages (80 | 6.0%) are the most common fields of study among 1,328 individuals in South Monrovia Island who have obtained a bachelor's degree or higher.
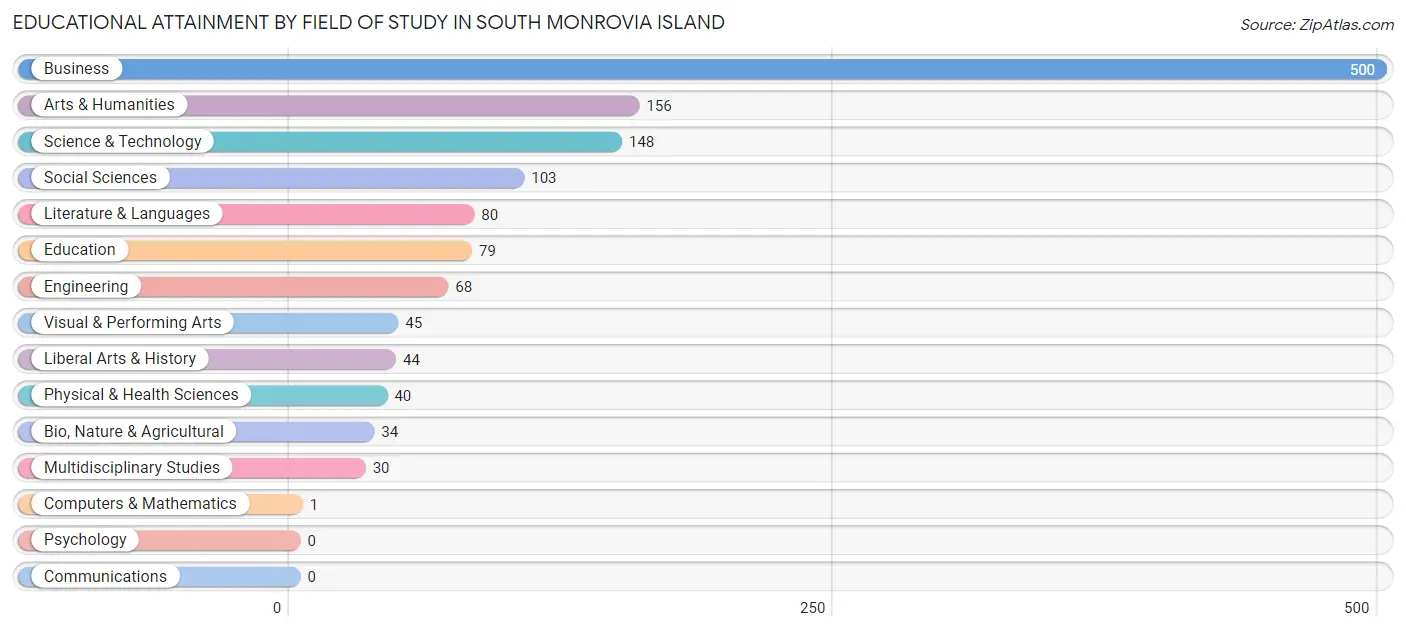
| Field of Study | # Graduates | % Graduates |
| Computers & Mathematics | 1 | 0.1% |
| Bio, Nature & Agricultural | 34 | 2.6% |
| Physical & Health Sciences | 40 | 3.0% |
| Psychology | 0 | 0.0% |
| Social Sciences | 103 | 7.8% |
| Engineering | 68 | 5.1% |
| Multidisciplinary Studies | 30 | 2.3% |
| Science & Technology | 148 | 11.1% |
| Business | 500 | 37.7% |
| Education | 79 | 5.9% |
| Literature & Languages | 80 | 6.0% |
| Liberal Arts & History | 44 | 3.3% |
| Visual & Performing Arts | 45 | 3.4% |
| Communications | 0 | 0.0% |
| Arts & Humanities | 156 | 11.7% |
| Total | 1,328 | 100.0% |
Transportation & Commute in South Monrovia Island
Vehicle Availability by Sex in South Monrovia Island
The most prevalent vehicle ownership categories in South Monrovia Island are males with 2 vehicles (564, accounting for 32.7%) and females with 2 vehicles (588, making up 39.6%).
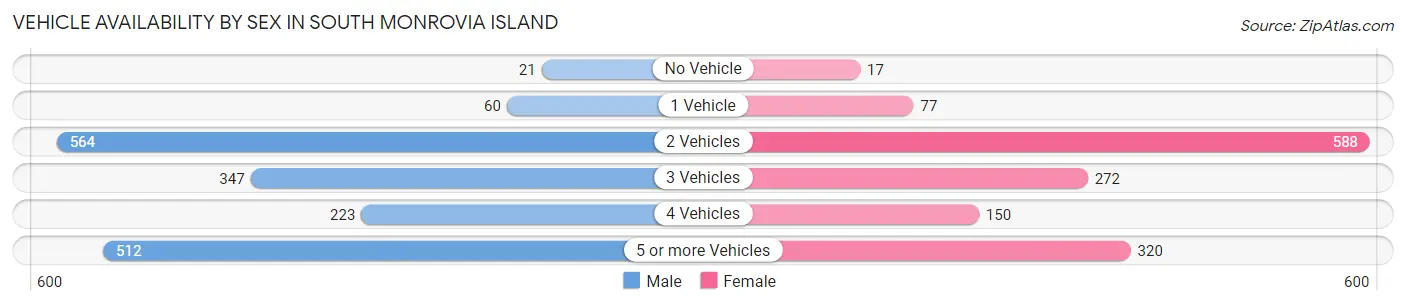
| Vehicles Available | Male | Female |
| No Vehicle | 21 (1.2%) | 17 (1.2%) |
| 1 Vehicle | 60 (3.5%) | 77 (5.4%) |
| 2 Vehicles | 564 (32.7%) | 588 (41.3%) |
| 3 Vehicles | 347 (20.1%) | 272 (19.1%) |
| 4 Vehicles | 223 (12.9%) | 150 (10.5%) |
| 5 or more Vehicles | 512 (29.6%) | 320 (22.5%) |
| Total | 1,727 (100.0%) | 1,424 (100.0%) |
Commute Time in South Monrovia Island
The most frequently occuring commute durations in South Monrovia Island are 30 to 34 minutes (806 commuters, 26.8%), 15 to 19 minutes (490 commuters, 16.3%), and 20 to 24 minutes (334 commuters, 11.1%).
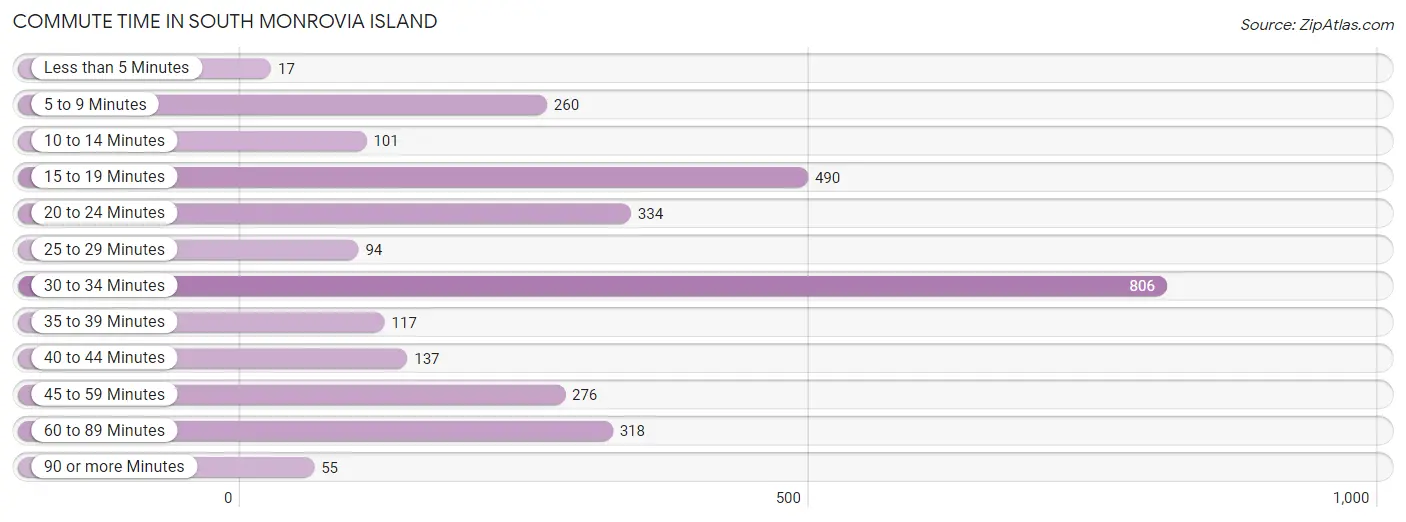
| Commute Time | # Commuters | % Commuters |
| Less than 5 Minutes | 17 | 0.6% |
| 5 to 9 Minutes | 260 | 8.6% |
| 10 to 14 Minutes | 101 | 3.4% |
| 15 to 19 Minutes | 490 | 16.3% |
| 20 to 24 Minutes | 334 | 11.1% |
| 25 to 29 Minutes | 94 | 3.1% |
| 30 to 34 Minutes | 806 | 26.8% |
| 35 to 39 Minutes | 117 | 3.9% |
| 40 to 44 Minutes | 137 | 4.6% |
| 45 to 59 Minutes | 276 | 9.2% |
| 60 to 89 Minutes | 318 | 10.6% |
| 90 or more Minutes | 55 | 1.8% |
Commute Time by Sex in South Monrovia Island
The most common commute times in South Monrovia Island are 30 to 34 minutes (510 commuters, 31.1%) for males and 30 to 34 minutes (296 commuters, 21.6%) for females.
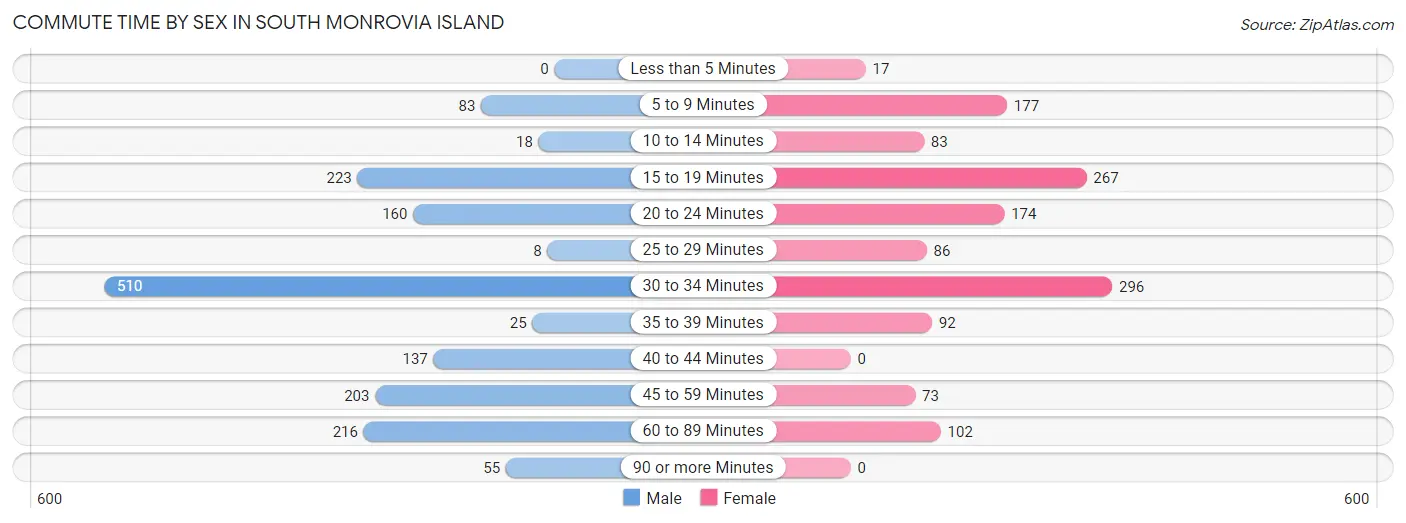
| Commute Time | Male | Female |
| Less than 5 Minutes | 0 (0.0%) | 17 (1.2%) |
| 5 to 9 Minutes | 83 (5.1%) | 177 (13.0%) |
| 10 to 14 Minutes | 18 (1.1%) | 83 (6.1%) |
| 15 to 19 Minutes | 223 (13.6%) | 267 (19.5%) |
| 20 to 24 Minutes | 160 (9.8%) | 174 (12.7%) |
| 25 to 29 Minutes | 8 (0.5%) | 86 (6.3%) |
| 30 to 34 Minutes | 510 (31.1%) | 296 (21.6%) |
| 35 to 39 Minutes | 25 (1.5%) | 92 (6.7%) |
| 40 to 44 Minutes | 137 (8.4%) | 0 (0.0%) |
| 45 to 59 Minutes | 203 (12.4%) | 73 (5.3%) |
| 60 to 89 Minutes | 216 (13.2%) | 102 (7.5%) |
| 90 or more Minutes | 55 (3.4%) | 0 (0.0%) |
Time of Departure to Work by Sex in South Monrovia Island
The most frequent times of departure to work in South Monrovia Island are 12:00 AM to 4:59 AM (224, 13.7%) for males and 8:00 AM to 8:29 AM (339, 24.8%) for females.
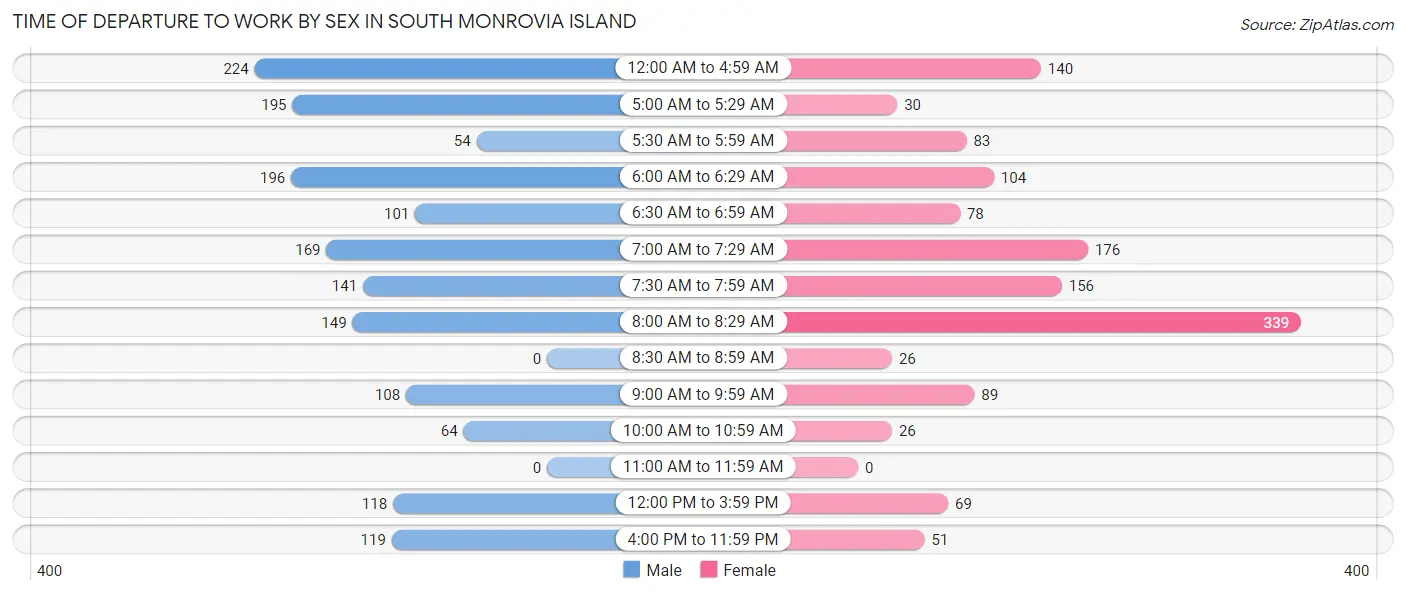
| Time of Departure | Male | Female |
| 12:00 AM to 4:59 AM | 224 (13.7%) | 140 (10.2%) |
| 5:00 AM to 5:29 AM | 195 (11.9%) | 30 (2.2%) |
| 5:30 AM to 5:59 AM | 54 (3.3%) | 83 (6.1%) |
| 6:00 AM to 6:29 AM | 196 (12.0%) | 104 (7.6%) |
| 6:30 AM to 6:59 AM | 101 (6.2%) | 78 (5.7%) |
| 7:00 AM to 7:29 AM | 169 (10.3%) | 176 (12.9%) |
| 7:30 AM to 7:59 AM | 141 (8.6%) | 156 (11.4%) |
| 8:00 AM to 8:29 AM | 149 (9.1%) | 339 (24.8%) |
| 8:30 AM to 8:59 AM | 0 (0.0%) | 26 (1.9%) |
| 9:00 AM to 9:59 AM | 108 (6.6%) | 89 (6.5%) |
| 10:00 AM to 10:59 AM | 64 (3.9%) | 26 (1.9%) |
| 11:00 AM to 11:59 AM | 0 (0.0%) | 0 (0.0%) |
| 12:00 PM to 3:59 PM | 118 (7.2%) | 69 (5.1%) |
| 4:00 PM to 11:59 PM | 119 (7.3%) | 51 (3.7%) |
| Total | 1,638 (100.0%) | 1,367 (100.0%) |
Housing Occupancy in South Monrovia Island
Occupancy by Ownership in South Monrovia Island
Of the total 1,686 dwellings in South Monrovia Island, owner-occupied units account for 1,059 (62.8%), while renter-occupied units make up 627 (37.2%).
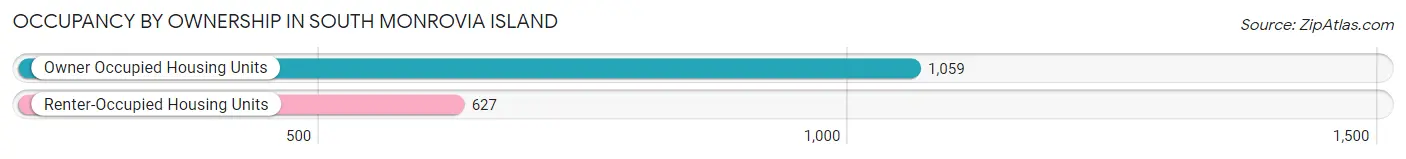
| Occupancy | # Housing Units | % Housing Units |
| Owner Occupied Housing Units | 1,059 | 62.8% |
| Renter-Occupied Housing Units | 627 | 37.2% |
| Total Occupied Housing Units | 1,686 | 100.0% |
Occupancy by Household Size in South Monrovia Island
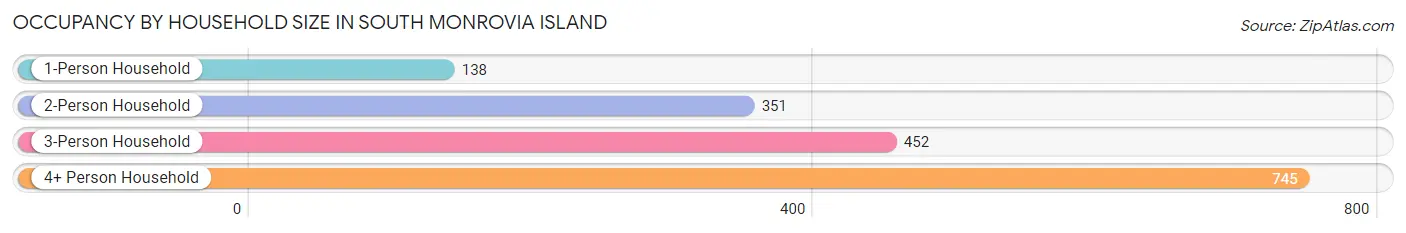
| Household Size | # Housing Units | % Housing Units |
| 1-Person Household | 138 | 8.2% |
| 2-Person Household | 351 | 20.8% |
| 3-Person Household | 452 | 26.8% |
| 4+ Person Household | 745 | 44.2% |
| Total Housing Units | 1,686 | 100.0% |
Occupancy by Ownership by Household Size in South Monrovia Island
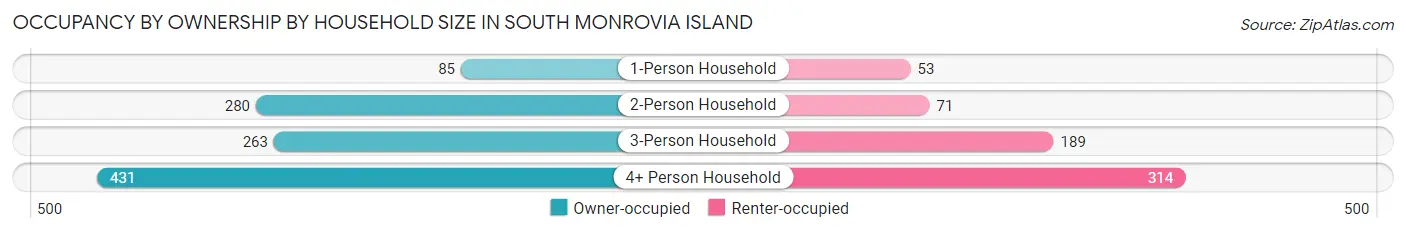
| Household Size | Owner-occupied | Renter-occupied |
| 1-Person Household | 85 (61.6%) | 53 (38.4%) |
| 2-Person Household | 280 (79.8%) | 71 (20.2%) |
| 3-Person Household | 263 (58.2%) | 189 (41.8%) |
| 4+ Person Household | 431 (57.9%) | 314 (42.1%) |
| Total Housing Units | 1,059 (62.8%) | 627 (37.2%) |
Occupancy by Educational Attainment in South Monrovia Island
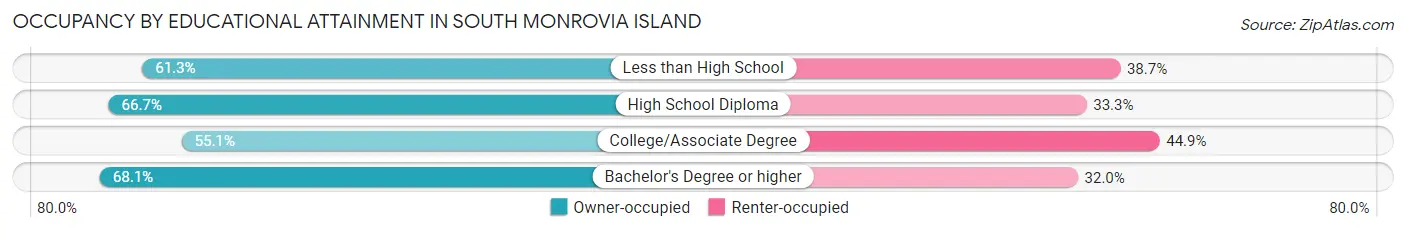
| Household Size | Owner-occupied | Renter-occupied |
| Less than High School | 268 (61.3%) | 169 (38.7%) |
| High School Diploma | 144 (66.7%) | 72 (33.3%) |
| College/Associate Degree | 238 (55.1%) | 194 (44.9%) |
| Bachelor's Degree or higher | 409 (68.0%) | 192 (32.0%) |
Occupancy by Age of Householder in South Monrovia Island
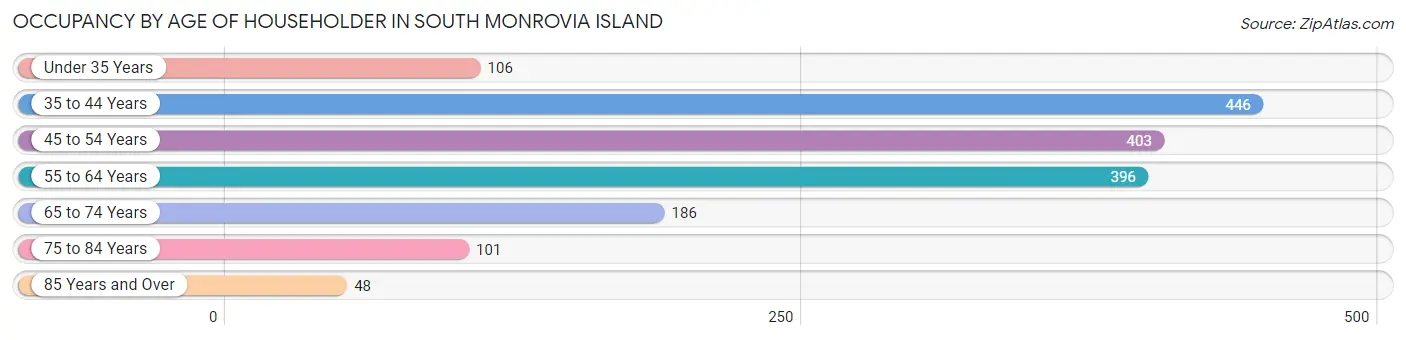
| Age Bracket | # Households | % Households |
| Under 35 Years | 106 | 6.3% |
| 35 to 44 Years | 446 | 26.5% |
| 45 to 54 Years | 403 | 23.9% |
| 55 to 64 Years | 396 | 23.5% |
| 65 to 74 Years | 186 | 11.0% |
| 75 to 84 Years | 101 | 6.0% |
| 85 Years and Over | 48 | 2.9% |
| Total | 1,686 | 100.0% |
Housing Finances in South Monrovia Island
Median Income by Occupancy in South Monrovia Island
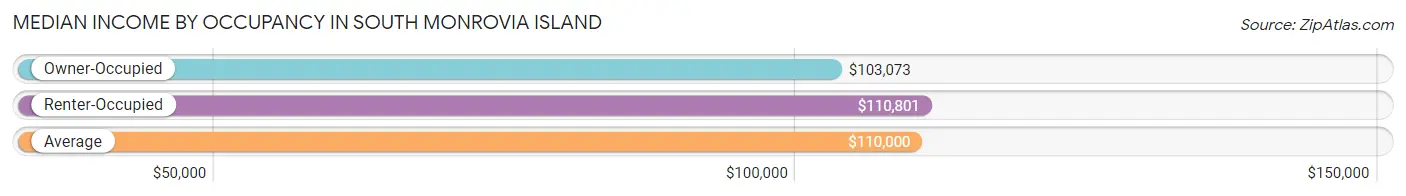
| Occupancy Type | # Households | Median Income |
| Owner-Occupied | 1,059 (62.8%) | $103,073 |
| Renter-Occupied | 627 (37.2%) | $110,801 |
| Average | 1,686 (100.0%) | $110,000 |
Occupancy by Householder Income Bracket in South Monrovia Island
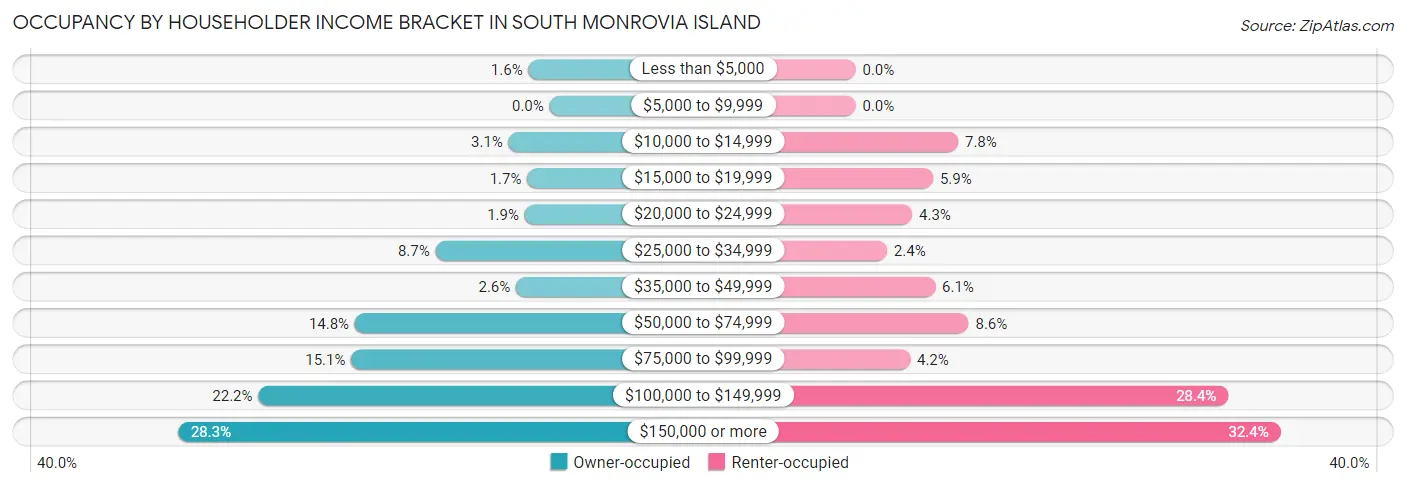
| Income Bracket | Owner-occupied | Renter-occupied |
| Less than $5,000 | 17 (1.6%) | 0 (0.0%) |
| $5,000 to $9,999 | 0 (0.0%) | 0 (0.0%) |
| $10,000 to $14,999 | 33 (3.1%) | 49 (7.8%) |
| $15,000 to $19,999 | 18 (1.7%) | 37 (5.9%) |
| $20,000 to $24,999 | 20 (1.9%) | 27 (4.3%) |
| $25,000 to $34,999 | 92 (8.7%) | 15 (2.4%) |
| $35,000 to $49,999 | 27 (2.5%) | 38 (6.1%) |
| $50,000 to $74,999 | 157 (14.8%) | 54 (8.6%) |
| $75,000 to $99,999 | 160 (15.1%) | 26 (4.2%) |
| $100,000 to $149,999 | 235 (22.2%) | 178 (28.4%) |
| $150,000 or more | 300 (28.3%) | 203 (32.4%) |
| Total | 1,059 (100.0%) | 627 (100.0%) |
Monthly Housing Cost Tiers in South Monrovia Island
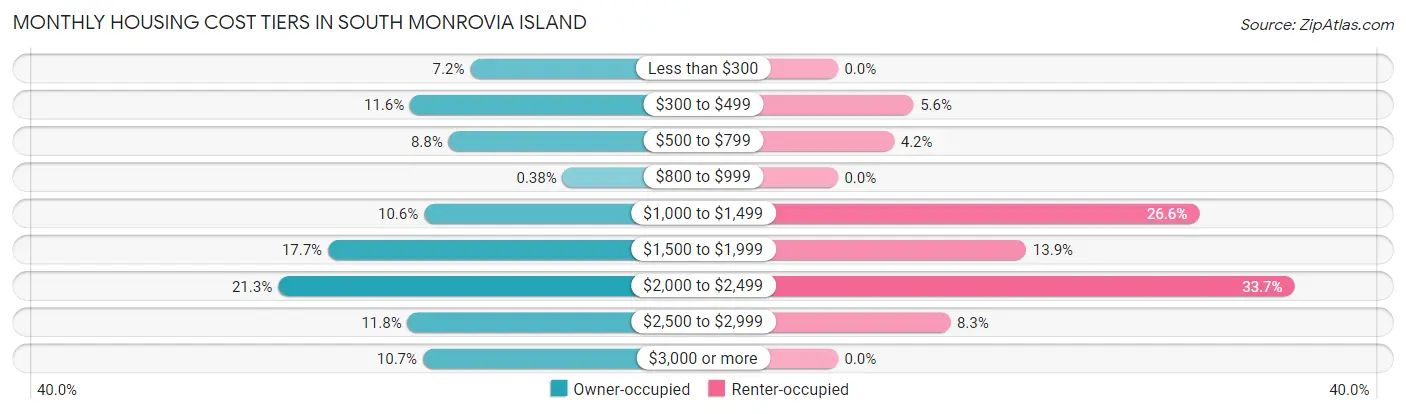
| Monthly Cost | Owner-occupied | Renter-occupied |
| Less than $300 | 76 (7.2%) | 0 (0.0%) |
| $300 to $499 | 123 (11.6%) | 35 (5.6%) |
| $500 to $799 | 93 (8.8%) | 26 (4.2%) |
| $800 to $999 | 4 (0.4%) | 0 (0.0%) |
| $1,000 to $1,499 | 112 (10.6%) | 167 (26.6%) |
| $1,500 to $1,999 | 187 (17.7%) | 87 (13.9%) |
| $2,000 to $2,499 | 226 (21.3%) | 211 (33.7%) |
| $2,500 to $2,999 | 125 (11.8%) | 52 (8.3%) |
| $3,000 or more | 113 (10.7%) | 0 (0.0%) |
| Total | 1,059 (100.0%) | 627 (100.0%) |
Physical Housing Characteristics in South Monrovia Island
Housing Structures in South Monrovia Island
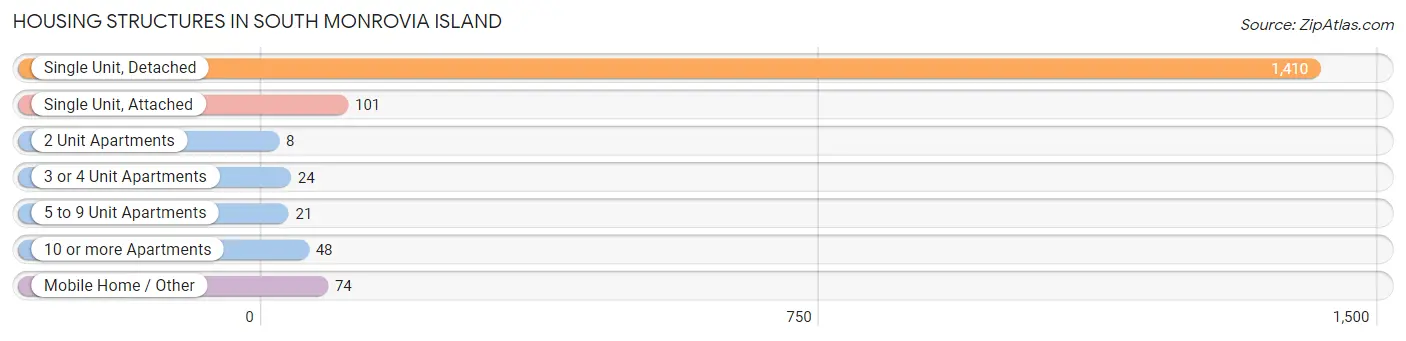
| Structure Type | # Housing Units | % Housing Units |
| Single Unit, Detached | 1,410 | 83.6% |
| Single Unit, Attached | 101 | 6.0% |
| 2 Unit Apartments | 8 | 0.5% |
| 3 or 4 Unit Apartments | 24 | 1.4% |
| 5 to 9 Unit Apartments | 21 | 1.3% |
| 10 or more Apartments | 48 | 2.9% |
| Mobile Home / Other | 74 | 4.4% |
| Total | 1,686 | 100.0% |
Housing Structures by Occupancy in South Monrovia Island
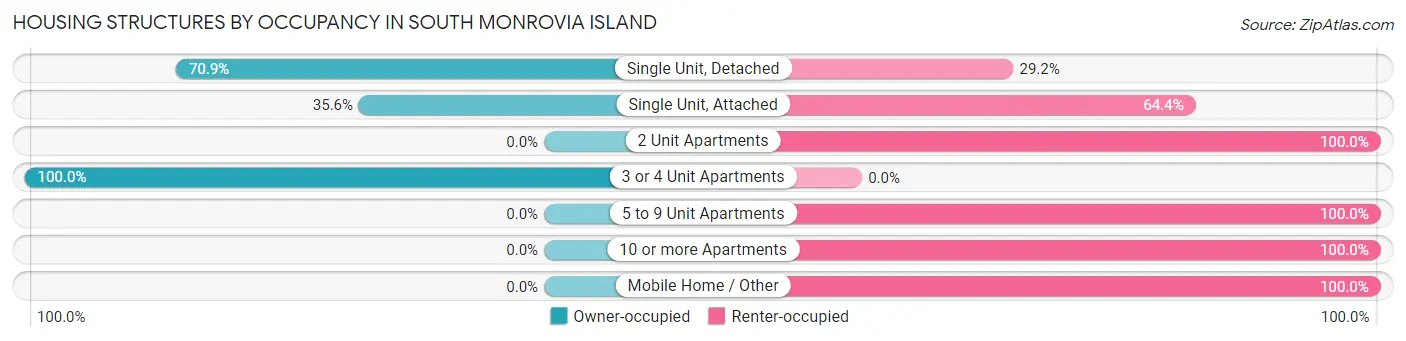
| Structure Type | Owner-occupied | Renter-occupied |
| Single Unit, Detached | 999 (70.9%) | 411 (29.1%) |
| Single Unit, Attached | 36 (35.6%) | 65 (64.4%) |
| 2 Unit Apartments | 0 (0.0%) | 8 (100.0%) |
| 3 or 4 Unit Apartments | 24 (100.0%) | 0 (0.0%) |
| 5 to 9 Unit Apartments | 0 (0.0%) | 21 (100.0%) |
| 10 or more Apartments | 0 (0.0%) | 48 (100.0%) |
| Mobile Home / Other | 0 (0.0%) | 74 (100.0%) |
| Total | 1,059 (62.8%) | 627 (37.2%) |
Housing Structures by Number of Rooms in South Monrovia Island
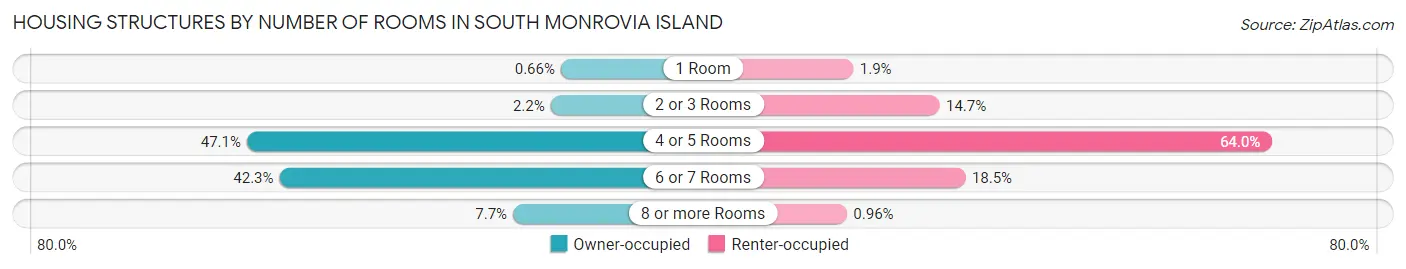
| Number of Rooms | Owner-occupied | Renter-occupied |
| 1 Room | 7 (0.7%) | 12 (1.9%) |
| 2 or 3 Rooms | 23 (2.2%) | 92 (14.7%) |
| 4 or 5 Rooms | 499 (47.1%) | 401 (64.0%) |
| 6 or 7 Rooms | 448 (42.3%) | 116 (18.5%) |
| 8 or more Rooms | 82 (7.7%) | 6 (1.0%) |
| Total | 1,059 (100.0%) | 627 (100.0%) |
Housing Structure by Heating Type in South Monrovia Island
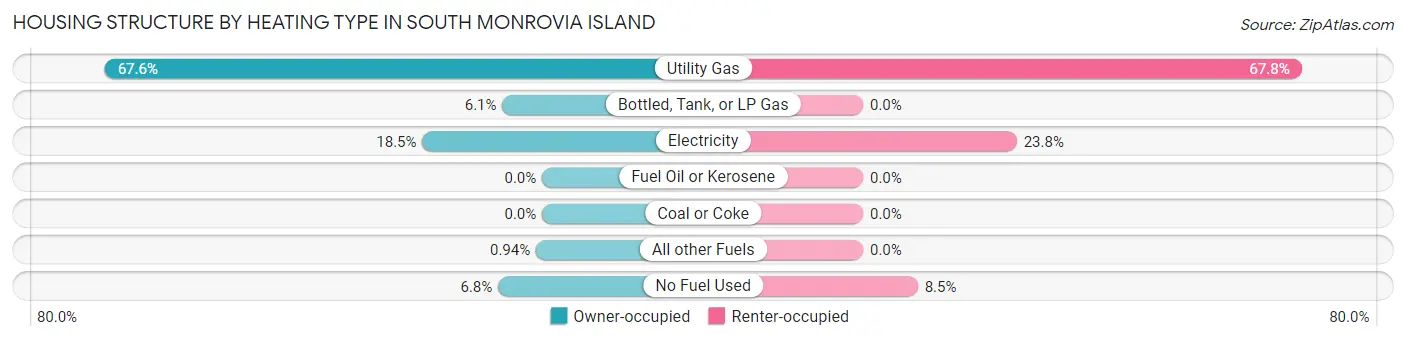
| Heating Type | Owner-occupied | Renter-occupied |
| Utility Gas | 716 (67.6%) | 425 (67.8%) |
| Bottled, Tank, or LP Gas | 65 (6.1%) | 0 (0.0%) |
| Electricity | 196 (18.5%) | 149 (23.8%) |
| Fuel Oil or Kerosene | 0 (0.0%) | 0 (0.0%) |
| Coal or Coke | 0 (0.0%) | 0 (0.0%) |
| All other Fuels | 10 (0.9%) | 0 (0.0%) |
| No Fuel Used | 72 (6.8%) | 53 (8.5%) |
| Total | 1,059 (100.0%) | 627 (100.0%) |
Household Vehicle Usage in South Monrovia Island
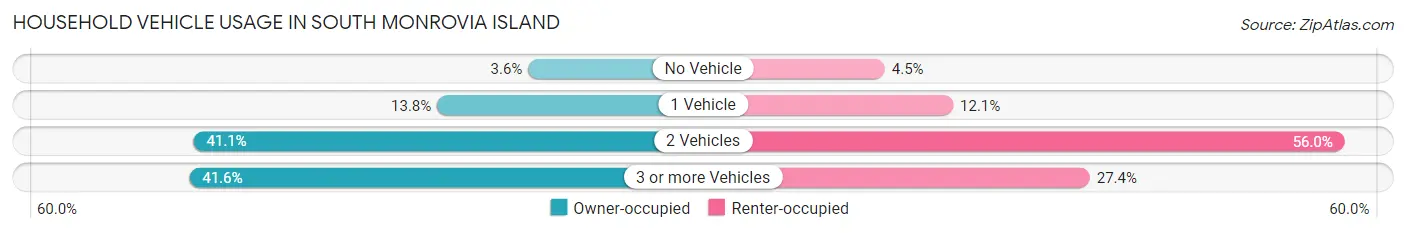
| Vehicles per Household | Owner-occupied | Renter-occupied |
| No Vehicle | 38 (3.6%) | 28 (4.5%) |
| 1 Vehicle | 146 (13.8%) | 76 (12.1%) |
| 2 Vehicles | 435 (41.1%) | 351 (56.0%) |
| 3 or more Vehicles | 440 (41.5%) | 172 (27.4%) |
| Total | 1,059 (100.0%) | 627 (100.0%) |
Real Estate & Mortgages in South Monrovia Island
Real Estate and Mortgage Overview in South Monrovia Island
| Characteristic | Without Mortgage | With Mortgage |
| Housing Units | 331 | 728 |
| Median Property Value | $648,000 | $635,900 |
| Median Household Income | $65,893 | $300 |
| Monthly Housing Costs | $444 | $113 |
| Real Estate Taxes | $2,401 | $42 |
Property Value by Mortgage Status in South Monrovia Island
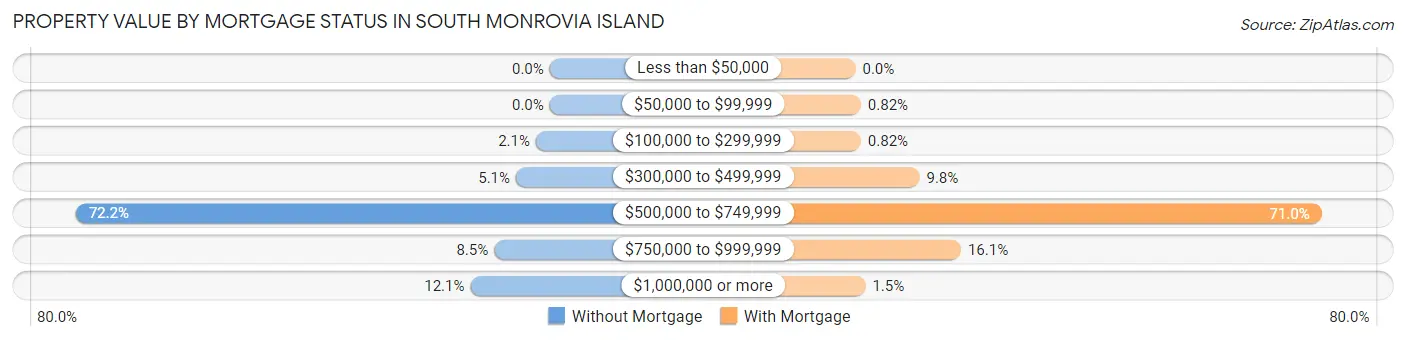
| Property Value | Without Mortgage | With Mortgage |
| Less than $50,000 | 0 (0.0%) | 0 (0.0%) |
| $50,000 to $99,999 | 0 (0.0%) | 6 (0.8%) |
| $100,000 to $299,999 | 7 (2.1%) | 6 (0.8%) |
| $300,000 to $499,999 | 17 (5.1%) | 71 (9.8%) |
| $500,000 to $749,999 | 239 (72.2%) | 517 (71.0%) |
| $750,000 to $999,999 | 28 (8.5%) | 117 (16.1%) |
| $1,000,000 or more | 40 (12.1%) | 11 (1.5%) |
| Total | 331 (100.0%) | 728 (100.0%) |
Household Income by Mortgage Status in South Monrovia Island
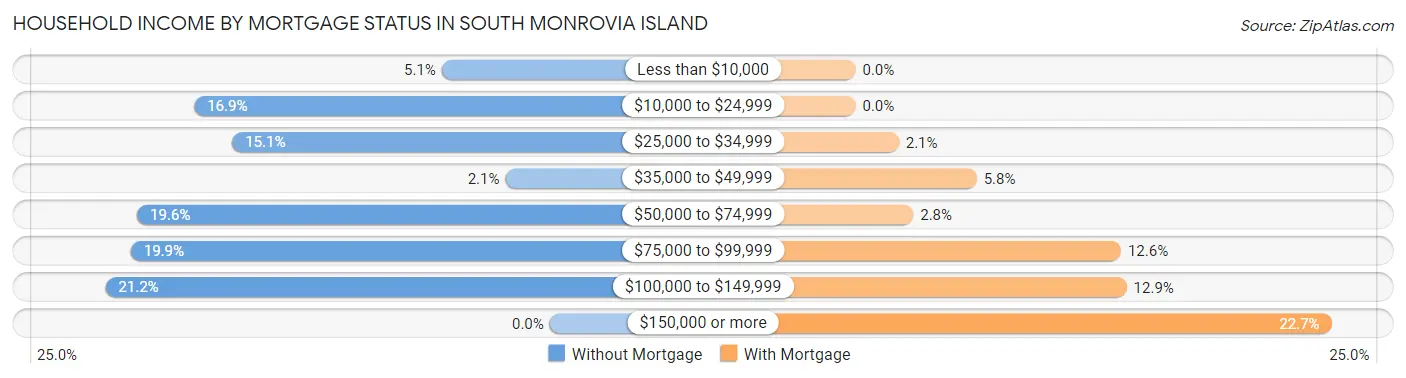
| Household Income | Without Mortgage | With Mortgage |
| Less than $10,000 | 17 (5.1%) | 0 (0.0%) |
| $10,000 to $24,999 | 56 (16.9%) | 0 (0.0%) |
| $25,000 to $34,999 | 50 (15.1%) | 15 (2.1%) |
| $35,000 to $49,999 | 7 (2.1%) | 42 (5.8%) |
| $50,000 to $74,999 | 65 (19.6%) | 20 (2.8%) |
| $75,000 to $99,999 | 66 (19.9%) | 92 (12.6%) |
| $100,000 to $149,999 | 70 (21.1%) | 94 (12.9%) |
| $150,000 or more | 0 (0.0%) | 165 (22.7%) |
| Total | 331 (100.0%) | 728 (100.0%) |
Property Value to Household Income Ratio in South Monrovia Island
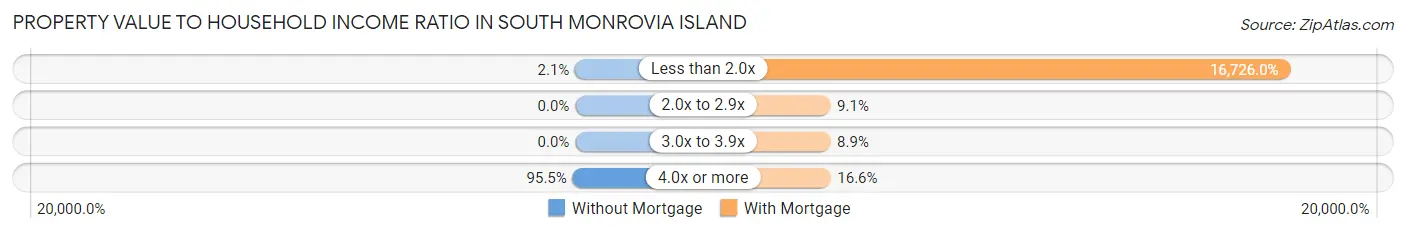
| Value-to-Income Ratio | Without Mortgage | With Mortgage |
| Less than 2.0x | 7 (2.1%) | 121,765 (16,726.0%) |
| 2.0x to 2.9x | 0 (0.0%) | 66 (9.1%) |
| 3.0x to 3.9x | 0 (0.0%) | 65 (8.9%) |
| 4.0x or more | 316 (95.5%) | 121 (16.6%) |
| Total | 331 (100.0%) | 728 (100.0%) |
Real Estate Taxes by Mortgage Status in South Monrovia Island
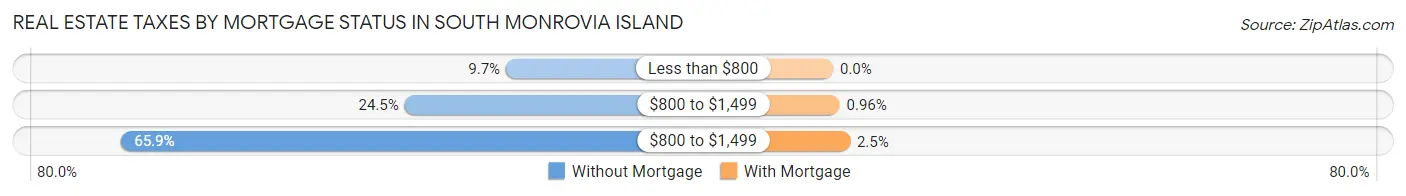
| Property Taxes | Without Mortgage | With Mortgage |
| Less than $800 | 32 (9.7%) | 0 (0.0%) |
| $800 to $1,499 | 81 (24.5%) | 7 (1.0%) |
| $800 to $1,499 | 218 (65.9%) | 18 (2.5%) |
| Total | 331 (100.0%) | 728 (100.0%) |
Health & Disability in South Monrovia Island
Health Insurance Coverage by Age in South Monrovia Island
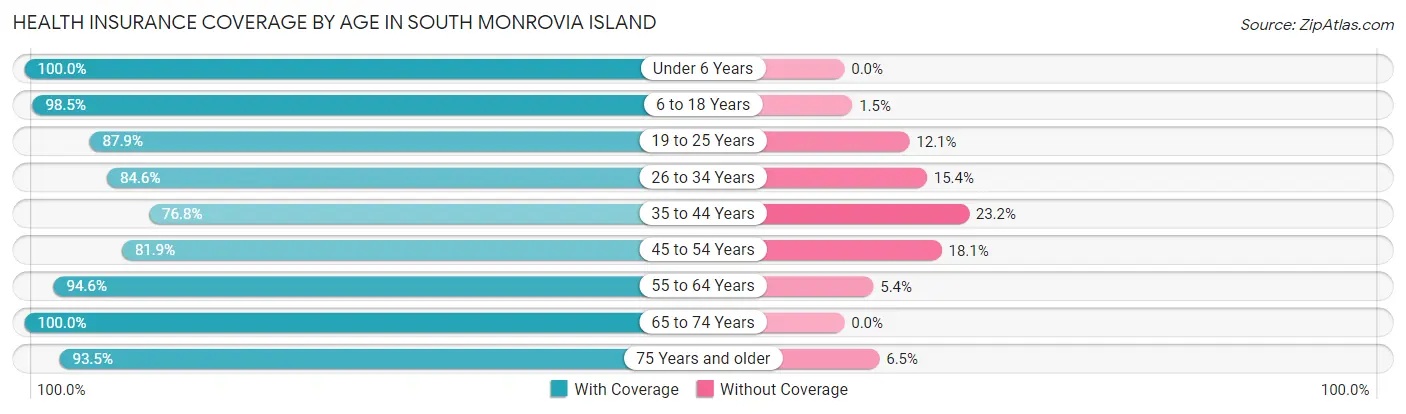
| Age Bracket | With Coverage | Without Coverage |
| Under 6 Years | 414 (100.0%) | 0 (0.0%) |
| 6 to 18 Years | 1,334 (98.5%) | 20 (1.5%) |
| 19 to 25 Years | 442 (87.9%) | 61 (12.1%) |
| 26 to 34 Years | 820 (84.6%) | 149 (15.4%) |
| 35 to 44 Years | 824 (76.8%) | 249 (23.2%) |
| 45 to 54 Years | 682 (81.9%) | 151 (18.1%) |
| 55 to 64 Years | 734 (94.6%) | 42 (5.4%) |
| 65 to 74 Years | 388 (100.0%) | 0 (0.0%) |
| 75 Years and older | 329 (93.5%) | 23 (6.5%) |
| Total | 5,967 (89.6%) | 695 (10.4%) |
Health Insurance Coverage by Citizenship Status in South Monrovia Island
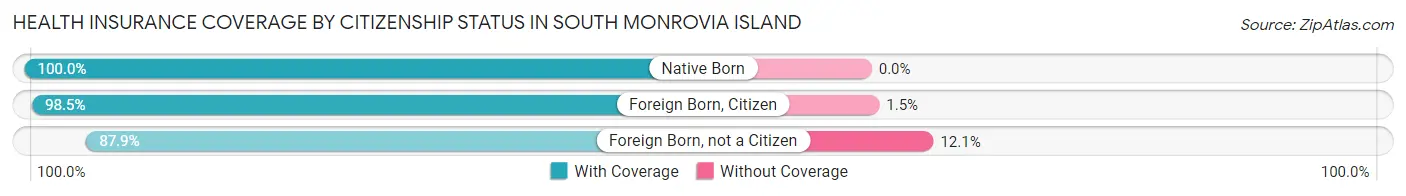
| Citizenship Status | With Coverage | Without Coverage |
| Native Born | 414 (100.0%) | 0 (0.0%) |
| Foreign Born, Citizen | 1,334 (98.5%) | 20 (1.5%) |
| Foreign Born, not a Citizen | 442 (87.9%) | 61 (12.1%) |
Health Insurance Coverage by Household Income in South Monrovia Island
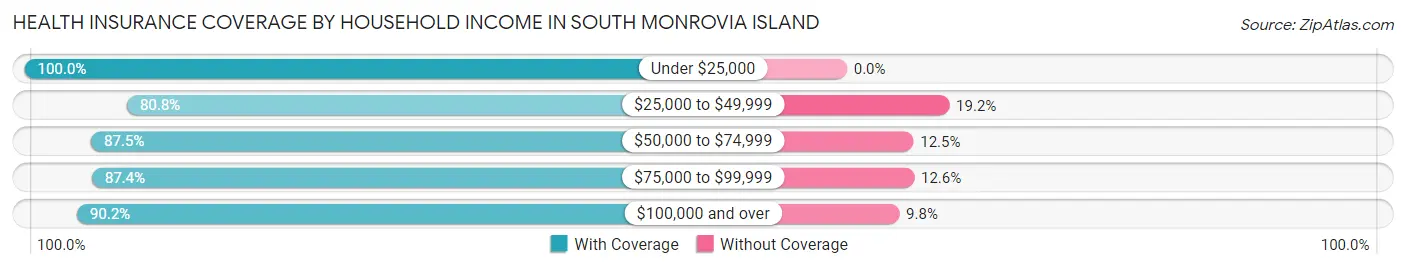
| Household Income | With Coverage | Without Coverage |
| Under $25,000 | 471 (100.0%) | 0 (0.0%) |
| $25,000 to $49,999 | 451 (80.8%) | 107 (19.2%) |
| $50,000 to $74,999 | 625 (87.5%) | 89 (12.5%) |
| $75,000 to $99,999 | 562 (87.4%) | 81 (12.6%) |
| $100,000 and over | 3,844 (90.2%) | 418 (9.8%) |
Public vs Private Health Insurance Coverage by Age in South Monrovia Island
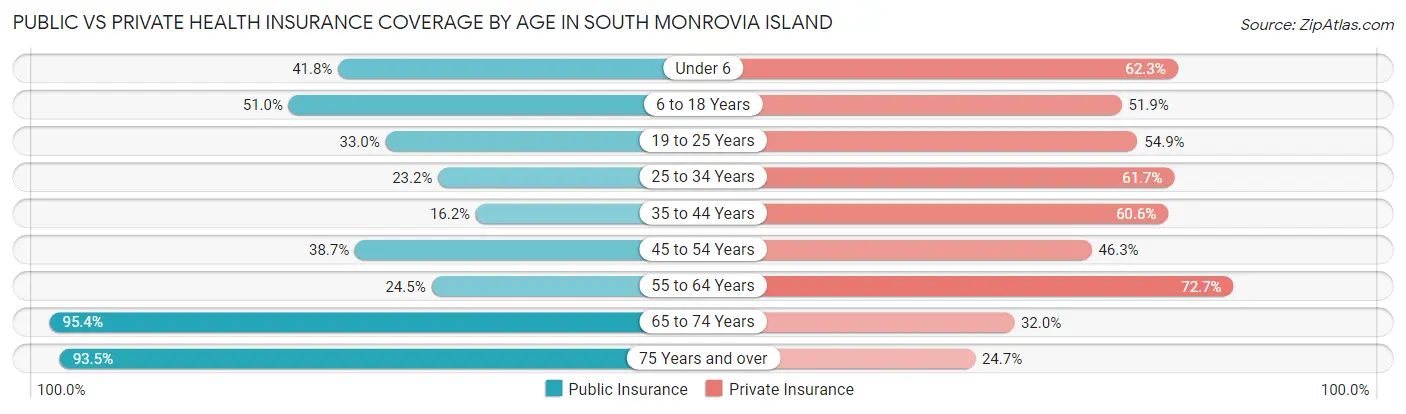
| Age Bracket | Public Insurance | Private Insurance |
| Under 6 | 173 (41.8%) | 258 (62.3%) |
| 6 to 18 Years | 690 (51.0%) | 703 (51.9%) |
| 19 to 25 Years | 166 (33.0%) | 276 (54.9%) |
| 25 to 34 Years | 225 (23.2%) | 598 (61.7%) |
| 35 to 44 Years | 174 (16.2%) | 650 (60.6%) |
| 45 to 54 Years | 322 (38.7%) | 386 (46.3%) |
| 55 to 64 Years | 190 (24.5%) | 564 (72.7%) |
| 65 to 74 Years | 370 (95.4%) | 124 (32.0%) |
| 75 Years and over | 329 (93.5%) | 87 (24.7%) |
| Total | 2,639 (39.6%) | 3,646 (54.7%) |
Disability Status by Sex by Age in South Monrovia Island
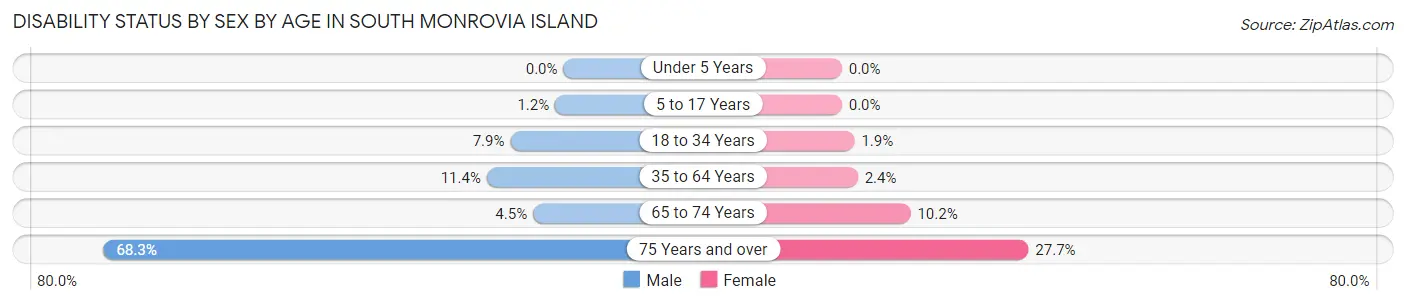
| Age Bracket | Male | Female |
| Under 5 Years | 0 (0.0%) | 0 (0.0%) |
| 5 to 17 Years | 11 (1.2%) | 0 (0.0%) |
| 18 to 34 Years | 70 (7.9%) | 12 (1.9%) |
| 35 to 64 Years | 156 (11.4%) | 31 (2.4%) |
| 65 to 74 Years | 6 (4.5%) | 26 (10.2%) |
| 75 Years and over | 127 (68.3%) | 46 (27.7%) |
Disability Class by Sex by Age in South Monrovia Island
Disability Class: Hearing Difficulty
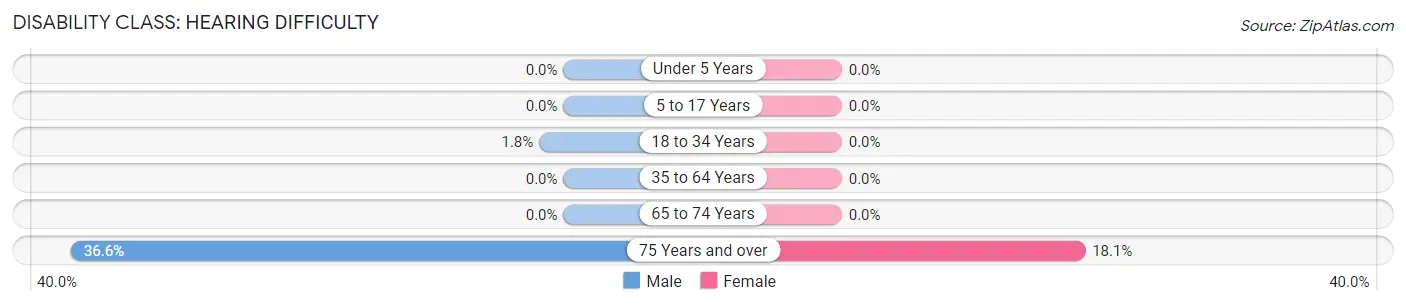
| Age Bracket | Male | Female |
| Under 5 Years | 0 (0.0%) | 0 (0.0%) |
| 5 to 17 Years | 0 (0.0%) | 0 (0.0%) |
| 18 to 34 Years | 16 (1.8%) | 0 (0.0%) |
| 35 to 64 Years | 0 (0.0%) | 0 (0.0%) |
| 65 to 74 Years | 0 (0.0%) | 0 (0.0%) |
| 75 Years and over | 68 (36.6%) | 30 (18.1%) |
Disability Class: Vision Difficulty
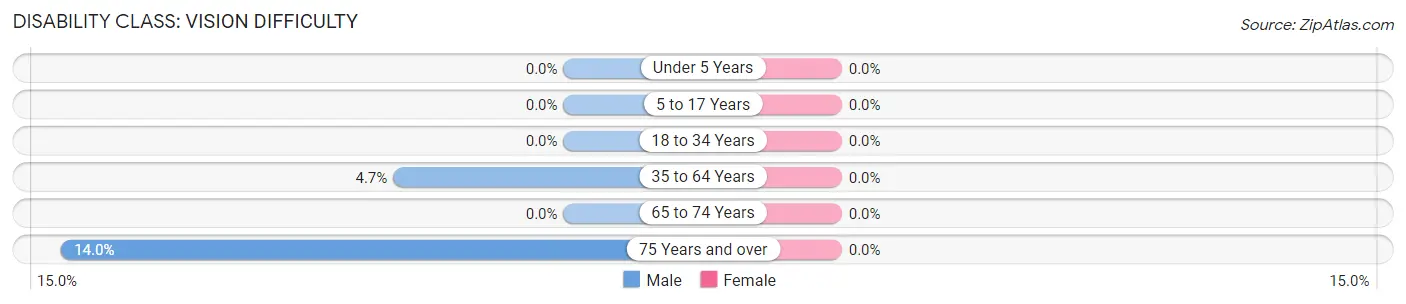
| Age Bracket | Male | Female |
| Under 5 Years | 0 (0.0%) | 0 (0.0%) |
| 5 to 17 Years | 0 (0.0%) | 0 (0.0%) |
| 18 to 34 Years | 0 (0.0%) | 0 (0.0%) |
| 35 to 64 Years | 65 (4.7%) | 0 (0.0%) |
| 65 to 74 Years | 0 (0.0%) | 0 (0.0%) |
| 75 Years and over | 26 (14.0%) | 0 (0.0%) |
Disability Class: Cognitive Difficulty
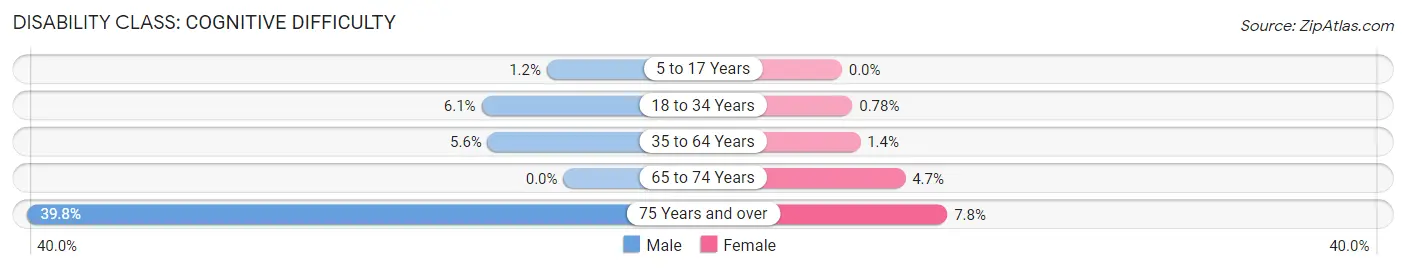
| Age Bracket | Male | Female |
| 5 to 17 Years | 11 (1.2%) | 0 (0.0%) |
| 18 to 34 Years | 54 (6.1%) | 5 (0.8%) |
| 35 to 64 Years | 77 (5.6%) | 18 (1.4%) |
| 65 to 74 Years | 0 (0.0%) | 12 (4.7%) |
| 75 Years and over | 74 (39.8%) | 13 (7.8%) |
Disability Class: Ambulatory Difficulty
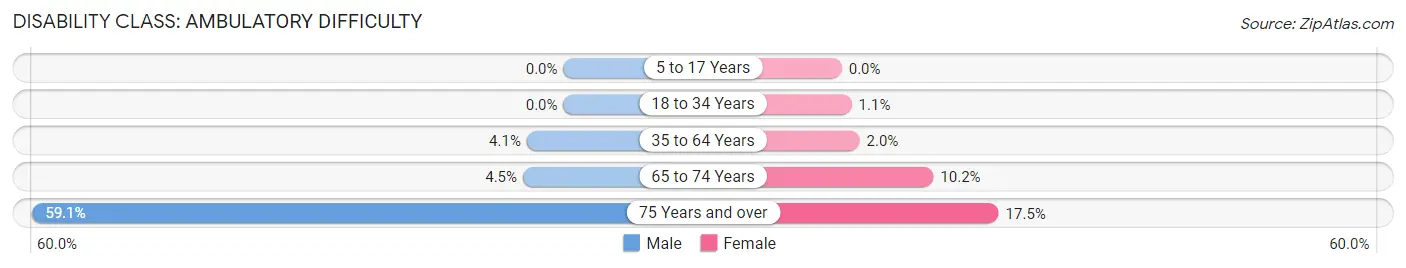
| Age Bracket | Male | Female |
| 5 to 17 Years | 0 (0.0%) | 0 (0.0%) |
| 18 to 34 Years | 0 (0.0%) | 7 (1.1%) |
| 35 to 64 Years | 56 (4.1%) | 26 (2.0%) |
| 65 to 74 Years | 6 (4.5%) | 26 (10.2%) |
| 75 Years and over | 110 (59.1%) | 29 (17.5%) |
Disability Class: Self-Care Difficulty
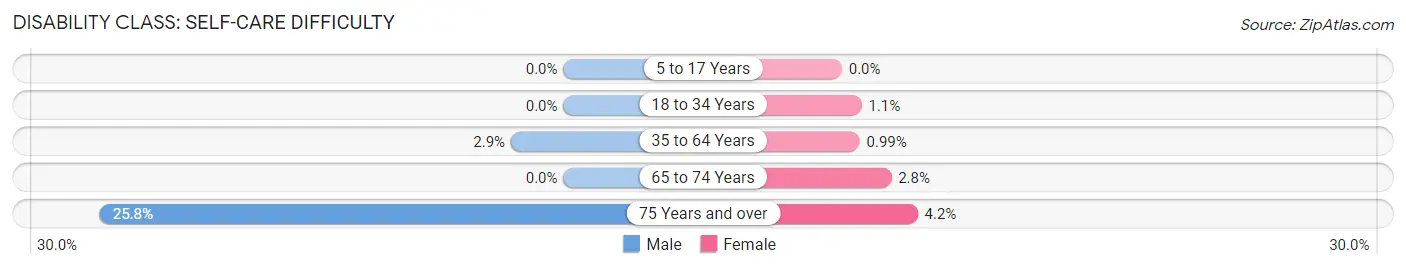
| Age Bracket | Male | Female |
| 5 to 17 Years | 0 (0.0%) | 0 (0.0%) |
| 18 to 34 Years | 0 (0.0%) | 7 (1.1%) |
| 35 to 64 Years | 40 (2.9%) | 13 (1.0%) |
| 65 to 74 Years | 0 (0.0%) | 7 (2.8%) |
| 75 Years and over | 48 (25.8%) | 7 (4.2%) |
Technology Access in South Monrovia Island
Computing Device Access in South Monrovia Island
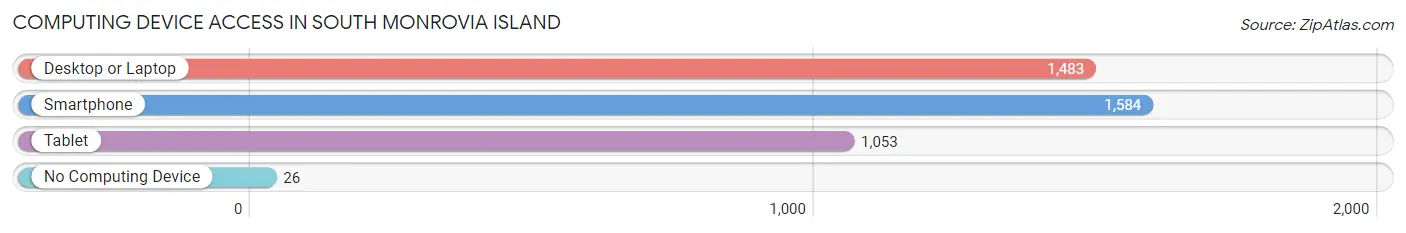
| Device Type | # Households | % Households |
| Desktop or Laptop | 1,483 | 88.0% |
| Smartphone | 1,584 | 94.0% |
| Tablet | 1,053 | 62.5% |
| No Computing Device | 26 | 1.5% |
| Total | 1,686 | 100.0% |
Internet Access in South Monrovia Island
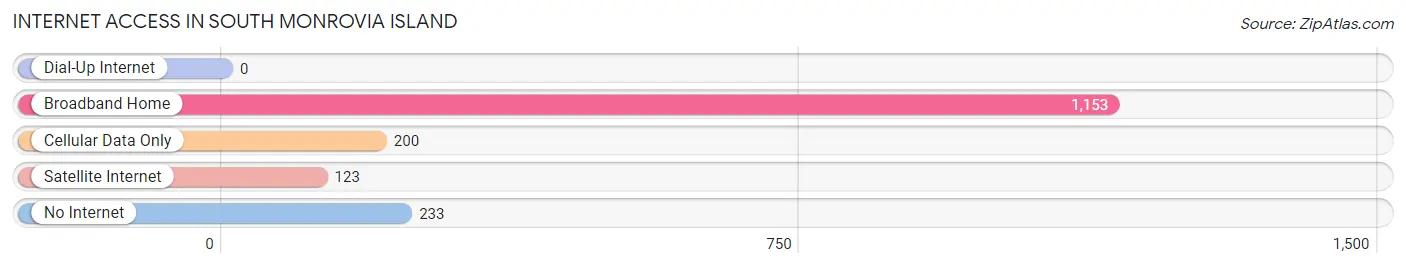
| Internet Type | # Households | % Households |
| Dial-Up Internet | 0 | 0.0% |
| Broadband Home | 1,153 | 68.4% |
| Cellular Data Only | 200 | 11.9% |
| Satellite Internet | 123 | 7.3% |
| No Internet | 233 | 13.8% |
| Total | 1,686 | 100.0% |
South Monrovia Island Summary
Monrovia Island is a small island located off the coast of Southern California, in the United States. It is part of the Los Angeles County and is situated between the cities of Long Beach and San Pedro. The island is approximately 1.5 miles long and 0.5 miles wide, and is home to a population of approximately 1,000 people.
History
Monrovia Island was first inhabited by the Tongva people, who were the original inhabitants of the Los Angeles Basin. The island was named after President James Monroe, who visited the area in 1824. In the late 19th century, the island was used as a quarantine station for immigrants arriving in the United States. In the early 20th century, the island was used as a military base and a naval training center.
In the 1950s, the island was developed as a residential community. The island was incorporated as a city in 1957, and the population has grown steadily since then.
Geography
Monrovia Island is located off the coast of Southern California, in the United States. It is part of the Los Angeles County and is situated between the cities of Long Beach and San Pedro. The island is approximately 1.5 miles long and 0.5 miles wide.
The island is surrounded by the Pacific Ocean on the west, the San Pedro Channel on the north, and the Long Beach Harbor on the east. The island is connected to the mainland by a bridge, which was built in the 1950s.
The island is mostly flat, with some hills in the northern part. The highest point on the island is approximately 200 feet above sea level.
Economy
The economy of Monrovia Island is largely based on tourism and fishing. The island is a popular destination for tourists, who come to enjoy the beaches, the fishing, and the local attractions.
The island also has a number of small businesses, including restaurants, shops, and hotels. The island also has a marina, which is used by local fishermen and recreational boaters.
Demographics
As of the 2010 census, the population of Monrovia Island was 1,000 people. The population is predominantly white (83.3%), with smaller percentages of African American (7.3%), Asian (4.3%), and Hispanic (4.3%) residents.
The median household income on the island is $60,000, and the median home value is $650,000. The unemployment rate is 4.3%, which is lower than the national average.
Conclusion
Monrovia Island is a small island located off the coast of Southern California, in the United States. It is part of the Los Angeles County and is situated between the cities of Long Beach and San Pedro. The island is approximately 1.5 miles long and 0.5 miles wide, and is home to a population of approximately 1,000 people. The economy of Monrovia Island is largely based on tourism and fishing, and the population is predominantly white. The island is a popular destination for tourists, who come to enjoy the beaches, the fishing, and the local attractions.
Common Questions
What is Per Capita Income in South Monrovia Island?
Per Capita income in South Monrovia Island is $28,977.
What is the Median Family Income in South Monrovia Island?
Median Family Income in South Monrovia Island is $110,506.
What is the Median Household income in South Monrovia Island?
Median Household Income in South Monrovia Island is $110,000.
What is Income or Wage Gap in South Monrovia Island?
Income or Wage Gap in South Monrovia Island is 11.9%.
Women in South Monrovia Island earn 88.1 cents for every dollar earned by a man.
What is Family Income Deficit in South Monrovia Island?
Family Income Deficit in South Monrovia Island is $8,901.
Families that are below poverty line in South Monrovia Island earn $8,901 less on average than the poverty threshold level.
What is Inequality or Gini Index in South Monrovia Island?
Inequality or Gini Index in South Monrovia Island is 0.37.
What is the Total Population of South Monrovia Island?
Total Population of South Monrovia Island is 6,833.
What is the Total Male Population of South Monrovia Island?
Total Male Population of South Monrovia Island is 3,804.
What is the Total Female Population of South Monrovia Island?
Total Female Population of South Monrovia Island is 3,029.
What is the Ratio of Males per 100 Females in South Monrovia Island?
There are 125.59 Males per 100 Females in South Monrovia Island.
What is the Ratio of Females per 100 Males in South Monrovia Island?
There are 79.63 Females per 100 Males in South Monrovia Island.
What is the Median Population Age in South Monrovia Island?
Median Population Age in South Monrovia Island is 35.8 Years.
What is the Average Family Size in South Monrovia Island
Average Family Size in South Monrovia Island is 4.1 People.
What is the Average Household Size in South Monrovia Island
Average Household Size in South Monrovia Island is 3.9 People.
How Large is the Labor Force in South Monrovia Island?
There are 3,379 People in the Labor Forcein in South Monrovia Island.
What is the Percentage of People in the Labor Force in South Monrovia Island?
62.8% of People are in the Labor Force in South Monrovia Island.
What is the Unemployment Rate in South Monrovia Island?
Unemployment Rate in South Monrovia Island is 5.8%.