Cities with the Highest Percentage of Population Taking Public Transit to Work in Indiana
RELATED REPORTS & OPTIONS
Public Transit
Indiana
Compare Cities
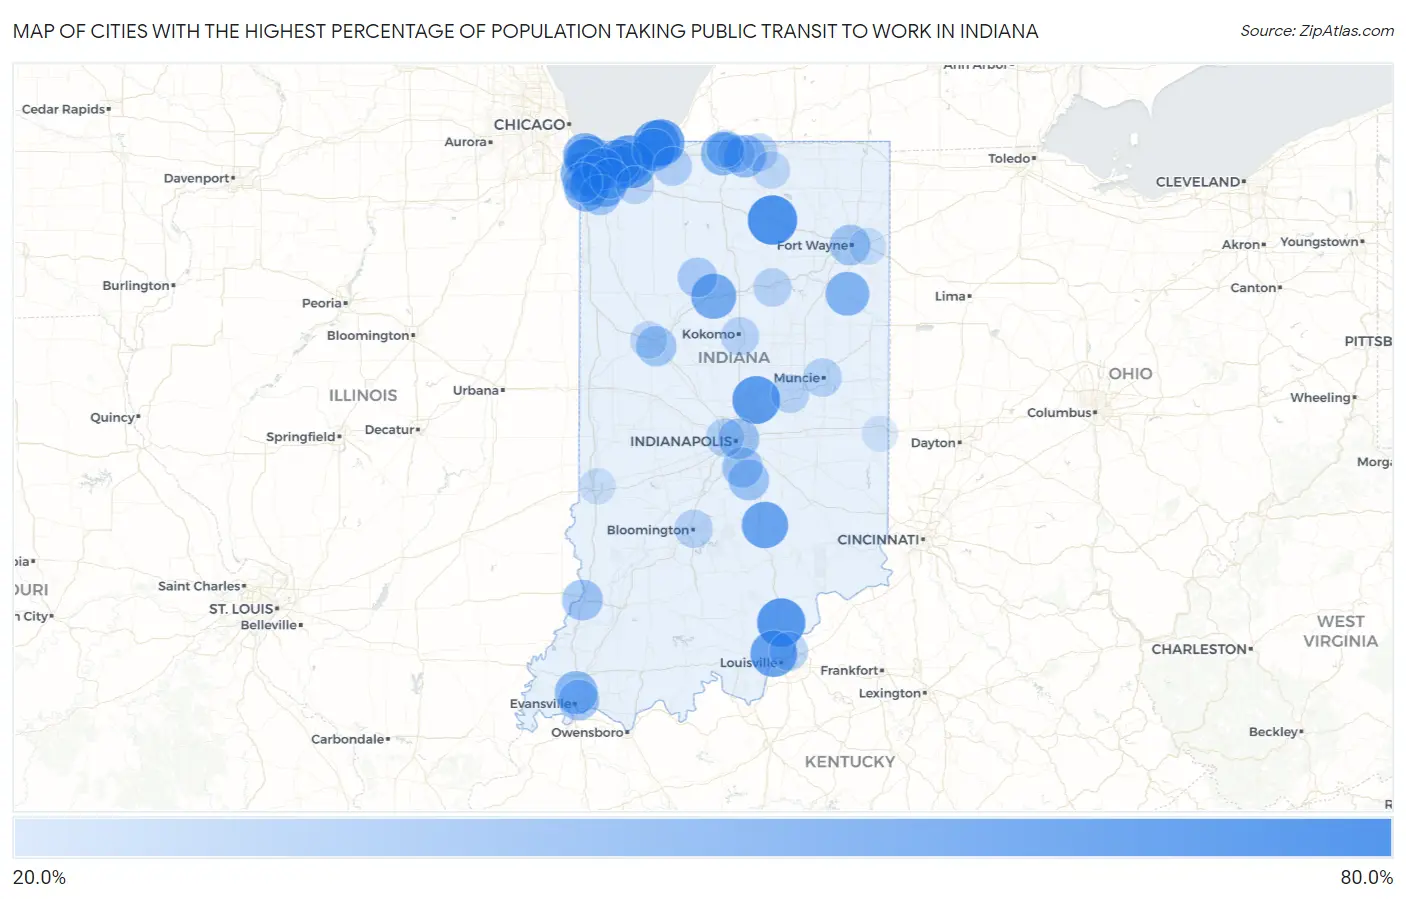
Map of Cities with the Highest Percentage of Population Taking Public Transit to Work in Indiana
0.0%
80.0%
Cities with the Highest Percentage of Population Taking Public Transit to Work in Indiana
| City | % Public Transit | vs State | vs National | |
| 1. | Warsaw | 66.9% | 36.2%(+30.7)#1 | 38.5%(+28.4)#30 |
| 2. | Henryville | 62.8% | 36.2%(+26.6)#2 | 38.5%(+24.3)#86 |
| 3. | Noblesville | 60.5% | 36.2%(+24.3)#3 | 38.5%(+22.0)#146 |
| 4. | Dune Acres | 58.3% | 36.2%(+22.1)#4 | 38.5%(+19.8)#238 |
| 5. | Long Beach | 57.6% | 36.2%(+21.4)#5 | 38.5%(+19.1)#278 |
| 6. | New Albany | 57.0% | 36.2%(+20.8)#6 | 38.5%(+18.5)#310 |
| 7. | Michiana Shores | 56.3% | 36.2%(+20.1)#7 | 38.5%(+17.8)#364 |
| 8. | Columbus | 56.0% | 36.2%(+19.8)#8 | 38.5%(+17.5)#377 |
| 9. | Chesterton | 54.5% | 36.2%(+18.3)#9 | 38.5%(+16.0)#476 |
| 10. | Logansport | 51.5% | 36.2%(+15.3)#10 | 38.5%(+13.0)#718 |
| 11. | East Chicago | 51.2% | 36.2%(+15.0)#11 | 38.5%(+12.7)#755 |
| 12. | Merrillville | 47.3% | 36.2%(+11.1)#12 | 38.5%(+8.80)#1,290 |
| 13. | Bluffton | 47.3% | 36.2%(+11.1)#13 | 38.5%(+8.80)#1,298 |
| 14. | Munster | 47.2% | 36.2%(+11.0)#14 | 38.5%(+8.70)#1,312 |
| 15. | Whiting | 46.7% | 36.2%(+10.5)#15 | 38.5%(+8.20)#1,391 |
| 16. | Portage | 45.9% | 36.2%(+9.70)#16 | 38.5%(+7.40)#1,508 |
| 17. | Ogden Dunes | 45.8% | 36.2%(+9.60)#17 | 38.5%(+7.30)#1,529 |
| 18. | St John | 45.4% | 36.2%(+9.20)#18 | 38.5%(+6.90)#1,596 |
| 19. | South Bend | 44.7% | 36.2%(+8.50)#19 | 38.5%(+6.20)#1,704 |
| 20. | Michigan City | 43.9% | 36.2%(+7.70)#20 | 38.5%(+5.40)#1,846 |
| 21. | Highland | 43.8% | 36.2%(+7.60)#21 | 38.5%(+5.30)#1,869 |
| 22. | Osceola | 42.3% | 36.2%(+6.10)#22 | 38.5%(+3.80)#2,155 |
| 23. | Hammond | 41.8% | 36.2%(+5.60)#23 | 38.5%(+3.30)#2,211 |
| 24. | Griffith | 40.1% | 36.2%(+3.90)#24 | 38.5%(+1.60)#2,523 |
| 25. | Schererville | 39.8% | 36.2%(+3.60)#25 | 38.5%(+1.30)#2,571 |
| 26. | Gary | 39.1% | 36.2%(+2.90)#26 | 38.5%(+0.600)#2,691 |
| 27. | Indianapolis | 37.2% | 36.2%(+1.00)#27 | 38.5%(-1.30)#2,979 |
| 28. | Franklin | 37.1% | 36.2%(+0.900)#28 | 38.5%(-1.40)#2,998 |
| 29. | Evansville | 36.7% | 36.2%(+0.500)#29 | 38.5%(-1.80)#3,055 |
| 30. | Vincennes | 36.7% | 36.2%(+0.500)#30 | 38.5%(-1.80)#3,065 |
| 31. | Greenwood | 36.4% | 36.2%(+0.200)#31 | 38.5%(-2.10)#3,114 |
| 32. | Fort Wayne | 36.3% | 36.2%(+0.100)#32 | 38.5%(-2.20)#3,123 |
| 33. | Crown Point | 35.3% | 36.2%(-0.900)#33 | 38.5%(-3.20)#3,270 |
| 34. | Lafayette | 35.1% | 36.2%(-1.10)#34 | 38.5%(-3.40)#3,301 |
| 35. | Hobart | 34.8% | 36.2%(-1.40)#35 | 38.5%(-3.70)#3,344 |
| 36. | Dyer | 34.4% | 36.2%(-1.80)#36 | 38.5%(-4.10)#3,410 |
| 37. | Royal Center | 33.3% | 36.2%(-2.90)#37 | 38.5%(-5.20)#3,546 |
| 38. | Jeffersonville | 30.5% | 36.2%(-5.70)#38 | 38.5%(-8.00)#3,833 |
| 39. | La Porte | 30.5% | 36.2%(-5.70)#39 | 38.5%(-8.00)#3,834 |
| 40. | Muncie | 29.6% | 36.2%(-6.60)#40 | 38.5%(-8.90)#3,913 |
| 41. | Notre Dame | 29.6% | 36.2%(-6.60)#41 | 38.5%(-8.90)#3,916 |
| 42. | Speedway | 28.9% | 36.2%(-7.30)#42 | 38.5%(-9.60)#3,978 |
| 43. | Anderson | 28.6% | 36.2%(-7.60)#43 | 38.5%(-9.90)#4,007 |
| 44. | Wabash | 28.6% | 36.2%(-7.60)#44 | 38.5%(-9.90)#4,013 |
| 45. | Kokomo | 28.5% | 36.2%(-7.70)#45 | 38.5%(-10.0)#4,018 |
| 46. | Bloomington | 28.3% | 36.2%(-7.90)#46 | 38.5%(-10.2)#4,035 |
| 47. | Valparaiso | 27.4% | 36.2%(-8.80)#47 | 38.5%(-11.1)#4,103 |
| 48. | Elkhart | 27.1% | 36.2%(-9.10)#48 | 38.5%(-11.4)#4,123 |
| 49. | Mishawaka | 26.9% | 36.2%(-9.30)#49 | 38.5%(-11.6)#4,128 |
| 50. | Roseland | 26.4% | 36.2%(-9.80)#50 | 38.5%(-12.1)#4,173 |
| 51. | Goshen | 25.7% | 36.2%(-10.5)#51 | 38.5%(-12.8)#4,203 |
| 52. | West Lafayette | 25.5% | 36.2%(-10.7)#52 | 38.5%(-13.0)#4,219 |
| 53. | New Haven | 23.8% | 36.2%(-12.4)#53 | 38.5%(-14.7)#4,317 |
| 54. | Terre Haute | 22.2% | 36.2%(-14.0)#54 | 38.5%(-16.3)#4,412 |
| 55. | Richmond | 20.8% | 36.2%(-15.4)#55 | 38.5%(-17.7)#4,469 |
Common Questions
What are the Top 10 Cities with the Highest Percentage of Population Taking Public Transit to Work in Indiana?
Top 10 Cities with the Highest Percentage of Population Taking Public Transit to Work in Indiana are:
#1
66.9%
#2
62.8%
#3
60.5%
#4
58.3%
#5
57.6%
#6
57.0%
#7
56.3%
#8
56.0%
#9
54.5%
#10
51.5%
What city has the Highest Percentage of Population Taking Public Transit to Work in Indiana?
Warsaw has the Highest Percentage of Population Taking Public Transit to Work in Indiana with 66.9%.
What is the Percentage of Population Taking Public Transit to Work in the State of Indiana?
Percentage of Population Taking Public Transit to Work in Indiana is 36.2%.
What is the Percentage of Population Taking Public Transit to Work in the United States?
Percentage of Population Taking Public Transit to Work in the United States is 38.5%.