Alhambra, CA Map & Demographics
Alhambra Map
Alhambra Overview
$38,394
PER CAPITA INCOME
$86,200
AVG FAMILY INCOME
$80,234
AVG HOUSEHOLD INCOME
13.1%
WAGE / INCOME GAP [ % ]
86.9¢/ $1
WAGE / INCOME GAP [ $ ]
$8,453
FAMILY INCOME DEFICIT
0.45
INEQUALITY / GINI INDEX
82,295
TOTAL POPULATION
39,910
MALE POPULATION
42,385
FEMALE POPULATION
94.16
MALES / 100 FEMALES
106.20
FEMALES / 100 MALES
41.1
MEDIAN AGE
3.2
AVG FAMILY SIZE
2.7
AVG HOUSEHOLD SIZE
43,800
LABOR FORCE [ PEOPLE ]
62.9%
PERCENT IN LABOR FORCE
5.5%
UNEMPLOYMENT RATE
Income in Alhambra
Income Overview in Alhambra
Per Capita Income in Alhambra is $38,394, while median incomes of families and households are $86,200 and $80,234 respectively.
| Characteristic | Number | Measure |
| Per Capita Income | 82,295 | $38,394 |
| Median Family Income | 20,592 | $86,200 |
| Mean Family Income | 20,592 | $110,917 |
| Median Household Income | 30,054 | $80,234 |
| Mean Household Income | 30,054 | $102,384 |
| Income Deficit | 20,592 | $8,453 |
| Wage / Income Gap (%) | 82,295 | 13.08% |
| Wage / Income Gap ($) | 82,295 | 86.92¢ per $1 |
| Gini / Inequality Index | 82,295 | 0.45 |
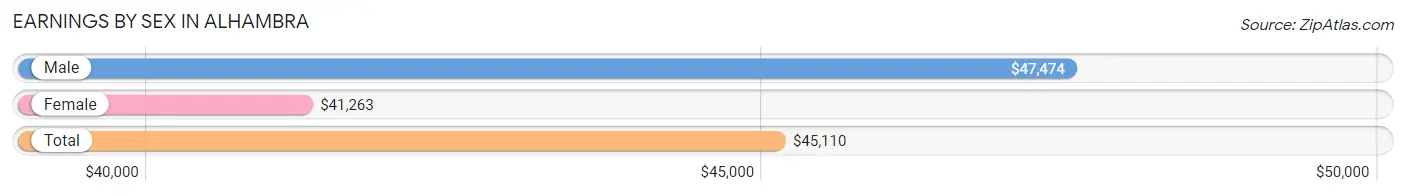
Earnings by Sex in Alhambra
Average Earnings in Alhambra are $45,110, $47,474 for men and $41,263 for women, a difference of 13.1%.
| Sex | Number | Average Earnings |
| Male | 23,193 (52.1%) | $47,474 |
| Female | 21,284 (47.8%) | $41,263 |
| Total | 44,477 (100.0%) | $45,110 |
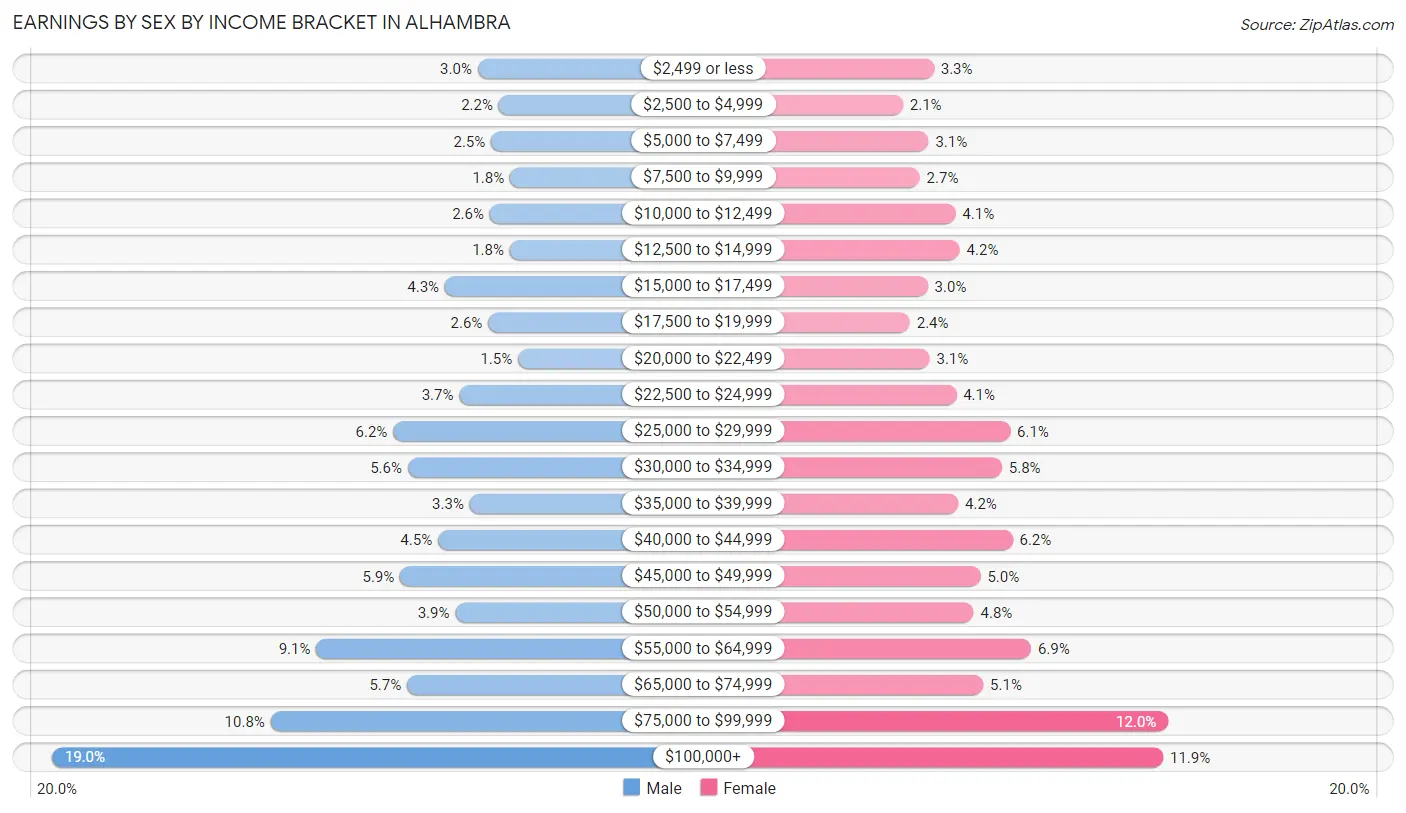
Earnings by Sex by Income Bracket in Alhambra
The most common earnings brackets in Alhambra are $100,000+ for men (4,402 | 19.0%) and $75,000 to $99,999 for women (2,563 | 12.0%).
| Income | Male | Female |
| $2,499 or less | 701 (3.0%) | 694 (3.3%) |
| $2,500 to $4,999 | 517 (2.2%) | 446 (2.1%) |
| $5,000 to $7,499 | 584 (2.5%) | 651 (3.1%) |
| $7,500 to $9,999 | 419 (1.8%) | 581 (2.7%) |
| $10,000 to $12,499 | 595 (2.6%) | 867 (4.1%) |
| $12,500 to $14,999 | 421 (1.8%) | 900 (4.2%) |
| $15,000 to $17,499 | 985 (4.3%) | 645 (3.0%) |
| $17,500 to $19,999 | 610 (2.6%) | 502 (2.4%) |
| $20,000 to $22,499 | 350 (1.5%) | 660 (3.1%) |
| $22,500 to $24,999 | 861 (3.7%) | 872 (4.1%) |
| $25,000 to $29,999 | 1,435 (6.2%) | 1,302 (6.1%) |
| $30,000 to $34,999 | 1,309 (5.6%) | 1,236 (5.8%) |
| $35,000 to $39,999 | 770 (3.3%) | 888 (4.2%) |
| $40,000 to $44,999 | 1,046 (4.5%) | 1,321 (6.2%) |
| $45,000 to $49,999 | 1,375 (5.9%) | 1,067 (5.0%) |
| $50,000 to $54,999 | 895 (3.9%) | 1,010 (4.8%) |
| $55,000 to $64,999 | 2,103 (9.1%) | 1,468 (6.9%) |
| $65,000 to $74,999 | 1,315 (5.7%) | 1,088 (5.1%) |
| $75,000 to $99,999 | 2,500 (10.8%) | 2,563 (12.0%) |
| $100,000+ | 4,402 (19.0%) | 2,523 (11.8%) |
| Total | 23,193 (100.0%) | 21,284 (100.0%) |
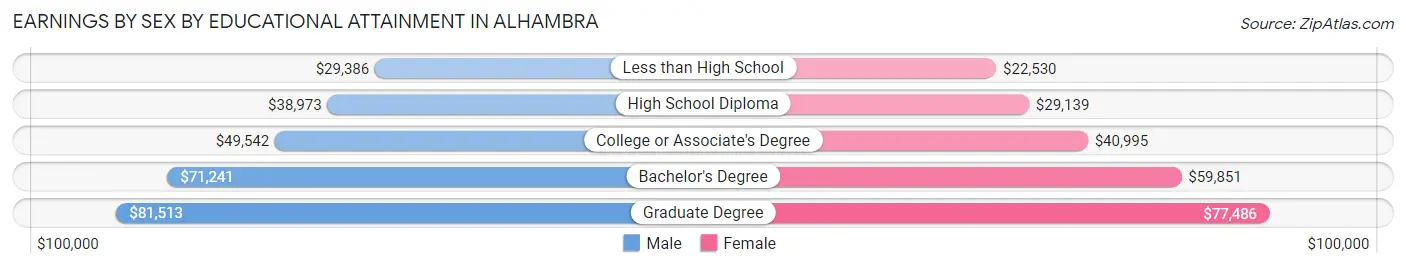
Earnings by Sex by Educational Attainment in Alhambra
Average earnings in Alhambra are $52,317 for men and $43,755 for women, a difference of 16.4%. Men with an educational attainment of graduate degree enjoy the highest average annual earnings of $81,513, while those with less than high school education earn the least with $29,386. Women with an educational attainment of graduate degree earn the most with the average annual earnings of $77,486, while those with less than high school education have the smallest earnings of $22,530.
| Educational Attainment | Male Income | Female Income |
| Less than High School | $29,386 | $22,530 |
| High School Diploma | $38,973 | $29,139 |
| College or Associate's Degree | $49,542 | $40,995 |
| Bachelor's Degree | $71,241 | $59,851 |
| Graduate Degree | $81,513 | $77,486 |
| Total | $52,317 | $43,755 |
Family Income in Alhambra
Family Income Brackets in Alhambra
According to the Alhambra family income data, there are 4,160 families falling into the $100,000 to $149,999 income range, which is the most common income bracket and makes up 20.2% of all families. Conversely, the $10,000 to $14,999 income bracket is the least frequent group with only 391 families (1.9%) belonging to this category.
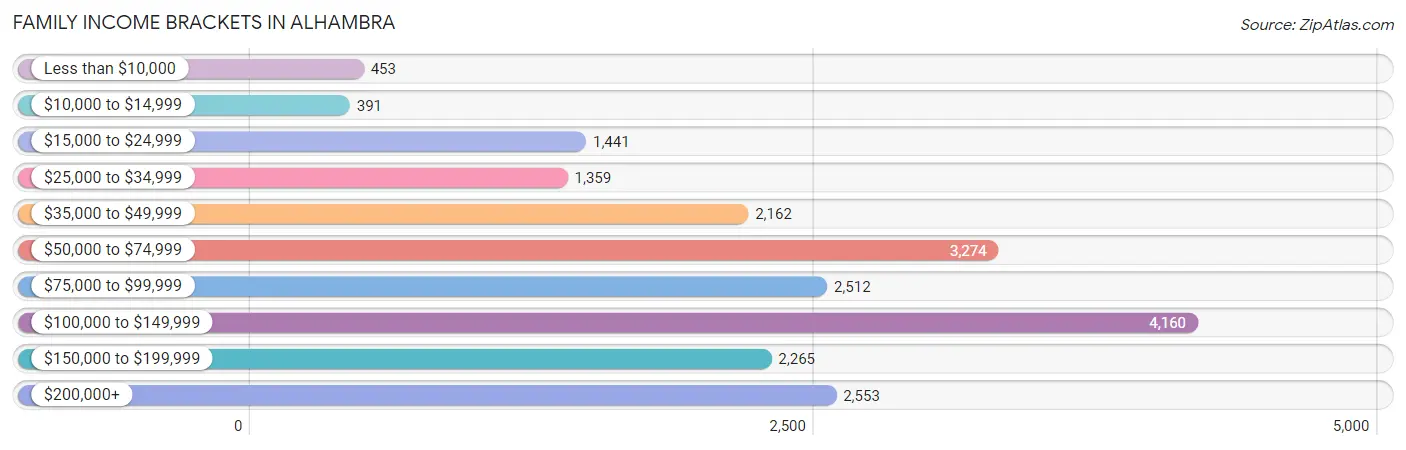
| Income Bracket | # Families | % Families |
| Less than $10,000 | 453 | 2.2% |
| $10,000 to $14,999 | 391 | 1.9% |
| $15,000 to $24,999 | 1,441 | 7.0% |
| $25,000 to $34,999 | 1,359 | 6.6% |
| $35,000 to $49,999 | 2,162 | 10.5% |
| $50,000 to $74,999 | 3,274 | 15.9% |
| $75,000 to $99,999 | 2,512 | 12.2% |
| $100,000 to $149,999 | 4,160 | 20.2% |
| $150,000 to $199,999 | 2,265 | 11.0% |
| $200,000+ | 2,553 | 12.4% |
Family Income by Famaliy Size in Alhambra
4-person families (3,877 | 18.8%) account for the highest median family income in Alhambra with $118,355 per family, while 2-person families (8,867 | 43.1%) have the highest median income of $36,562 per family member.
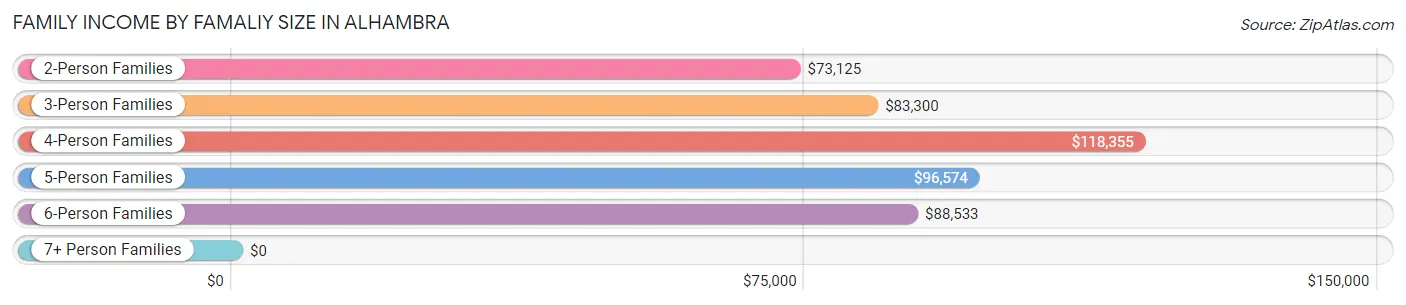
| Income Bracket | # Families | Median Income |
| 2-Person Families | 8,867 (43.1%) | $73,125 |
| 3-Person Families | 5,217 (25.3%) | $83,300 |
| 4-Person Families | 3,877 (18.8%) | $118,355 |
| 5-Person Families | 1,834 (8.9%) | $96,574 |
| 6-Person Families | 597 (2.9%) | $88,533 |
| 7+ Person Families | 200 (1.0%) | $0 |
| Total | 20,592 (100.0%) | $86,200 |
Family Income by Number of Earners in Alhambra
The median family income in Alhambra is $86,200, with families comprising 3+ earners (2,703) having the highest median family income of $123,060, while families with no earners (2,574) have the lowest median family income of $31,333, accounting for 13.1% and 12.5% of families, respectively.
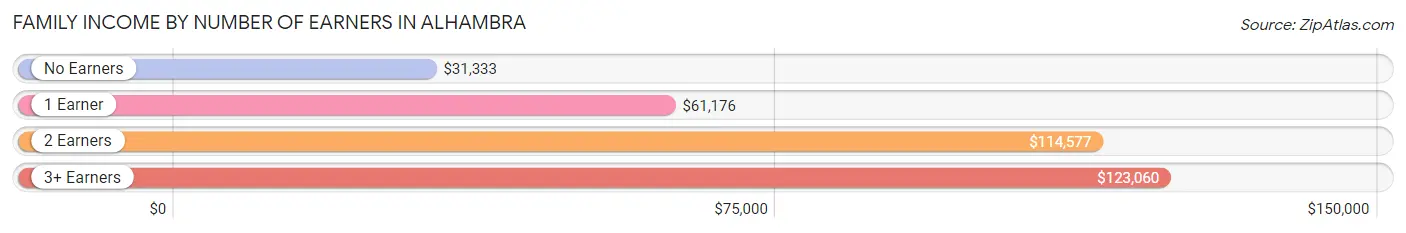
| Number of Earners | # Families | Median Income |
| No Earners | 2,574 (12.5%) | $31,333 |
| 1 Earner | 6,873 (33.4%) | $61,176 |
| 2 Earners | 8,442 (41.0%) | $114,577 |
| 3+ Earners | 2,703 (13.1%) | $123,060 |
| Total | 20,592 (100.0%) | $86,200 |
Household Income in Alhambra
Household Income Brackets in Alhambra
With 5,830 households falling in the category, the $100,000 to $149,999 income range is the most frequent in Alhambra, accounting for 19.4% of all households. In contrast, only 1,082 households (3.6%) fall into the $10,000 to $14,999 income bracket, making it the least populous group.
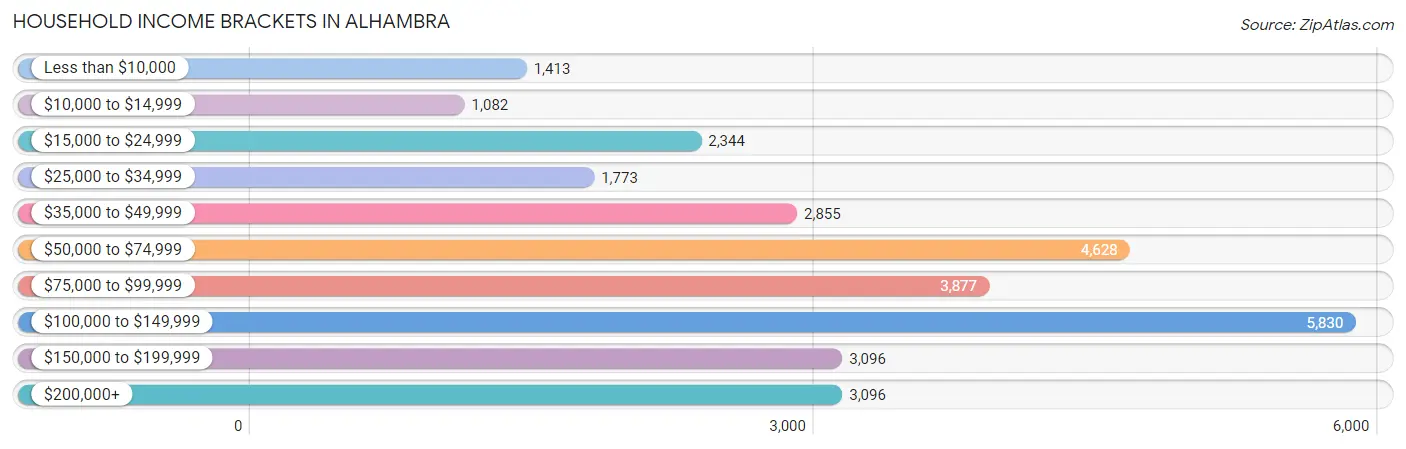
| Income Bracket | # Households | % Households |
| Less than $10,000 | 1,413 | 4.7% |
| $10,000 to $14,999 | 1,082 | 3.6% |
| $15,000 to $24,999 | 2,344 | 7.8% |
| $25,000 to $34,999 | 1,773 | 5.9% |
| $35,000 to $49,999 | 2,855 | 9.5% |
| $50,000 to $74,999 | 4,628 | 15.4% |
| $75,000 to $99,999 | 3,877 | 12.9% |
| $100,000 to $149,999 | 5,830 | 19.4% |
| $150,000 to $199,999 | 3,096 | 10.3% |
| $200,000+ | 3,096 | 10.3% |
Household Income by Householder Age in Alhambra
The median household income in Alhambra is $80,234, with the highest median household income of $93,558 found in the 25 to 44 years age bracket for the primary householder. A total of 10,887 households (36.2%) fall into this category. Meanwhile, the 65+ years age bracket for the primary householder has the lowest median household income of $47,016, with 7,204 households (24.0%) in this group.
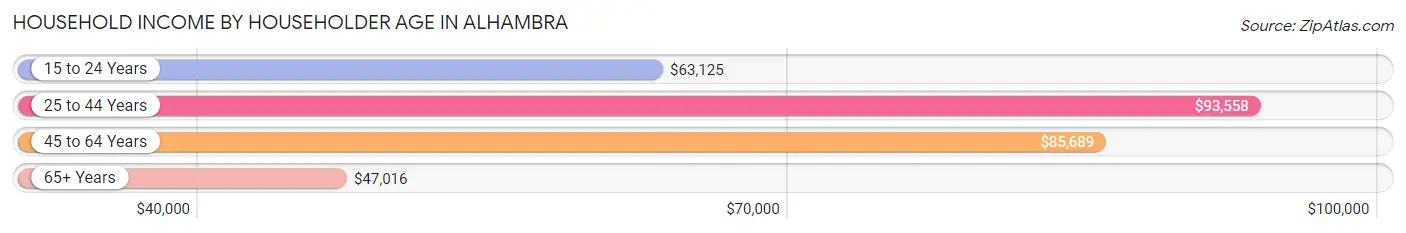
| Income Bracket | # Households | Median Income |
| 15 to 24 Years | 631 (2.1%) | $63,125 |
| 25 to 44 Years | 10,887 (36.2%) | $93,558 |
| 45 to 64 Years | 11,332 (37.7%) | $85,689 |
| 65+ Years | 7,204 (24.0%) | $47,016 |
| Total | 30,054 (100.0%) | $80,234 |
Poverty in Alhambra
Income Below Poverty by Sex and Age in Alhambra
With 11.4% poverty level for males and 13.6% for females among the residents of Alhambra, 15 year old males and 16 and 17 year old females are the most vulnerable to poverty, with 91 males (25.3%) and 193 females (20.3%) in their respective age groups living below the poverty level.
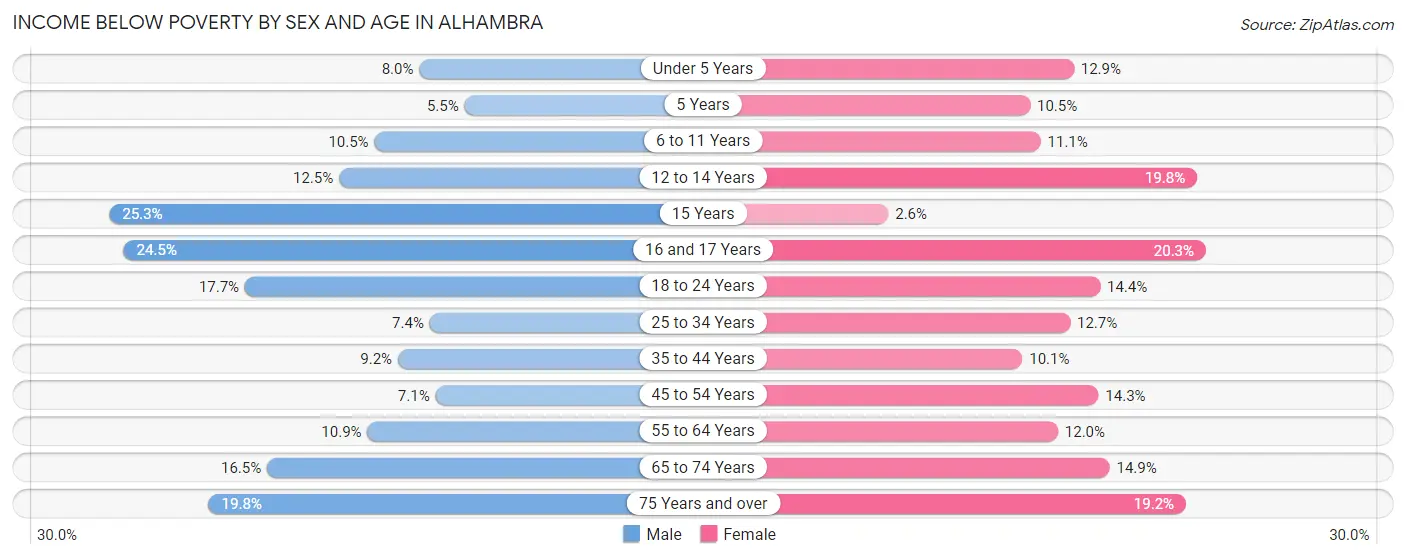
| Age Bracket | Male | Female |
| Under 5 Years | 163 (8.0%) | 254 (12.9%) |
| 5 Years | 28 (5.5%) | 63 (10.5%) |
| 6 to 11 Years | 243 (10.5%) | 246 (11.1%) |
| 12 to 14 Years | 124 (12.5%) | 234 (19.8%) |
| 15 Years | 91 (25.3%) | 10 (2.6%) |
| 16 and 17 Years | 240 (24.5%) | 193 (20.3%) |
| 18 to 24 Years | 491 (17.7%) | 414 (14.4%) |
| 25 to 34 Years | 518 (7.4%) | 781 (12.7%) |
| 35 to 44 Years | 528 (9.2%) | 592 (10.1%) |
| 45 to 54 Years | 378 (7.1%) | 839 (14.3%) |
| 55 to 64 Years | 590 (10.9%) | 646 (12.0%) |
| 65 to 74 Years | 661 (16.5%) | 660 (14.9%) |
| 75 Years and over | 453 (19.8%) | 784 (19.2%) |
| Total | 4,508 (11.4%) | 5,716 (13.6%) |
Income Above Poverty by Sex and Age in Alhambra
According to the poverty statistics in Alhambra, males aged 5 years and females aged 15 years are the age groups that are most secure financially, with 94.5% of males and 97.4% of females in these age groups living above the poverty line.
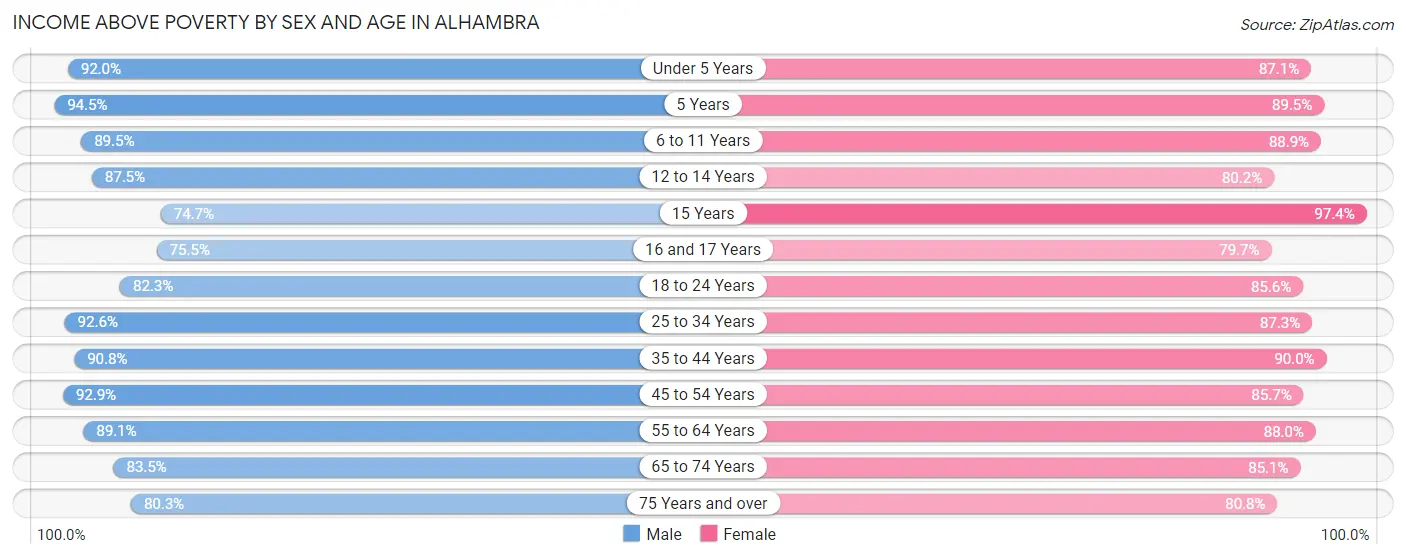
| Age Bracket | Male | Female |
| Under 5 Years | 1,870 (92.0%) | 1,712 (87.1%) |
| 5 Years | 481 (94.5%) | 538 (89.5%) |
| 6 to 11 Years | 2,066 (89.5%) | 1,977 (88.9%) |
| 12 to 14 Years | 869 (87.5%) | 949 (80.2%) |
| 15 Years | 269 (74.7%) | 376 (97.4%) |
| 16 and 17 Years | 740 (75.5%) | 759 (79.7%) |
| 18 to 24 Years | 2,279 (82.3%) | 2,465 (85.6%) |
| 25 to 34 Years | 6,442 (92.6%) | 5,365 (87.3%) |
| 35 to 44 Years | 5,206 (90.8%) | 5,299 (89.9%) |
| 45 to 54 Years | 4,933 (92.9%) | 5,031 (85.7%) |
| 55 to 64 Years | 4,816 (89.1%) | 4,724 (88.0%) |
| 65 to 74 Years | 3,346 (83.5%) | 3,767 (85.1%) |
| 75 Years and over | 1,841 (80.2%) | 3,308 (80.8%) |
| Total | 35,158 (88.6%) | 36,270 (86.4%) |
Income Below Poverty Among Married-Couple Families in Alhambra
The poverty statistics for married-couple families in Alhambra show that 7.9% or 1,096 of the total 13,879 families live below the poverty line. Families with 1 or 2 children have the highest poverty rate of 11.4%, comprising of 584 families. On the other hand, families with 5 or more children have the lowest poverty rate of 0.0%, which includes 0 families.
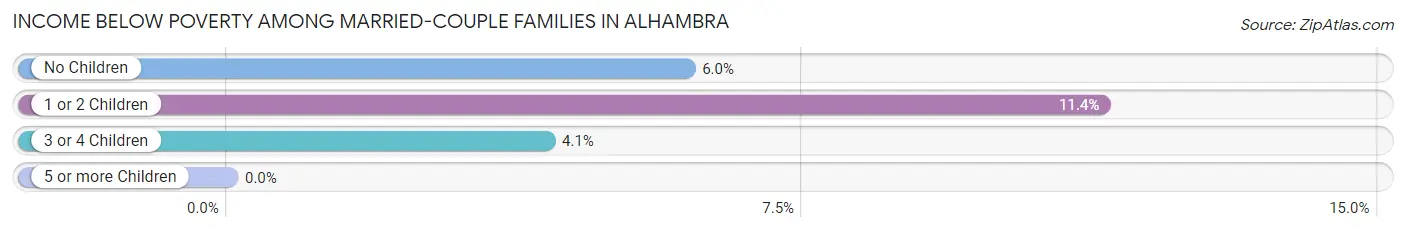
| Children | Above Poverty | Below Poverty |
| No Children | 7,720 (94.0%) | 490 (6.0%) |
| 1 or 2 Children | 4,540 (88.6%) | 584 (11.4%) |
| 3 or 4 Children | 510 (95.9%) | 22 (4.1%) |
| 5 or more Children | 13 (100.0%) | 0 (0.0%) |
| Total | 12,783 (92.1%) | 1,096 (7.9%) |
Income Below Poverty Among Single-Parent Households in Alhambra
According to the poverty data in Alhambra, 10.5% or 228 single-father households and 12.7% or 575 single-mother households are living below the poverty line. Among single-father households, those with 1 or 2 children have the highest poverty rate, with 159 households (19.4%) experiencing poverty. Likewise, among single-mother households, those with 5 or more children have the highest poverty rate, with 20 households (100.0%) falling below the poverty line.
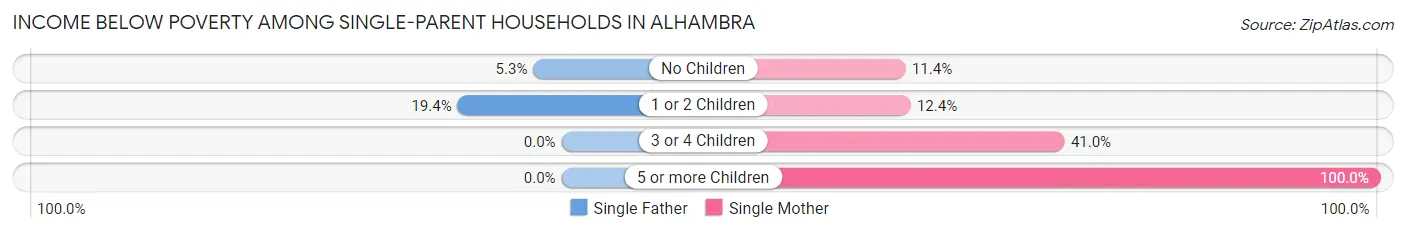
| Children | Single Father | Single Mother |
| No Children | 69 (5.3%) | 311 (11.4%) |
| 1 or 2 Children | 159 (19.4%) | 212 (12.3%) |
| 3 or 4 Children | 0 (0.0%) | 32 (41.0%) |
| 5 or more Children | 0 (0.0%) | 20 (100.0%) |
| Total | 228 (10.5%) | 575 (12.7%) |
Income Below Poverty Among Married-Couple vs Single-Parent Households in Alhambra
The poverty data for Alhambra shows that 1,096 of the married-couple family households (7.9%) and 803 of the single-parent households (12.0%) are living below the poverty level. Within the married-couple family households, those with 1 or 2 children have the highest poverty rate, with 584 households (11.4%) falling below the poverty line. Among the single-parent households, those with 5 or more children have the highest poverty rate, with 20 household (71.4%) living below poverty.
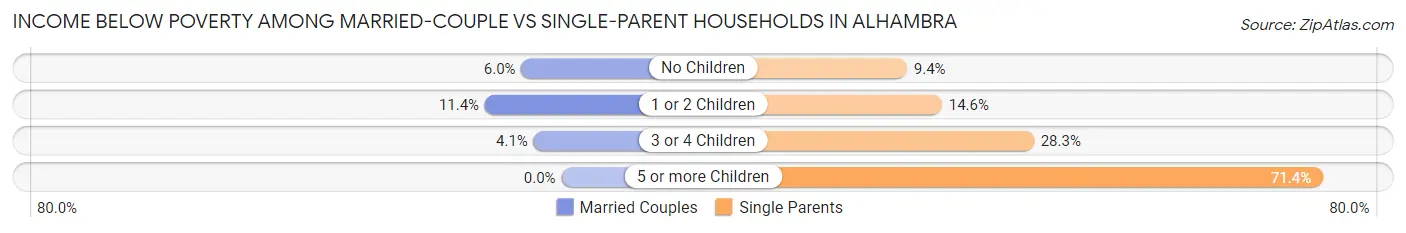
| Children | Married-Couple Families | Single-Parent Households |
| No Children | 490 (6.0%) | 380 (9.4%) |
| 1 or 2 Children | 584 (11.4%) | 371 (14.6%) |
| 3 or 4 Children | 22 (4.1%) | 32 (28.3%) |
| 5 or more Children | 0 (0.0%) | 20 (71.4%) |
| Total | 1,096 (7.9%) | 803 (12.0%) |
Race in Alhambra
The most populous races in Alhambra are Asian (42,204 | 51.3%), Hispanic or Latino (28,876 | 35.1%), and Some other Race (15,563 | 18.9%).
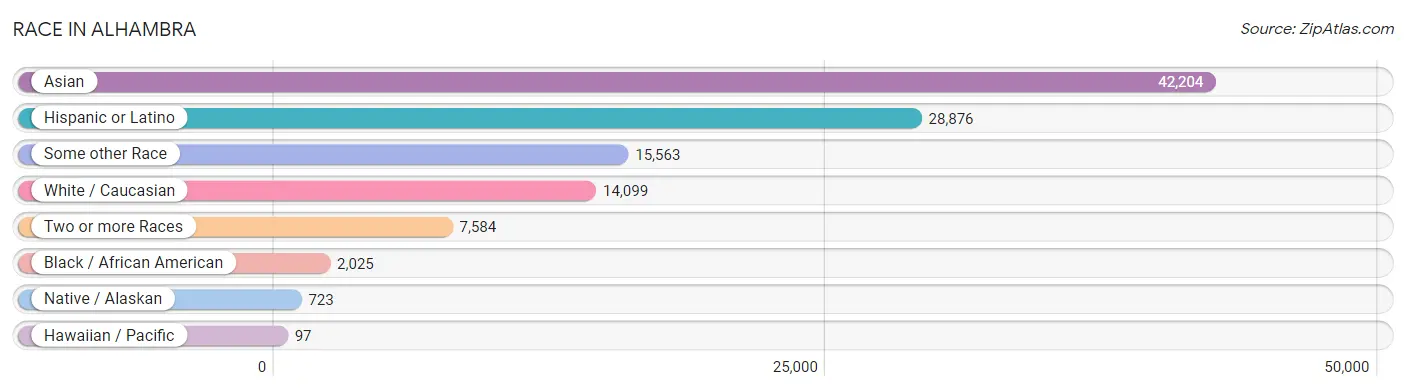
| Race | # Population | % Population |
| Asian | 42,204 | 51.3% |
| Black / African American | 2,025 | 2.5% |
| Hawaiian / Pacific | 97 | 0.1% |
| Hispanic or Latino | 28,876 | 35.1% |
| Native / Alaskan | 723 | 0.9% |
| White / Caucasian | 14,099 | 17.1% |
| Two or more Races | 7,584 | 9.2% |
| Some other Race | 15,563 | 18.9% |
| Total | 82,295 | 100.0% |
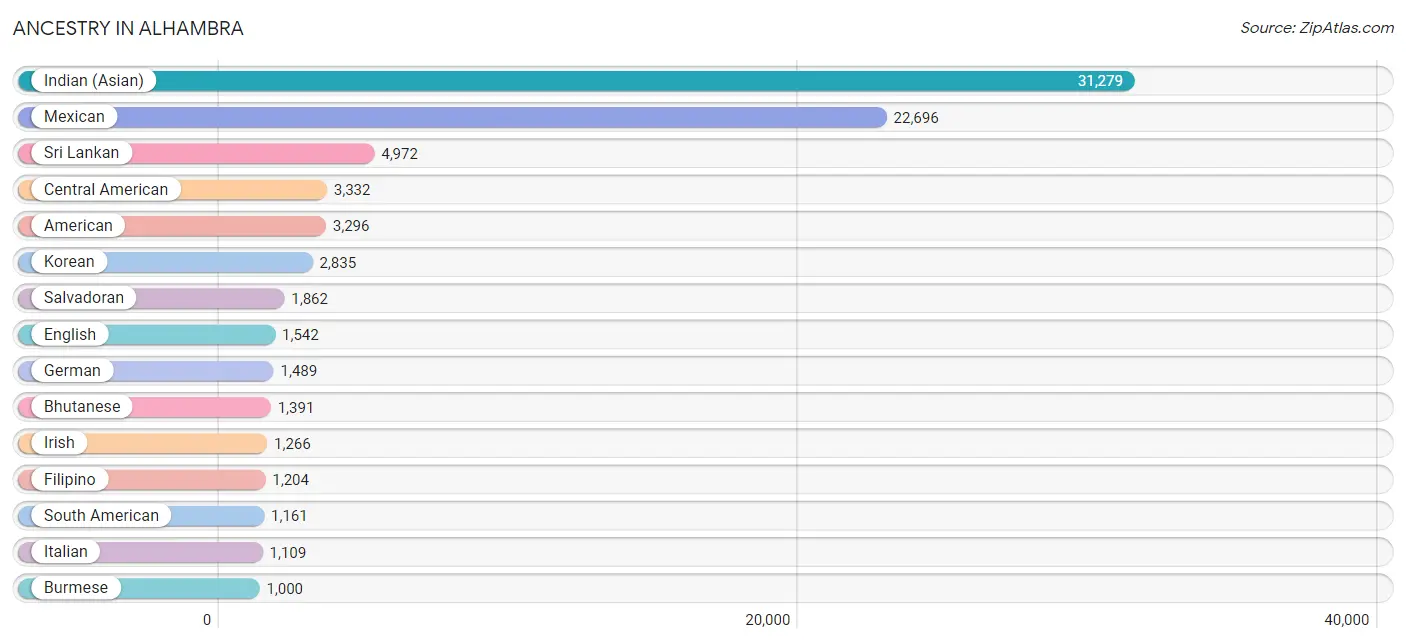
Ancestry in Alhambra
The most populous ancestries reported in Alhambra are Indian (Asian) (31,279 | 38.0%), Mexican (22,696 | 27.6%), Sri Lankan (4,972 | 6.0%), Central American (3,332 | 4.1%), and American (3,296 | 4.0%), together accounting for 79.7% of all Alhambra residents.
| Ancestry | # Population | % Population |
| Afghan | 21 | 0.0% |
| African | 83 | 0.1% |
| American | 3,296 | 4.0% |
| Arab | 323 | 0.4% |
| Argentinean | 248 | 0.3% |
| Armenian | 75 | 0.1% |
| Australian | 2 | 0.0% |
| Austrian | 15 | 0.0% |
| Barbadian | 1 | 0.0% |
| Basque | 32 | 0.0% |
| Belgian | 24 | 0.0% |
| Bhutanese | 1,391 | 1.7% |
| Blackfeet | 40 | 0.1% |
| Brazilian | 92 | 0.1% |
| British | 178 | 0.2% |
| Bulgarian | 5 | 0.0% |
| Burmese | 1,000 | 1.2% |
| Canadian | 100 | 0.1% |
| Central American | 3,332 | 4.1% |
| Central American Indian | 166 | 0.2% |
| Cherokee | 205 | 0.3% |
| Chilean | 64 | 0.1% |
| Chippewa | 87 | 0.1% |
| Choctaw | 8 | 0.0% |
| Colombian | 221 | 0.3% |
| Costa Rican | 78 | 0.1% |
| Croatian | 25 | 0.0% |
| Cuban | 437 | 0.5% |
| Czech | 33 | 0.0% |
| Czechoslovakian | 9 | 0.0% |
| Danish | 64 | 0.1% |
| Delaware | 13 | 0.0% |
| Dominican | 30 | 0.0% |
| Dutch | 210 | 0.3% |
| Eastern European | 54 | 0.1% |
| Ecuadorian | 187 | 0.2% |
| Egyptian | 189 | 0.2% |
| English | 1,542 | 1.9% |
| Estonian | 22 | 0.0% |
| Ethiopian | 18 | 0.0% |
| European | 683 | 0.8% |
| Filipino | 1,204 | 1.5% |
| Finnish | 12 | 0.0% |
| French | 539 | 0.6% |
| French Canadian | 40 | 0.1% |
| German | 1,489 | 1.8% |
| Greek | 111 | 0.1% |
| Guatemalan | 723 | 0.9% |
| Haitian | 9 | 0.0% |
| Honduran | 205 | 0.3% |
| Hopi | 19 | 0.0% |
| Hungarian | 74 | 0.1% |
| Icelander | 20 | 0.0% |
| Indian (Asian) | 31,279 | 38.0% |
| Indonesian | 447 | 0.5% |
| Iranian | 164 | 0.2% |
| Iraqi | 8 | 0.0% |
| Irish | 1,266 | 1.5% |
| Israeli | 3 | 0.0% |
| Italian | 1,109 | 1.3% |
| Japanese | 691 | 0.8% |
| Kiowa | 27 | 0.0% |
| Korean | 2,835 | 3.4% |
| Laotian | 400 | 0.5% |
| Lebanese | 71 | 0.1% |
| Lithuanian | 6 | 0.0% |
| Malaysian | 194 | 0.2% |
| Mexican | 22,696 | 27.6% |
| Mexican American Indian | 548 | 0.7% |
| Mongolian | 116 | 0.1% |
| Native Hawaiian | 86 | 0.1% |
| Navajo | 18 | 0.0% |
| Nicaraguan | 336 | 0.4% |
| Nigerian | 7 | 0.0% |
| Norwegian | 396 | 0.5% |
| Pakistani | 475 | 0.6% |
| Palestinian | 2 | 0.0% |
| Panamanian | 34 | 0.0% |
| Paraguayan | 27 | 0.0% |
| Peruvian | 314 | 0.4% |
| Polish | 371 | 0.4% |
| Portuguese | 55 | 0.1% |
| Pueblo | 126 | 0.2% |
| Puerto Rican | 354 | 0.4% |
| Romanian | 12 | 0.0% |
| Russian | 87 | 0.1% |
| Salvadoran | 1,862 | 2.3% |
| Scandinavian | 23 | 0.0% |
| Scotch-Irish | 157 | 0.2% |
| Scottish | 482 | 0.6% |
| Seminole | 4 | 0.0% |
| Slovak | 23 | 0.0% |
| South American | 1,161 | 1.4% |
| South American Indian | 143 | 0.2% |
| Spaniard | 234 | 0.3% |
| Spanish | 98 | 0.1% |
| Sri Lankan | 4,972 | 6.0% |
| Subsaharan African | 120 | 0.2% |
| Swedish | 290 | 0.4% |
| Swiss | 91 | 0.1% |
| Syrian | 46 | 0.1% |
| Thai | 603 | 0.7% |
| Tohono O'Odham | 33 | 0.0% |
| Turkish | 33 | 0.0% |
| Ukrainian | 41 | 0.1% |
| Uruguayan | 14 | 0.0% |
| Venezuelan | 63 | 0.1% |
| Welsh | 175 | 0.2% |
| West Indian | 15 | 0.0% |
| Yaqui | 87 | 0.1% |
| Yugoslavian | 11 | 0.0% | View All 111 Rows |
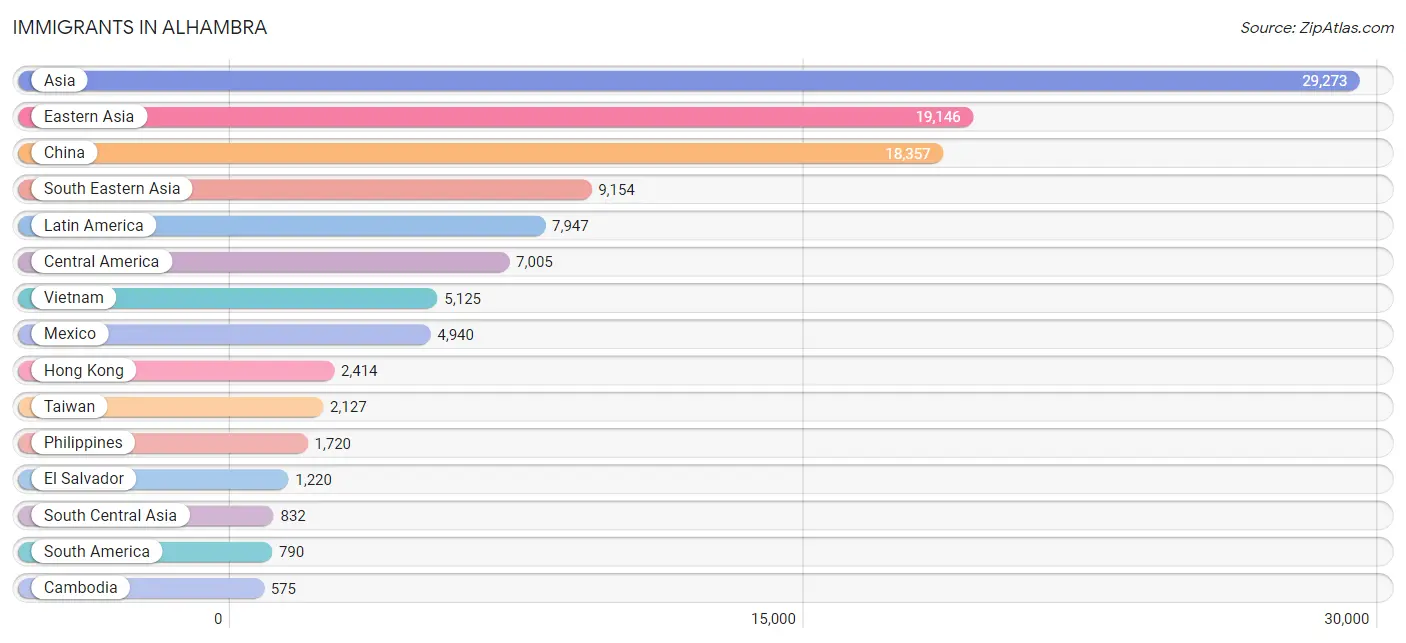
Immigrants in Alhambra
The most numerous immigrant groups reported in Alhambra came from Asia (29,273 | 35.6%), Eastern Asia (19,146 | 23.3%), China (18,357 | 22.3%), South Eastern Asia (9,154 | 11.1%), and Latin America (7,947 | 9.7%), together accounting for 101.9% of all Alhambra residents.
| Immigration Origin | # Population | % Population |
| Afghanistan | 13 | 0.0% |
| Africa | 116 | 0.1% |
| Argentina | 123 | 0.2% |
| Asia | 29,273 | 35.6% |
| Australia | 42 | 0.1% |
| Barbados | 1 | 0.0% |
| Belarus | 27 | 0.0% |
| Brazil | 52 | 0.1% |
| Bulgaria | 20 | 0.0% |
| Cambodia | 575 | 0.7% |
| Canada | 86 | 0.1% |
| Caribbean | 152 | 0.2% |
| Central America | 7,005 | 8.5% |
| Chile | 64 | 0.1% |
| China | 18,357 | 22.3% |
| Colombia | 133 | 0.2% |
| Costa Rica | 51 | 0.1% |
| Cuba | 59 | 0.1% |
| Dominican Republic | 92 | 0.1% |
| Eastern Africa | 26 | 0.0% |
| Eastern Asia | 19,146 | 23.3% |
| Eastern Europe | 85 | 0.1% |
| Ecuador | 126 | 0.2% |
| Egypt | 21 | 0.0% |
| El Salvador | 1,220 | 1.5% |
| England | 23 | 0.0% |
| Eritrea | 9 | 0.0% |
| Ethiopia | 17 | 0.0% |
| Europe | 527 | 0.6% |
| Fiji | 56 | 0.1% |
| France | 47 | 0.1% |
| Germany | 67 | 0.1% |
| Guatemala | 401 | 0.5% |
| Honduras | 193 | 0.2% |
| Hong Kong | 2,414 | 2.9% |
| India | 456 | 0.5% |
| Indonesia | 496 | 0.6% |
| Iran | 152 | 0.2% |
| Iraq | 10 | 0.0% |
| Ireland | 6 | 0.0% |
| Israel | 3 | 0.0% |
| Italy | 52 | 0.1% |
| Japan | 306 | 0.4% |
| Korea | 483 | 0.6% |
| Laos | 31 | 0.0% |
| Latin America | 7,947 | 9.7% |
| Lebanon | 33 | 0.0% |
| Malaysia | 379 | 0.5% |
| Mexico | 4,940 | 6.0% |
| Moldova | 12 | 0.0% |
| Nepal | 82 | 0.1% |
| Netherlands | 40 | 0.1% |
| Nicaragua | 188 | 0.2% |
| Nigeria | 8 | 0.0% |
| Northern Africa | 33 | 0.0% |
| Northern Europe | 158 | 0.2% |
| Oceania | 99 | 0.1% |
| Pakistan | 118 | 0.1% |
| Panama | 12 | 0.0% |
| Peru | 166 | 0.2% |
| Philippines | 1,720 | 2.1% |
| Poland | 17 | 0.0% |
| Russia | 9 | 0.0% |
| Scotland | 16 | 0.0% |
| Singapore | 22 | 0.0% |
| South Africa | 39 | 0.1% |
| South America | 790 | 1.0% |
| South Central Asia | 832 | 1.0% |
| South Eastern Asia | 9,154 | 11.1% |
| Southern Europe | 130 | 0.2% |
| Spain | 78 | 0.1% |
| Sri Lanka | 11 | 0.0% |
| Sudan | 12 | 0.0% |
| Sweden | 11 | 0.0% |
| Syria | 41 | 0.1% |
| Taiwan | 2,127 | 2.6% |
| Thailand | 290 | 0.4% |
| Turkey | 33 | 0.0% |
| Uruguay | 14 | 0.0% |
| Venezuela | 83 | 0.1% |
| Vietnam | 5,125 | 6.2% |
| Western Africa | 18 | 0.0% |
| Western Asia | 134 | 0.2% |
| Western Europe | 154 | 0.2% | View All 84 Rows |
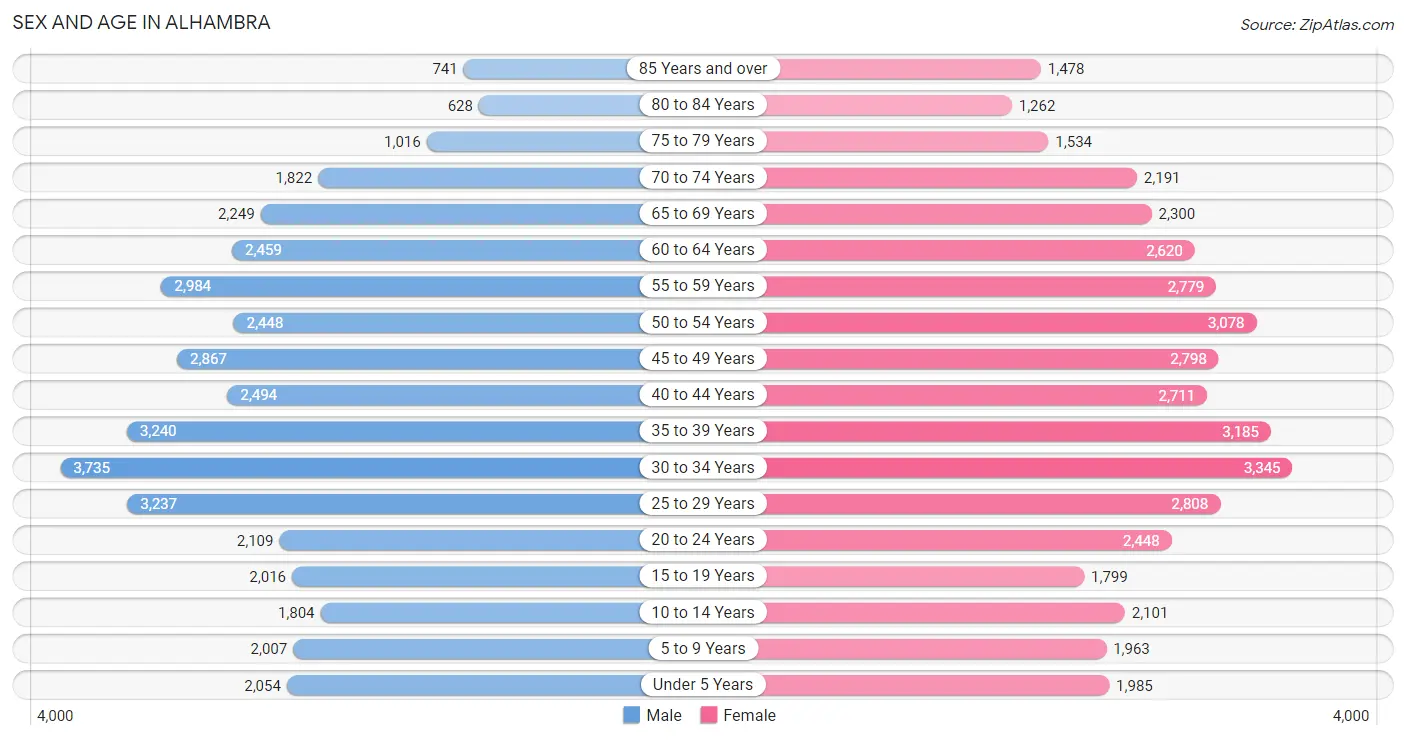
Sex and Age in Alhambra
Sex and Age in Alhambra
The most populous age groups in Alhambra are 30 to 34 Years (3,735 | 9.4%) for men and 30 to 34 Years (3,345 | 7.9%) for women.
| Age Bracket | Male | Female |
| Under 5 Years | 2,054 (5.1%) | 1,985 (4.7%) |
| 5 to 9 Years | 2,007 (5.0%) | 1,963 (4.6%) |
| 10 to 14 Years | 1,804 (4.5%) | 2,101 (5.0%) |
| 15 to 19 Years | 2,016 (5.1%) | 1,799 (4.2%) |
| 20 to 24 Years | 2,109 (5.3%) | 2,448 (5.8%) |
| 25 to 29 Years | 3,237 (8.1%) | 2,808 (6.6%) |
| 30 to 34 Years | 3,735 (9.4%) | 3,345 (7.9%) |
| 35 to 39 Years | 3,240 (8.1%) | 3,185 (7.5%) |
| 40 to 44 Years | 2,494 (6.2%) | 2,711 (6.4%) |
| 45 to 49 Years | 2,867 (7.2%) | 2,798 (6.6%) |
| 50 to 54 Years | 2,448 (6.1%) | 3,078 (7.3%) |
| 55 to 59 Years | 2,984 (7.5%) | 2,779 (6.6%) |
| 60 to 64 Years | 2,459 (6.2%) | 2,620 (6.2%) |
| 65 to 69 Years | 2,249 (5.6%) | 2,300 (5.4%) |
| 70 to 74 Years | 1,822 (4.6%) | 2,191 (5.2%) |
| 75 to 79 Years | 1,016 (2.5%) | 1,534 (3.6%) |
| 80 to 84 Years | 628 (1.6%) | 1,262 (3.0%) |
| 85 Years and over | 741 (1.9%) | 1,478 (3.5%) |
| Total | 39,910 (100.0%) | 42,385 (100.0%) |
Families and Households in Alhambra
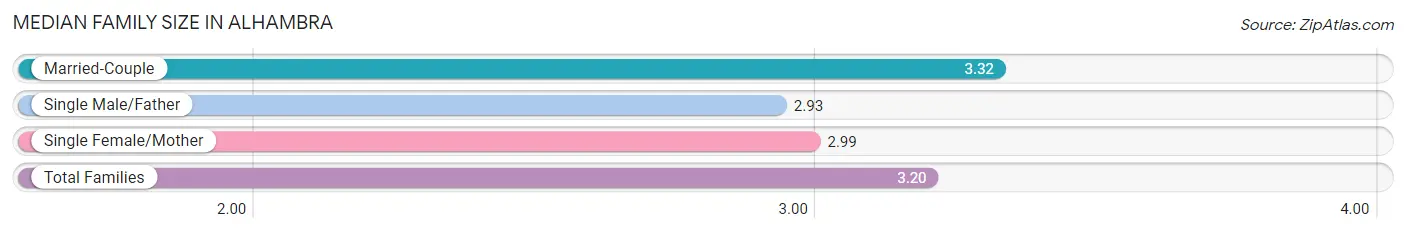
Median Family Size in Alhambra
The median family size in Alhambra is 3.20 persons per family, with married-couple families (13,879 | 67.4%) accounting for the largest median family size of 3.32 persons per family. On the other hand, single male/father families (2,175 | 10.6%) represent the smallest median family size with 2.93 persons per family.
| Family Type | # Families | Family Size |
| Married-Couple | 13,879 (67.4%) | 3.32 |
| Single Male/Father | 2,175 (10.6%) | 2.93 |
| Single Female/Mother | 4,538 (22.0%) | 2.99 |
| Total Families | 20,592 (100.0%) | 3.20 |
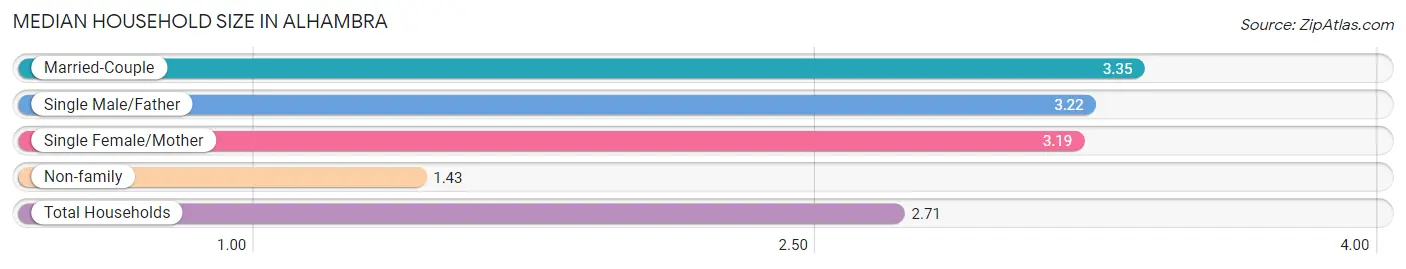
Median Household Size in Alhambra
The median household size in Alhambra is 2.71 persons per household, with married-couple households (13,879 | 46.2%) accounting for the largest median household size of 3.35 persons per household. non-family households (9,462 | 31.5%) represent the smallest median household size with 1.43 persons per household.
| Household Type | # Households | Household Size |
| Married-Couple | 13,879 (46.2%) | 3.35 |
| Single Male/Father | 2,175 (7.2%) | 3.22 |
| Single Female/Mother | 4,538 (15.1%) | 3.19 |
| Non-family | 9,462 (31.5%) | 1.43 |
| Total Households | 30,054 (100.0%) | 2.71 |
Household Size by Marriage Status in Alhambra
Out of a total of 30,054 households in Alhambra, 20,592 (68.5%) are family households, while 9,462 (31.5%) are nonfamily households. The most numerous type of family households are 2-person households, comprising 8,051, and the most common type of nonfamily households are 1-person households, comprising 6,911.
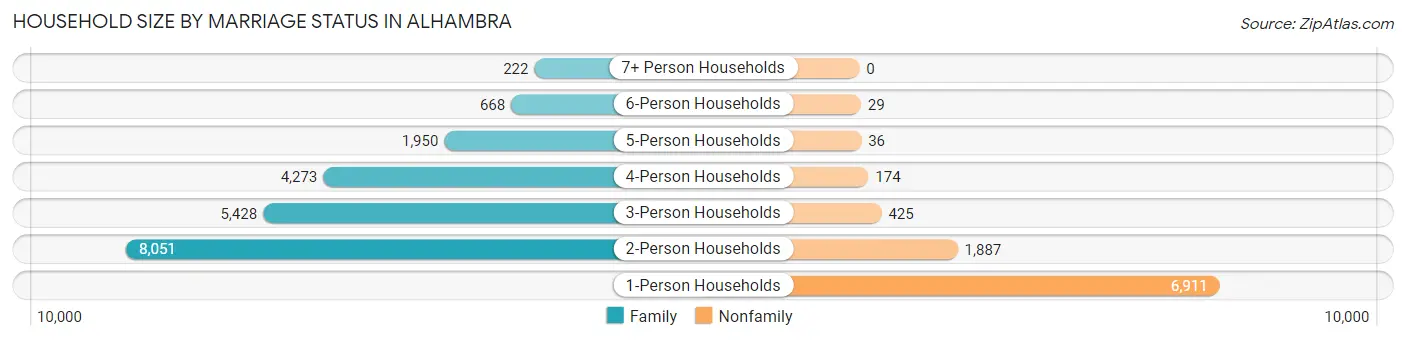
| Household Size | Family Households | Nonfamily Households |
| 1-Person Households | - | 6,911 (23.0%) |
| 2-Person Households | 8,051 (26.8%) | 1,887 (6.3%) |
| 3-Person Households | 5,428 (18.1%) | 425 (1.4%) |
| 4-Person Households | 4,273 (14.2%) | 174 (0.6%) |
| 5-Person Households | 1,950 (6.5%) | 36 (0.1%) |
| 6-Person Households | 668 (2.2%) | 29 (0.1%) |
| 7+ Person Households | 222 (0.7%) | 0 (0.0%) |
| Total | 20,592 (68.5%) | 9,462 (31.5%) |
Female Fertility in Alhambra
Fertility by Age in Alhambra
Average fertility rate in Alhambra is 46.0 births per 1,000 women. Women in the age bracket of 20 to 34 years have the highest fertility rate with 69.0 births per 1,000 women. Women in the age bracket of 20 to 34 years acount for 65.0% of all women with births.
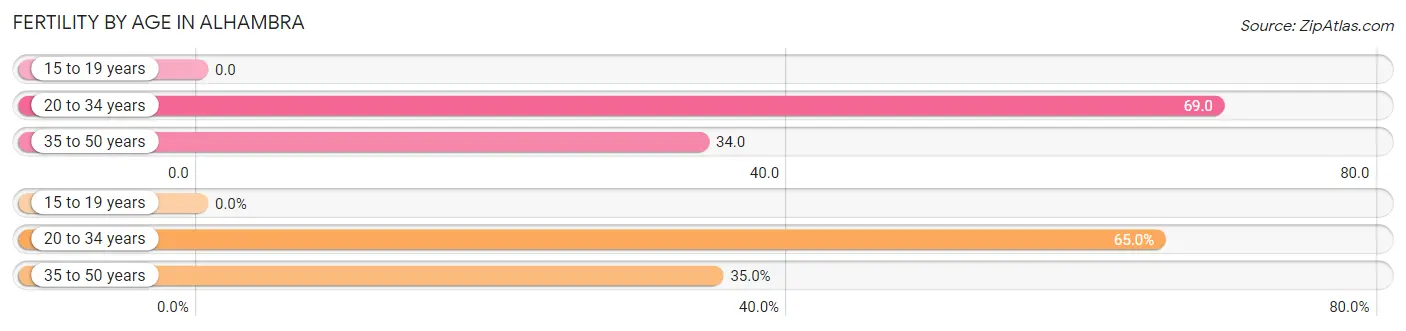
| Age Bracket | Women with Births | Births / 1,000 Women |
| 15 to 19 years | 0 (0.0%) | 0.0 |
| 20 to 34 years | 593 (65.0%) | 69.0 |
| 35 to 50 years | 319 (35.0%) | 34.0 |
| Total | 912 (100.0%) | 46.0 |
Fertility by Age by Marriage Status in Alhambra
75.1% of women with births (912) in Alhambra are married. The highest percentage of unmarried women with births falls into 20 to 34 years age bracket with 30.2% of them unmarried at the time of birth, while the lowest percentage of unmarried women with births belong to 35 to 50 years age bracket with 15.0% of them unmarried.
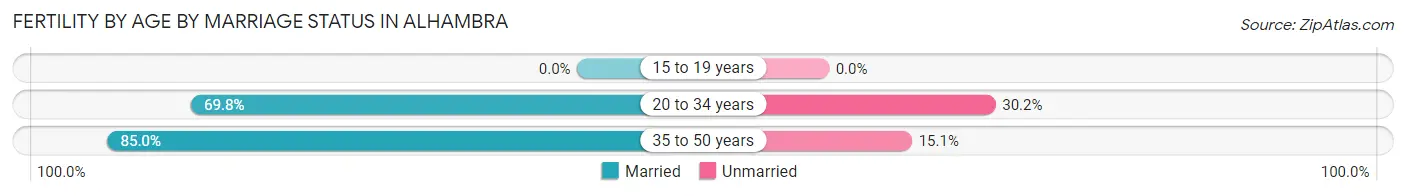
| Age Bracket | Married | Unmarried |
| 15 to 19 years | 0 (0.0%) | 0 (0.0%) |
| 20 to 34 years | 414 (69.8%) | 179 (30.2%) |
| 35 to 50 years | 271 (85.0%) | 48 (15.0%) |
| Total | 685 (75.1%) | 227 (24.9%) |
Fertility by Education in Alhambra
Average fertility rate in Alhambra is 46.0 births per 1,000 women. Women with the education attainment of graduate degree have the highest fertility rate of 64.0 births per 1,000 women, while women with the education attainment of less than high school have the lowest fertility at 14.0 births per 1,000 women. Women with the education attainment of bachelor's degree represent 34.3% of all women with births.
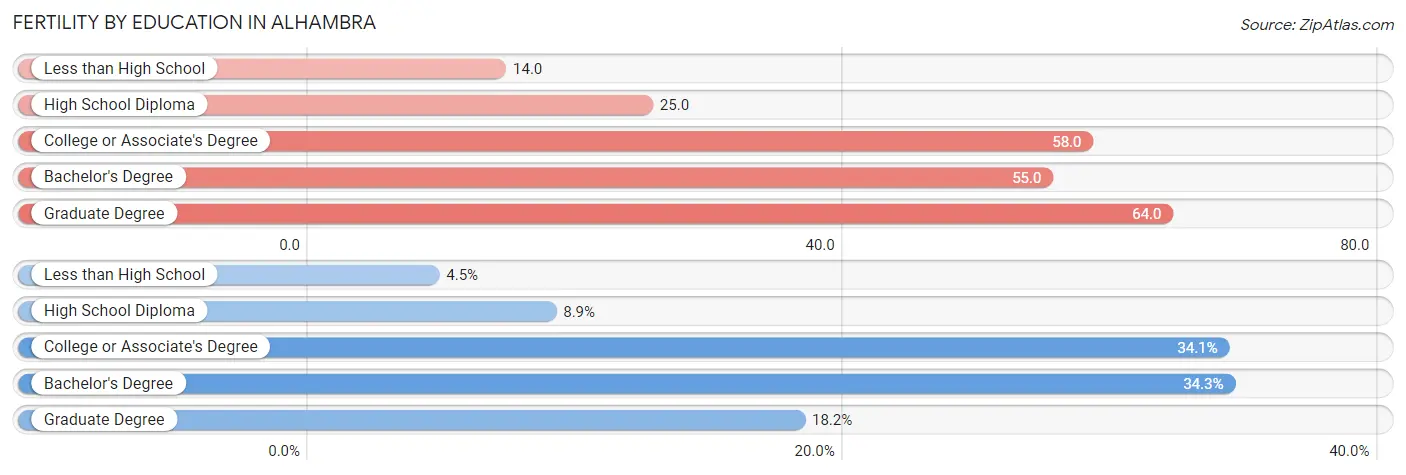
| Educational Attainment | Women with Births | Births / 1,000 Women |
| Less than High School | 41 (4.5%) | 14.0 |
| High School Diploma | 81 (8.9%) | 25.0 |
| College or Associate's Degree | 311 (34.1%) | 58.0 |
| Bachelor's Degree | 313 (34.3%) | 55.0 |
| Graduate Degree | 166 (18.2%) | 64.0 |
| Total | 912 (100.0%) | 46.0 |
Fertility by Education by Marriage Status in Alhambra
24.9% of women with births in Alhambra are unmarried. Women with the educational attainment of high school diploma are most likely to be married with 100.0% of them married at childbirth, while women with the educational attainment of college or associate's degree are least likely to be married with 35.0% of them unmarried at childbirth.
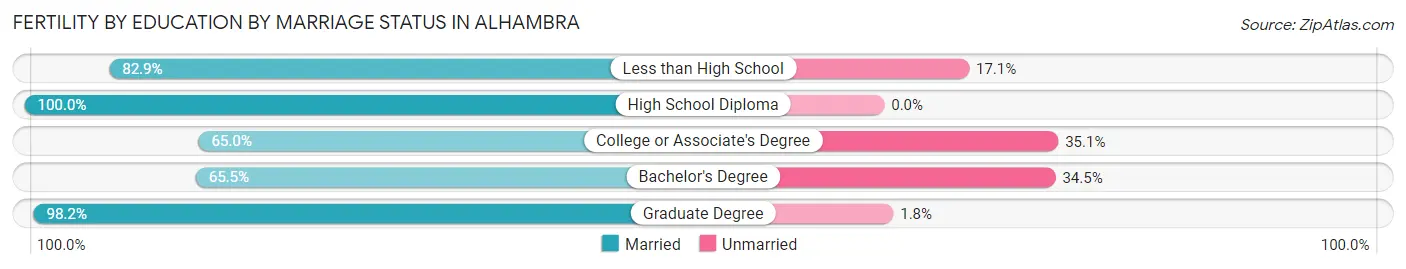
| Educational Attainment | Married | Unmarried |
| Less than High School | 34 (82.9%) | 7 (17.1%) |
| High School Diploma | 81 (100.0%) | 0 (0.0%) |
| College or Associate's Degree | 202 (64.9%) | 109 (35.0%) |
| Bachelor's Degree | 205 (65.5%) | 108 (34.5%) |
| Graduate Degree | 163 (98.2%) | 3 (1.8%) |
| Total | 685 (75.1%) | 227 (24.9%) |
Employment Characteristics in Alhambra
Employment by Class of Employer in Alhambra
Among the 40,563 employed individuals in Alhambra, private company employees (26,032 | 64.2%), local government employees (5,013 | 12.4%), and not-for-profit organizations (3,277 | 8.1%) make up the most common classes of employment.
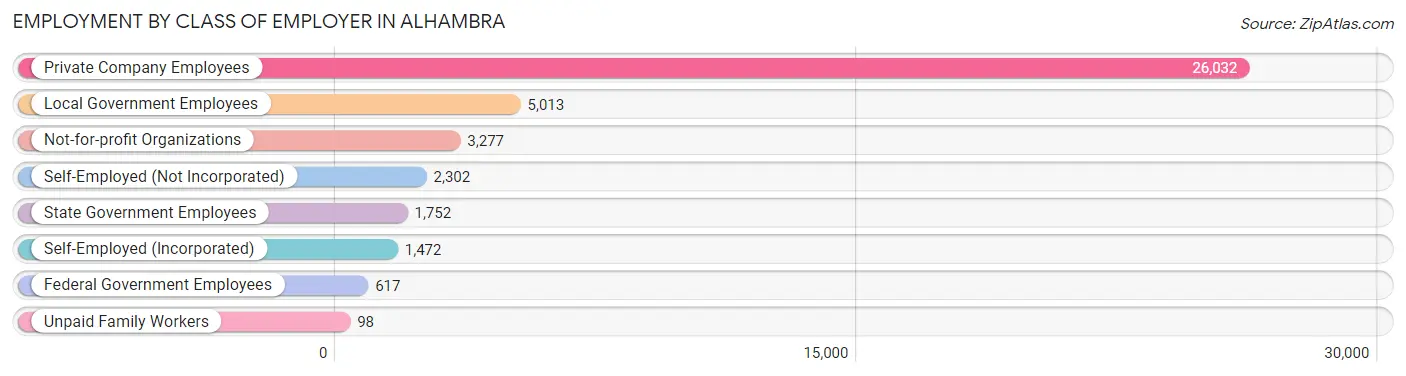
| Employer Class | # Employees | % Employees |
| Private Company Employees | 26,032 | 64.2% |
| Self-Employed (Incorporated) | 1,472 | 3.6% |
| Self-Employed (Not Incorporated) | 2,302 | 5.7% |
| Not-for-profit Organizations | 3,277 | 8.1% |
| Local Government Employees | 5,013 | 12.4% |
| State Government Employees | 1,752 | 4.3% |
| Federal Government Employees | 617 | 1.5% |
| Unpaid Family Workers | 98 | 0.2% |
| Total | 40,563 | 100.0% |
Employment Status by Age in Alhambra
According to the labor force statistics for Alhambra, out of the total population over 16 years of age (69,635), 62.9% or 43,800 individuals are in the labor force, with 5.5% or 2,409 of them unemployed. The age group with the highest labor force participation rate is 35 to 44 years, with 86.1% or 10,013 individuals in the labor force. Within the labor force, the 16 to 19 years age range has the highest percentage of unemployed individuals, with 23.0% or 84 of them being unemployed.
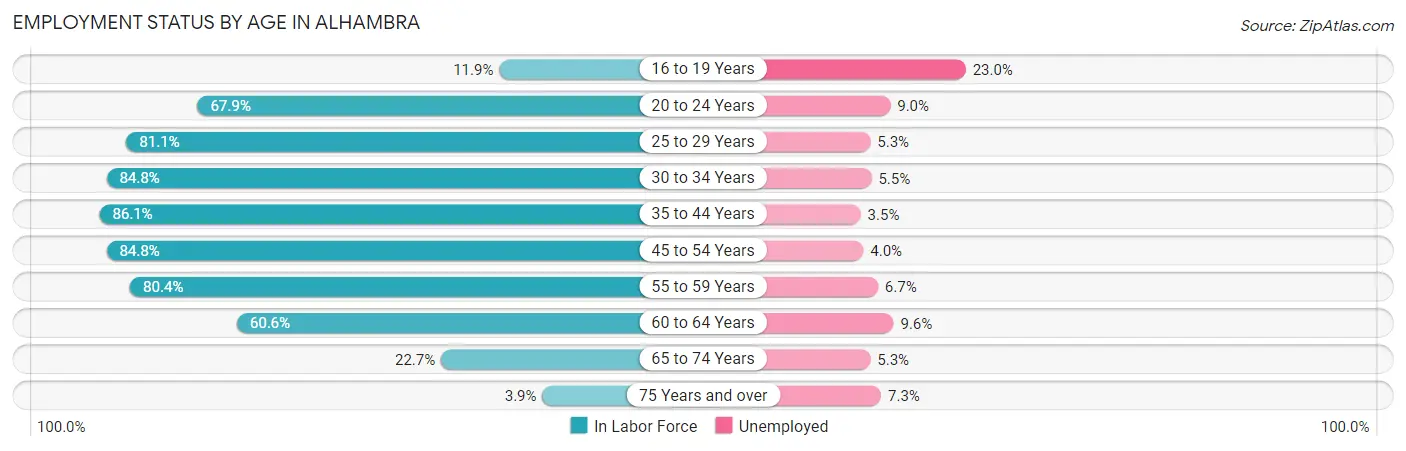
| Age Bracket | In Labor Force | Unemployed |
| 16 to 19 Years | 365 (11.9%) | 84 (23.0%) |
| 20 to 24 Years | 3,094 (67.9%) | 278 (9.0%) |
| 25 to 29 Years | 4,902 (81.1%) | 260 (5.3%) |
| 30 to 34 Years | 6,004 (84.8%) | 330 (5.5%) |
| 35 to 44 Years | 10,013 (86.1%) | 350 (3.5%) |
| 45 to 54 Years | 9,490 (84.8%) | 380 (4.0%) |
| 55 to 59 Years | 4,633 (80.4%) | 310 (6.7%) |
| 60 to 64 Years | 3,078 (60.6%) | 295 (9.6%) |
| 65 to 74 Years | 1,944 (22.7%) | 103 (5.3%) |
| 75 Years and over | 260 (3.9%) | 19 (7.3%) |
| Total | 43,800 (62.9%) | 2,409 (5.5%) |
Employment Status by Educational Attainment in Alhambra
According to labor force statistics for Alhambra, 81.5% of individuals (38,132) out of the total population between 25 and 64 years of age (46,788) are in the labor force, with 5.0% or 1,907 of them being unemployed. The group with the highest labor force participation rate are those with the educational attainment of bachelor's degree or higher, with 86.5% or 17,364 individuals in the labor force. Within the labor force, individuals with high school diploma education have the highest percentage of unemployment, with 6.7% or 516 of them being unemployed.
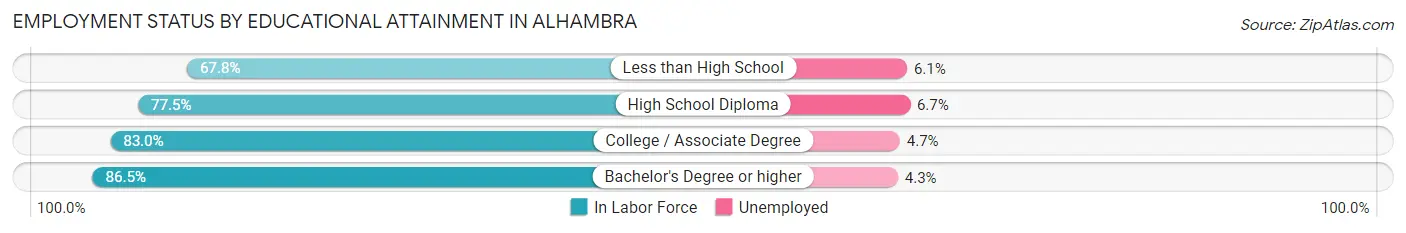
| Educational Attainment | In Labor Force | Unemployed |
| Less than High School | 3,812 (67.8%) | 343 (6.1%) |
| High School Diploma | 7,703 (77.5%) | 666 (6.7%) |
| College / Associate Degree | 9,257 (83.0%) | 524 (4.7%) |
| Bachelor's Degree or higher | 17,364 (86.5%) | 863 (4.3%) |
| Total | 38,132 (81.5%) | 2,339 (5.0%) |
Employment Occupations by Sex in Alhambra
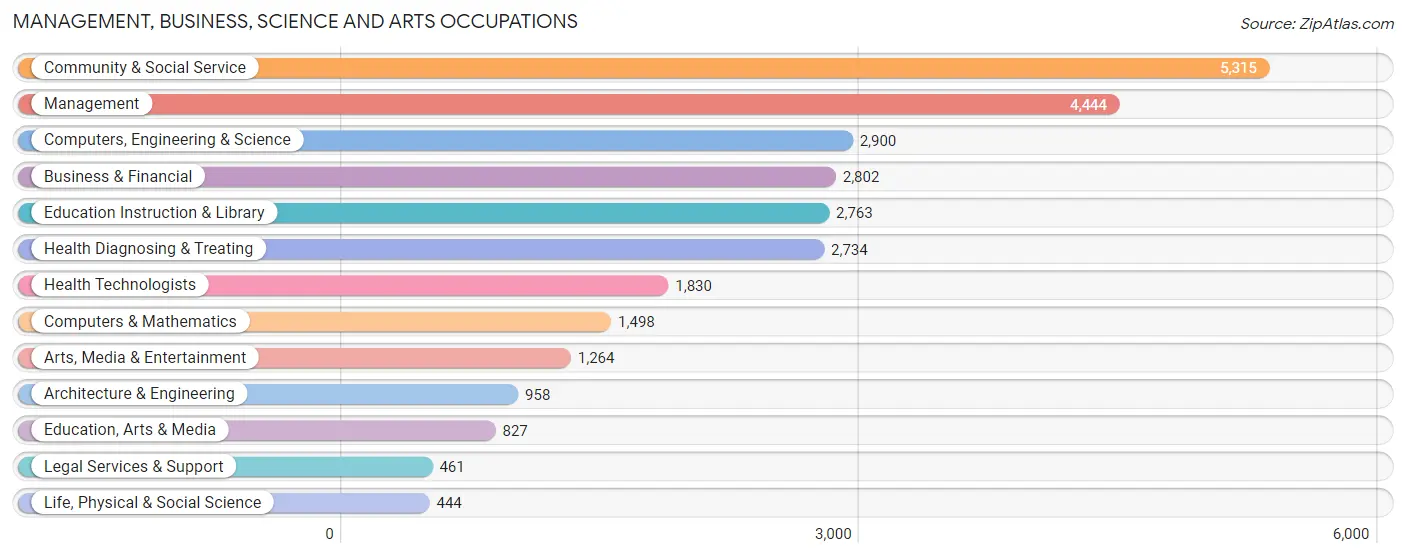
Management, Business, Science and Arts Occupations
The most common Management, Business, Science and Arts occupations in Alhambra are Community & Social Service (5,315 | 12.9%), Management (4,444 | 10.8%), Computers, Engineering & Science (2,900 | 7.0%), Business & Financial (2,802 | 6.8%), and Education Instruction & Library (2,763 | 6.7%).
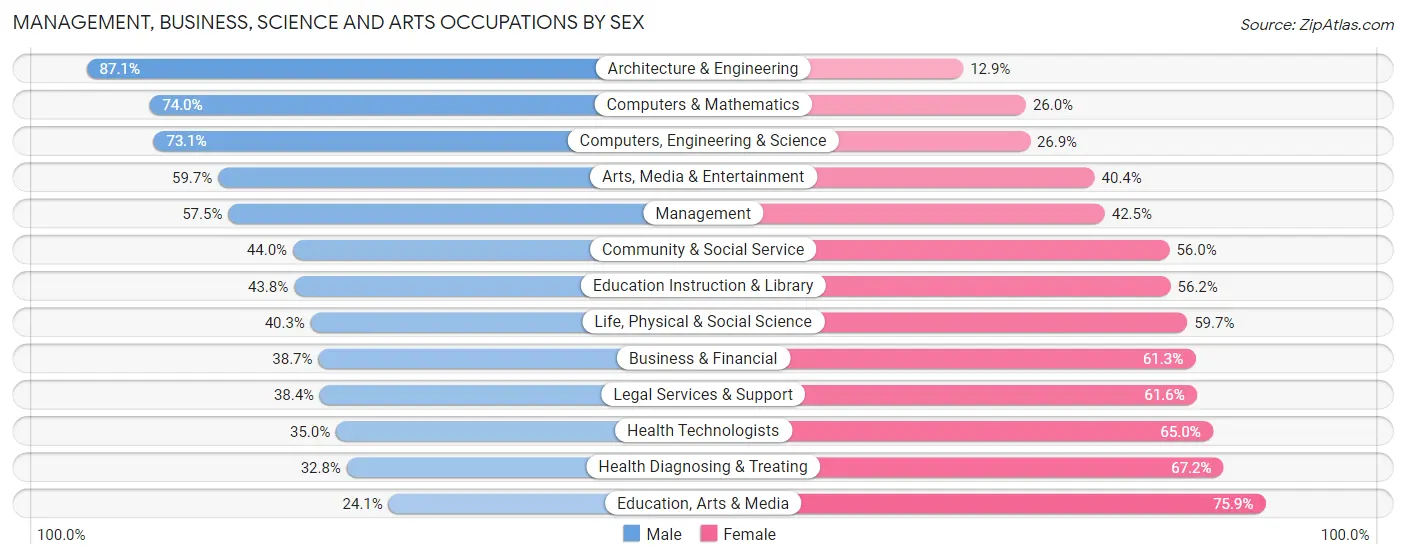
Management, Business, Science and Arts Occupations by Sex
Within the Management, Business, Science and Arts occupations in Alhambra, the most male-oriented occupations are Architecture & Engineering (87.1%), Computers & Mathematics (74.0%), and Computers, Engineering & Science (73.1%), while the most female-oriented occupations are Education, Arts & Media (75.9%), Health Diagnosing & Treating (67.2%), and Health Technologists (65.0%).
| Occupation | Male | Female |
| Management | 2,556 (57.5%) | 1,888 (42.5%) |
| Business & Financial | 1,085 (38.7%) | 1,717 (61.3%) |
| Computers, Engineering & Science | 2,121 (73.1%) | 779 (26.9%) |
| Computers & Mathematics | 1,108 (74.0%) | 390 (26.0%) |
| Architecture & Engineering | 834 (87.1%) | 124 (12.9%) |
| Life, Physical & Social Science | 179 (40.3%) | 265 (59.7%) |
| Community & Social Service | 2,340 (44.0%) | 2,975 (56.0%) |
| Education, Arts & Media | 199 (24.1%) | 628 (75.9%) |
| Legal Services & Support | 177 (38.4%) | 284 (61.6%) |
| Education Instruction & Library | 1,210 (43.8%) | 1,553 (56.2%) |
| Arts, Media & Entertainment | 754 (59.7%) | 510 (40.4%) |
| Health Diagnosing & Treating | 897 (32.8%) | 1,837 (67.2%) |
| Health Technologists | 641 (35.0%) | 1,189 (65.0%) |
| Total (Category) | 8,999 (49.5%) | 9,196 (50.5%) |
| Total (Overall) | 21,572 (52.2%) | 19,741 (47.8%) |
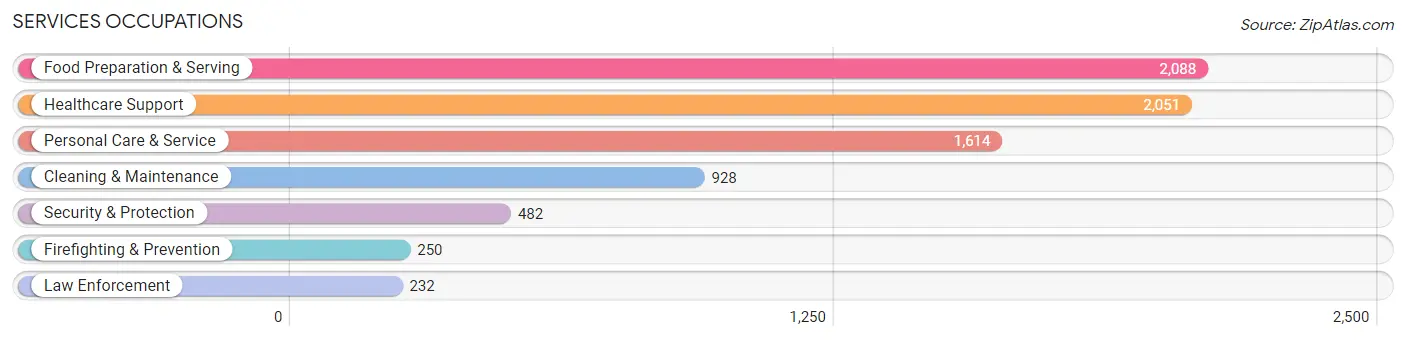
Services Occupations
The most common Services occupations in Alhambra are Food Preparation & Serving (2,088 | 5.1%), Healthcare Support (2,051 | 5.0%), Personal Care & Service (1,614 | 3.9%), Cleaning & Maintenance (928 | 2.2%), and Security & Protection (482 | 1.2%).
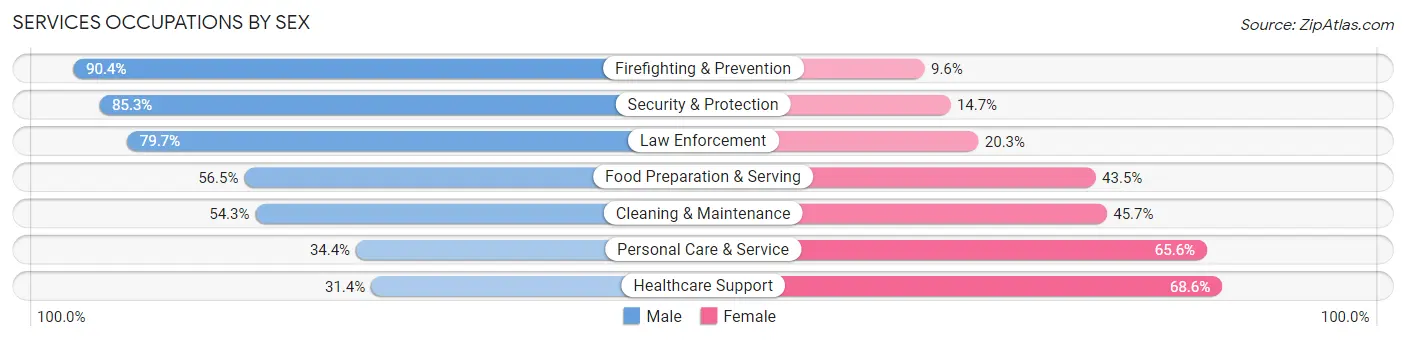
Services Occupations by Sex
Within the Services occupations in Alhambra, the most male-oriented occupations are Firefighting & Prevention (90.4%), Security & Protection (85.3%), and Law Enforcement (79.7%), while the most female-oriented occupations are Healthcare Support (68.6%), Personal Care & Service (65.6%), and Cleaning & Maintenance (45.7%).
| Occupation | Male | Female |
| Healthcare Support | 644 (31.4%) | 1,407 (68.6%) |
| Security & Protection | 411 (85.3%) | 71 (14.7%) |
| Firefighting & Prevention | 226 (90.4%) | 24 (9.6%) |
| Law Enforcement | 185 (79.7%) | 47 (20.3%) |
| Food Preparation & Serving | 1,180 (56.5%) | 908 (43.5%) |
| Cleaning & Maintenance | 504 (54.3%) | 424 (45.7%) |
| Personal Care & Service | 555 (34.4%) | 1,059 (65.6%) |
| Total (Category) | 3,294 (46.0%) | 3,869 (54.0%) |
| Total (Overall) | 21,572 (52.2%) | 19,741 (47.8%) |
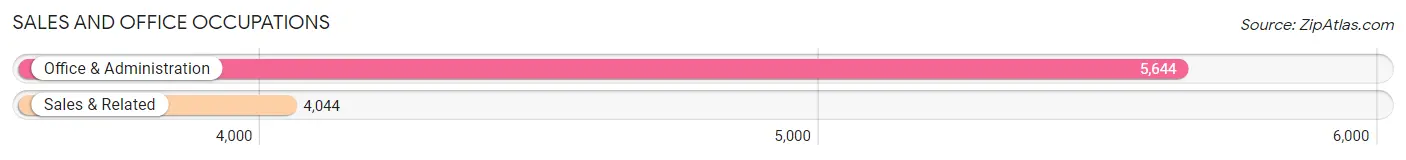
Sales and Office Occupations
The most common Sales and Office occupations in Alhambra are Office & Administration (5,644 | 13.7%), and Sales & Related (4,044 | 9.8%).
Sales and Office Occupations by Sex
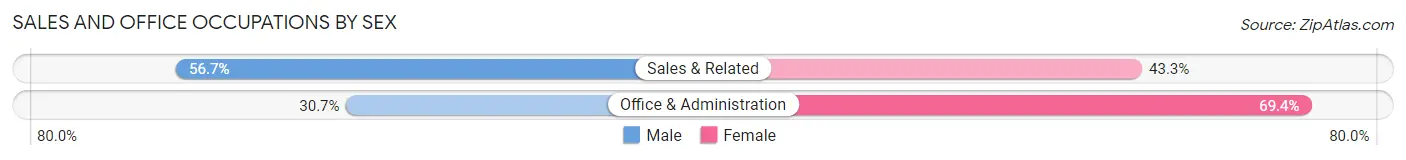
| Occupation | Male | Female |
| Sales & Related | 2,292 (56.7%) | 1,752 (43.3%) |
| Office & Administration | 1,730 (30.6%) | 3,914 (69.4%) |
| Total (Category) | 4,022 (41.5%) | 5,666 (58.5%) |
| Total (Overall) | 21,572 (52.2%) | 19,741 (47.8%) |
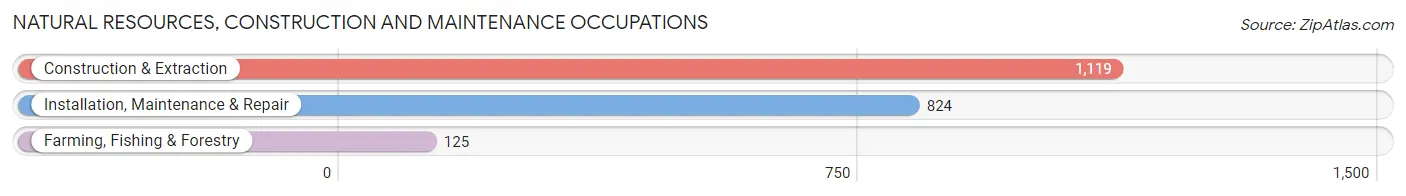
Natural Resources, Construction and Maintenance Occupations
The most common Natural Resources, Construction and Maintenance occupations in Alhambra are Construction & Extraction (1,119 | 2.7%), Installation, Maintenance & Repair (824 | 2.0%), and Farming, Fishing & Forestry (125 | 0.3%).
Natural Resources, Construction and Maintenance Occupations by Sex
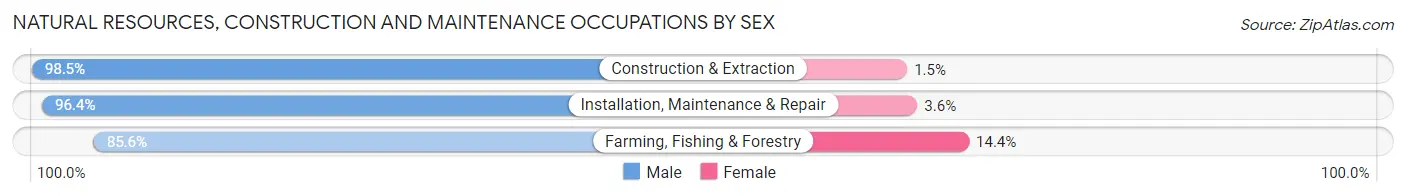
| Occupation | Male | Female |
| Farming, Fishing & Forestry | 107 (85.6%) | 18 (14.4%) |
| Construction & Extraction | 1,102 (98.5%) | 17 (1.5%) |
| Installation, Maintenance & Repair | 794 (96.4%) | 30 (3.6%) |
| Total (Category) | 2,003 (96.9%) | 65 (3.1%) |
| Total (Overall) | 21,572 (52.2%) | 19,741 (47.8%) |
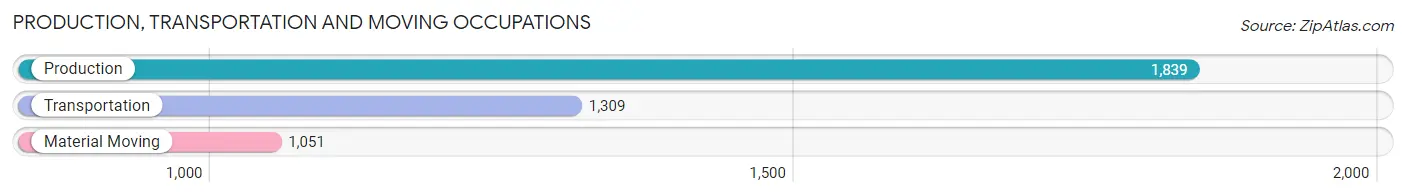
Production, Transportation and Moving Occupations
The most common Production, Transportation and Moving occupations in Alhambra are Production (1,839 | 4.4%), Transportation (1,309 | 3.2%), and Material Moving (1,051 | 2.5%).
Production, Transportation and Moving Occupations by Sex
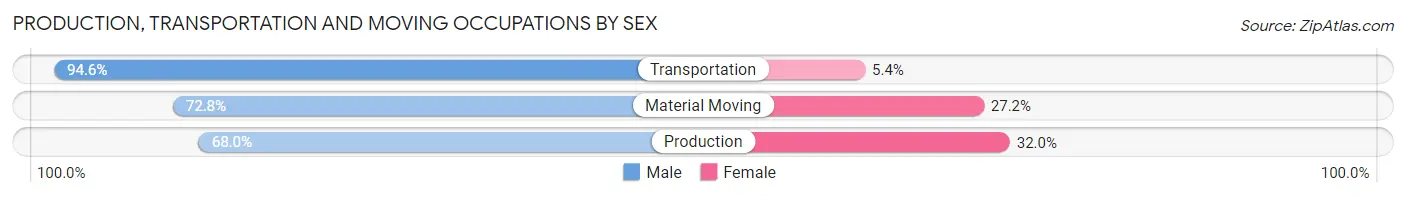
| Occupation | Male | Female |
| Production | 1,251 (68.0%) | 588 (32.0%) |
| Transportation | 1,238 (94.6%) | 71 (5.4%) |
| Material Moving | 765 (72.8%) | 286 (27.2%) |
| Total (Category) | 3,254 (77.5%) | 945 (22.5%) |
| Total (Overall) | 21,572 (52.2%) | 19,741 (47.8%) |
Employment Industries by Sex in Alhambra
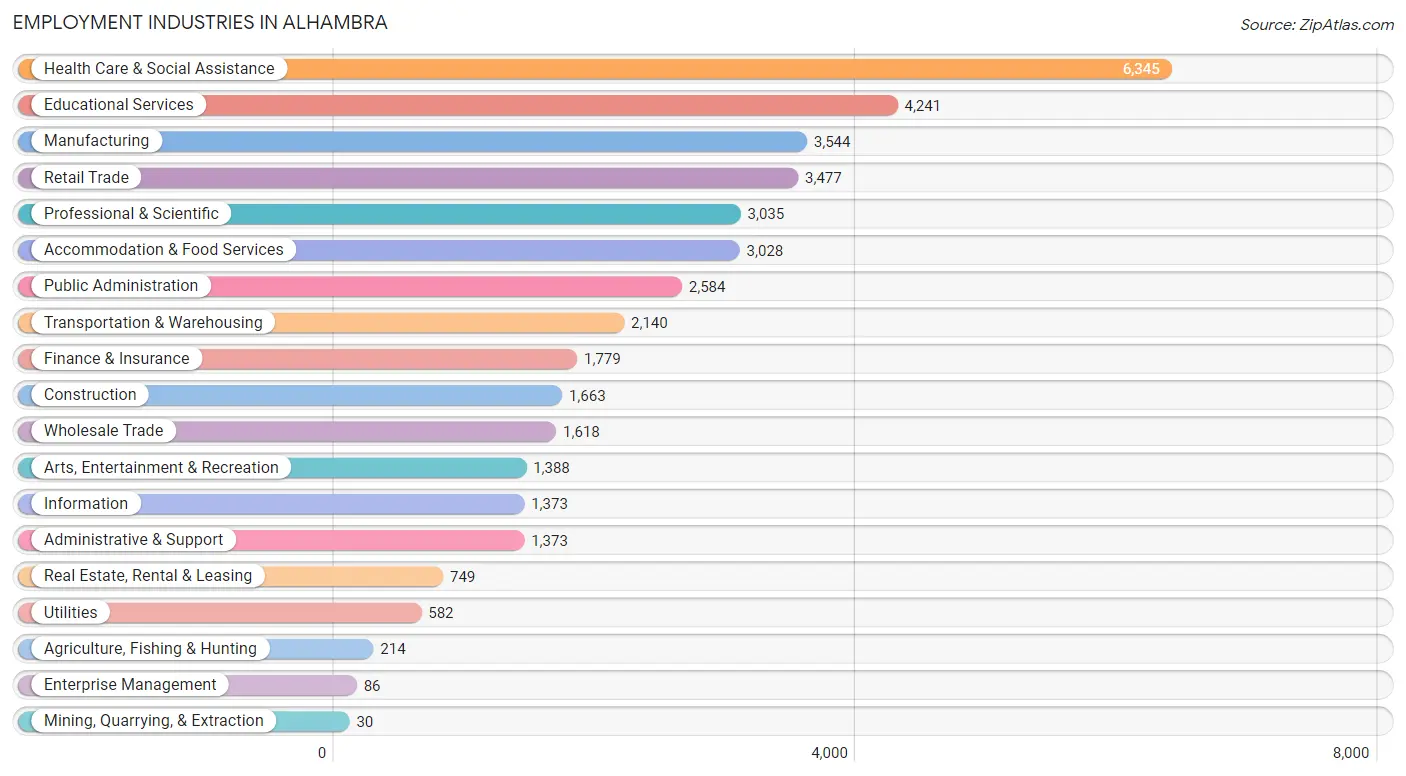
Employment Industries in Alhambra
The major employment industries in Alhambra include Health Care & Social Assistance (6,345 | 15.4%), Educational Services (4,241 | 10.3%), Manufacturing (3,544 | 8.6%), Retail Trade (3,477 | 8.4%), and Professional & Scientific (3,035 | 7.3%).
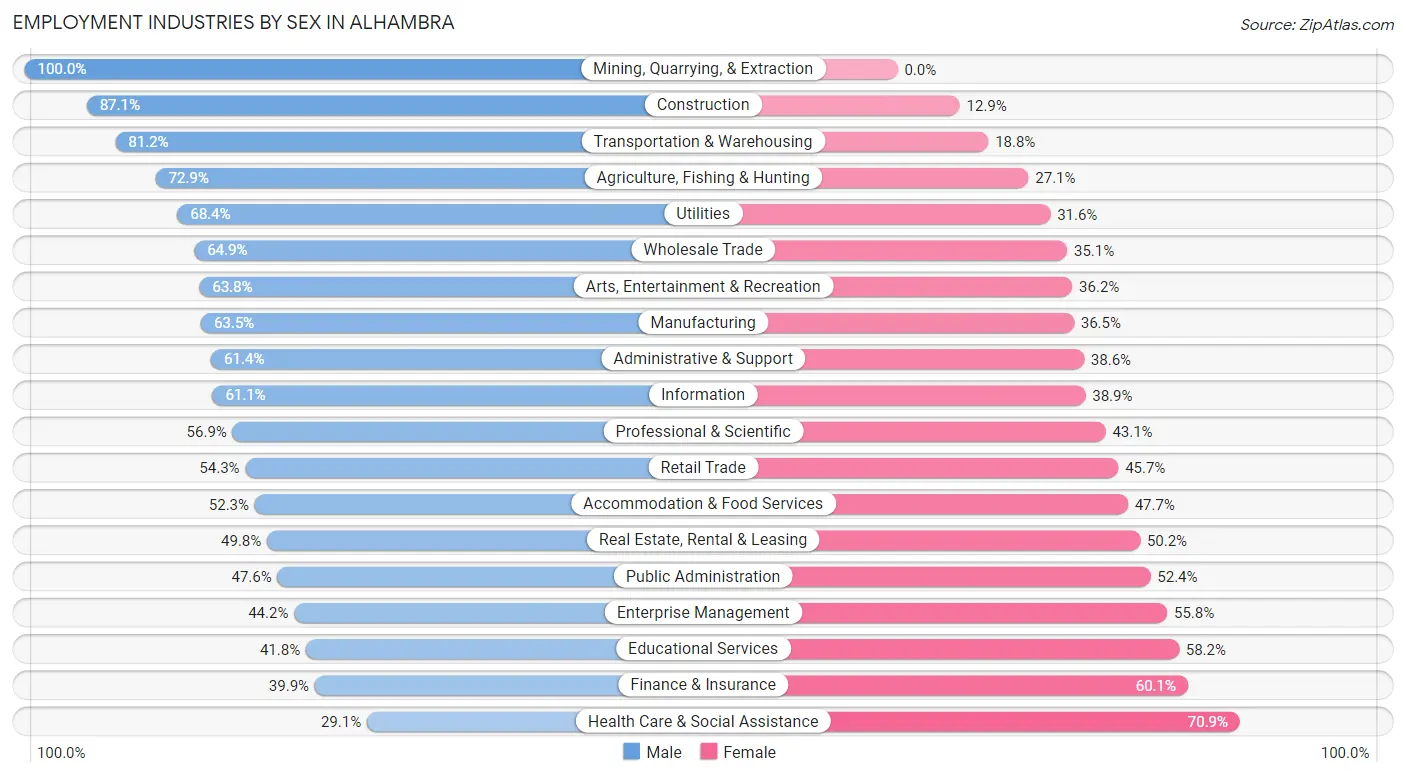
Employment Industries by Sex in Alhambra
The Alhambra industries that see more men than women are Mining, Quarrying, & Extraction (100.0%), Construction (87.1%), and Transportation & Warehousing (81.2%), whereas the industries that tend to have a higher number of women are Health Care & Social Assistance (70.9%), Finance & Insurance (60.1%), and Educational Services (58.2%).
| Industry | Male | Female |
| Agriculture, Fishing & Hunting | 156 (72.9%) | 58 (27.1%) |
| Mining, Quarrying, & Extraction | 30 (100.0%) | 0 (0.0%) |
| Construction | 1,449 (87.1%) | 214 (12.9%) |
| Manufacturing | 2,250 (63.5%) | 1,294 (36.5%) |
| Wholesale Trade | 1,050 (64.9%) | 568 (35.1%) |
| Retail Trade | 1,888 (54.3%) | 1,589 (45.7%) |
| Transportation & Warehousing | 1,738 (81.2%) | 402 (18.8%) |
| Utilities | 398 (68.4%) | 184 (31.6%) |
| Information | 839 (61.1%) | 534 (38.9%) |
| Finance & Insurance | 710 (39.9%) | 1,069 (60.1%) |
| Real Estate, Rental & Leasing | 373 (49.8%) | 376 (50.2%) |
| Professional & Scientific | 1,728 (56.9%) | 1,307 (43.1%) |
| Enterprise Management | 38 (44.2%) | 48 (55.8%) |
| Administrative & Support | 843 (61.4%) | 530 (38.6%) |
| Educational Services | 1,771 (41.8%) | 2,470 (58.2%) |
| Health Care & Social Assistance | 1,848 (29.1%) | 4,497 (70.9%) |
| Arts, Entertainment & Recreation | 886 (63.8%) | 502 (36.2%) |
| Accommodation & Food Services | 1,585 (52.3%) | 1,443 (47.7%) |
| Public Administration | 1,231 (47.6%) | 1,353 (52.4%) |
| Total | 21,572 (52.2%) | 19,741 (47.8%) |
Education in Alhambra
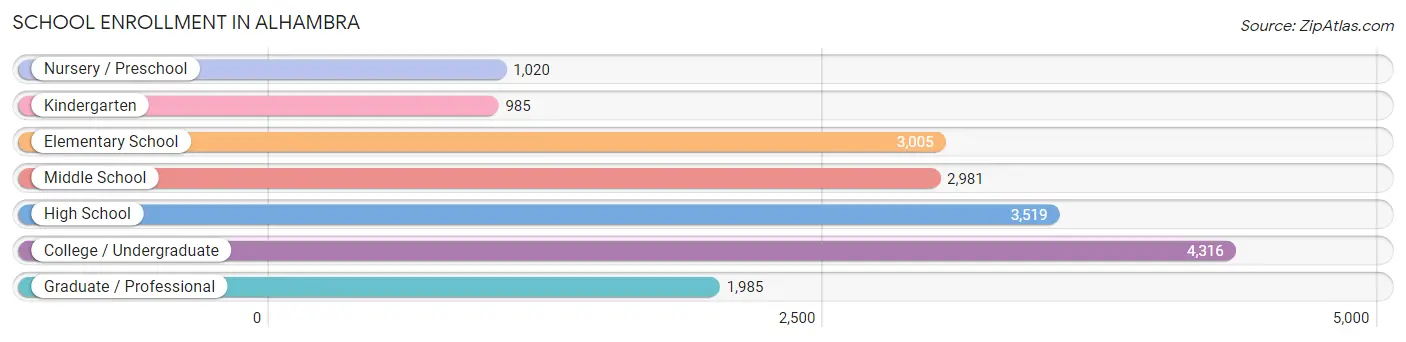
School Enrollment in Alhambra
The most common levels of schooling among the 17,811 students in Alhambra are college / undergraduate (4,316 | 24.2%), high school (3,519 | 19.8%), and elementary school (3,005 | 16.9%).
| School Level | # Students | % Students |
| Nursery / Preschool | 1,020 | 5.7% |
| Kindergarten | 985 | 5.5% |
| Elementary School | 3,005 | 16.9% |
| Middle School | 2,981 | 16.7% |
| High School | 3,519 | 19.8% |
| College / Undergraduate | 4,316 | 24.2% |
| Graduate / Professional | 1,985 | 11.1% |
| Total | 17,811 | 100.0% |
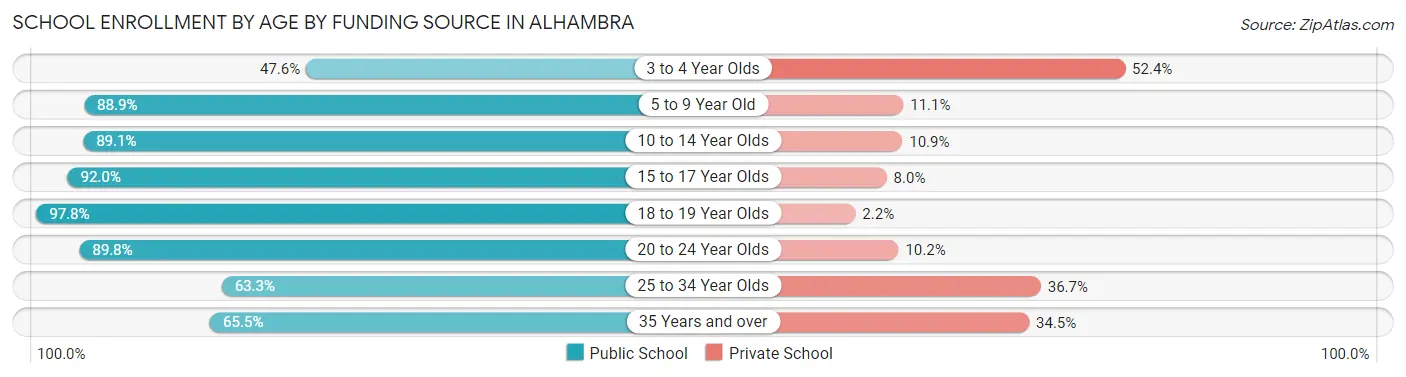
School Enrollment by Age by Funding Source in Alhambra
Out of a total of 17,811 students who are enrolled in schools in Alhambra, 2,939 (16.5%) attend a private institution, while the remaining 14,872 (83.5%) are enrolled in public schools. The age group of 3 to 4 year olds has the highest likelihood of being enrolled in private schools, with 399 (52.4% in the age bracket) enrolled. Conversely, the age group of 18 to 19 year olds has the lowest likelihood of being enrolled in a private school, with 1,028 (97.8% in the age bracket) attending a public institution.
| Age Bracket | Public School | Private School |
| 3 to 4 Year Olds | 362 (47.6%) | 399 (52.4%) |
| 5 to 9 Year Old | 3,421 (88.9%) | 427 (11.1%) |
| 10 to 14 Year Olds | 3,401 (89.1%) | 417 (10.9%) |
| 15 to 17 Year Olds | 2,378 (92.0%) | 207 (8.0%) |
| 18 to 19 Year Olds | 1,028 (97.8%) | 23 (2.2%) |
| 20 to 24 Year Olds | 2,040 (89.8%) | 232 (10.2%) |
| 25 to 34 Year Olds | 1,203 (63.3%) | 698 (36.7%) |
| 35 Years and over | 1,031 (65.5%) | 544 (34.5%) |
| Total | 14,872 (83.5%) | 2,939 (16.5%) |
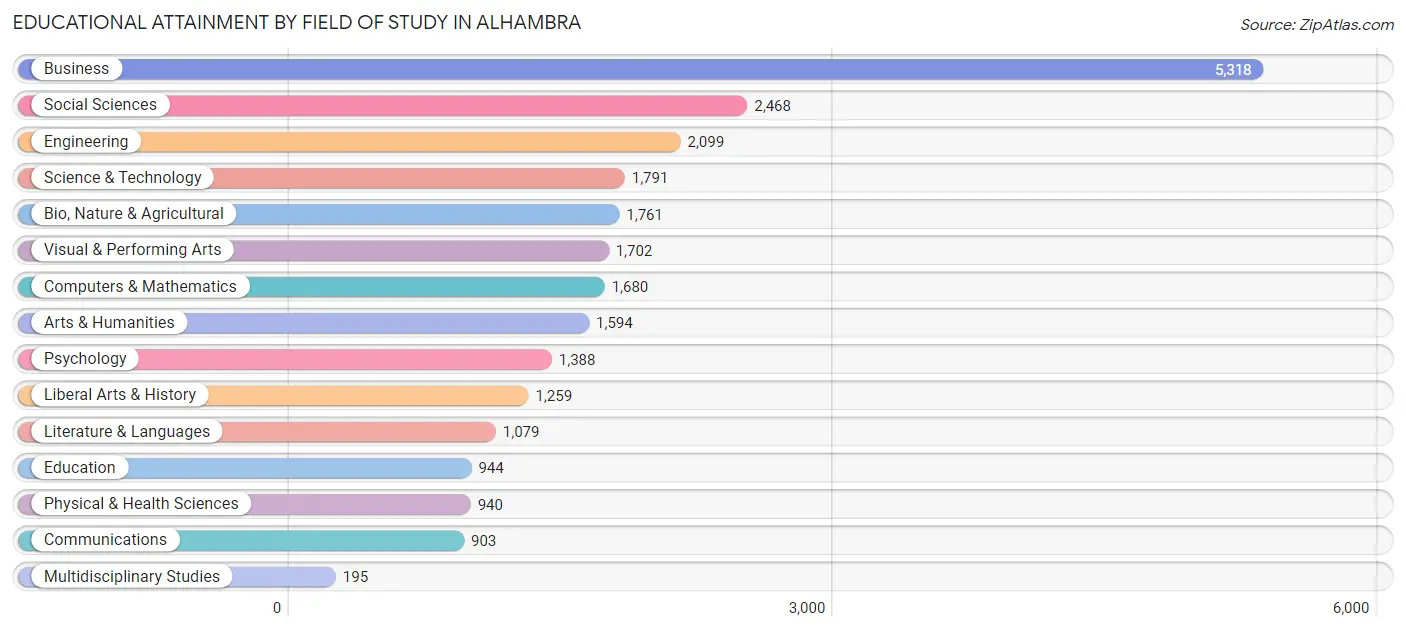
Educational Attainment by Field of Study in Alhambra
Business (5,318 | 21.2%), social sciences (2,468 | 9.8%), engineering (2,099 | 8.4%), science & technology (1,791 | 7.1%), and bio, nature & agricultural (1,761 | 7.0%) are the most common fields of study among 25,121 individuals in Alhambra who have obtained a bachelor's degree or higher.
| Field of Study | # Graduates | % Graduates |
| Computers & Mathematics | 1,680 | 6.7% |
| Bio, Nature & Agricultural | 1,761 | 7.0% |
| Physical & Health Sciences | 940 | 3.7% |
| Psychology | 1,388 | 5.5% |
| Social Sciences | 2,468 | 9.8% |
| Engineering | 2,099 | 8.4% |
| Multidisciplinary Studies | 195 | 0.8% |
| Science & Technology | 1,791 | 7.1% |
| Business | 5,318 | 21.2% |
| Education | 944 | 3.8% |
| Literature & Languages | 1,079 | 4.3% |
| Liberal Arts & History | 1,259 | 5.0% |
| Visual & Performing Arts | 1,702 | 6.8% |
| Communications | 903 | 3.6% |
| Arts & Humanities | 1,594 | 6.4% |
| Total | 25,121 | 100.0% |
Transportation & Commute in Alhambra
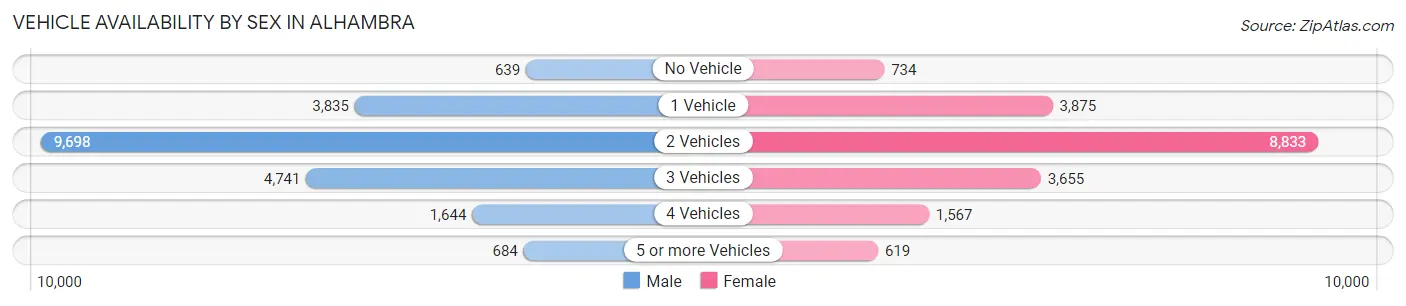
Vehicle Availability by Sex in Alhambra
The most prevalent vehicle ownership categories in Alhambra are males with 2 vehicles (9,698, accounting for 45.7%) and females with 2 vehicles (8,833, making up 50.3%).
| Vehicles Available | Male | Female |
| No Vehicle | 639 (3.0%) | 734 (3.8%) |
| 1 Vehicle | 3,835 (18.0%) | 3,875 (20.1%) |
| 2 Vehicles | 9,698 (45.7%) | 8,833 (45.8%) |
| 3 Vehicles | 4,741 (22.3%) | 3,655 (19.0%) |
| 4 Vehicles | 1,644 (7.7%) | 1,567 (8.1%) |
| 5 or more Vehicles | 684 (3.2%) | 619 (3.2%) |
| Total | 21,241 (100.0%) | 19,283 (100.0%) |
Commute Time in Alhambra
The most frequently occuring commute durations in Alhambra are 30 to 34 minutes (6,836 commuters, 19.0%), 20 to 24 minutes (5,434 commuters, 15.1%), and 15 to 19 minutes (4,346 commuters, 12.1%).
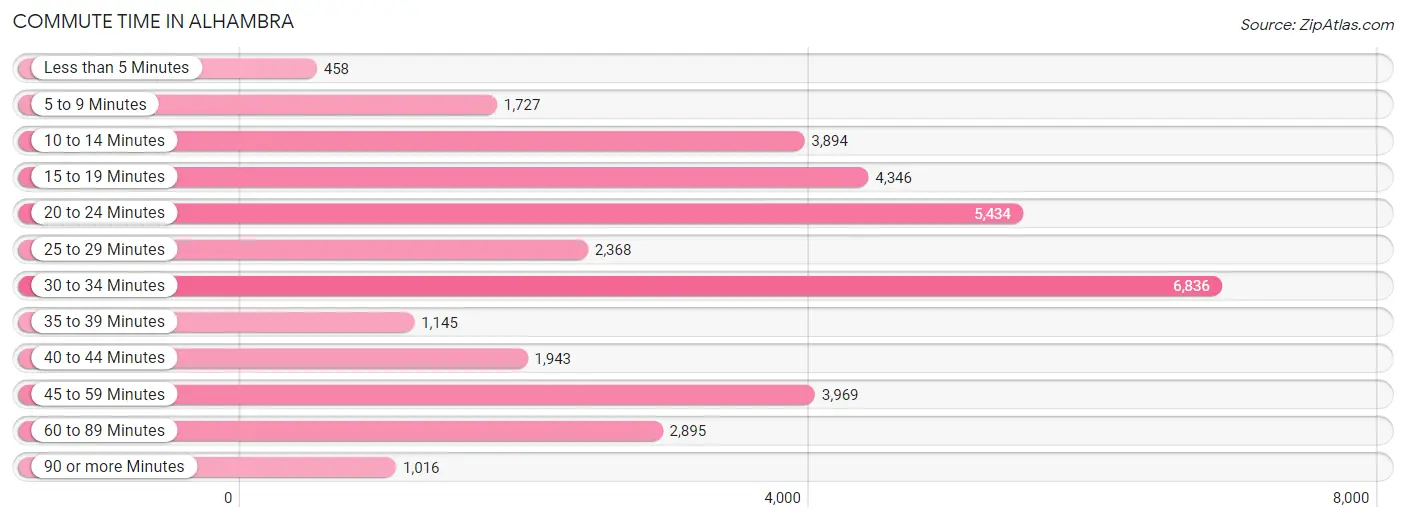
| Commute Time | # Commuters | % Commuters |
| Less than 5 Minutes | 458 | 1.3% |
| 5 to 9 Minutes | 1,727 | 4.8% |
| 10 to 14 Minutes | 3,894 | 10.8% |
| 15 to 19 Minutes | 4,346 | 12.1% |
| 20 to 24 Minutes | 5,434 | 15.1% |
| 25 to 29 Minutes | 2,368 | 6.6% |
| 30 to 34 Minutes | 6,836 | 19.0% |
| 35 to 39 Minutes | 1,145 | 3.2% |
| 40 to 44 Minutes | 1,943 | 5.4% |
| 45 to 59 Minutes | 3,969 | 11.0% |
| 60 to 89 Minutes | 2,895 | 8.0% |
| 90 or more Minutes | 1,016 | 2.8% |
Commute Time by Sex in Alhambra
The most common commute times in Alhambra are 30 to 34 minutes (3,814 commuters, 20.3%) for males and 30 to 34 minutes (3,022 commuters, 17.5%) for females.
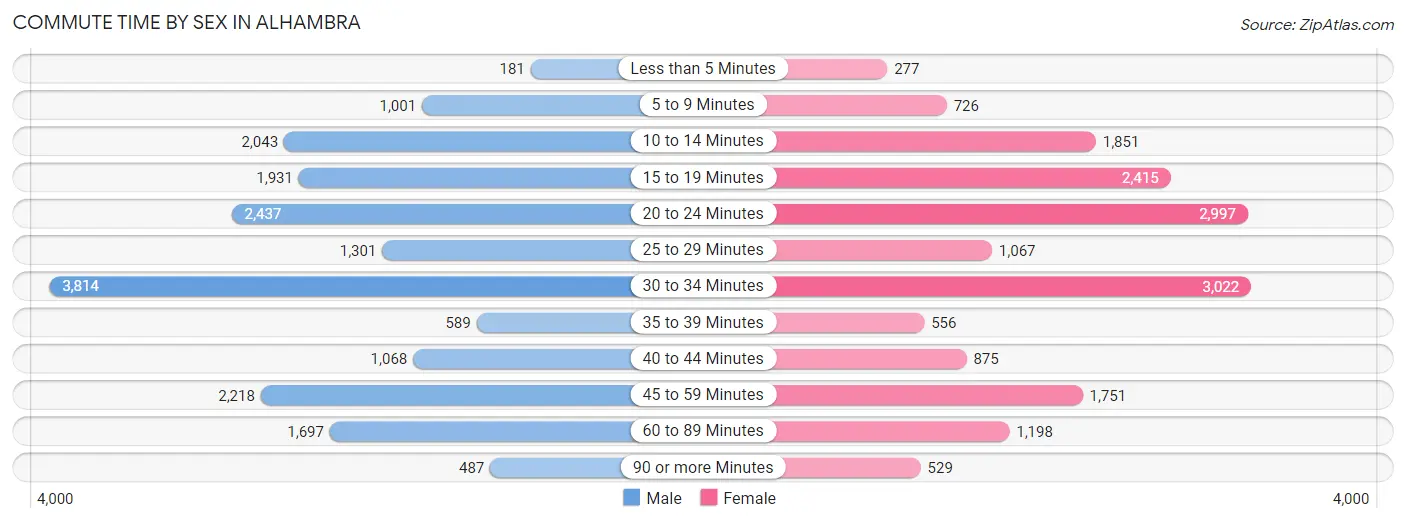
| Commute Time | Male | Female |
| Less than 5 Minutes | 181 (1.0%) | 277 (1.6%) |
| 5 to 9 Minutes | 1,001 (5.3%) | 726 (4.2%) |
| 10 to 14 Minutes | 2,043 (10.9%) | 1,851 (10.7%) |
| 15 to 19 Minutes | 1,931 (10.3%) | 2,415 (14.0%) |
| 20 to 24 Minutes | 2,437 (13.0%) | 2,997 (17.4%) |
| 25 to 29 Minutes | 1,301 (6.9%) | 1,067 (6.2%) |
| 30 to 34 Minutes | 3,814 (20.3%) | 3,022 (17.5%) |
| 35 to 39 Minutes | 589 (3.1%) | 556 (3.2%) |
| 40 to 44 Minutes | 1,068 (5.7%) | 875 (5.1%) |
| 45 to 59 Minutes | 2,218 (11.8%) | 1,751 (10.1%) |
| 60 to 89 Minutes | 1,697 (9.0%) | 1,198 (6.9%) |
| 90 or more Minutes | 487 (2.6%) | 529 (3.1%) |
Time of Departure to Work by Sex in Alhambra
The most frequent times of departure to work in Alhambra are 8:00 AM to 8:29 AM (2,477, 13.2%) for males and 8:00 AM to 8:29 AM (3,203, 18.5%) for females.
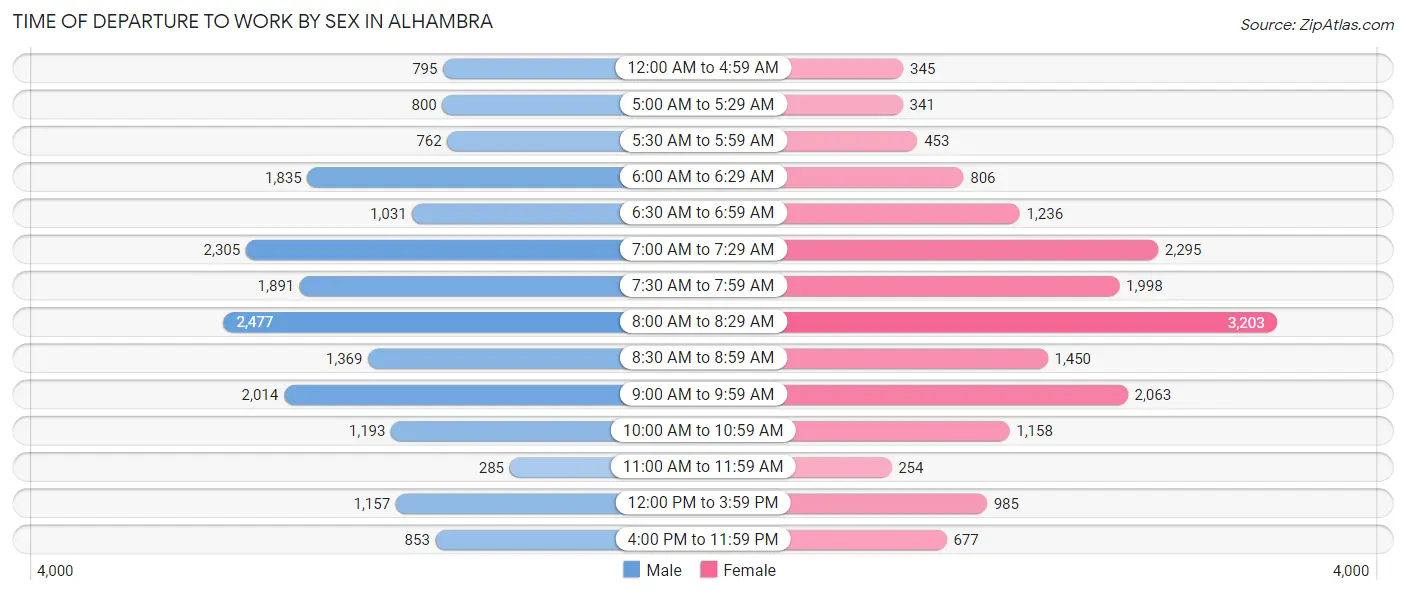
| Time of Departure | Male | Female |
| 12:00 AM to 4:59 AM | 795 (4.2%) | 345 (2.0%) |
| 5:00 AM to 5:29 AM | 800 (4.3%) | 341 (2.0%) |
| 5:30 AM to 5:59 AM | 762 (4.1%) | 453 (2.6%) |
| 6:00 AM to 6:29 AM | 1,835 (9.8%) | 806 (4.7%) |
| 6:30 AM to 6:59 AM | 1,031 (5.5%) | 1,236 (7.2%) |
| 7:00 AM to 7:29 AM | 2,305 (12.3%) | 2,295 (13.3%) |
| 7:30 AM to 7:59 AM | 1,891 (10.1%) | 1,998 (11.6%) |
| 8:00 AM to 8:29 AM | 2,477 (13.2%) | 3,203 (18.5%) |
| 8:30 AM to 8:59 AM | 1,369 (7.3%) | 1,450 (8.4%) |
| 9:00 AM to 9:59 AM | 2,014 (10.7%) | 2,063 (11.9%) |
| 10:00 AM to 10:59 AM | 1,193 (6.4%) | 1,158 (6.7%) |
| 11:00 AM to 11:59 AM | 285 (1.5%) | 254 (1.5%) |
| 12:00 PM to 3:59 PM | 1,157 (6.2%) | 985 (5.7%) |
| 4:00 PM to 11:59 PM | 853 (4.5%) | 677 (3.9%) |
| Total | 18,767 (100.0%) | 17,264 (100.0%) |
Housing Occupancy in Alhambra
Occupancy by Ownership in Alhambra
Of the total 30,054 dwellings in Alhambra, owner-occupied units account for 12,324 (41.0%), while renter-occupied units make up 17,730 (59.0%).
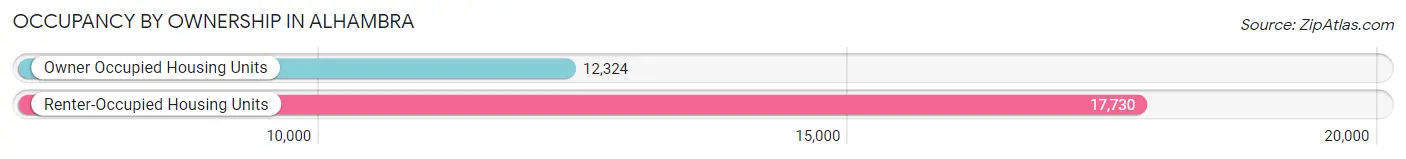
| Occupancy | # Housing Units | % Housing Units |
| Owner Occupied Housing Units | 12,324 | 41.0% |
| Renter-Occupied Housing Units | 17,730 | 59.0% |
| Total Occupied Housing Units | 30,054 | 100.0% |
Occupancy by Household Size in Alhambra
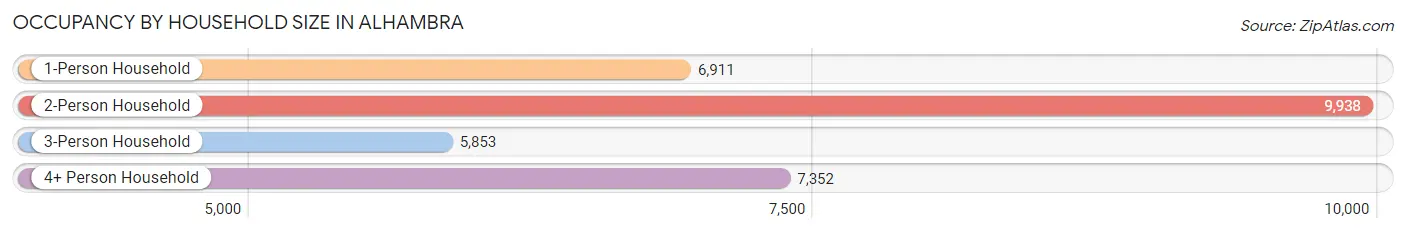
| Household Size | # Housing Units | % Housing Units |
| 1-Person Household | 6,911 | 23.0% |
| 2-Person Household | 9,938 | 33.1% |
| 3-Person Household | 5,853 | 19.5% |
| 4+ Person Household | 7,352 | 24.5% |
| Total Housing Units | 30,054 | 100.0% |
Occupancy by Ownership by Household Size in Alhambra
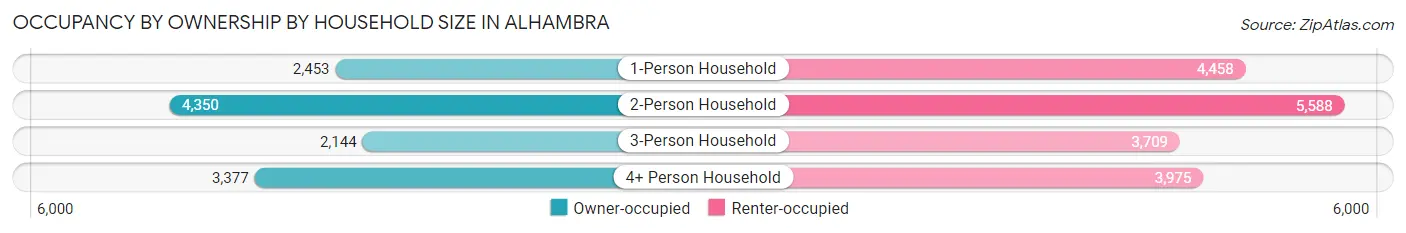
| Household Size | Owner-occupied | Renter-occupied |
| 1-Person Household | 2,453 (35.5%) | 4,458 (64.5%) |
| 2-Person Household | 4,350 (43.8%) | 5,588 (56.2%) |
| 3-Person Household | 2,144 (36.6%) | 3,709 (63.4%) |
| 4+ Person Household | 3,377 (45.9%) | 3,975 (54.1%) |
| Total Housing Units | 12,324 (41.0%) | 17,730 (59.0%) |
Occupancy by Educational Attainment in Alhambra
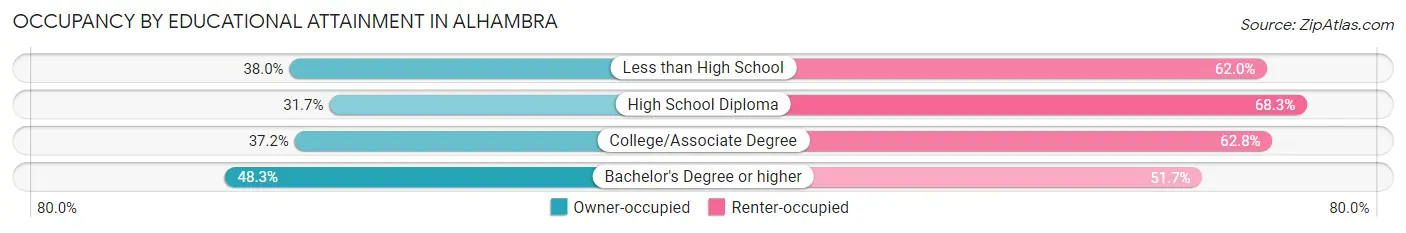
| Household Size | Owner-occupied | Renter-occupied |
| Less than High School | 1,320 (38.0%) | 2,155 (62.0%) |
| High School Diploma | 1,745 (31.7%) | 3,765 (68.3%) |
| College/Associate Degree | 3,042 (37.2%) | 5,145 (62.8%) |
| Bachelor's Degree or higher | 6,217 (48.3%) | 6,665 (51.7%) |
Occupancy by Age of Householder in Alhambra
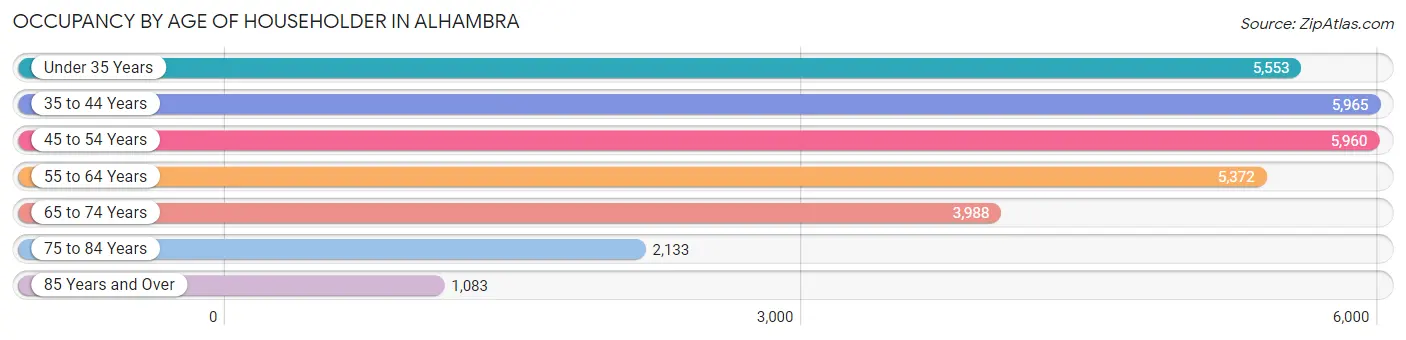
| Age Bracket | # Households | % Households |
| Under 35 Years | 5,553 | 18.5% |
| 35 to 44 Years | 5,965 | 19.9% |
| 45 to 54 Years | 5,960 | 19.8% |
| 55 to 64 Years | 5,372 | 17.9% |
| 65 to 74 Years | 3,988 | 13.3% |
| 75 to 84 Years | 2,133 | 7.1% |
| 85 Years and Over | 1,083 | 3.6% |
| Total | 30,054 | 100.0% |
Housing Finances in Alhambra
Median Income by Occupancy in Alhambra
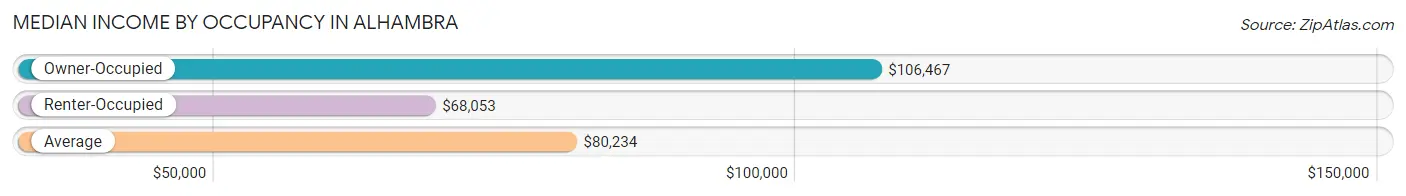
| Occupancy Type | # Households | Median Income |
| Owner-Occupied | 12,324 (41.0%) | $106,467 |
| Renter-Occupied | 17,730 (59.0%) | $68,053 |
| Average | 30,054 (100.0%) | $80,234 |
Occupancy by Householder Income Bracket in Alhambra
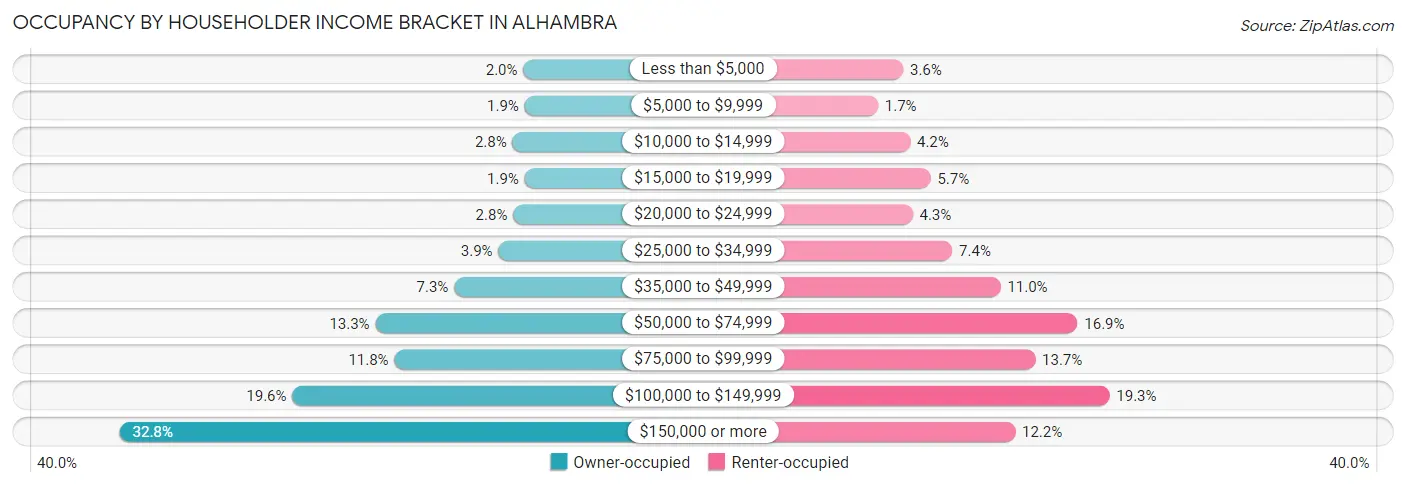
| Income Bracket | Owner-occupied | Renter-occupied |
| Less than $5,000 | 246 (2.0%) | 641 (3.6%) |
| $5,000 to $9,999 | 234 (1.9%) | 302 (1.7%) |
| $10,000 to $14,999 | 347 (2.8%) | 736 (4.2%) |
| $15,000 to $19,999 | 234 (1.9%) | 1,013 (5.7%) |
| $20,000 to $24,999 | 341 (2.8%) | 770 (4.3%) |
| $25,000 to $34,999 | 481 (3.9%) | 1,305 (7.4%) |
| $35,000 to $49,999 | 896 (7.3%) | 1,957 (11.0%) |
| $50,000 to $74,999 | 1,635 (13.3%) | 2,997 (16.9%) |
| $75,000 to $99,999 | 1,457 (11.8%) | 2,426 (13.7%) |
| $100,000 to $149,999 | 2,416 (19.6%) | 3,429 (19.3%) |
| $150,000 or more | 4,037 (32.8%) | 2,154 (12.1%) |
| Total | 12,324 (100.0%) | 17,730 (100.0%) |
Monthly Housing Cost Tiers in Alhambra
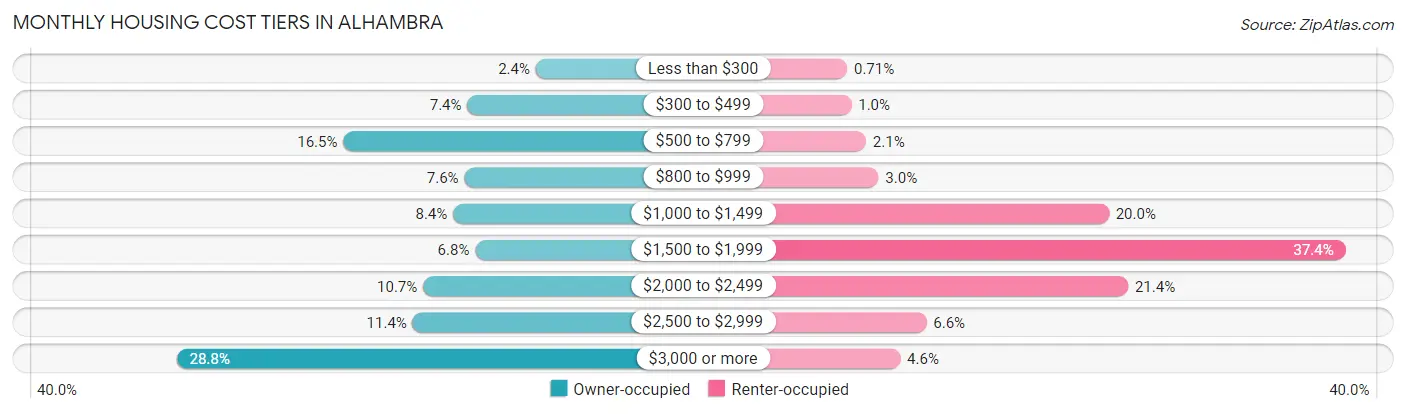
| Monthly Cost | Owner-occupied | Renter-occupied |
| Less than $300 | 290 (2.4%) | 126 (0.7%) |
| $300 to $499 | 911 (7.4%) | 180 (1.0%) |
| $500 to $799 | 2,037 (16.5%) | 373 (2.1%) |
| $800 to $999 | 938 (7.6%) | 535 (3.0%) |
| $1,000 to $1,499 | 1,040 (8.4%) | 3,542 (20.0%) |
| $1,500 to $1,999 | 839 (6.8%) | 6,634 (37.4%) |
| $2,000 to $2,499 | 1,312 (10.6%) | 3,794 (21.4%) |
| $2,500 to $2,999 | 1,407 (11.4%) | 1,162 (6.6%) |
| $3,000 or more | 3,550 (28.8%) | 820 (4.6%) |
| Total | 12,324 (100.0%) | 17,730 (100.0%) |
Physical Housing Characteristics in Alhambra
Housing Structures in Alhambra
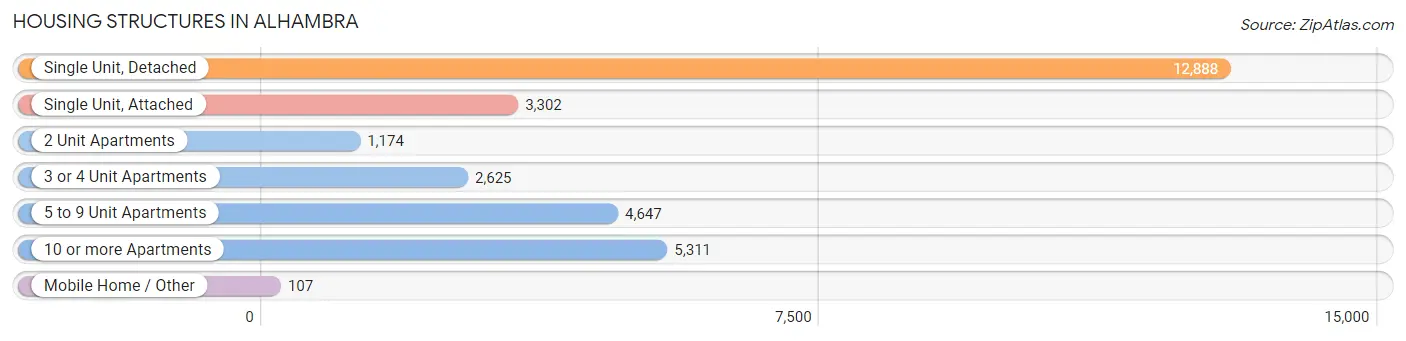
| Structure Type | # Housing Units | % Housing Units |
| Single Unit, Detached | 12,888 | 42.9% |
| Single Unit, Attached | 3,302 | 11.0% |
| 2 Unit Apartments | 1,174 | 3.9% |
| 3 or 4 Unit Apartments | 2,625 | 8.7% |
| 5 to 9 Unit Apartments | 4,647 | 15.5% |
| 10 or more Apartments | 5,311 | 17.7% |
| Mobile Home / Other | 107 | 0.4% |
| Total | 30,054 | 100.0% |
Housing Structures by Occupancy in Alhambra
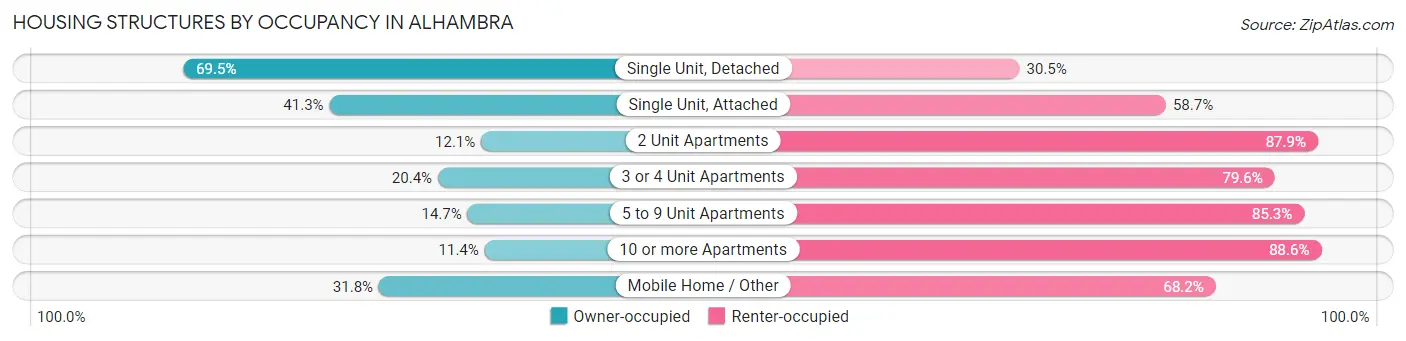
| Structure Type | Owner-occupied | Renter-occupied |
| Single Unit, Detached | 8,957 (69.5%) | 3,931 (30.5%) |
| Single Unit, Attached | 1,364 (41.3%) | 1,938 (58.7%) |
| 2 Unit Apartments | 142 (12.1%) | 1,032 (87.9%) |
| 3 or 4 Unit Apartments | 536 (20.4%) | 2,089 (79.6%) |
| 5 to 9 Unit Apartments | 684 (14.7%) | 3,963 (85.3%) |
| 10 or more Apartments | 607 (11.4%) | 4,704 (88.6%) |
| Mobile Home / Other | 34 (31.8%) | 73 (68.2%) |
| Total | 12,324 (41.0%) | 17,730 (59.0%) |
Housing Structures by Number of Rooms in Alhambra
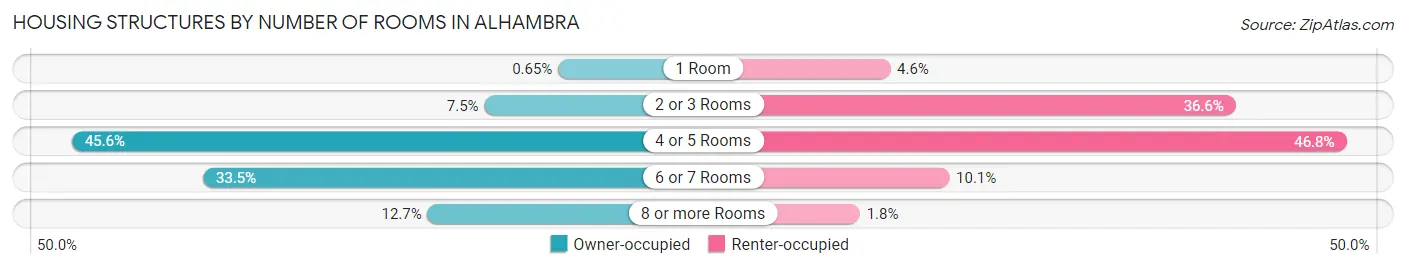
| Number of Rooms | Owner-occupied | Renter-occupied |
| 1 Room | 80 (0.6%) | 823 (4.6%) |
| 2 or 3 Rooms | 920 (7.5%) | 6,489 (36.6%) |
| 4 or 5 Rooms | 5,625 (45.6%) | 8,303 (46.8%) |
| 6 or 7 Rooms | 4,130 (33.5%) | 1,791 (10.1%) |
| 8 or more Rooms | 1,569 (12.7%) | 324 (1.8%) |
| Total | 12,324 (100.0%) | 17,730 (100.0%) |
Housing Structure by Heating Type in Alhambra
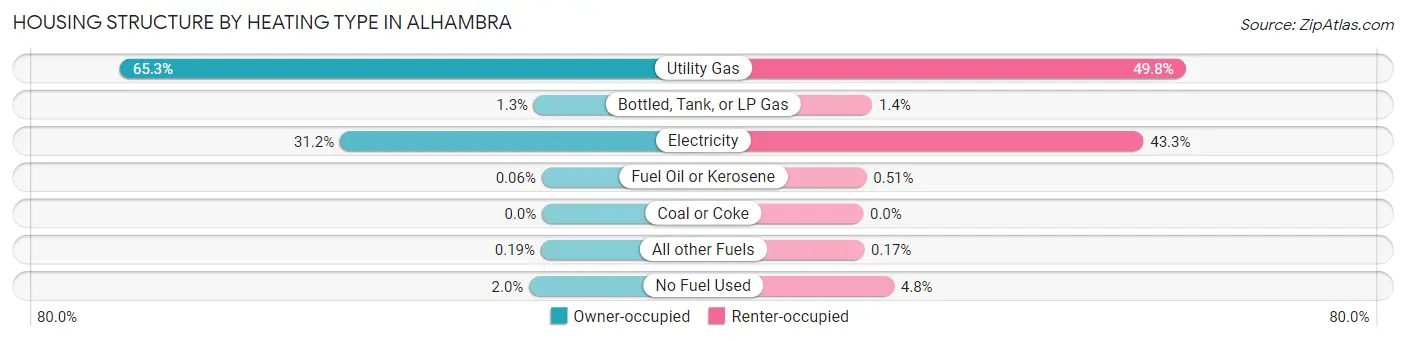
| Heating Type | Owner-occupied | Renter-occupied |
| Utility Gas | 8,044 (65.3%) | 8,836 (49.8%) |
| Bottled, Tank, or LP Gas | 155 (1.3%) | 248 (1.4%) |
| Electricity | 3,849 (31.2%) | 7,682 (43.3%) |
| Fuel Oil or Kerosene | 7 (0.1%) | 90 (0.5%) |
| Coal or Coke | 0 (0.0%) | 0 (0.0%) |
| All other Fuels | 23 (0.2%) | 30 (0.2%) |
| No Fuel Used | 246 (2.0%) | 844 (4.8%) |
| Total | 12,324 (100.0%) | 17,730 (100.0%) |
Household Vehicle Usage in Alhambra
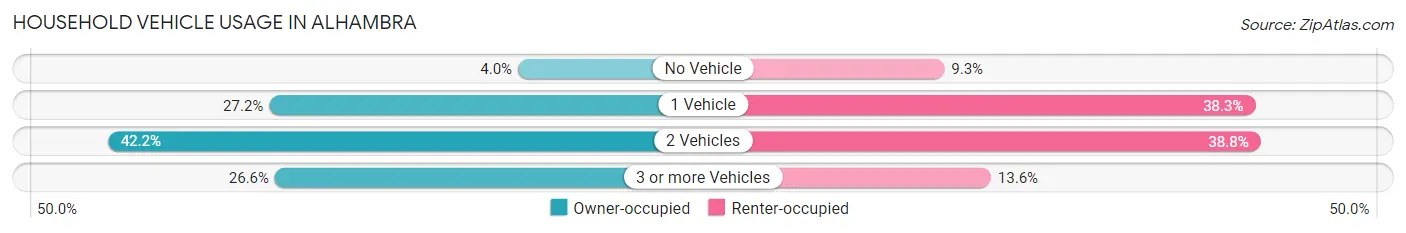
| Vehicles per Household | Owner-occupied | Renter-occupied |
| No Vehicle | 487 (4.0%) | 1,646 (9.3%) |
| 1 Vehicle | 3,348 (27.2%) | 6,790 (38.3%) |
| 2 Vehicles | 5,206 (42.2%) | 6,878 (38.8%) |
| 3 or more Vehicles | 3,283 (26.6%) | 2,416 (13.6%) |
| Total | 12,324 (100.0%) | 17,730 (100.0%) |
Real Estate & Mortgages in Alhambra
Real Estate and Mortgage Overview in Alhambra
| Characteristic | Without Mortgage | With Mortgage |
| Housing Units | 4,763 | 7,561 |
| Median Property Value | $718,900 | $795,700 |
| Median Household Income | $75,078 | $3,027 |
| Monthly Housing Costs | $702 | $3,550 |
| Real Estate Taxes | $4,312 | $62 |
Property Value by Mortgage Status in Alhambra
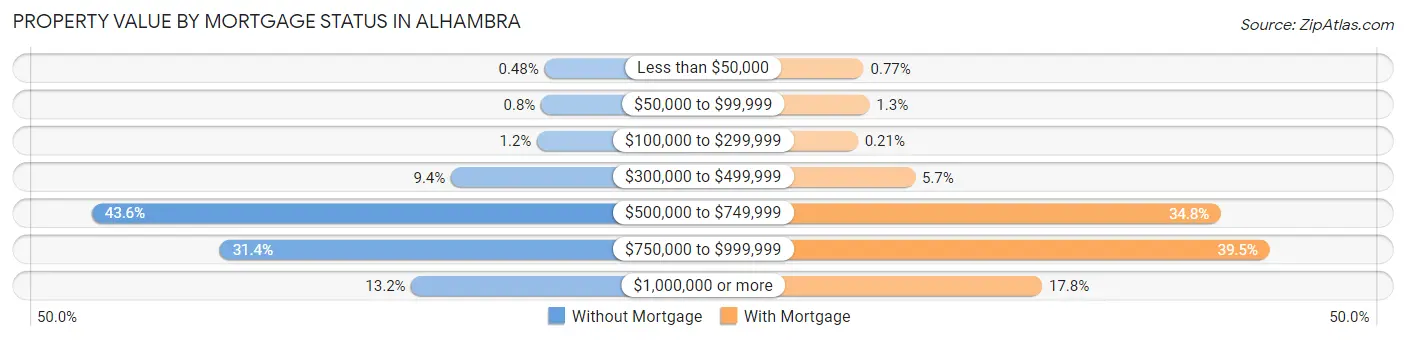
| Property Value | Without Mortgage | With Mortgage |
| Less than $50,000 | 23 (0.5%) | 58 (0.8%) |
| $50,000 to $99,999 | 38 (0.8%) | 100 (1.3%) |
| $100,000 to $299,999 | 56 (1.2%) | 16 (0.2%) |
| $300,000 to $499,999 | 447 (9.4%) | 428 (5.7%) |
| $500,000 to $749,999 | 2,076 (43.6%) | 2,633 (34.8%) |
| $750,000 to $999,999 | 1,496 (31.4%) | 2,983 (39.5%) |
| $1,000,000 or more | 627 (13.2%) | 1,343 (17.8%) |
| Total | 4,763 (100.0%) | 7,561 (100.0%) |
Household Income by Mortgage Status in Alhambra
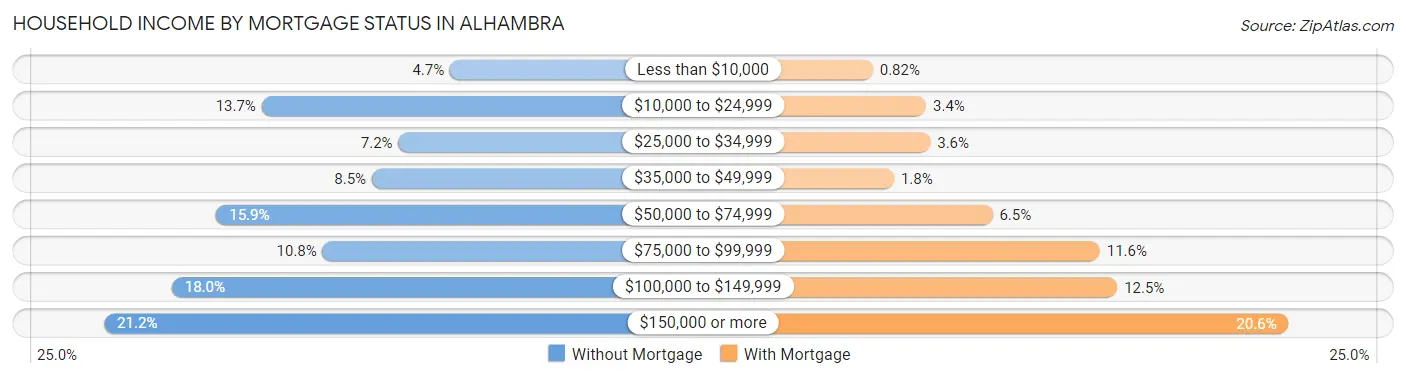
| Household Income | Without Mortgage | With Mortgage |
| Less than $10,000 | 226 (4.7%) | 62 (0.8%) |
| $10,000 to $24,999 | 653 (13.7%) | 254 (3.4%) |
| $25,000 to $34,999 | 343 (7.2%) | 269 (3.6%) |
| $35,000 to $49,999 | 403 (8.5%) | 138 (1.8%) |
| $50,000 to $74,999 | 756 (15.9%) | 493 (6.5%) |
| $75,000 to $99,999 | 515 (10.8%) | 879 (11.6%) |
| $100,000 to $149,999 | 857 (18.0%) | 942 (12.5%) |
| $150,000 or more | 1,010 (21.2%) | 1,559 (20.6%) |
| Total | 4,763 (100.0%) | 7,561 (100.0%) |
Property Value to Household Income Ratio in Alhambra
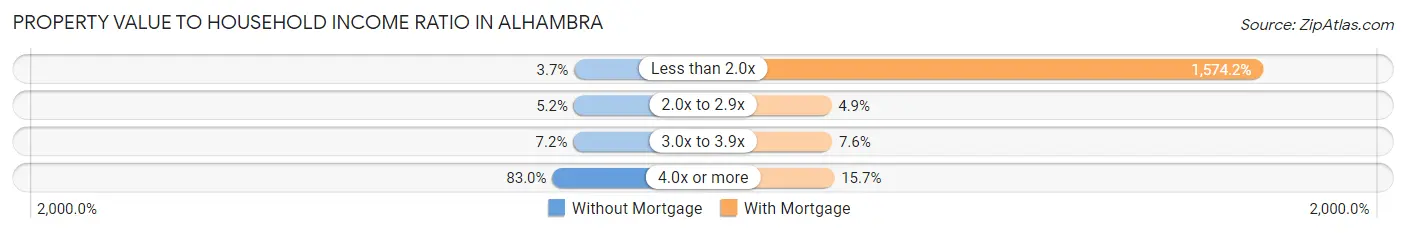
| Value-to-Income Ratio | Without Mortgage | With Mortgage |
| Less than 2.0x | 178 (3.7%) | 119,027 (1,574.2%) |
| 2.0x to 2.9x | 249 (5.2%) | 372 (4.9%) |
| 3.0x to 3.9x | 345 (7.2%) | 573 (7.6%) |
| 4.0x or more | 3,951 (83.0%) | 1,184 (15.7%) |
| Total | 4,763 (100.0%) | 7,561 (100.0%) |
Real Estate Taxes by Mortgage Status in Alhambra
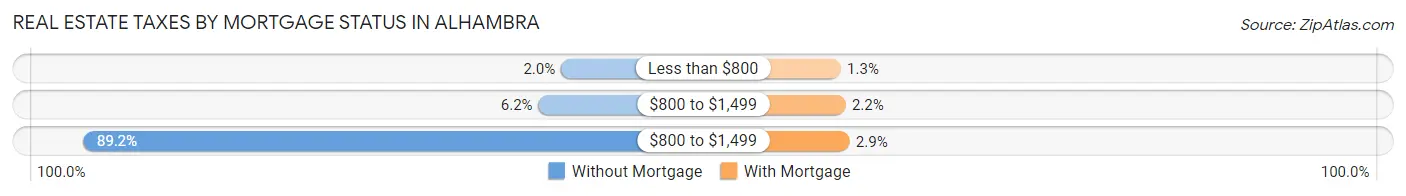
| Property Taxes | Without Mortgage | With Mortgage |
| Less than $800 | 96 (2.0%) | 98 (1.3%) |
| $800 to $1,499 | 293 (6.1%) | 164 (2.2%) |
| $800 to $1,499 | 4,247 (89.2%) | 219 (2.9%) |
| Total | 4,763 (100.0%) | 7,561 (100.0%) |
Health & Disability in Alhambra
Health Insurance Coverage by Age in Alhambra
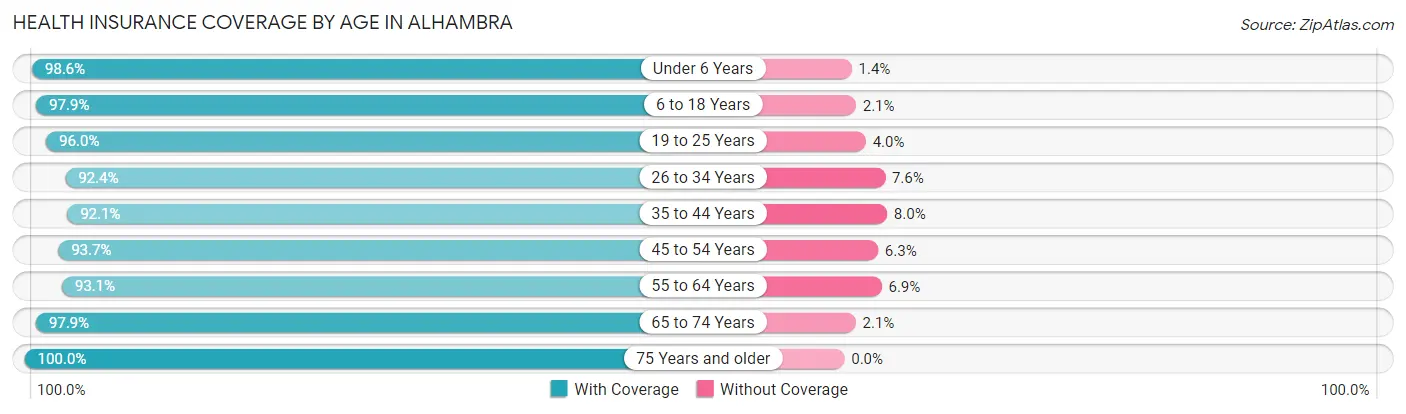
| Age Bracket | With Coverage | Without Coverage |
| Under 6 Years | 5,079 (98.6%) | 70 (1.4%) |
| 6 to 18 Years | 9,926 (97.9%) | 217 (2.1%) |
| 19 to 25 Years | 5,810 (96.0%) | 242 (4.0%) |
| 26 to 34 Years | 11,080 (92.4%) | 909 (7.6%) |
| 35 to 44 Years | 10,680 (92.0%) | 922 (8.0%) |
| 45 to 54 Years | 10,471 (93.7%) | 700 (6.3%) |
| 55 to 64 Years | 10,028 (93.1%) | 748 (6.9%) |
| 65 to 74 Years | 8,256 (97.9%) | 178 (2.1%) |
| 75 Years and older | 6,386 (100.0%) | 0 (0.0%) |
| Total | 77,716 (95.1%) | 3,986 (4.9%) |
Health Insurance Coverage by Citizenship Status in Alhambra
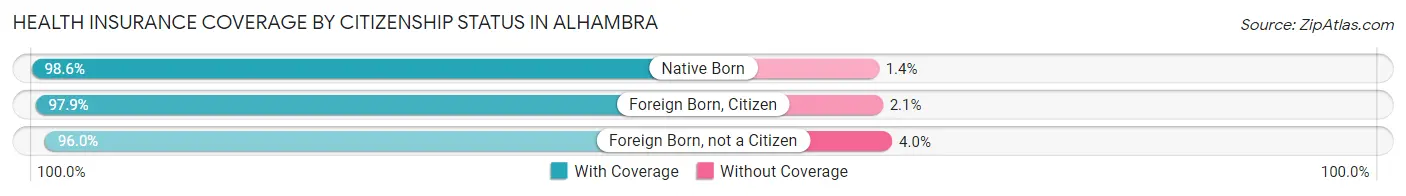
| Citizenship Status | With Coverage | Without Coverage |
| Native Born | 5,079 (98.6%) | 70 (1.4%) |
| Foreign Born, Citizen | 9,926 (97.9%) | 217 (2.1%) |
| Foreign Born, not a Citizen | 5,810 (96.0%) | 242 (4.0%) |
Health Insurance Coverage by Household Income in Alhambra
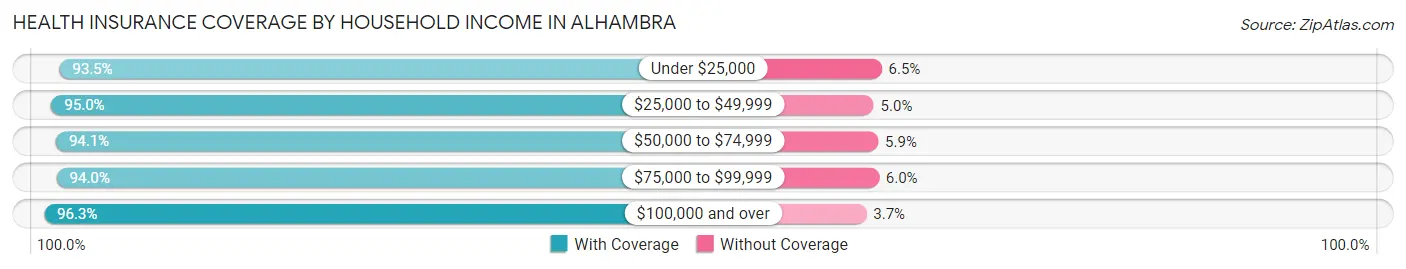
| Household Income | With Coverage | Without Coverage |
| Under $25,000 | 8,330 (93.5%) | 581 (6.5%) |
| $25,000 to $49,999 | 11,301 (95.0%) | 598 (5.0%) |
| $50,000 to $74,999 | 12,173 (94.1%) | 760 (5.9%) |
| $75,000 to $99,999 | 9,618 (94.0%) | 614 (6.0%) |
| $100,000 and over | 36,099 (96.3%) | 1,372 (3.7%) |
Public vs Private Health Insurance Coverage by Age in Alhambra
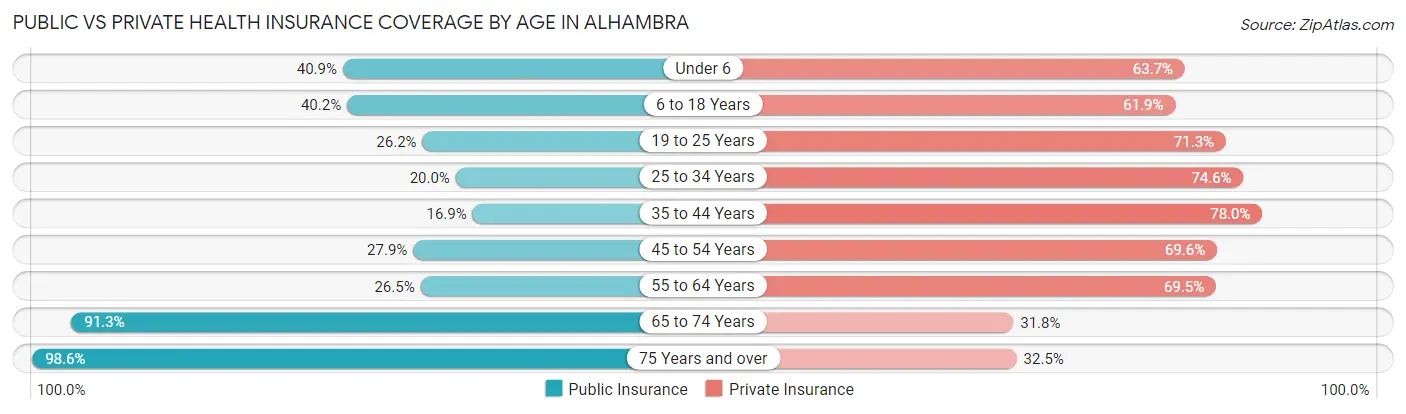
| Age Bracket | Public Insurance | Private Insurance |
| Under 6 | 2,108 (40.9%) | 3,279 (63.7%) |
| 6 to 18 Years | 4,073 (40.2%) | 6,280 (61.9%) |
| 19 to 25 Years | 1,583 (26.2%) | 4,315 (71.3%) |
| 25 to 34 Years | 2,396 (20.0%) | 8,938 (74.6%) |
| 35 to 44 Years | 1,955 (16.9%) | 9,054 (78.0%) |
| 45 to 54 Years | 3,114 (27.9%) | 7,779 (69.6%) |
| 55 to 64 Years | 2,858 (26.5%) | 7,486 (69.5%) |
| 65 to 74 Years | 7,702 (91.3%) | 2,685 (31.8%) |
| 75 Years and over | 6,295 (98.6%) | 2,073 (32.5%) |
| Total | 32,084 (39.3%) | 51,889 (63.5%) |
Disability Status by Sex by Age in Alhambra
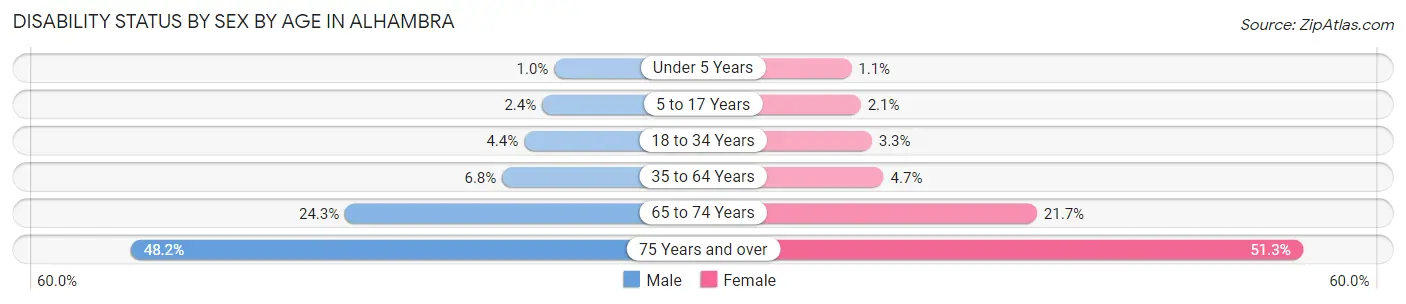
| Age Bracket | Male | Female |
| Under 5 Years | 21 (1.0%) | 21 (1.1%) |
| 5 to 17 Years | 122 (2.4%) | 114 (2.1%) |
| 18 to 34 Years | 425 (4.4%) | 302 (3.3%) |
| 35 to 64 Years | 1,120 (6.8%) | 799 (4.7%) |
| 65 to 74 Years | 974 (24.3%) | 962 (21.7%) |
| 75 Years and over | 1,105 (48.2%) | 2,099 (51.3%) |
Disability Class by Sex by Age in Alhambra
Disability Class: Hearing Difficulty
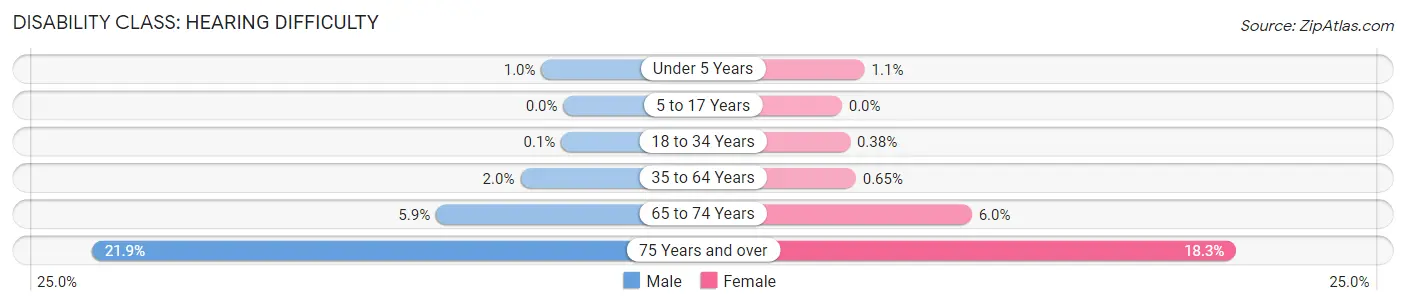
| Age Bracket | Male | Female |
| Under 5 Years | 21 (1.0%) | 21 (1.1%) |
| 5 to 17 Years | 0 (0.0%) | 0 (0.0%) |
| 18 to 34 Years | 10 (0.1%) | 34 (0.4%) |
| 35 to 64 Years | 328 (2.0%) | 112 (0.6%) |
| 65 to 74 Years | 237 (5.9%) | 267 (6.0%) |
| 75 Years and over | 502 (21.9%) | 749 (18.3%) |
Disability Class: Vision Difficulty
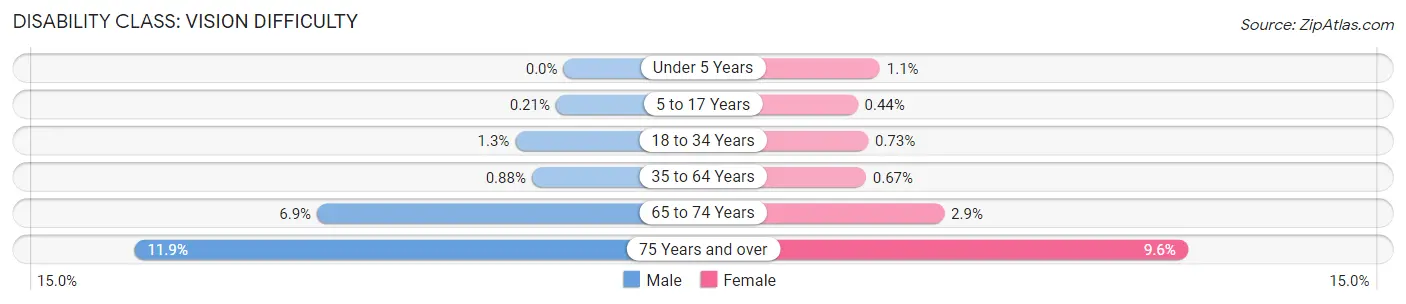
| Age Bracket | Male | Female |
| Under 5 Years | 0 (0.0%) | 21 (1.1%) |
| 5 to 17 Years | 11 (0.2%) | 24 (0.4%) |
| 18 to 34 Years | 130 (1.3%) | 66 (0.7%) |
| 35 to 64 Years | 144 (0.9%) | 115 (0.7%) |
| 65 to 74 Years | 275 (6.9%) | 126 (2.9%) |
| 75 Years and over | 274 (11.9%) | 394 (9.6%) |
Disability Class: Cognitive Difficulty
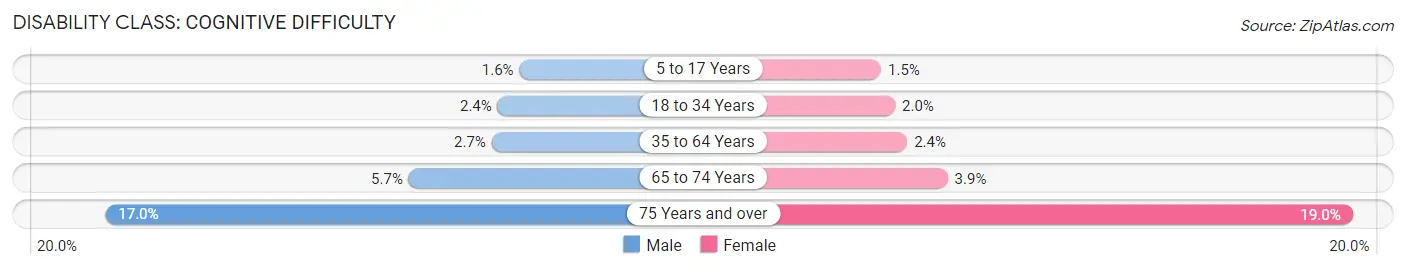
| Age Bracket | Male | Female |
| 5 to 17 Years | 84 (1.6%) | 79 (1.5%) |
| 18 to 34 Years | 237 (2.4%) | 179 (2.0%) |
| 35 to 64 Years | 437 (2.7%) | 417 (2.4%) |
| 65 to 74 Years | 230 (5.7%) | 174 (3.9%) |
| 75 Years and over | 390 (17.0%) | 776 (19.0%) |
Disability Class: Ambulatory Difficulty
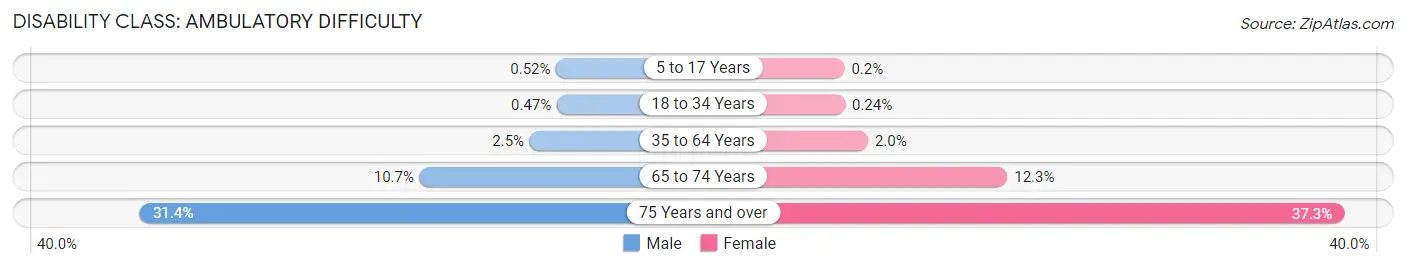
| Age Bracket | Male | Female |
| 5 to 17 Years | 27 (0.5%) | 11 (0.2%) |
| 18 to 34 Years | 46 (0.5%) | 22 (0.2%) |
| 35 to 64 Years | 407 (2.5%) | 334 (1.9%) |
| 65 to 74 Years | 427 (10.7%) | 544 (12.3%) |
| 75 Years and over | 721 (31.4%) | 1,526 (37.3%) |
Disability Class: Self-Care Difficulty
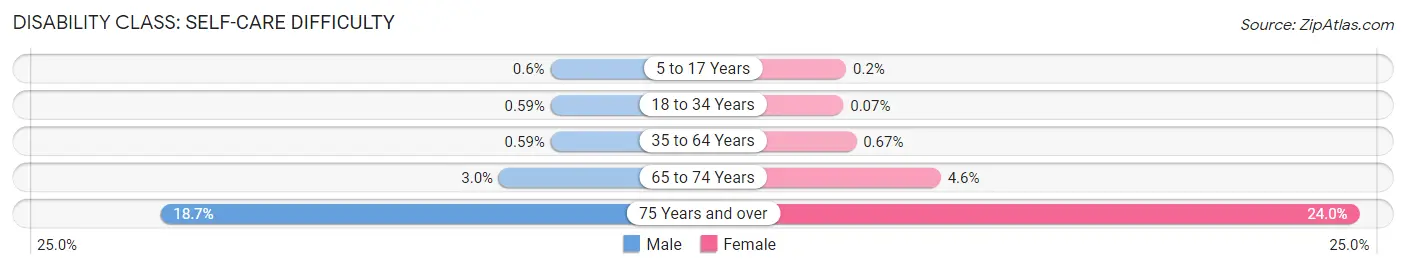
| Age Bracket | Male | Female |
| 5 to 17 Years | 31 (0.6%) | 11 (0.2%) |
| 18 to 34 Years | 57 (0.6%) | 6 (0.1%) |
| 35 to 64 Years | 97 (0.6%) | 115 (0.7%) |
| 65 to 74 Years | 120 (3.0%) | 203 (4.6%) |
| 75 Years and over | 429 (18.7%) | 983 (24.0%) |
Technology Access in Alhambra
Computing Device Access in Alhambra
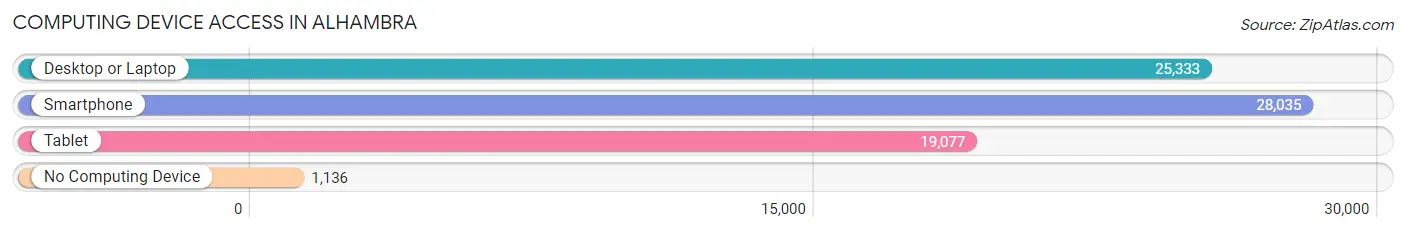
| Device Type | # Households | % Households |
| Desktop or Laptop | 25,333 | 84.3% |
| Smartphone | 28,035 | 93.3% |
| Tablet | 19,077 | 63.5% |
| No Computing Device | 1,136 | 3.8% |
| Total | 30,054 | 100.0% |
Internet Access in Alhambra
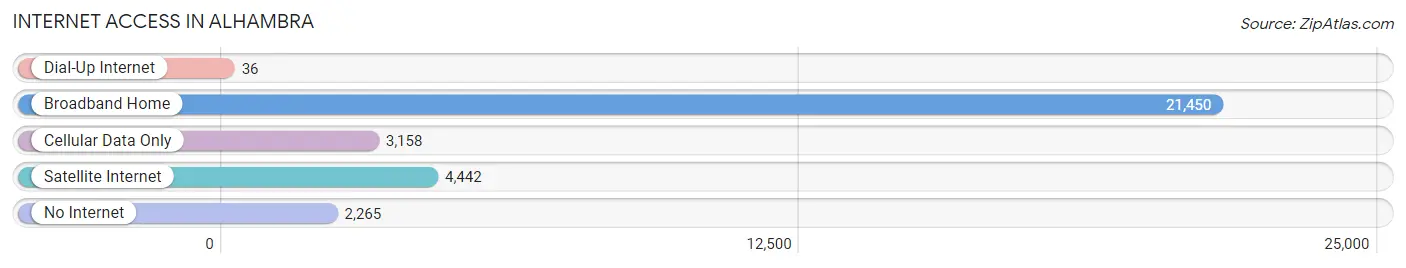
| Internet Type | # Households | % Households |
| Dial-Up Internet | 36 | 0.1% |
| Broadband Home | 21,450 | 71.4% |
| Cellular Data Only | 3,158 | 10.5% |
| Satellite Internet | 4,442 | 14.8% |
| No Internet | 2,265 | 7.5% |
| Total | 30,054 | 100.0% |
Alhambra Summary
Alhambra is a city located in Los Angeles County, California, United States. It is situated in the western San Gabriel Valley, approximately eight miles from downtown Los Angeles. As of the 2010 census, the population of Alhambra was 83,089.
History
The area that is now Alhambra was originally inhabited by the Tongva Native American tribe. The first Europeans to settle in the area were the Spanish, who established the Mission San Gabriel Arcángel in 1771. The area was later part of the Rancho San Pascual, which was granted to the Lugo family in 1842. In 1852, the Lugo family sold the land to Benjamin Davis Wilson, who established the city of Alhambra in 1875.
Geography
Alhambra is located at 34°6'10" North, 118°7'37" West (34.1028, -118.1269). It is situated in the western San Gabriel Valley, approximately eight miles from downtown Los Angeles. The city covers an area of 7.6 square miles, with a population density of 10,845 people per square mile.
The city is bordered by the cities of San Marino to the north, San Gabriel to the east, South Pasadena to the south, and Monterey Park to the west. The San Gabriel Mountains are located to the north of the city, and the Rio Hondo River runs through the city.
Economy
Alhambra is a major economic center in the San Gabriel Valley. The city is home to a variety of businesses, including retail stores, restaurants, and professional services. The city is also home to several major employers, including the Alhambra Unified School District, the Alhambra Hospital Medical Center, and the Alhambra Water Company.
Demographics
As of the 2010 census, the population of Alhambra was 83,089. The racial makeup of the city was 53.2% White, 1.3% African American, 0.7% Native American, 18.2% Asian, 0.1% Pacific Islander, 21.3% from other races, and 5.2% from two or more races. Hispanic or Latino of any race were 44.8% of the population.
The median household income in Alhambra was $50,845 in 2010. The per capita income was $25,845. The median age was 36.7 years. About 17.2% of the population was below the poverty line.
Conclusion
Alhambra is a city located in Los Angeles County, California, United States. It is situated in the western San Gabriel Valley, approximately eight miles from downtown Los Angeles. As of the 2010 census, the population of Alhambra was 83,089. The city is a major economic center in the San Gabriel Valley, and is home to a variety of businesses, including retail stores, restaurants, and professional services. The racial makeup of the city was 53.2% White, 1.3% African American, 0.7% Native American, 18.2% Asian, 0.1% Pacific Islander, 21.3% from other races, and 5.2% from two or more races. The median household income in Alhambra was $50,845 in 2010. The per capita income was $25,845. The median age was 36.7 years. About 17.2% of the population was below the poverty line.
Common Questions
What is Per Capita Income in Alhambra?
Per Capita income in Alhambra is $38,394.
What is the Median Family Income in Alhambra?
Median Family Income in Alhambra is $86,200.
What is the Median Household income in Alhambra?
Median Household Income in Alhambra is $80,234.
What is Income or Wage Gap in Alhambra?
Income or Wage Gap in Alhambra is 13.1%.
Women in Alhambra earn 86.9 cents for every dollar earned by a man.
What is Family Income Deficit in Alhambra?
Family Income Deficit in Alhambra is $8,453.
Families that are below poverty line in Alhambra earn $8,453 less on average than the poverty threshold level.
What is Inequality or Gini Index in Alhambra?
Inequality or Gini Index in Alhambra is 0.45.
What is the Total Population of Alhambra?
Total Population of Alhambra is 82,295.
What is the Total Male Population of Alhambra?
Total Male Population of Alhambra is 39,910.
What is the Total Female Population of Alhambra?
Total Female Population of Alhambra is 42,385.
What is the Ratio of Males per 100 Females in Alhambra?
There are 94.16 Males per 100 Females in Alhambra.
What is the Ratio of Females per 100 Males in Alhambra?
There are 106.20 Females per 100 Males in Alhambra.
What is the Median Population Age in Alhambra?
Median Population Age in Alhambra is 41.1 Years.
What is the Average Family Size in Alhambra
Average Family Size in Alhambra is 3.2 People.
What is the Average Household Size in Alhambra
Average Household Size in Alhambra is 2.7 People.
How Large is the Labor Force in Alhambra?
There are 43,800 People in the Labor Forcein in Alhambra.
What is the Percentage of People in the Labor Force in Alhambra?
62.9% of People are in the Labor Force in Alhambra.
What is the Unemployment Rate in Alhambra?
Unemployment Rate in Alhambra is 5.5%.