Woodland, CA Map & Demographics
Woodland Map
Woodland Overview
$37,368
PER CAPITA INCOME
$95,455
AVG FAMILY INCOME
$84,494
AVG HOUSEHOLD INCOME
25.6%
WAGE / INCOME GAP [ % ]
74.4¢/ $1
WAGE / INCOME GAP [ $ ]
$9,550
FAMILY INCOME DEFICIT
0.42
INEQUALITY / GINI INDEX
61,227
TOTAL POPULATION
30,457
MALE POPULATION
30,770
FEMALE POPULATION
98.98
MALES / 100 FEMALES
101.03
FEMALES / 100 MALES
37.0
MEDIAN AGE
3.2
AVG FAMILY SIZE
2.9
AVG HOUSEHOLD SIZE
31,912
LABOR FORCE [ PEOPLE ]
66.1%
PERCENT IN LABOR FORCE
5.0%
UNEMPLOYMENT RATE
Woodland Area Codes
Income in Woodland
Income Overview in Woodland
Per Capita Income in Woodland is $37,368, while median incomes of families and households are $95,455 and $84,494 respectively.
| Characteristic | Number | Measure |
| Per Capita Income | 61,227 | $37,368 |
| Median Family Income | 15,572 | $95,455 |
| Mean Family Income | 15,572 | $115,570 |
| Median Household Income | 21,078 | $84,494 |
| Mean Household Income | 21,078 | $106,960 |
| Income Deficit | 15,572 | $9,550 |
| Wage / Income Gap (%) | 61,227 | 25.63% |
| Wage / Income Gap ($) | 61,227 | 74.37¢ per $1 |
| Gini / Inequality Index | 61,227 | 0.42 |
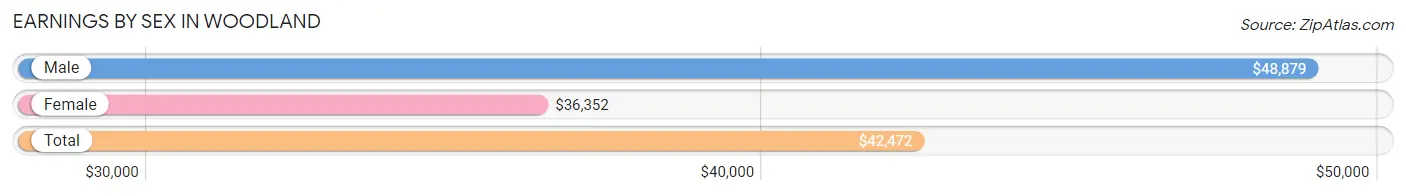
Earnings by Sex in Woodland
Average Earnings in Woodland are $42,472, $48,879 for men and $36,352 for women, a difference of 25.6%.
| Sex | Number | Average Earnings |
| Male | 17,964 (54.6%) | $48,879 |
| Female | 14,957 (45.4%) | $36,352 |
| Total | 32,921 (100.0%) | $42,472 |
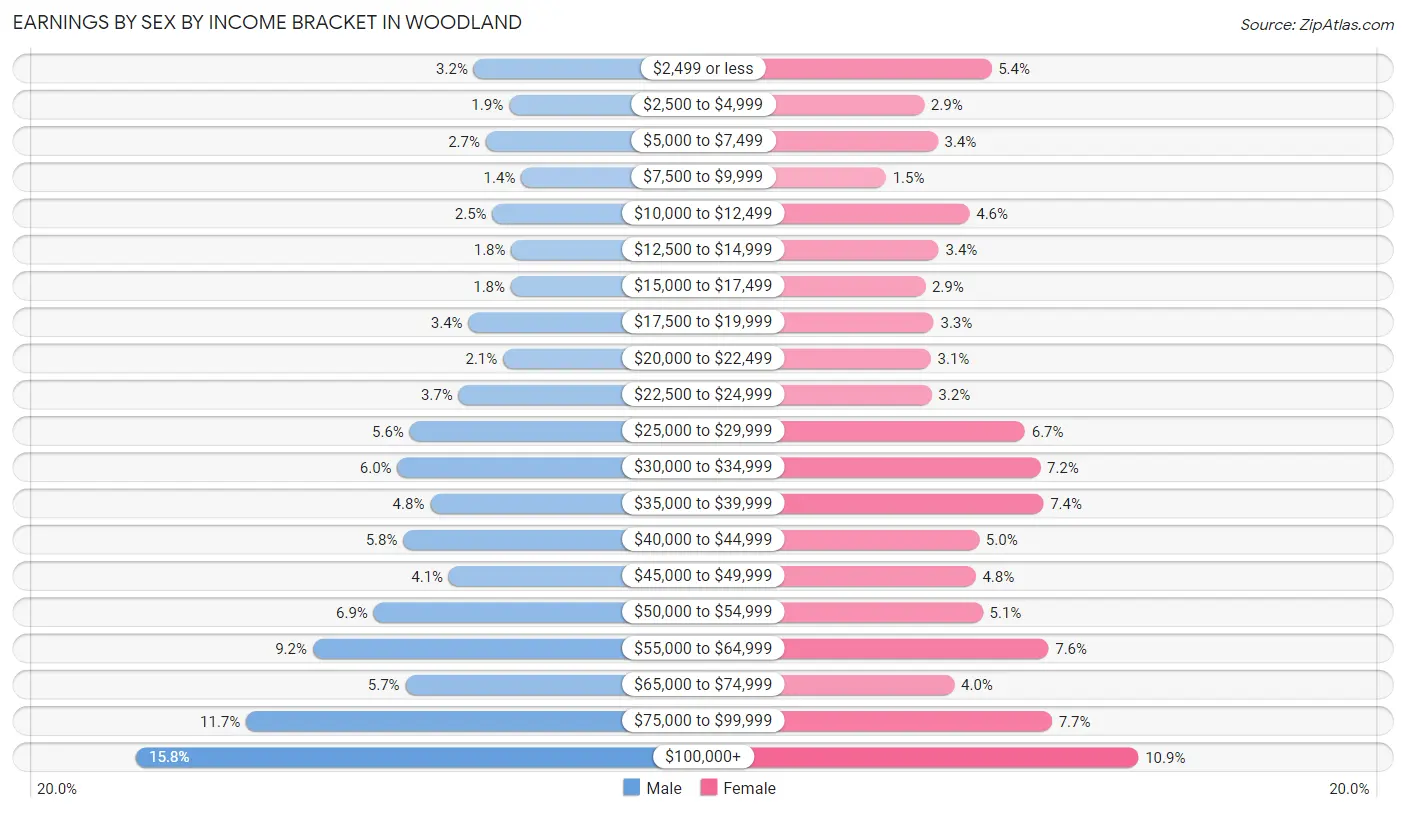
Earnings by Sex by Income Bracket in Woodland
The most common earnings brackets in Woodland are $100,000+ for men (2,842 | 15.8%) and $100,000+ for women (1,633 | 10.9%).
| Income | Male | Female |
| $2,499 or less | 569 (3.2%) | 809 (5.4%) |
| $2,500 to $4,999 | 332 (1.8%) | 433 (2.9%) |
| $5,000 to $7,499 | 489 (2.7%) | 508 (3.4%) |
| $7,500 to $9,999 | 249 (1.4%) | 219 (1.5%) |
| $10,000 to $12,499 | 444 (2.5%) | 687 (4.6%) |
| $12,500 to $14,999 | 317 (1.8%) | 515 (3.4%) |
| $15,000 to $17,499 | 320 (1.8%) | 438 (2.9%) |
| $17,500 to $19,999 | 606 (3.4%) | 486 (3.3%) |
| $20,000 to $22,499 | 371 (2.1%) | 470 (3.1%) |
| $22,500 to $24,999 | 671 (3.7%) | 474 (3.2%) |
| $25,000 to $29,999 | 1,001 (5.6%) | 997 (6.7%) |
| $30,000 to $34,999 | 1,083 (6.0%) | 1,083 (7.2%) |
| $35,000 to $39,999 | 863 (4.8%) | 1,101 (7.4%) |
| $40,000 to $44,999 | 1,043 (5.8%) | 741 (5.0%) |
| $45,000 to $49,999 | 737 (4.1%) | 721 (4.8%) |
| $50,000 to $54,999 | 1,244 (6.9%) | 761 (5.1%) |
| $55,000 to $64,999 | 1,653 (9.2%) | 1,130 (7.5%) |
| $65,000 to $74,999 | 1,029 (5.7%) | 602 (4.0%) |
| $75,000 to $99,999 | 2,101 (11.7%) | 1,149 (7.7%) |
| $100,000+ | 2,842 (15.8%) | 1,633 (10.9%) |
| Total | 17,964 (100.0%) | 14,957 (100.0%) |
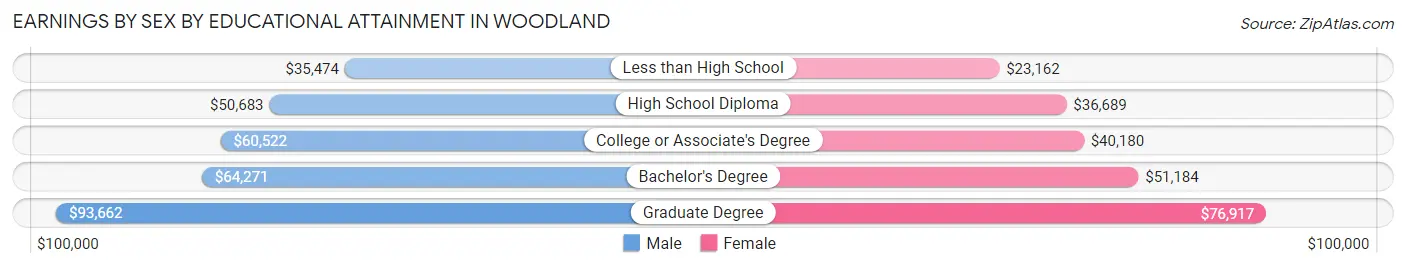
Earnings by Sex by Educational Attainment in Woodland
Average earnings in Woodland are $52,831 for men and $41,831 for women, a difference of 20.8%. Men with an educational attainment of graduate degree enjoy the highest average annual earnings of $93,662, while those with less than high school education earn the least with $35,474. Women with an educational attainment of graduate degree earn the most with the average annual earnings of $76,917, while those with less than high school education have the smallest earnings of $23,162.
| Educational Attainment | Male Income | Female Income |
| Less than High School | $35,474 | $23,162 |
| High School Diploma | $50,683 | $36,689 |
| College or Associate's Degree | $60,522 | $40,180 |
| Bachelor's Degree | $64,271 | $51,184 |
| Graduate Degree | $93,662 | $76,917 |
| Total | $52,831 | $41,831 |
Family Income in Woodland
Family Income Brackets in Woodland
According to the Woodland family income data, there are 3,426 families falling into the $100,000 to $149,999 income range, which is the most common income bracket and makes up 22.0% of all families. Conversely, the $10,000 to $14,999 income bracket is the least frequent group with only 218 families (1.4%) belonging to this category.
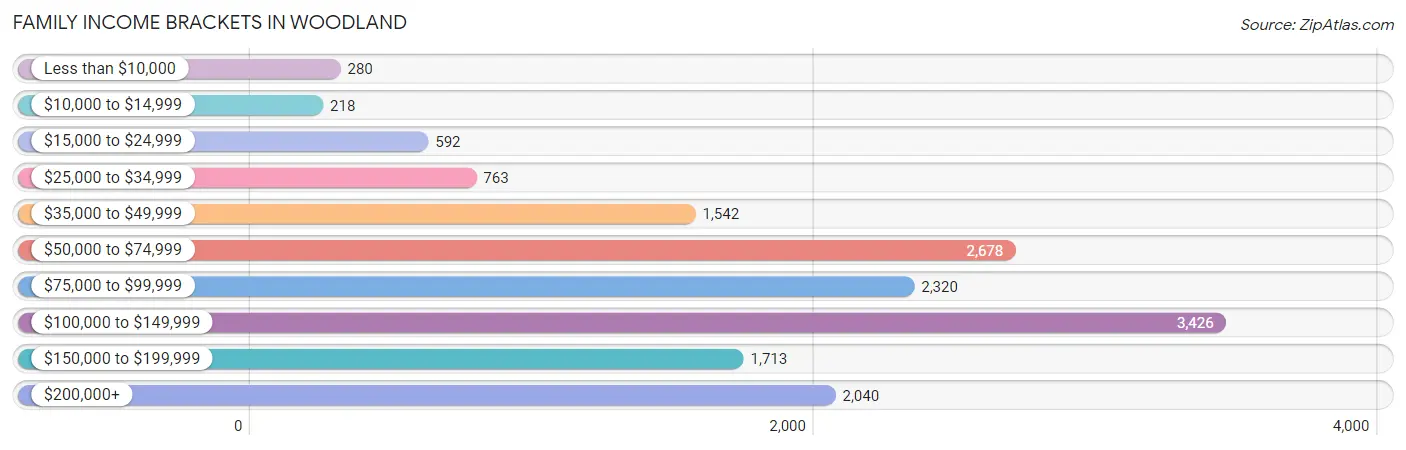
| Income Bracket | # Families | % Families |
| Less than $10,000 | 280 | 1.8% |
| $10,000 to $14,999 | 218 | 1.4% |
| $15,000 to $24,999 | 592 | 3.8% |
| $25,000 to $34,999 | 763 | 4.9% |
| $35,000 to $49,999 | 1,542 | 9.9% |
| $50,000 to $74,999 | 2,678 | 17.2% |
| $75,000 to $99,999 | 2,320 | 14.9% |
| $100,000 to $149,999 | 3,426 | 22.0% |
| $150,000 to $199,999 | 1,713 | 11.0% |
| $200,000+ | 2,040 | 13.1% |
Family Income by Famaliy Size in Woodland
7+ person families (278 | 1.8%) account for the highest median family income in Woodland with $145,357 per family, while 2-person families (5,988 | 38.5%) have the highest median income of $42,986 per family member.
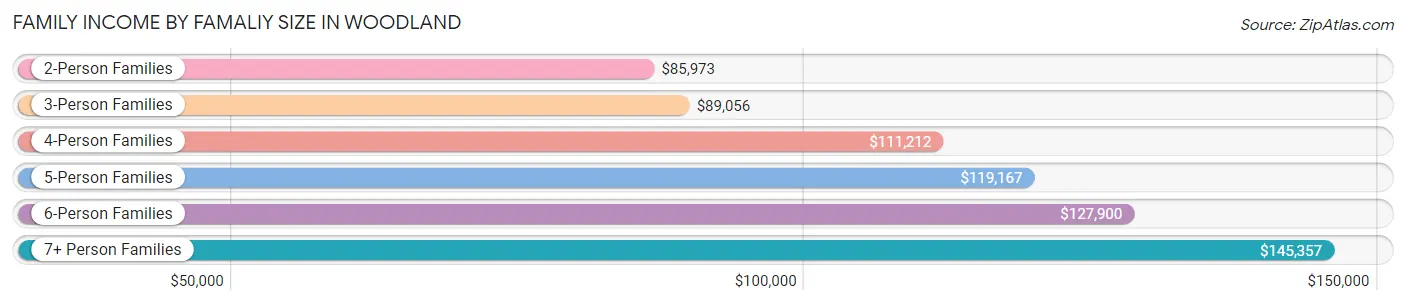
| Income Bracket | # Families | Median Income |
| 2-Person Families | 5,988 (38.5%) | $85,973 |
| 3-Person Families | 3,841 (24.7%) | $89,056 |
| 4-Person Families | 3,604 (23.1%) | $111,212 |
| 5-Person Families | 1,370 (8.8%) | $119,167 |
| 6-Person Families | 491 (3.2%) | $127,900 |
| 7+ Person Families | 278 (1.8%) | $145,357 |
| Total | 15,572 (100.0%) | $95,455 |
Family Income by Number of Earners in Woodland
The median family income in Woodland is $95,455, with families comprising 3+ earners (2,573) having the highest median family income of $138,585, while families with no earners (1,655) have the lowest median family income of $54,041, accounting for 16.5% and 10.6% of families, respectively.
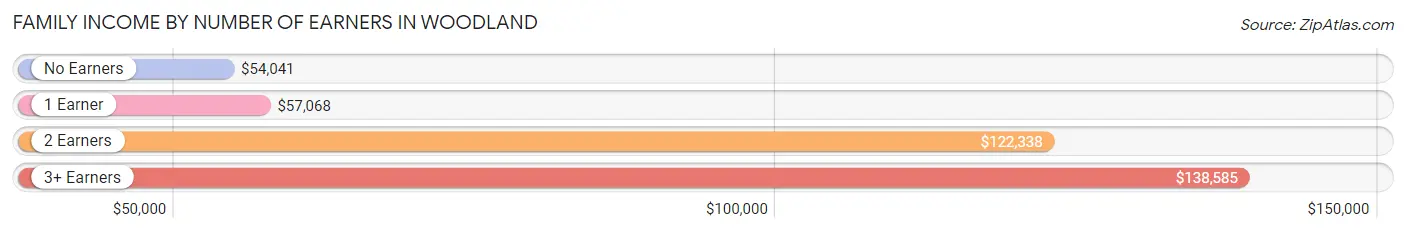
| Number of Earners | # Families | Median Income |
| No Earners | 1,655 (10.6%) | $54,041 |
| 1 Earner | 5,301 (34.0%) | $57,068 |
| 2 Earners | 6,043 (38.8%) | $122,338 |
| 3+ Earners | 2,573 (16.5%) | $138,585 |
| Total | 15,572 (100.0%) | $95,455 |
Household Income in Woodland
Household Income Brackets in Woodland
With 4,089 households falling in the category, the $100,000 to $149,999 income range is the most frequent in Woodland, accounting for 19.4% of all households. In contrast, only 464 households (2.2%) fall into the $10,000 to $14,999 income bracket, making it the least populous group.
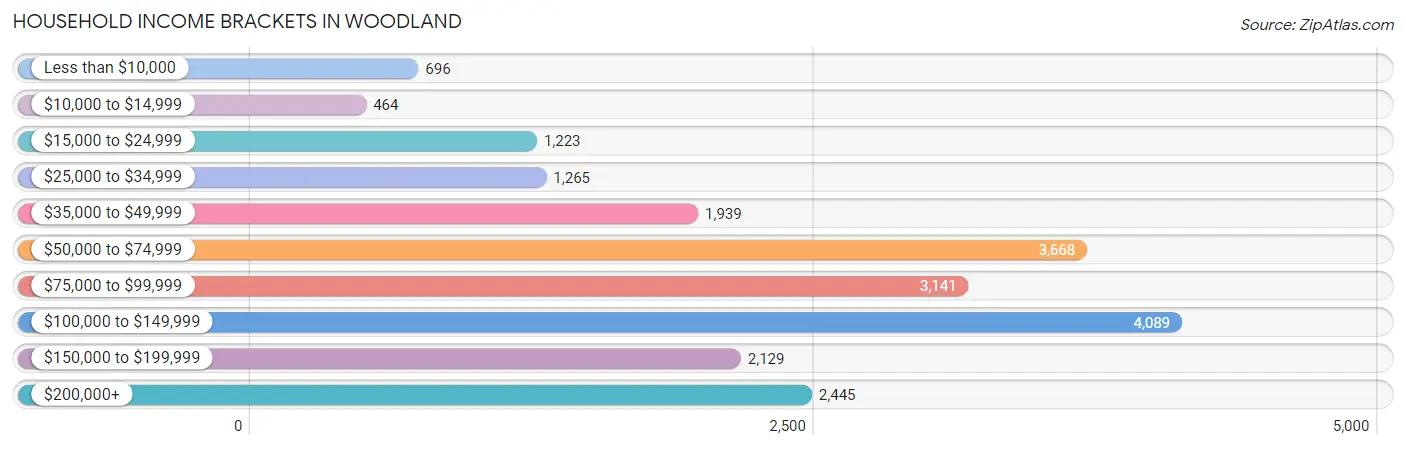
| Income Bracket | # Households | % Households |
| Less than $10,000 | 696 | 3.3% |
| $10,000 to $14,999 | 464 | 2.2% |
| $15,000 to $24,999 | 1,223 | 5.8% |
| $25,000 to $34,999 | 1,265 | 6.0% |
| $35,000 to $49,999 | 1,939 | 9.2% |
| $50,000 to $74,999 | 3,668 | 17.4% |
| $75,000 to $99,999 | 3,141 | 14.9% |
| $100,000 to $149,999 | 4,089 | 19.4% |
| $150,000 to $199,999 | 2,129 | 10.1% |
| $200,000+ | 2,445 | 11.6% |
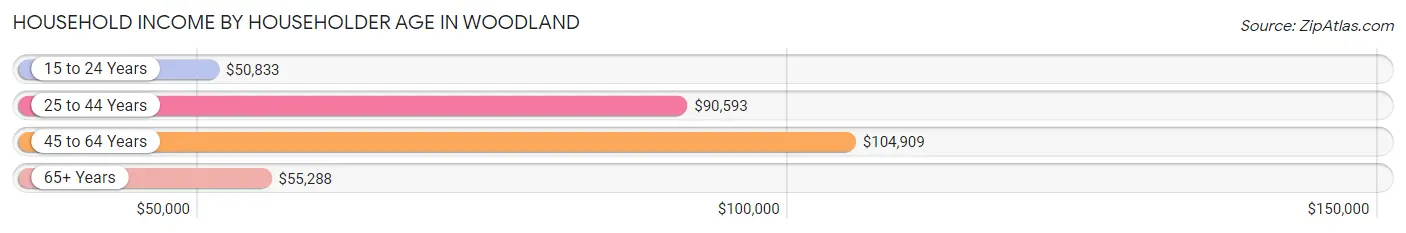
Household Income by Householder Age in Woodland
The median household income in Woodland is $84,494, with the highest median household income of $104,909 found in the 45 to 64 years age bracket for the primary householder. A total of 8,283 households (39.3%) fall into this category. Meanwhile, the 15 to 24 years age bracket for the primary householder has the lowest median household income of $50,833, with 666 households (3.2%) in this group.
| Income Bracket | # Households | Median Income |
| 15 to 24 Years | 666 (3.2%) | $50,833 |
| 25 to 44 Years | 6,986 (33.1%) | $90,593 |
| 45 to 64 Years | 8,283 (39.3%) | $104,909 |
| 65+ Years | 5,143 (24.4%) | $55,288 |
| Total | 21,078 (100.0%) | $84,494 |
Poverty in Woodland
Income Below Poverty by Sex and Age in Woodland
With 8.5% poverty level for males and 10.1% for females among the residents of Woodland, 12 to 14 year old males and 18 to 24 year old females are the most vulnerable to poverty, with 214 males (15.7%) and 475 females (14.7%) in their respective age groups living below the poverty level.
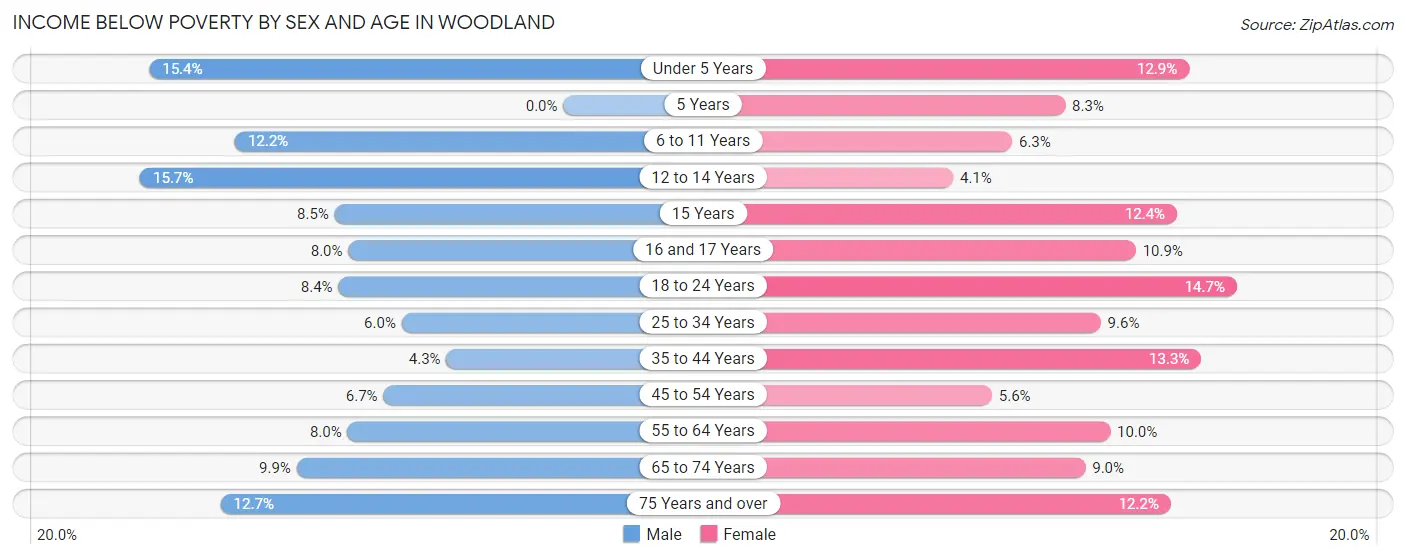
| Age Bracket | Male | Female |
| Under 5 Years | 302 (15.4%) | 213 (12.9%) |
| 5 Years | 0 (0.0%) | 29 (8.3%) |
| 6 to 11 Years | 281 (12.2%) | 166 (6.3%) |
| 12 to 14 Years | 214 (15.7%) | 45 (4.1%) |
| 15 Years | 36 (8.5%) | 80 (12.4%) |
| 16 and 17 Years | 54 (8.0%) | 84 (10.9%) |
| 18 to 24 Years | 246 (8.4%) | 475 (14.7%) |
| 25 to 34 Years | 265 (6.0%) | 380 (9.6%) |
| 35 to 44 Years | 182 (4.3%) | 544 (13.3%) |
| 45 to 54 Years | 266 (6.7%) | 203 (5.6%) |
| 55 to 64 Years | 277 (8.0%) | 368 (10.0%) |
| 65 to 74 Years | 240 (9.9%) | 251 (9.0%) |
| 75 Years and over | 172 (12.7%) | 229 (12.2%) |
| Total | 2,535 (8.5%) | 3,067 (10.1%) |
Income Above Poverty by Sex and Age in Woodland
According to the poverty statistics in Woodland, males aged 5 years and females aged 12 to 14 years are the age groups that are most secure financially, with 100.0% of males and 95.9% of females in these age groups living above the poverty line.
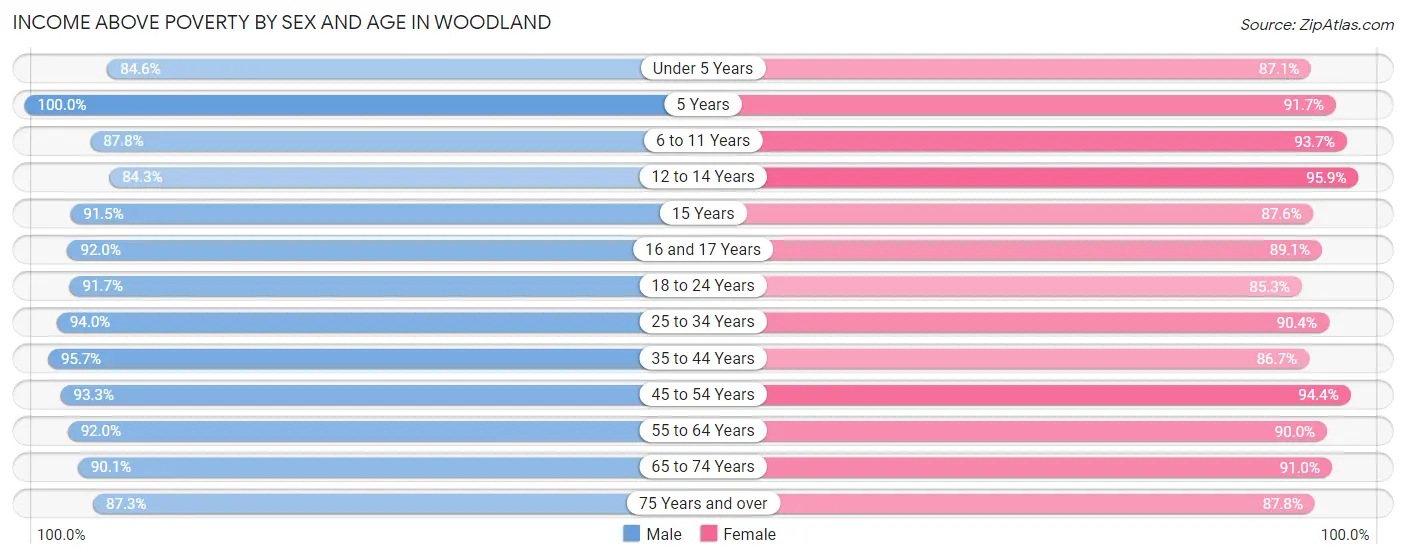
| Age Bracket | Male | Female |
| Under 5 Years | 1,663 (84.6%) | 1,440 (87.1%) |
| 5 Years | 224 (100.0%) | 321 (91.7%) |
| 6 to 11 Years | 2,025 (87.8%) | 2,459 (93.7%) |
| 12 to 14 Years | 1,148 (84.3%) | 1,044 (95.9%) |
| 15 Years | 388 (91.5%) | 563 (87.6%) |
| 16 and 17 Years | 623 (92.0%) | 686 (89.1%) |
| 18 to 24 Years | 2,699 (91.6%) | 2,766 (85.3%) |
| 25 to 34 Years | 4,150 (94.0%) | 3,575 (90.4%) |
| 35 to 44 Years | 4,008 (95.7%) | 3,533 (86.7%) |
| 45 to 54 Years | 3,718 (93.3%) | 3,439 (94.4%) |
| 55 to 64 Years | 3,182 (92.0%) | 3,327 (90.0%) |
| 65 to 74 Years | 2,184 (90.1%) | 2,526 (91.0%) |
| 75 Years and over | 1,180 (87.3%) | 1,647 (87.8%) |
| Total | 27,192 (91.5%) | 27,326 (89.9%) |
Income Below Poverty Among Married-Couple Families in Woodland
The poverty statistics for married-couple families in Woodland show that 3.6% or 395 of the total 10,996 families live below the poverty line. Families with 1 or 2 children have the highest poverty rate of 4.2%, comprising of 174 families. On the other hand, families with no children have the lowest poverty rate of 3.1%, which includes 183 families.
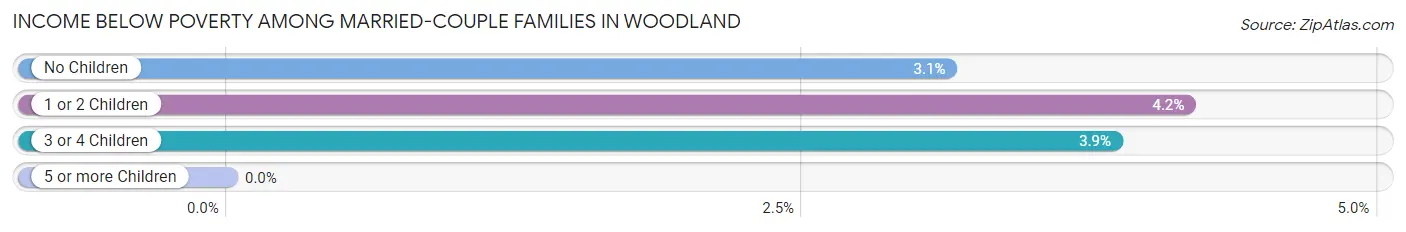
| Children | Above Poverty | Below Poverty |
| No Children | 5,657 (96.9%) | 183 (3.1%) |
| 1 or 2 Children | 3,996 (95.8%) | 174 (4.2%) |
| 3 or 4 Children | 948 (96.2%) | 38 (3.8%) |
| 5 or more Children | 0 (0.0%) | 0 (0.0%) |
| Total | 10,601 (96.4%) | 395 (3.6%) |
Income Below Poverty Among Single-Parent Households in Woodland
According to the poverty data in Woodland, 2.2% or 30 single-father households and 18.0% or 583 single-mother households are living below the poverty line. Among single-father households, those with 1 or 2 children have the highest poverty rate, with 19 households (3.5%) experiencing poverty. Likewise, among single-mother households, those with 5 or more children have the highest poverty rate, with 27 households (100.0%) falling below the poverty line.
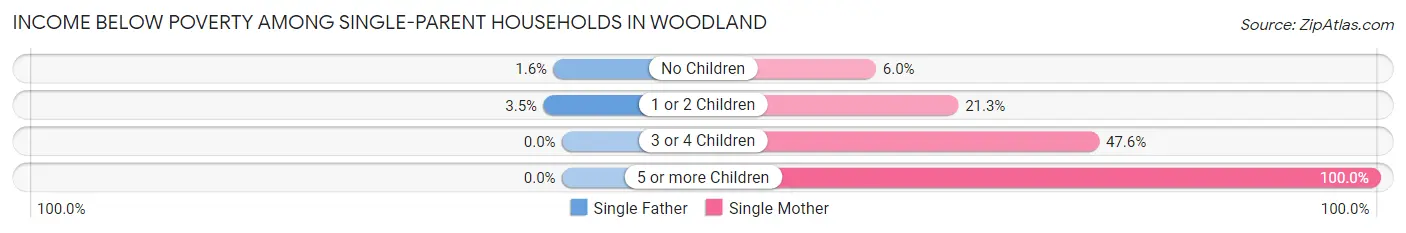
| Children | Single Father | Single Mother |
| No Children | 11 (1.6%) | 69 (6.0%) |
| 1 or 2 Children | 19 (3.5%) | 399 (21.3%) |
| 3 or 4 Children | 0 (0.0%) | 88 (47.6%) |
| 5 or more Children | 0 (0.0%) | 27 (100.0%) |
| Total | 30 (2.2%) | 583 (18.0%) |
Income Below Poverty Among Married-Couple vs Single-Parent Households in Woodland
The poverty data for Woodland shows that 395 of the married-couple family households (3.6%) and 613 of the single-parent households (13.4%) are living below the poverty level. Within the married-couple family households, those with 1 or 2 children have the highest poverty rate, with 174 households (4.2%) falling below the poverty line. Among the single-parent households, those with 5 or more children have the highest poverty rate, with 27 household (45.0%) living below poverty.
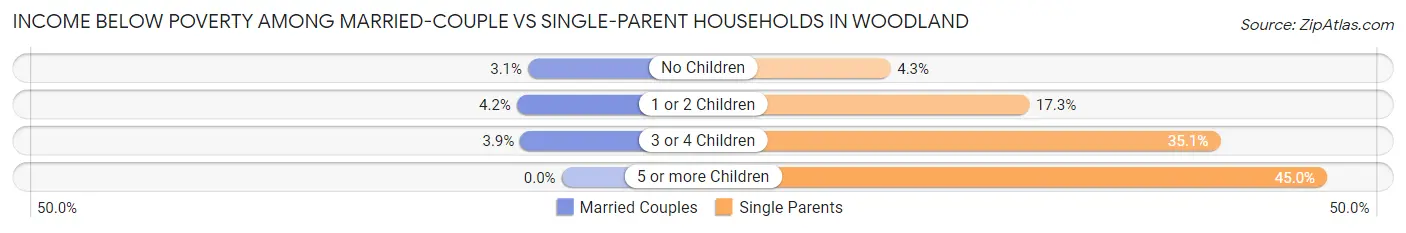
| Children | Married-Couple Families | Single-Parent Households |
| No Children | 183 (3.1%) | 80 (4.3%) |
| 1 or 2 Children | 174 (4.2%) | 418 (17.3%) |
| 3 or 4 Children | 38 (3.8%) | 88 (35.1%) |
| 5 or more Children | 0 (0.0%) | 27 (45.0%) |
| Total | 395 (3.6%) | 613 (13.4%) |
Race in Woodland
The most populous races in Woodland are White / Caucasian (36,289 | 59.3%), Hispanic or Latino (30,353 | 49.6%), and Two or more Races (11,986 | 19.6%).
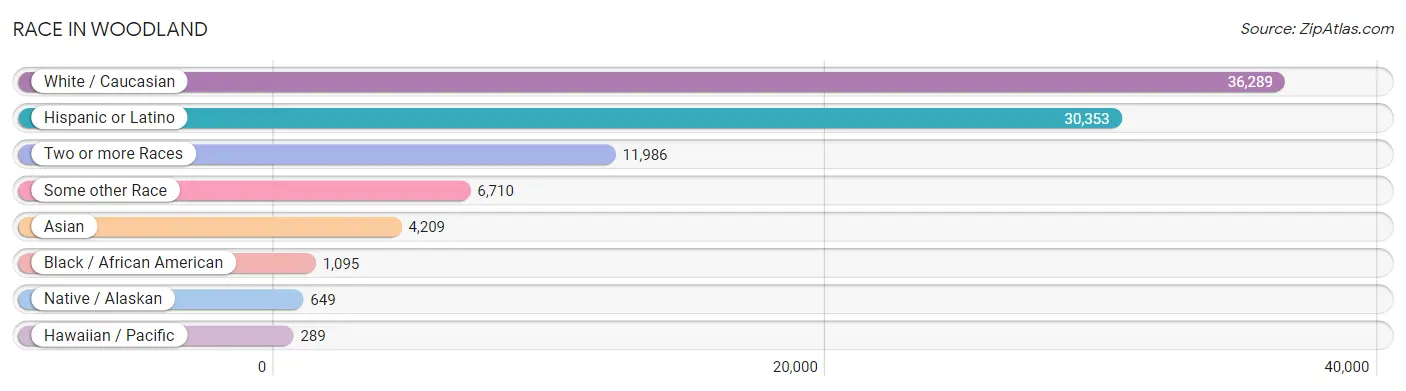
| Race | # Population | % Population |
| Asian | 4,209 | 6.9% |
| Black / African American | 1,095 | 1.8% |
| Hawaiian / Pacific | 289 | 0.5% |
| Hispanic or Latino | 30,353 | 49.6% |
| Native / Alaskan | 649 | 1.1% |
| White / Caucasian | 36,289 | 59.3% |
| Two or more Races | 11,986 | 19.6% |
| Some other Race | 6,710 | 11.0% |
| Total | 61,227 | 100.0% |
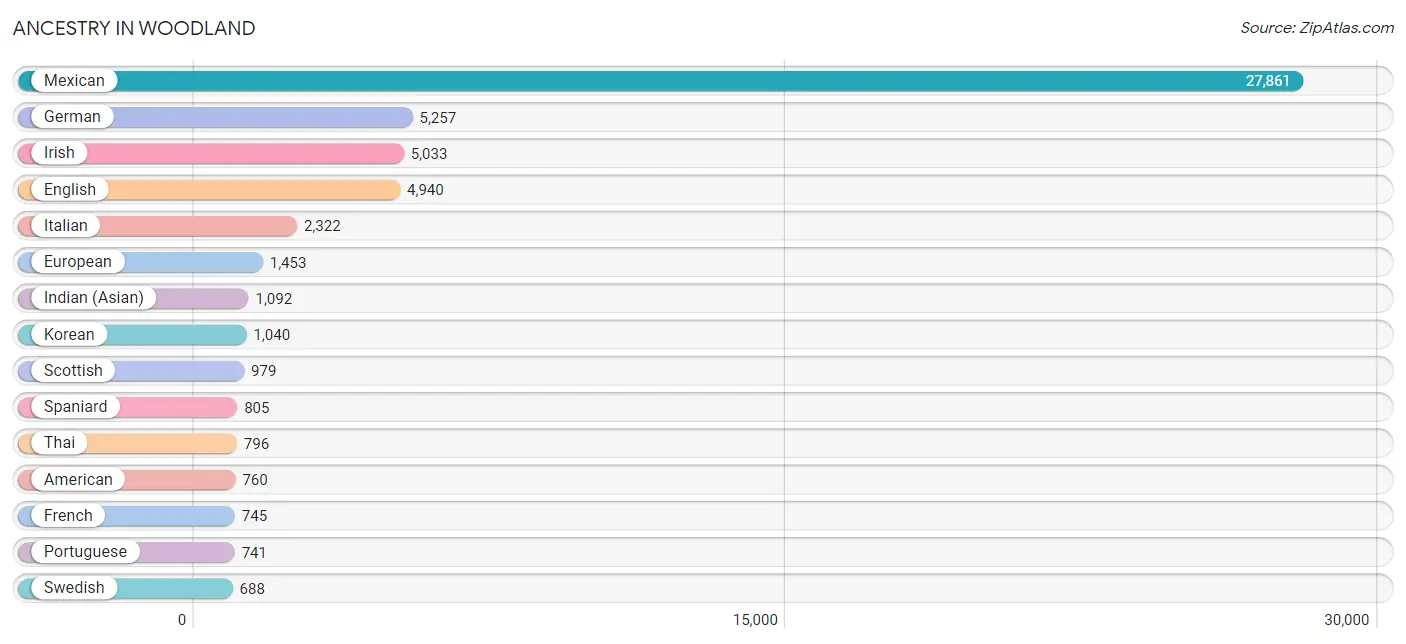
Ancestry in Woodland
The most populous ancestries reported in Woodland are Mexican (27,861 | 45.5%), German (5,257 | 8.6%), Irish (5,033 | 8.2%), English (4,940 | 8.1%), and Italian (2,322 | 3.8%), together accounting for 74.2% of all Woodland residents.
| Ancestry | # Population | % Population |
| African | 100 | 0.2% |
| Alaska Native | 30 | 0.1% |
| American | 760 | 1.2% |
| Apache | 133 | 0.2% |
| Arab | 70 | 0.1% |
| Argentinean | 57 | 0.1% |
| Armenian | 25 | 0.0% |
| Austrian | 82 | 0.1% |
| Bangladeshi | 100 | 0.2% |
| Basque | 37 | 0.1% |
| Belgian | 16 | 0.0% |
| Bhutanese | 312 | 0.5% |
| Blackfeet | 59 | 0.1% |
| Brazilian | 49 | 0.1% |
| British | 343 | 0.6% |
| Bulgarian | 13 | 0.0% |
| Burmese | 416 | 0.7% |
| Cajun | 30 | 0.1% |
| Canadian | 83 | 0.1% |
| Central American | 530 | 0.9% |
| Central American Indian | 36 | 0.1% |
| Cherokee | 95 | 0.2% |
| Chickasaw | 31 | 0.1% |
| Chilean | 56 | 0.1% |
| Choctaw | 29 | 0.1% |
| Colombian | 106 | 0.2% |
| Costa Rican | 12 | 0.0% |
| Cree | 52 | 0.1% |
| Croatian | 21 | 0.0% |
| Czech | 78 | 0.1% |
| Czechoslovakian | 134 | 0.2% |
| Danish | 149 | 0.2% |
| Dutch | 355 | 0.6% |
| Eastern European | 79 | 0.1% |
| Ecuadorian | 17 | 0.0% |
| English | 4,940 | 8.1% |
| European | 1,453 | 2.4% |
| Filipino | 69 | 0.1% |
| Finnish | 93 | 0.2% |
| French | 745 | 1.2% |
| French Canadian | 144 | 0.2% |
| German | 5,257 | 8.6% |
| Greek | 163 | 0.3% |
| Guamanian / Chamorro | 5 | 0.0% |
| Guatemalan | 152 | 0.3% |
| Honduran | 103 | 0.2% |
| Hungarian | 125 | 0.2% |
| Icelander | 15 | 0.0% |
| Indian (Asian) | 1,092 | 1.8% |
| Iranian | 61 | 0.1% |
| Iraqi | 27 | 0.0% |
| Irish | 5,033 | 8.2% |
| Iroquois | 46 | 0.1% |
| Israeli | 10 | 0.0% |
| Italian | 2,322 | 3.8% |
| Jamaican | 88 | 0.1% |
| Japanese | 219 | 0.4% |
| Korean | 1,040 | 1.7% |
| Laotian | 55 | 0.1% |
| Latvian | 9 | 0.0% |
| Lithuanian | 10 | 0.0% |
| Maltese | 32 | 0.1% |
| Mexican | 27,861 | 45.5% |
| Mexican American Indian | 172 | 0.3% |
| Native Hawaiian | 93 | 0.2% |
| Navajo | 53 | 0.1% |
| Nepalese | 45 | 0.1% |
| Nicaraguan | 34 | 0.1% |
| Nigerian | 162 | 0.3% |
| Northern European | 26 | 0.0% |
| Norwegian | 598 | 1.0% |
| Pakistani | 52 | 0.1% |
| Panamanian | 23 | 0.0% |
| Peruvian | 208 | 0.3% |
| Polish | 339 | 0.5% |
| Portuguese | 741 | 1.2% |
| Pueblo | 8 | 0.0% |
| Puerto Rican | 253 | 0.4% |
| Romanian | 18 | 0.0% |
| Russian | 671 | 1.1% |
| Salvadoran | 206 | 0.3% |
| Samoan | 107 | 0.2% |
| Scandinavian | 84 | 0.1% |
| Scotch-Irish | 552 | 0.9% |
| Scottish | 979 | 1.6% |
| Serbian | 10 | 0.0% |
| Slovene | 27 | 0.0% |
| South American | 455 | 0.7% |
| South American Indian | 100 | 0.2% |
| Spaniard | 805 | 1.3% |
| Spanish | 153 | 0.3% |
| Spanish American | 8 | 0.0% |
| Sri Lankan | 103 | 0.2% |
| Subsaharan African | 262 | 0.4% |
| Swedish | 688 | 1.1% |
| Swiss | 138 | 0.2% |
| Thai | 796 | 1.3% |
| Tlingit-Haida | 11 | 0.0% |
| Tongan | 60 | 0.1% |
| Turkish | 19 | 0.0% |
| Ukrainian | 107 | 0.2% |
| Venezuelan | 11 | 0.0% |
| Welsh | 176 | 0.3% |
| Yaqui | 11 | 0.0% |
| Yugoslavian | 71 | 0.1% | View All 105 Rows |
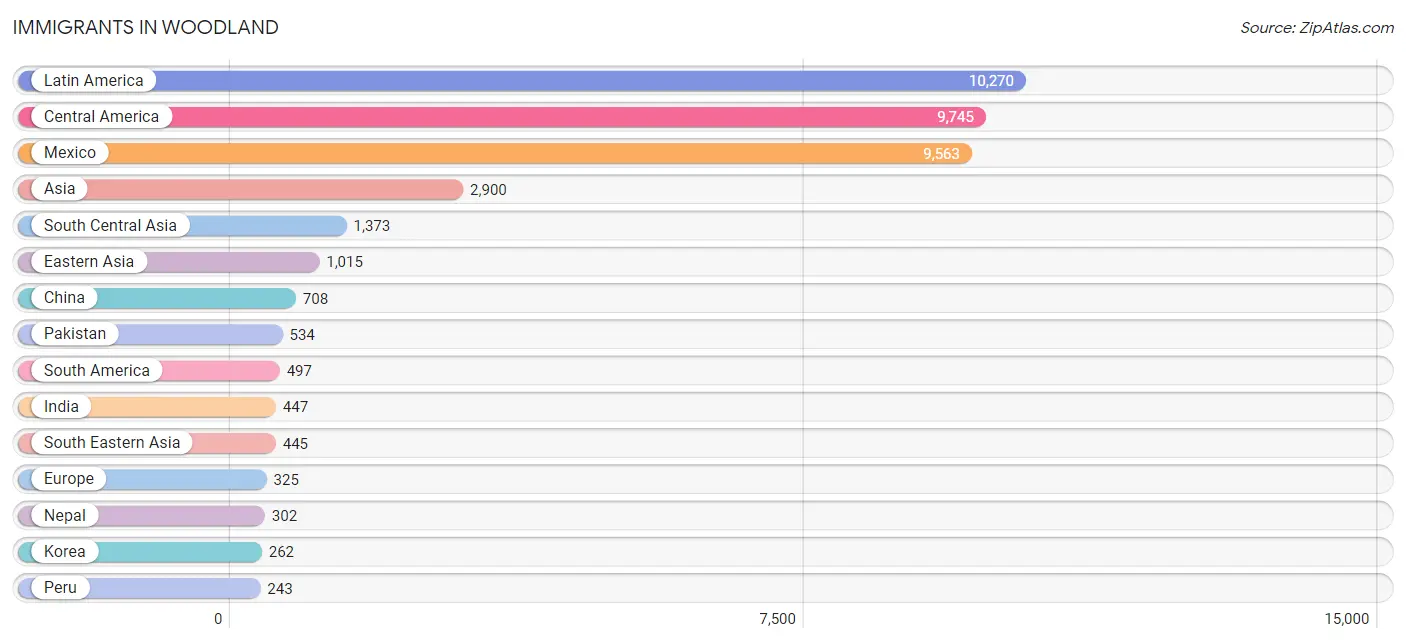
Immigrants in Woodland
The most numerous immigrant groups reported in Woodland came from Latin America (10,270 | 16.8%), Central America (9,745 | 15.9%), Mexico (9,563 | 15.6%), Asia (2,900 | 4.7%), and South Central Asia (1,373 | 2.2%), together accounting for 55.3% of all Woodland residents.
| Immigration Origin | # Population | % Population |
| Africa | 181 | 0.3% |
| Argentina | 63 | 0.1% |
| Armenia | 4 | 0.0% |
| Asia | 2,900 | 4.7% |
| Brazil | 20 | 0.0% |
| Cambodia | 166 | 0.3% |
| Canada | 91 | 0.2% |
| Caribbean | 28 | 0.1% |
| Central America | 9,745 | 15.9% |
| Chile | 17 | 0.0% |
| China | 708 | 1.2% |
| Colombia | 126 | 0.2% |
| Denmark | 11 | 0.0% |
| Eastern Africa | 22 | 0.0% |
| Eastern Asia | 1,015 | 1.7% |
| Eastern Europe | 87 | 0.1% |
| Ecuador | 17 | 0.0% |
| El Salvador | 68 | 0.1% |
| England | 17 | 0.0% |
| Ethiopia | 8 | 0.0% |
| Europe | 325 | 0.5% |
| Fiji | 72 | 0.1% |
| France | 41 | 0.1% |
| Germany | 22 | 0.0% |
| Ghana | 7 | 0.0% |
| Guatemala | 77 | 0.1% |
| Honduras | 37 | 0.1% |
| Hong Kong | 81 | 0.1% |
| Hungary | 9 | 0.0% |
| India | 447 | 0.7% |
| Indonesia | 8 | 0.0% |
| Iran | 50 | 0.1% |
| Iraq | 27 | 0.0% |
| Ireland | 4 | 0.0% |
| Israel | 10 | 0.0% |
| Italy | 21 | 0.0% |
| Jamaica | 28 | 0.1% |
| Japan | 45 | 0.1% |
| Korea | 262 | 0.4% |
| Latin America | 10,270 | 16.8% |
| Lebanon | 10 | 0.0% |
| Liberia | 28 | 0.1% |
| Mexico | 9,563 | 15.6% |
| Middle Africa | 9 | 0.0% |
| Nepal | 302 | 0.5% |
| Netherlands | 6 | 0.0% |
| Nigeria | 87 | 0.1% |
| Northern Europe | 111 | 0.2% |
| Norway | 8 | 0.0% |
| Oceania | 96 | 0.2% |
| Pakistan | 534 | 0.9% |
| Peru | 243 | 0.4% |
| Philippines | 220 | 0.4% |
| Portugal | 6 | 0.0% |
| South Africa | 15 | 0.0% |
| South America | 497 | 0.8% |
| South Central Asia | 1,373 | 2.2% |
| South Eastern Asia | 445 | 0.7% |
| Southern Europe | 58 | 0.1% |
| Spain | 31 | 0.1% |
| Sri Lanka | 25 | 0.0% |
| Sweden | 9 | 0.0% |
| Taiwan | 157 | 0.3% |
| Thailand | 26 | 0.0% |
| Ukraine | 78 | 0.1% |
| Uzbekistan | 15 | 0.0% |
| Venezuela | 11 | 0.0% |
| Vietnam | 25 | 0.0% |
| Western Africa | 122 | 0.2% |
| Western Asia | 67 | 0.1% |
| Western Europe | 69 | 0.1% |
| Zaire | 9 | 0.0% | View All 72 Rows |
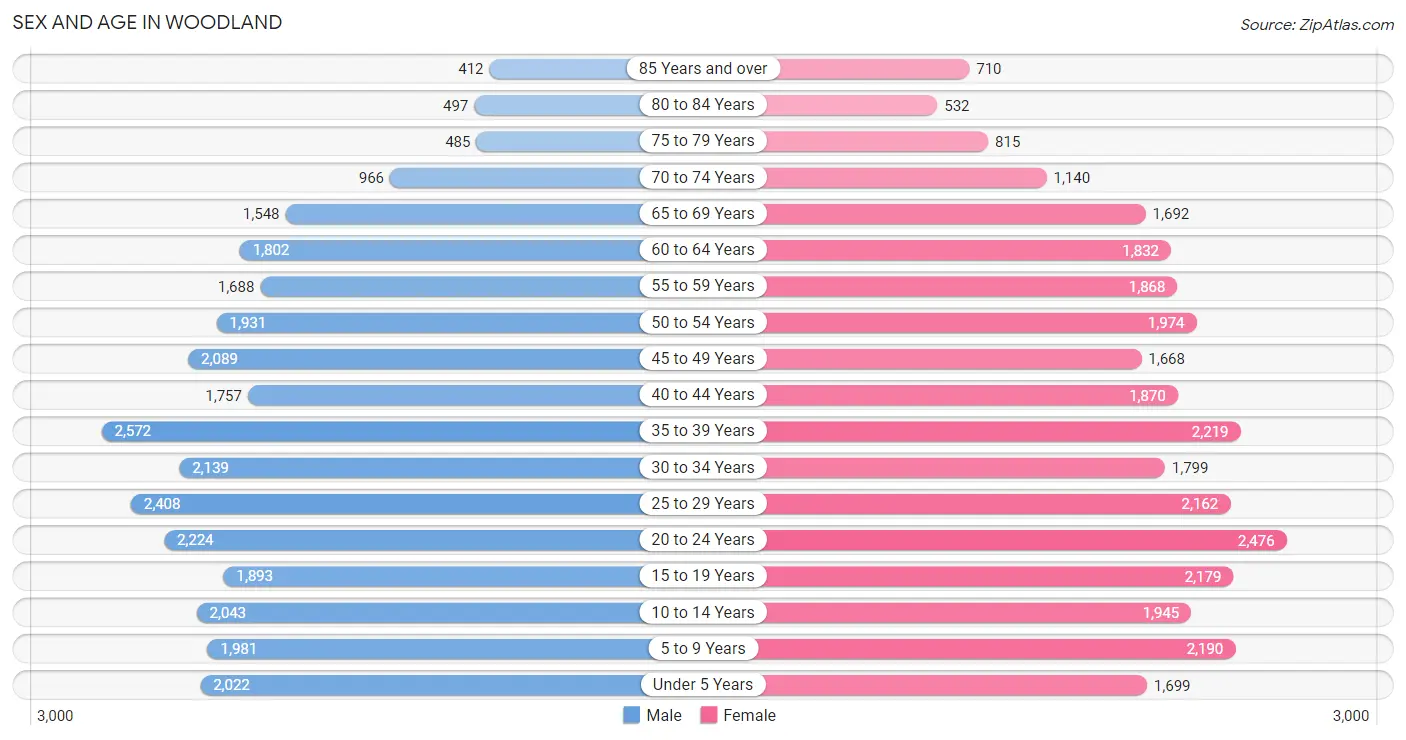
Sex and Age in Woodland
Sex and Age in Woodland
The most populous age groups in Woodland are 35 to 39 Years (2,572 | 8.4%) for men and 20 to 24 Years (2,476 | 8.1%) for women.
| Age Bracket | Male | Female |
| Under 5 Years | 2,022 (6.6%) | 1,699 (5.5%) |
| 5 to 9 Years | 1,981 (6.5%) | 2,190 (7.1%) |
| 10 to 14 Years | 2,043 (6.7%) | 1,945 (6.3%) |
| 15 to 19 Years | 1,893 (6.2%) | 2,179 (7.1%) |
| 20 to 24 Years | 2,224 (7.3%) | 2,476 (8.1%) |
| 25 to 29 Years | 2,408 (7.9%) | 2,162 (7.0%) |
| 30 to 34 Years | 2,139 (7.0%) | 1,799 (5.9%) |
| 35 to 39 Years | 2,572 (8.4%) | 2,219 (7.2%) |
| 40 to 44 Years | 1,757 (5.8%) | 1,870 (6.1%) |
| 45 to 49 Years | 2,089 (6.9%) | 1,668 (5.4%) |
| 50 to 54 Years | 1,931 (6.3%) | 1,974 (6.4%) |
| 55 to 59 Years | 1,688 (5.5%) | 1,868 (6.1%) |
| 60 to 64 Years | 1,802 (5.9%) | 1,832 (5.9%) |
| 65 to 69 Years | 1,548 (5.1%) | 1,692 (5.5%) |
| 70 to 74 Years | 966 (3.2%) | 1,140 (3.7%) |
| 75 to 79 Years | 485 (1.6%) | 815 (2.6%) |
| 80 to 84 Years | 497 (1.6%) | 532 (1.7%) |
| 85 Years and over | 412 (1.3%) | 710 (2.3%) |
| Total | 30,457 (100.0%) | 30,770 (100.0%) |
Families and Households in Woodland
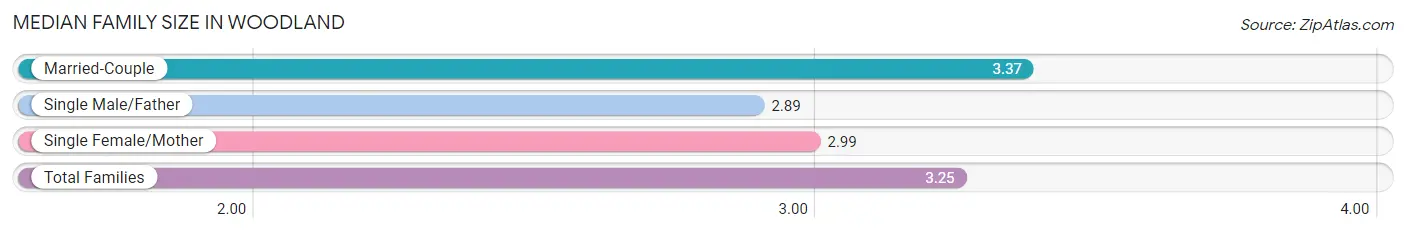
Median Family Size in Woodland
The median family size in Woodland is 3.25 persons per family, with married-couple families (10,996 | 70.6%) accounting for the largest median family size of 3.37 persons per family. On the other hand, single male/father families (1,342 | 8.6%) represent the smallest median family size with 2.89 persons per family.
| Family Type | # Families | Family Size |
| Married-Couple | 10,996 (70.6%) | 3.37 |
| Single Male/Father | 1,342 (8.6%) | 2.89 |
| Single Female/Mother | 3,234 (20.8%) | 2.99 |
| Total Families | 15,572 (100.0%) | 3.25 |
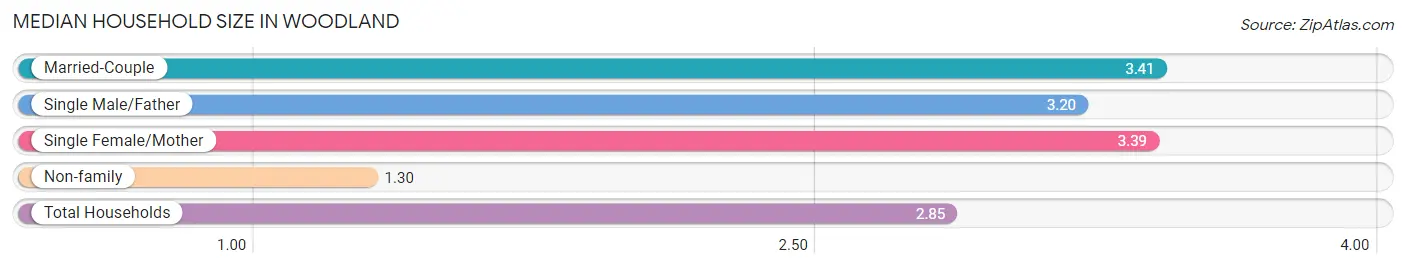
Median Household Size in Woodland
The median household size in Woodland is 2.85 persons per household, with married-couple households (10,996 | 52.2%) accounting for the largest median household size of 3.41 persons per household. non-family households (5,506 | 26.1%) represent the smallest median household size with 1.30 persons per household.
| Household Type | # Households | Household Size |
| Married-Couple | 10,996 (52.2%) | 3.41 |
| Single Male/Father | 1,342 (6.4%) | 3.20 |
| Single Female/Mother | 3,234 (15.3%) | 3.39 |
| Non-family | 5,506 (26.1%) | 1.30 |
| Total Households | 21,078 (100.0%) | 2.85 |
Household Size by Marriage Status in Woodland
Out of a total of 21,078 households in Woodland, 15,572 (73.9%) are family households, while 5,506 (26.1%) are nonfamily households. The most numerous type of family households are 2-person households, comprising 5,451, and the most common type of nonfamily households are 1-person households, comprising 4,208.
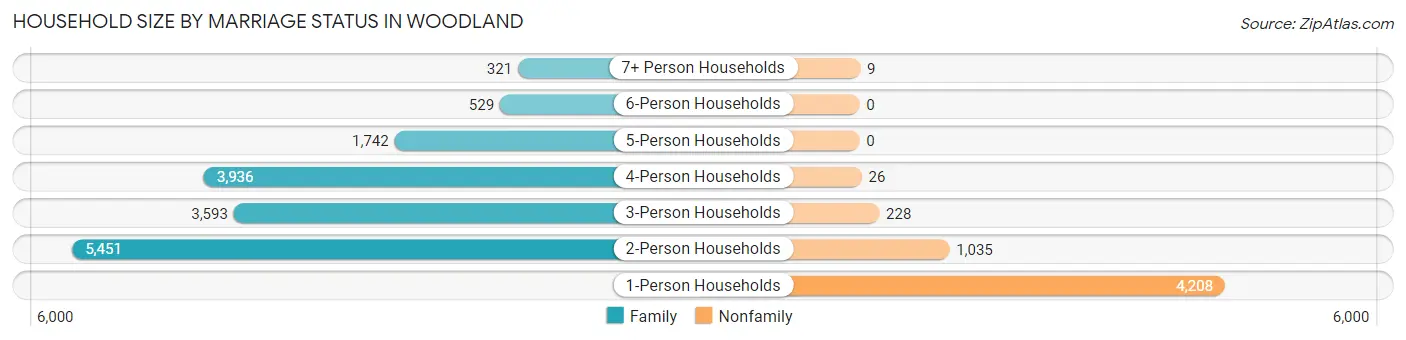
| Household Size | Family Households | Nonfamily Households |
| 1-Person Households | - | 4,208 (20.0%) |
| 2-Person Households | 5,451 (25.9%) | 1,035 (4.9%) |
| 3-Person Households | 3,593 (17.1%) | 228 (1.1%) |
| 4-Person Households | 3,936 (18.7%) | 26 (0.1%) |
| 5-Person Households | 1,742 (8.3%) | 0 (0.0%) |
| 6-Person Households | 529 (2.5%) | 0 (0.0%) |
| 7+ Person Households | 321 (1.5%) | 9 (0.0%) |
| Total | 15,572 (73.9%) | 5,506 (26.1%) |
Female Fertility in Woodland
Fertility by Age in Woodland
Average fertility rate in Woodland is 67.0 births per 1,000 women. Women in the age bracket of 20 to 34 years have the highest fertility rate with 96.0 births per 1,000 women. Women in the age bracket of 20 to 34 years acount for 61.9% of all women with births.
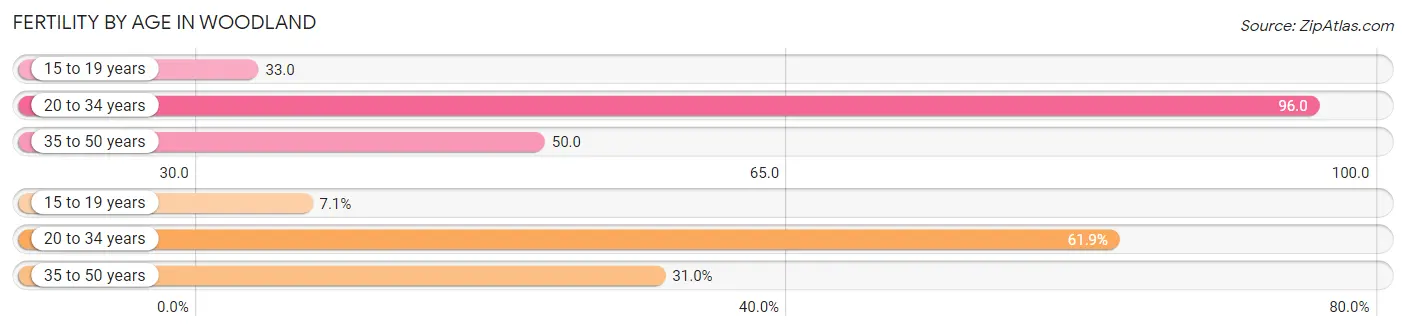
| Age Bracket | Women with Births | Births / 1,000 Women |
| 15 to 19 years | 71 (7.1%) | 33.0 |
| 20 to 34 years | 620 (61.9%) | 96.0 |
| 35 to 50 years | 311 (31.0%) | 50.0 |
| Total | 1,002 (100.0%) | 67.0 |
Fertility by Age by Marriage Status in Woodland
55.0% of women with births (1,002) in Woodland are married. The highest percentage of unmarried women with births falls into 15 to 19 years age bracket with 100.0% of them unmarried at the time of birth, while the lowest percentage of unmarried women with births belong to 20 to 34 years age bracket with 29.8% of them unmarried.
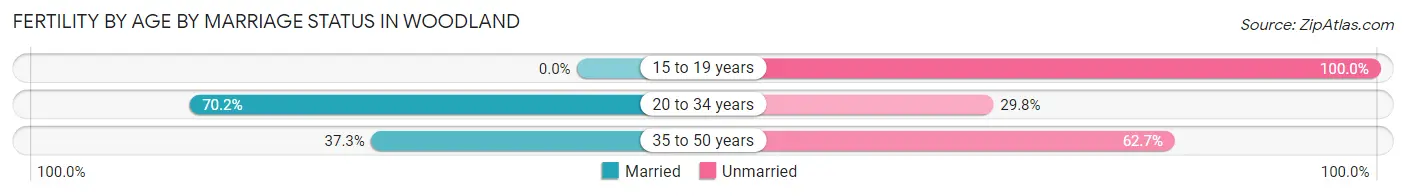
| Age Bracket | Married | Unmarried |
| 15 to 19 years | 0 (0.0%) | 71 (100.0%) |
| 20 to 34 years | 435 (70.2%) | 185 (29.8%) |
| 35 to 50 years | 116 (37.3%) | 195 (62.7%) |
| Total | 551 (55.0%) | 451 (45.0%) |
Fertility by Education in Woodland
Average fertility rate in Woodland is 67.0 births per 1,000 women. Women with the education attainment of college or associate's degree have the highest fertility rate of 91.0 births per 1,000 women, while women with the education attainment of bachelor's degree have the lowest fertility at 40.0 births per 1,000 women. Women with the education attainment of college or associate's degree represent 46.6% of all women with births.
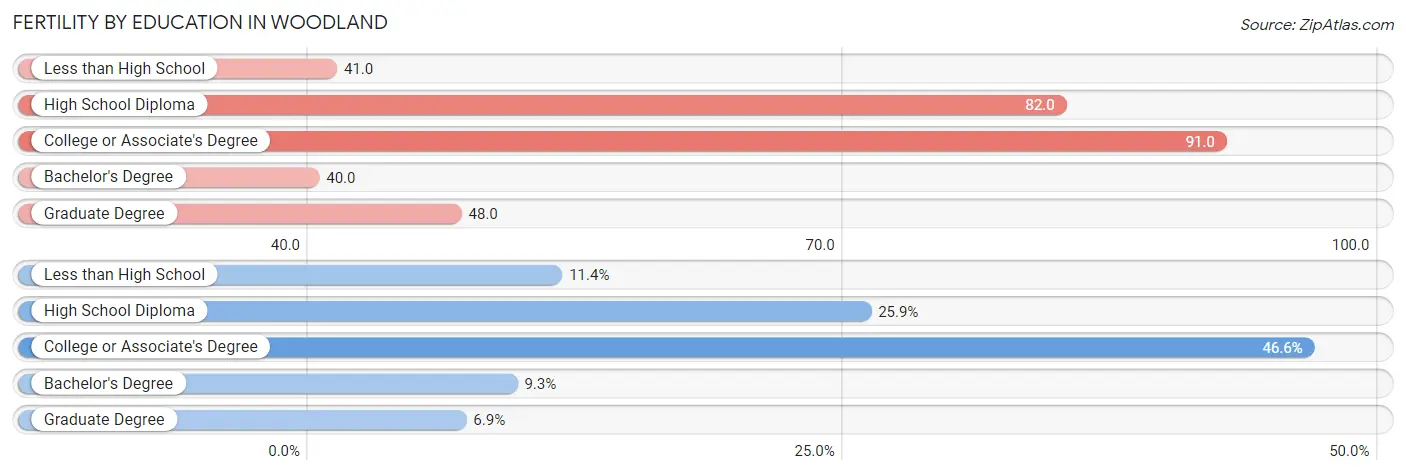
| Educational Attainment | Women with Births | Births / 1,000 Women |
| Less than High School | 114 (11.4%) | 41.0 |
| High School Diploma | 259 (25.9%) | 82.0 |
| College or Associate's Degree | 467 (46.6%) | 91.0 |
| Bachelor's Degree | 93 (9.3%) | 40.0 |
| Graduate Degree | 69 (6.9%) | 48.0 |
| Total | 1,002 (100.0%) | 67.0 |
Fertility by Education by Marriage Status in Woodland
45.0% of women with births in Woodland are unmarried. Women with the educational attainment of bachelor's degree are most likely to be married with 100.0% of them married at childbirth, while women with the educational attainment of less than high school are least likely to be married with 80.7% of them unmarried at childbirth.
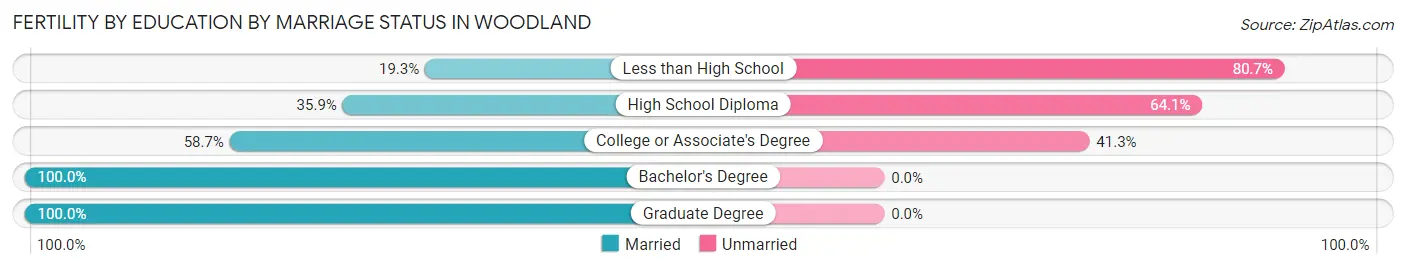
| Educational Attainment | Married | Unmarried |
| Less than High School | 22 (19.3%) | 92 (80.7%) |
| High School Diploma | 93 (35.9%) | 166 (64.1%) |
| College or Associate's Degree | 274 (58.7%) | 193 (41.3%) |
| Bachelor's Degree | 93 (100.0%) | 0 (0.0%) |
| Graduate Degree | 69 (100.0%) | 0 (0.0%) |
| Total | 551 (55.0%) | 451 (45.0%) |
Employment Characteristics in Woodland
Employment by Class of Employer in Woodland
Among the 29,842 employed individuals in Woodland, private company employees (18,273 | 61.2%), local government employees (3,649 | 12.2%), and state government employees (3,034 | 10.2%) make up the most common classes of employment.
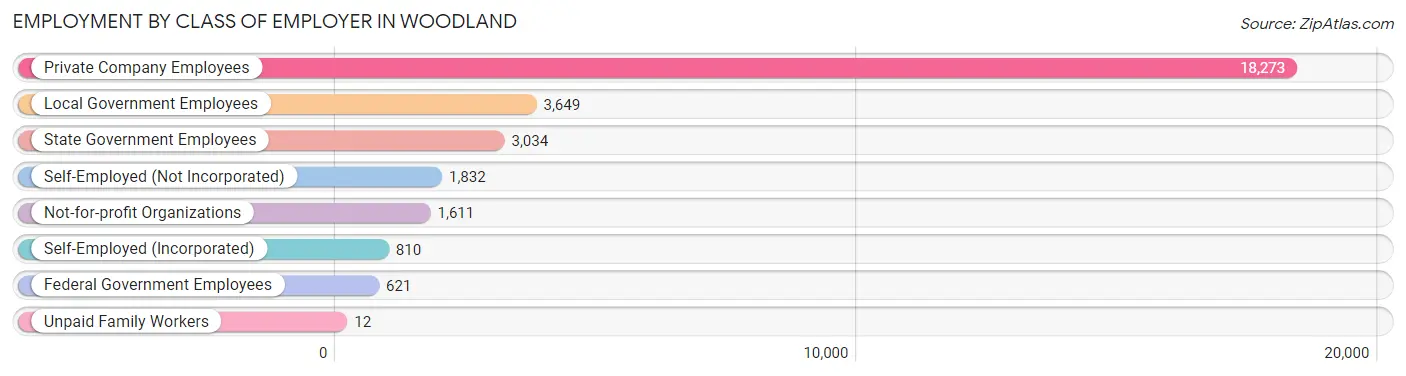
| Employer Class | # Employees | % Employees |
| Private Company Employees | 18,273 | 61.2% |
| Self-Employed (Incorporated) | 810 | 2.7% |
| Self-Employed (Not Incorporated) | 1,832 | 6.1% |
| Not-for-profit Organizations | 1,611 | 5.4% |
| Local Government Employees | 3,649 | 12.2% |
| State Government Employees | 3,034 | 10.2% |
| Federal Government Employees | 621 | 2.1% |
| Unpaid Family Workers | 12 | 0.0% |
| Total | 29,842 | 100.0% |
Employment Status by Age in Woodland
According to the labor force statistics for Woodland, out of the total population over 16 years of age (48,279), 66.1% or 31,912 individuals are in the labor force, with 5.0% or 1,596 of them unemployed. The age group with the highest labor force participation rate is 45 to 54 years, with 85.7% or 6,566 individuals in the labor force. Within the labor force, the 16 to 19 years age range has the highest percentage of unemployed individuals, with 25.2% or 215 of them being unemployed.
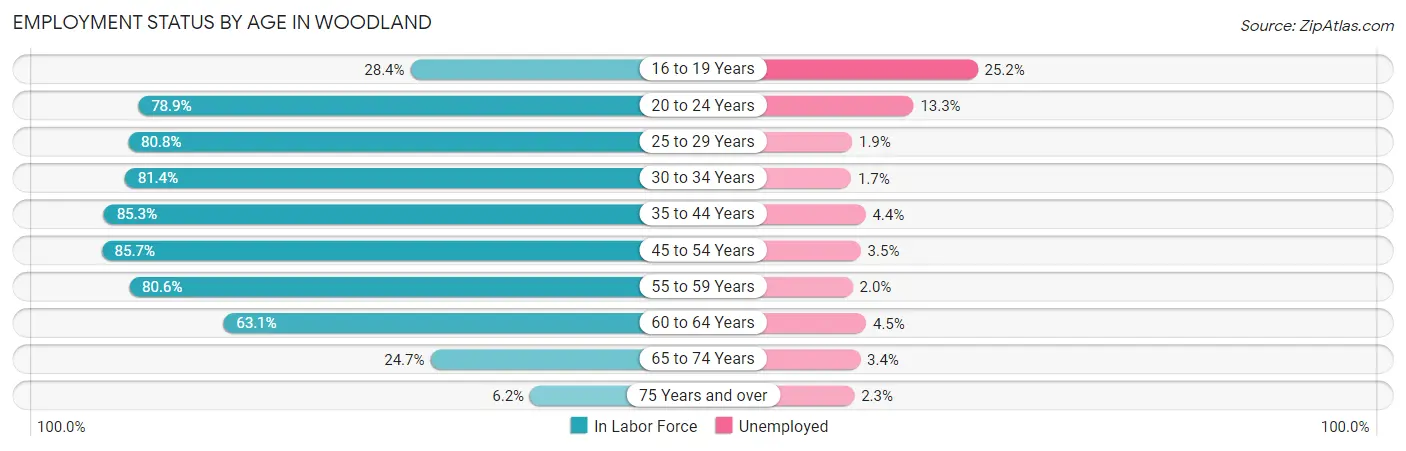
| Age Bracket | In Labor Force | Unemployed |
| 16 to 19 Years | 853 (28.4%) | 215 (25.2%) |
| 20 to 24 Years | 3,708 (78.9%) | 493 (13.3%) |
| 25 to 29 Years | 3,693 (80.8%) | 70 (1.9%) |
| 30 to 34 Years | 3,206 (81.4%) | 55 (1.7%) |
| 35 to 44 Years | 7,181 (85.3%) | 316 (4.4%) |
| 45 to 54 Years | 6,566 (85.7%) | 230 (3.5%) |
| 55 to 59 Years | 2,866 (80.6%) | 57 (2.0%) |
| 60 to 64 Years | 2,293 (63.1%) | 103 (4.5%) |
| 65 to 74 Years | 1,320 (24.7%) | 45 (3.4%) |
| 75 Years and over | 214 (6.2%) | 5 (2.3%) |
| Total | 31,912 (66.1%) | 1,596 (5.0%) |
Employment Status by Educational Attainment in Woodland
According to labor force statistics for Woodland, 81.2% of individuals (25,804) out of the total population between 25 and 64 years of age (31,778) are in the labor force, with 3.2% or 826 of them being unemployed. The group with the highest labor force participation rate are those with the educational attainment of bachelor's degree or higher, with 87.9% or 8,160 individuals in the labor force. Within the labor force, individuals with high school diploma education have the highest percentage of unemployment, with 3.9% or 238 of them being unemployed.
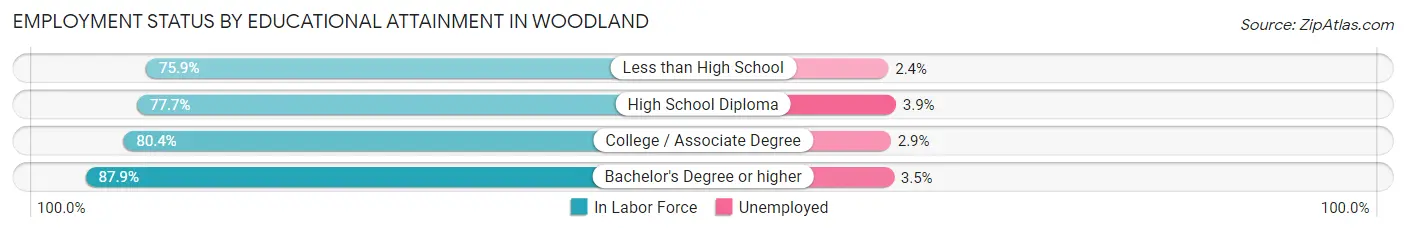
| Educational Attainment | In Labor Force | Unemployed |
| Less than High School | 3,888 (75.9%) | 123 (2.4%) |
| High School Diploma | 6,113 (77.7%) | 307 (3.9%) |
| College / Associate Degree | 7,642 (80.4%) | 276 (2.9%) |
| Bachelor's Degree or higher | 8,160 (87.9%) | 325 (3.5%) |
| Total | 25,804 (81.2%) | 1,017 (3.2%) |
Employment Occupations by Sex in Woodland
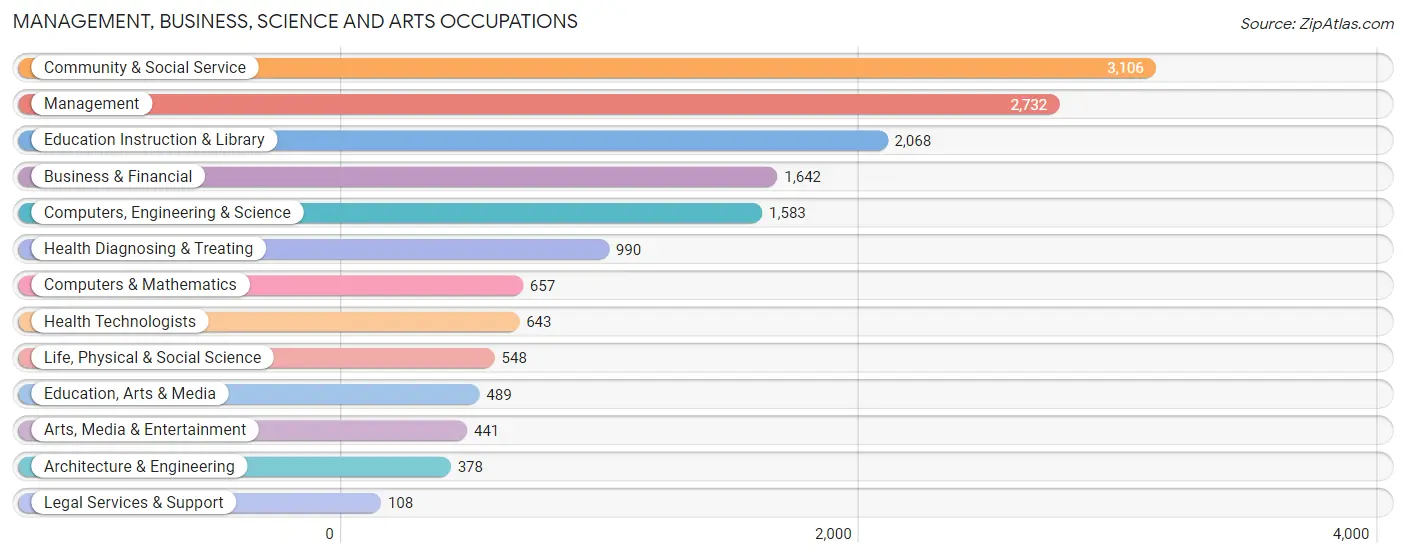
Management, Business, Science and Arts Occupations
The most common Management, Business, Science and Arts occupations in Woodland are Community & Social Service (3,106 | 10.3%), Management (2,732 | 9.1%), Education Instruction & Library (2,068 | 6.9%), Business & Financial (1,642 | 5.4%), and Computers, Engineering & Science (1,583 | 5.3%).
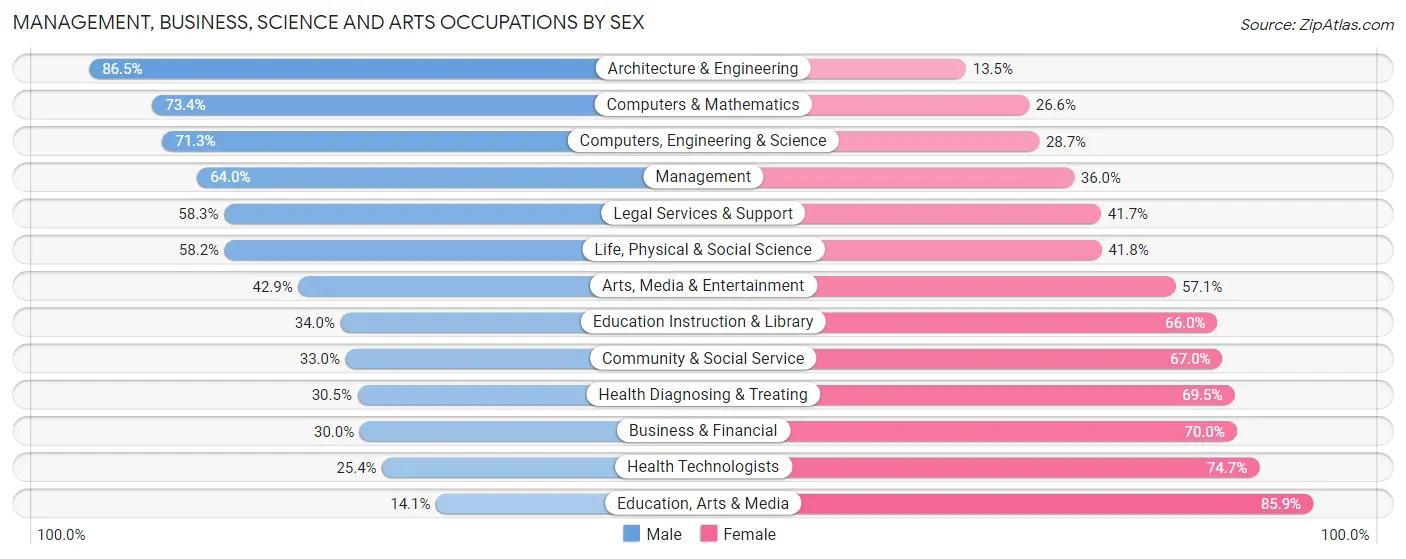
Management, Business, Science and Arts Occupations by Sex
Within the Management, Business, Science and Arts occupations in Woodland, the most male-oriented occupations are Architecture & Engineering (86.5%), Computers & Mathematics (73.4%), and Computers, Engineering & Science (71.3%), while the most female-oriented occupations are Education, Arts & Media (85.9%), Health Technologists (74.7%), and Business & Financial (70.0%).
| Occupation | Male | Female |
| Management | 1,748 (64.0%) | 984 (36.0%) |
| Business & Financial | 493 (30.0%) | 1,149 (70.0%) |
| Computers, Engineering & Science | 1,128 (71.3%) | 455 (28.7%) |
| Computers & Mathematics | 482 (73.4%) | 175 (26.6%) |
| Architecture & Engineering | 327 (86.5%) | 51 (13.5%) |
| Life, Physical & Social Science | 319 (58.2%) | 229 (41.8%) |
| Community & Social Service | 1,025 (33.0%) | 2,081 (67.0%) |
| Education, Arts & Media | 69 (14.1%) | 420 (85.9%) |
| Legal Services & Support | 63 (58.3%) | 45 (41.7%) |
| Education Instruction & Library | 704 (34.0%) | 1,364 (66.0%) |
| Arts, Media & Entertainment | 189 (42.9%) | 252 (57.1%) |
| Health Diagnosing & Treating | 302 (30.5%) | 688 (69.5%) |
| Health Technologists | 163 (25.4%) | 480 (74.7%) |
| Total (Category) | 4,696 (46.7%) | 5,357 (53.3%) |
| Total (Overall) | 16,374 (54.4%) | 13,736 (45.6%) |
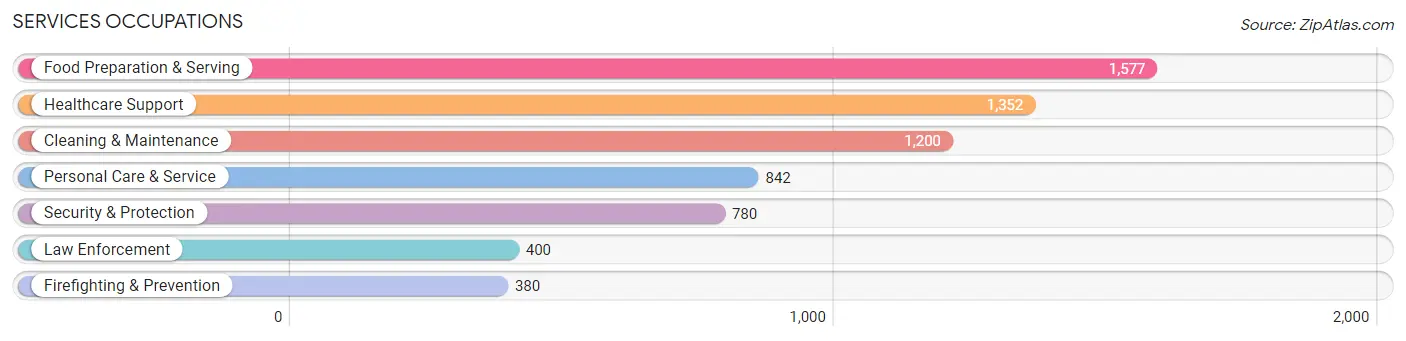
Services Occupations
The most common Services occupations in Woodland are Food Preparation & Serving (1,577 | 5.2%), Healthcare Support (1,352 | 4.5%), Cleaning & Maintenance (1,200 | 4.0%), Personal Care & Service (842 | 2.8%), and Security & Protection (780 | 2.6%).
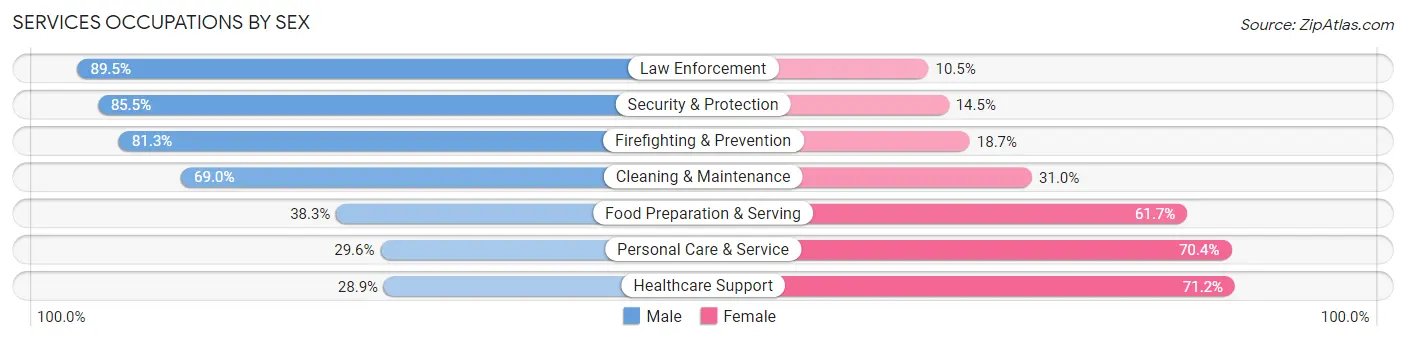
Services Occupations by Sex
Within the Services occupations in Woodland, the most male-oriented occupations are Law Enforcement (89.5%), Security & Protection (85.5%), and Firefighting & Prevention (81.3%), while the most female-oriented occupations are Healthcare Support (71.2%), Personal Care & Service (70.4%), and Food Preparation & Serving (61.7%).
| Occupation | Male | Female |
| Healthcare Support | 390 (28.8%) | 962 (71.2%) |
| Security & Protection | 667 (85.5%) | 113 (14.5%) |
| Firefighting & Prevention | 309 (81.3%) | 71 (18.7%) |
| Law Enforcement | 358 (89.5%) | 42 (10.5%) |
| Food Preparation & Serving | 604 (38.3%) | 973 (61.7%) |
| Cleaning & Maintenance | 828 (69.0%) | 372 (31.0%) |
| Personal Care & Service | 249 (29.6%) | 593 (70.4%) |
| Total (Category) | 2,738 (47.6%) | 3,013 (52.4%) |
| Total (Overall) | 16,374 (54.4%) | 13,736 (45.6%) |
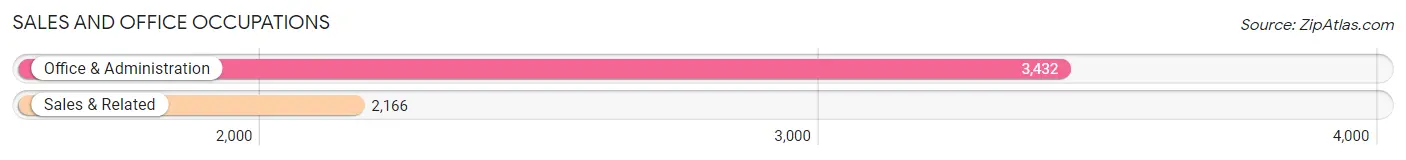
Sales and Office Occupations
The most common Sales and Office occupations in Woodland are Office & Administration (3,432 | 11.4%), and Sales & Related (2,166 | 7.2%).
Sales and Office Occupations by Sex
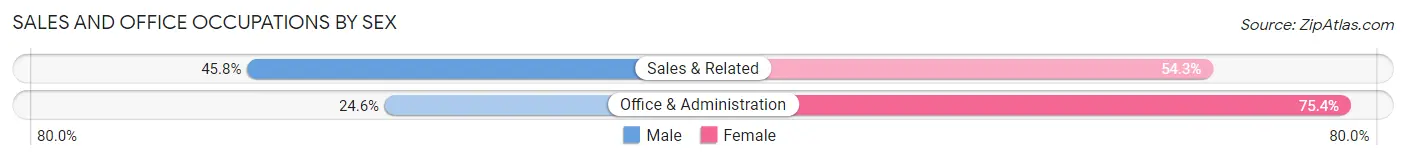
| Occupation | Male | Female |
| Sales & Related | 991 (45.8%) | 1,175 (54.2%) |
| Office & Administration | 843 (24.6%) | 2,589 (75.4%) |
| Total (Category) | 1,834 (32.8%) | 3,764 (67.2%) |
| Total (Overall) | 16,374 (54.4%) | 13,736 (45.6%) |
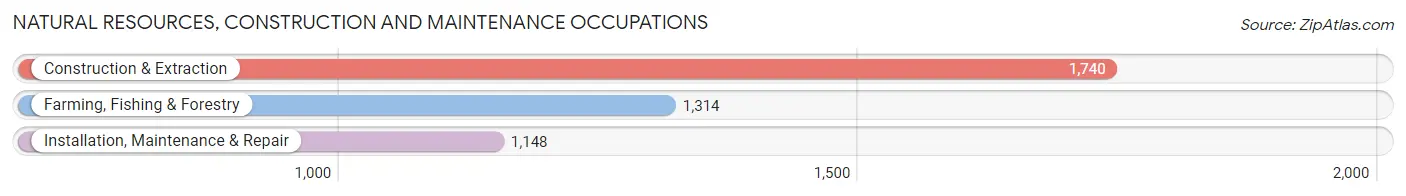
Natural Resources, Construction and Maintenance Occupations
The most common Natural Resources, Construction and Maintenance occupations in Woodland are Construction & Extraction (1,740 | 5.8%), Farming, Fishing & Forestry (1,314 | 4.4%), and Installation, Maintenance & Repair (1,148 | 3.8%).
Natural Resources, Construction and Maintenance Occupations by Sex
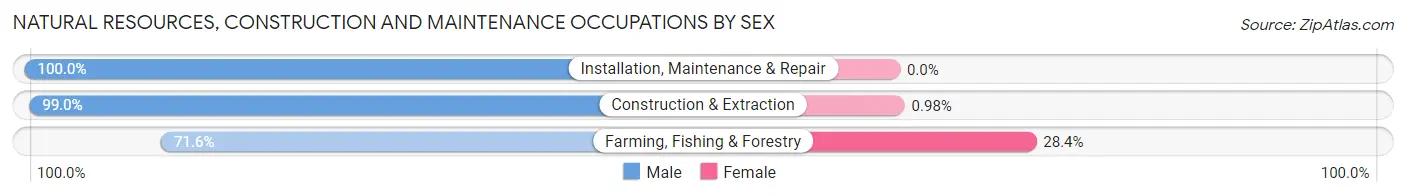
| Occupation | Male | Female |
| Farming, Fishing & Forestry | 941 (71.6%) | 373 (28.4%) |
| Construction & Extraction | 1,723 (99.0%) | 17 (1.0%) |
| Installation, Maintenance & Repair | 1,148 (100.0%) | 0 (0.0%) |
| Total (Category) | 3,812 (90.7%) | 390 (9.3%) |
| Total (Overall) | 16,374 (54.4%) | 13,736 (45.6%) |
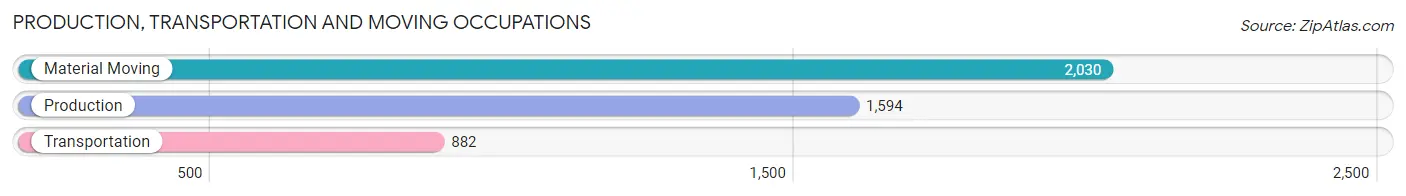
Production, Transportation and Moving Occupations
The most common Production, Transportation and Moving occupations in Woodland are Material Moving (2,030 | 6.7%), Production (1,594 | 5.3%), and Transportation (882 | 2.9%).
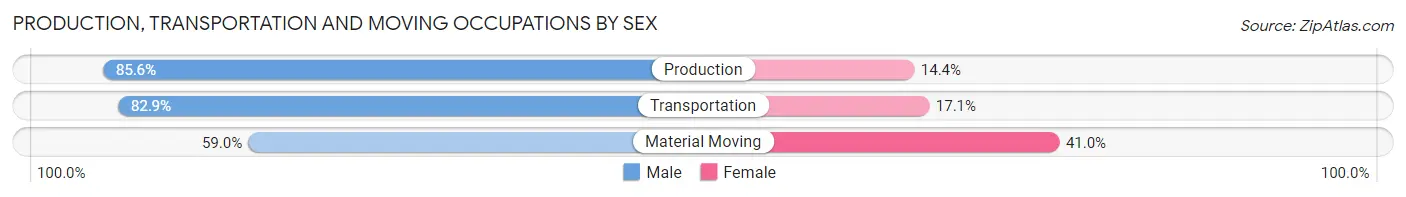
Production, Transportation and Moving Occupations by Sex
| Occupation | Male | Female |
| Production | 1,365 (85.6%) | 229 (14.4%) |
| Transportation | 731 (82.9%) | 151 (17.1%) |
| Material Moving | 1,198 (59.0%) | 832 (41.0%) |
| Total (Category) | 3,294 (73.1%) | 1,212 (26.9%) |
| Total (Overall) | 16,374 (54.4%) | 13,736 (45.6%) |
Employment Industries by Sex in Woodland
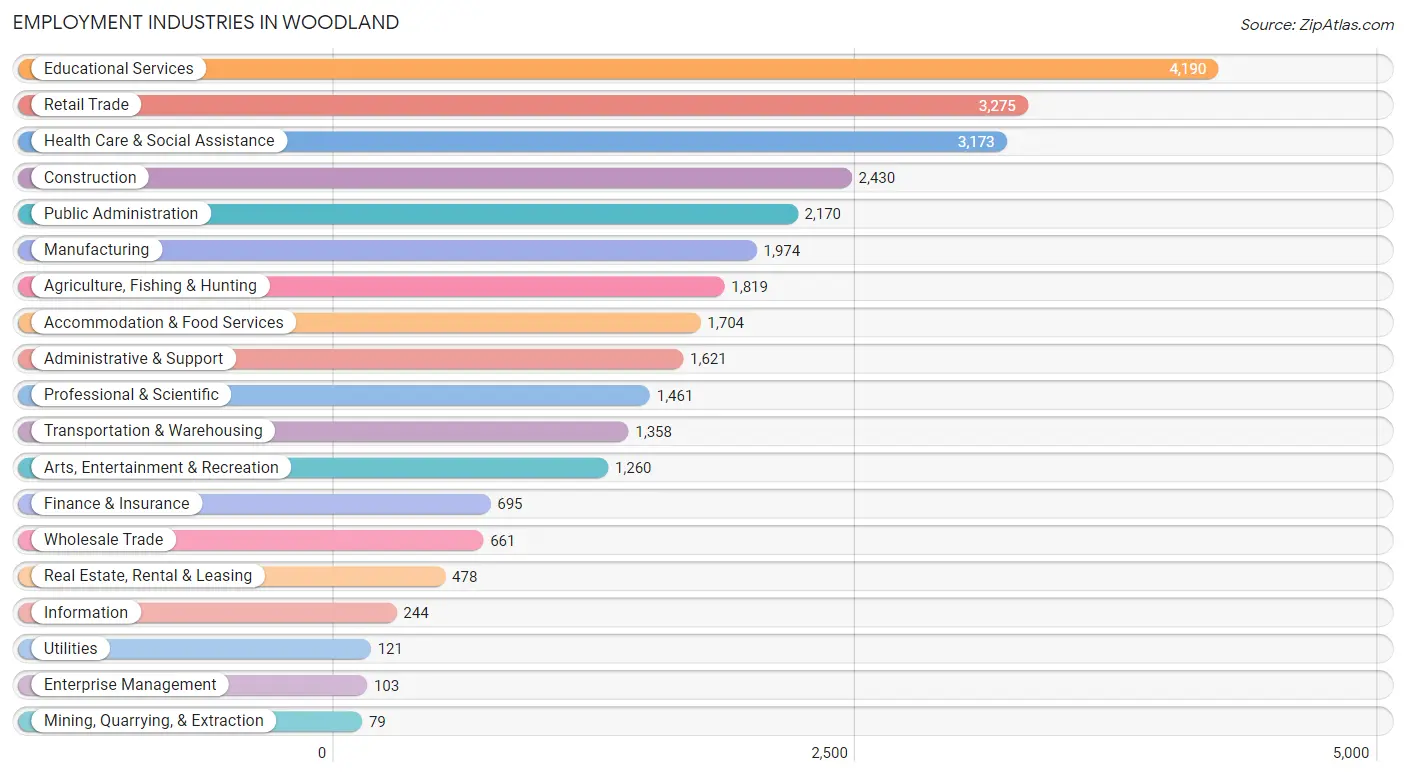
Employment Industries in Woodland
The major employment industries in Woodland include Educational Services (4,190 | 13.9%), Retail Trade (3,275 | 10.9%), Health Care & Social Assistance (3,173 | 10.5%), Construction (2,430 | 8.1%), and Public Administration (2,170 | 7.2%).
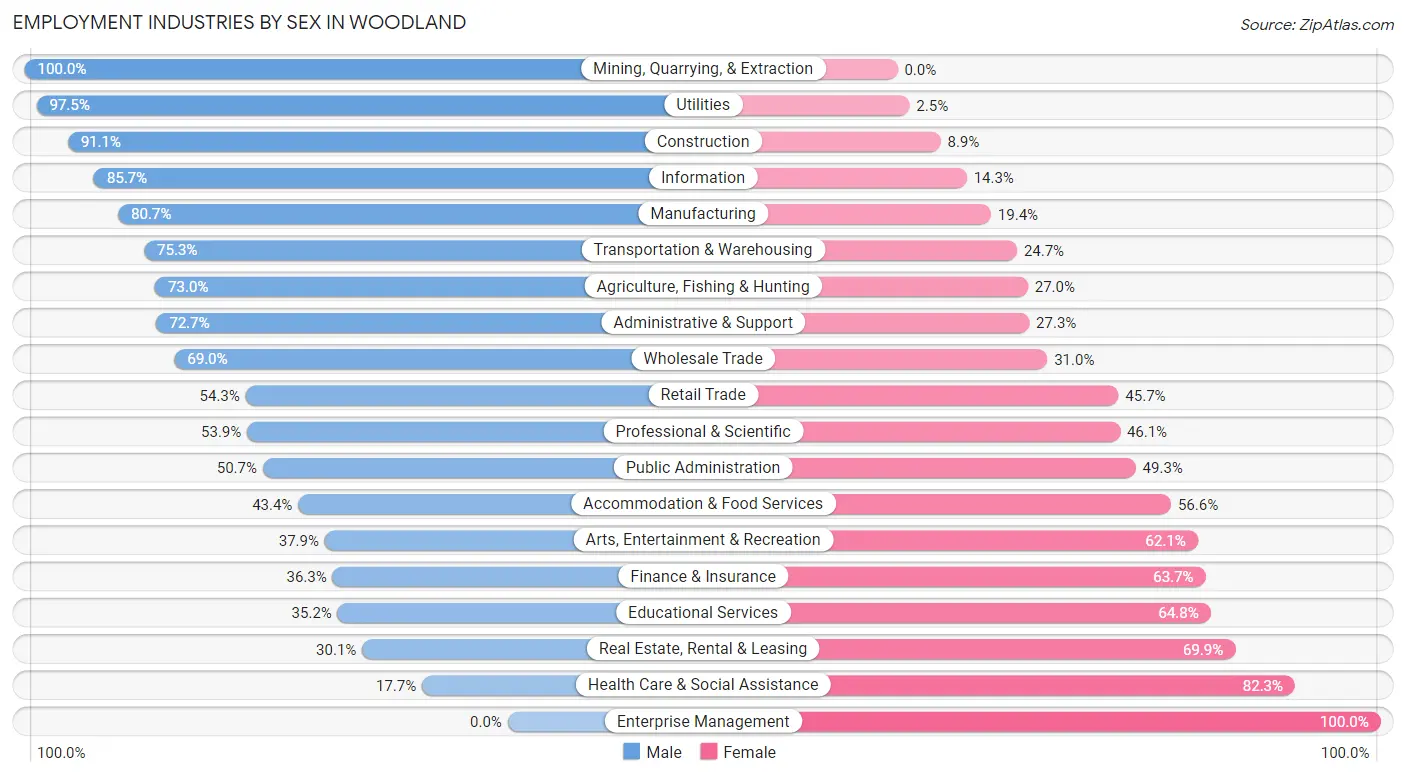
Employment Industries by Sex in Woodland
The Woodland industries that see more men than women are Mining, Quarrying, & Extraction (100.0%), Utilities (97.5%), and Construction (91.1%), whereas the industries that tend to have a higher number of women are Enterprise Management (100.0%), Health Care & Social Assistance (82.3%), and Real Estate, Rental & Leasing (69.9%).
| Industry | Male | Female |
| Agriculture, Fishing & Hunting | 1,328 (73.0%) | 491 (27.0%) |
| Mining, Quarrying, & Extraction | 79 (100.0%) | 0 (0.0%) |
| Construction | 2,213 (91.1%) | 217 (8.9%) |
| Manufacturing | 1,592 (80.6%) | 382 (19.4%) |
| Wholesale Trade | 456 (69.0%) | 205 (31.0%) |
| Retail Trade | 1,777 (54.3%) | 1,498 (45.7%) |
| Transportation & Warehousing | 1,022 (75.3%) | 336 (24.7%) |
| Utilities | 118 (97.5%) | 3 (2.5%) |
| Information | 209 (85.7%) | 35 (14.3%) |
| Finance & Insurance | 252 (36.3%) | 443 (63.7%) |
| Real Estate, Rental & Leasing | 144 (30.1%) | 334 (69.9%) |
| Professional & Scientific | 788 (53.9%) | 673 (46.1%) |
| Enterprise Management | 0 (0.0%) | 103 (100.0%) |
| Administrative & Support | 1,179 (72.7%) | 442 (27.3%) |
| Educational Services | 1,475 (35.2%) | 2,715 (64.8%) |
| Health Care & Social Assistance | 563 (17.7%) | 2,610 (82.3%) |
| Arts, Entertainment & Recreation | 477 (37.9%) | 783 (62.1%) |
| Accommodation & Food Services | 739 (43.4%) | 965 (56.6%) |
| Public Administration | 1,100 (50.7%) | 1,070 (49.3%) |
| Total | 16,374 (54.4%) | 13,736 (45.6%) |
Education in Woodland
School Enrollment in Woodland
The most common levels of schooling among the 16,342 students in Woodland are college / undergraduate (4,088 | 25.0%), elementary school (3,607 | 22.1%), and high school (3,470 | 21.2%).
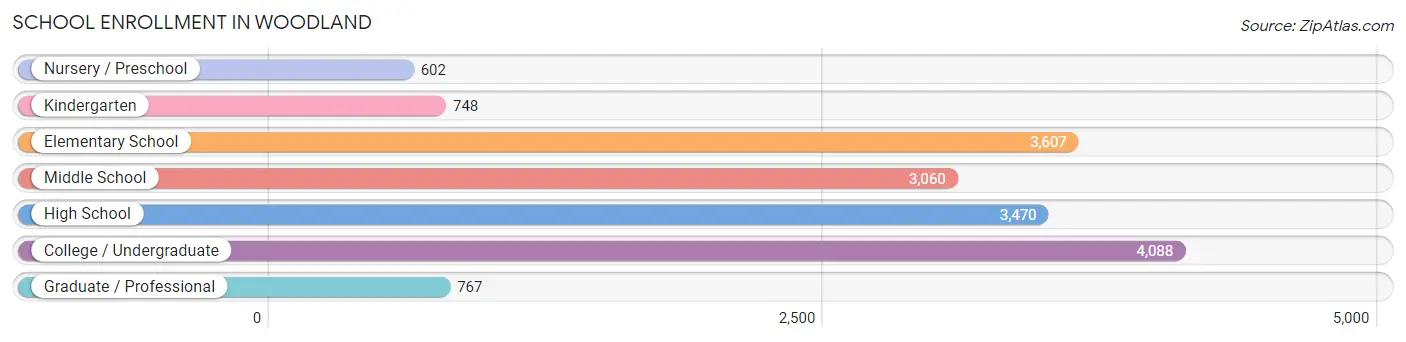
| School Level | # Students | % Students |
| Nursery / Preschool | 602 | 3.7% |
| Kindergarten | 748 | 4.6% |
| Elementary School | 3,607 | 22.1% |
| Middle School | 3,060 | 18.7% |
| High School | 3,470 | 21.2% |
| College / Undergraduate | 4,088 | 25.0% |
| Graduate / Professional | 767 | 4.7% |
| Total | 16,342 | 100.0% |
School Enrollment by Age by Funding Source in Woodland
Out of a total of 16,342 students who are enrolled in schools in Woodland, 1,340 (8.2%) attend a private institution, while the remaining 15,002 (91.8%) are enrolled in public schools. The age group of 3 to 4 year olds has the highest likelihood of being enrolled in private schools, with 243 (42.5% in the age bracket) enrolled. Conversely, the age group of 18 to 19 year olds has the lowest likelihood of being enrolled in a private school, with 1,145 (99.9% in the age bracket) attending a public institution.
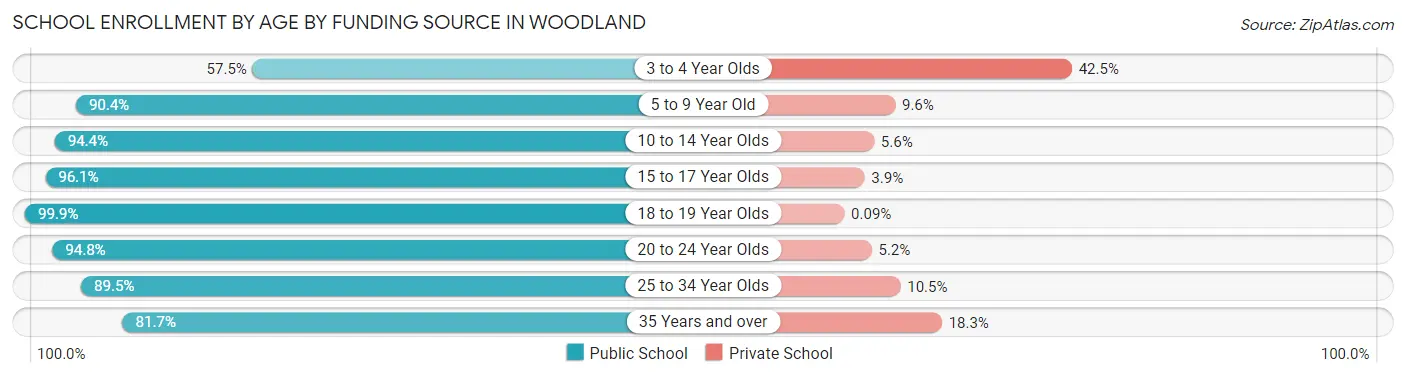
| Age Bracket | Public School | Private School |
| 3 to 4 Year Olds | 329 (57.5%) | 243 (42.5%) |
| 5 to 9 Year Old | 3,630 (90.4%) | 384 (9.6%) |
| 10 to 14 Year Olds | 3,707 (94.4%) | 221 (5.6%) |
| 15 to 17 Year Olds | 2,319 (96.1%) | 93 (3.9%) |
| 18 to 19 Year Olds | 1,145 (99.9%) | 1 (0.1%) |
| 20 to 24 Year Olds | 2,173 (94.8%) | 119 (5.2%) |
| 25 to 34 Year Olds | 976 (89.5%) | 115 (10.5%) |
| 35 Years and over | 725 (81.7%) | 162 (18.3%) |
| Total | 15,002 (91.8%) | 1,340 (8.2%) |
Educational Attainment by Field of Study in Woodland
Bio, nature & agricultural (1,499 | 11.9%), social sciences (1,475 | 11.7%), business (1,396 | 11.1%), liberal arts & history (1,063 | 8.5%), and engineering (966 | 7.7%) are the most common fields of study among 12,586 individuals in Woodland who have obtained a bachelor's degree or higher.
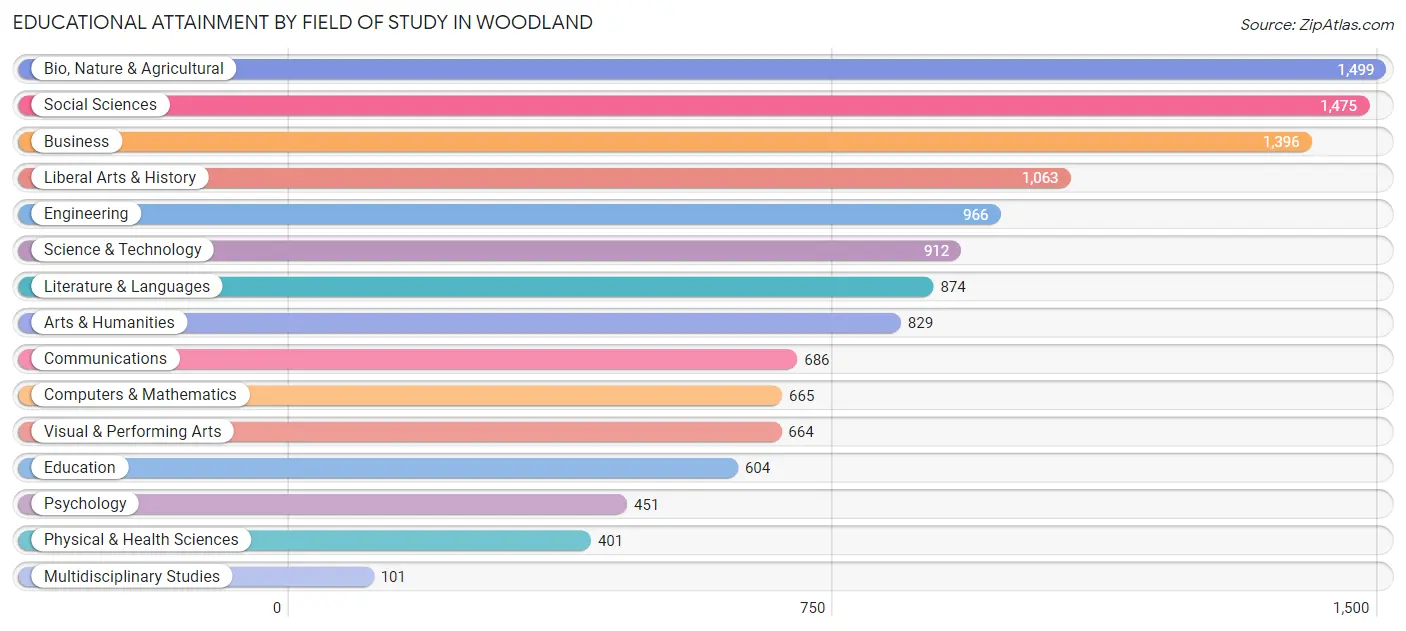
| Field of Study | # Graduates | % Graduates |
| Computers & Mathematics | 665 | 5.3% |
| Bio, Nature & Agricultural | 1,499 | 11.9% |
| Physical & Health Sciences | 401 | 3.2% |
| Psychology | 451 | 3.6% |
| Social Sciences | 1,475 | 11.7% |
| Engineering | 966 | 7.7% |
| Multidisciplinary Studies | 101 | 0.8% |
| Science & Technology | 912 | 7.2% |
| Business | 1,396 | 11.1% |
| Education | 604 | 4.8% |
| Literature & Languages | 874 | 6.9% |
| Liberal Arts & History | 1,063 | 8.5% |
| Visual & Performing Arts | 664 | 5.3% |
| Communications | 686 | 5.4% |
| Arts & Humanities | 829 | 6.6% |
| Total | 12,586 | 100.0% |
Transportation & Commute in Woodland
Vehicle Availability by Sex in Woodland
The most prevalent vehicle ownership categories in Woodland are males with 2 vehicles (5,899, accounting for 36.3%) and females with 2 vehicles (5,476, making up 43.6%).
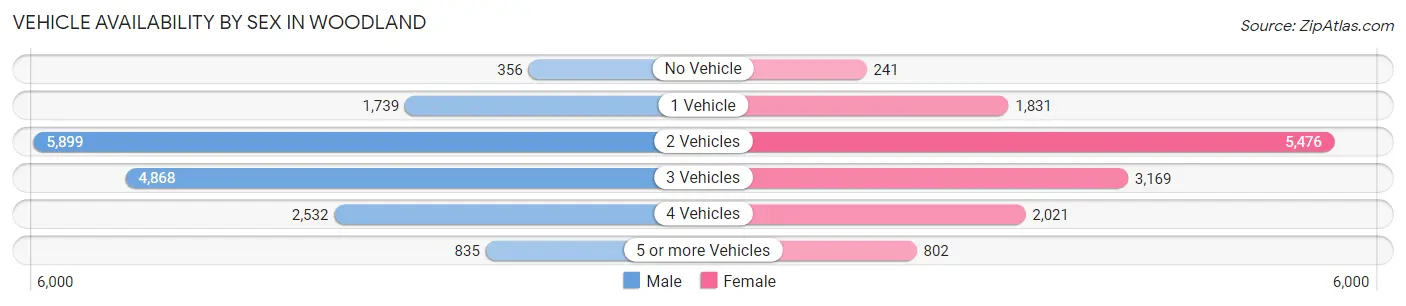
| Vehicles Available | Male | Female |
| No Vehicle | 356 (2.2%) | 241 (1.8%) |
| 1 Vehicle | 1,739 (10.7%) | 1,831 (13.5%) |
| 2 Vehicles | 5,899 (36.3%) | 5,476 (40.4%) |
| 3 Vehicles | 4,868 (30.0%) | 3,169 (23.4%) |
| 4 Vehicles | 2,532 (15.6%) | 2,021 (14.9%) |
| 5 or more Vehicles | 835 (5.1%) | 802 (5.9%) |
| Total | 16,229 (100.0%) | 13,540 (100.0%) |
Commute Time in Woodland
The most frequently occuring commute durations in Woodland are 10 to 14 minutes (4,942 commuters, 18.4%), 15 to 19 minutes (4,220 commuters, 15.7%), and 5 to 9 minutes (3,735 commuters, 13.9%).
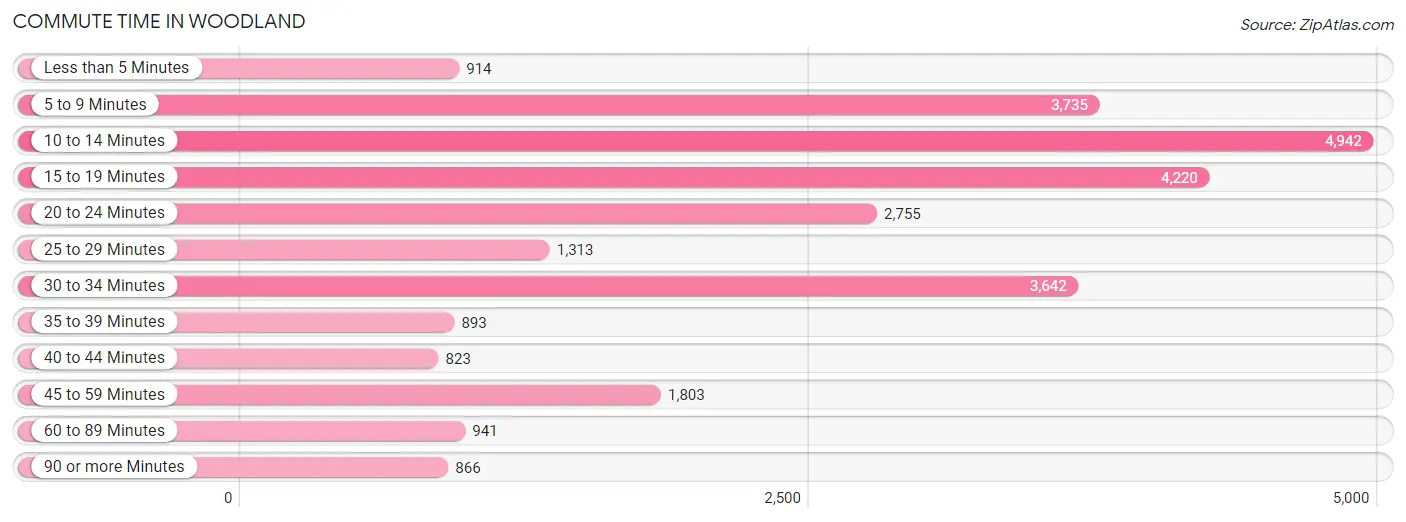
| Commute Time | # Commuters | % Commuters |
| Less than 5 Minutes | 914 | 3.4% |
| 5 to 9 Minutes | 3,735 | 13.9% |
| 10 to 14 Minutes | 4,942 | 18.4% |
| 15 to 19 Minutes | 4,220 | 15.7% |
| 20 to 24 Minutes | 2,755 | 10.3% |
| 25 to 29 Minutes | 1,313 | 4.9% |
| 30 to 34 Minutes | 3,642 | 13.6% |
| 35 to 39 Minutes | 893 | 3.3% |
| 40 to 44 Minutes | 823 | 3.1% |
| 45 to 59 Minutes | 1,803 | 6.7% |
| 60 to 89 Minutes | 941 | 3.5% |
| 90 or more Minutes | 866 | 3.2% |
Commute Time by Sex in Woodland
The most common commute times in Woodland are 10 to 14 minutes (2,385 commuters, 16.1%) for males and 10 to 14 minutes (2,557 commuters, 21.2%) for females.
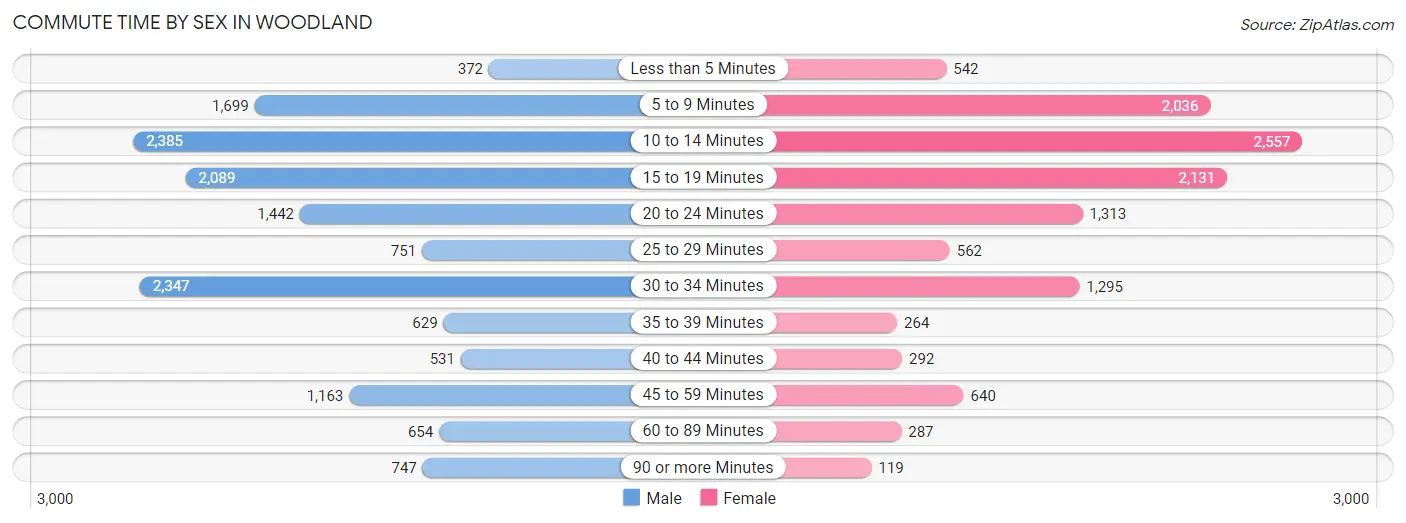
| Commute Time | Male | Female |
| Less than 5 Minutes | 372 (2.5%) | 542 (4.5%) |
| 5 to 9 Minutes | 1,699 (11.5%) | 2,036 (16.9%) |
| 10 to 14 Minutes | 2,385 (16.1%) | 2,557 (21.2%) |
| 15 to 19 Minutes | 2,089 (14.1%) | 2,131 (17.7%) |
| 20 to 24 Minutes | 1,442 (9.7%) | 1,313 (10.9%) |
| 25 to 29 Minutes | 751 (5.1%) | 562 (4.7%) |
| 30 to 34 Minutes | 2,347 (15.9%) | 1,295 (10.8%) |
| 35 to 39 Minutes | 629 (4.3%) | 264 (2.2%) |
| 40 to 44 Minutes | 531 (3.6%) | 292 (2.4%) |
| 45 to 59 Minutes | 1,163 (7.9%) | 640 (5.3%) |
| 60 to 89 Minutes | 654 (4.4%) | 287 (2.4%) |
| 90 or more Minutes | 747 (5.0%) | 119 (1.0%) |
Time of Departure to Work by Sex in Woodland
The most frequent times of departure to work in Woodland are 6:00 AM to 6:29 AM (2,120, 14.3%) for males and 7:30 AM to 7:59 AM (2,235, 18.6%) for females.
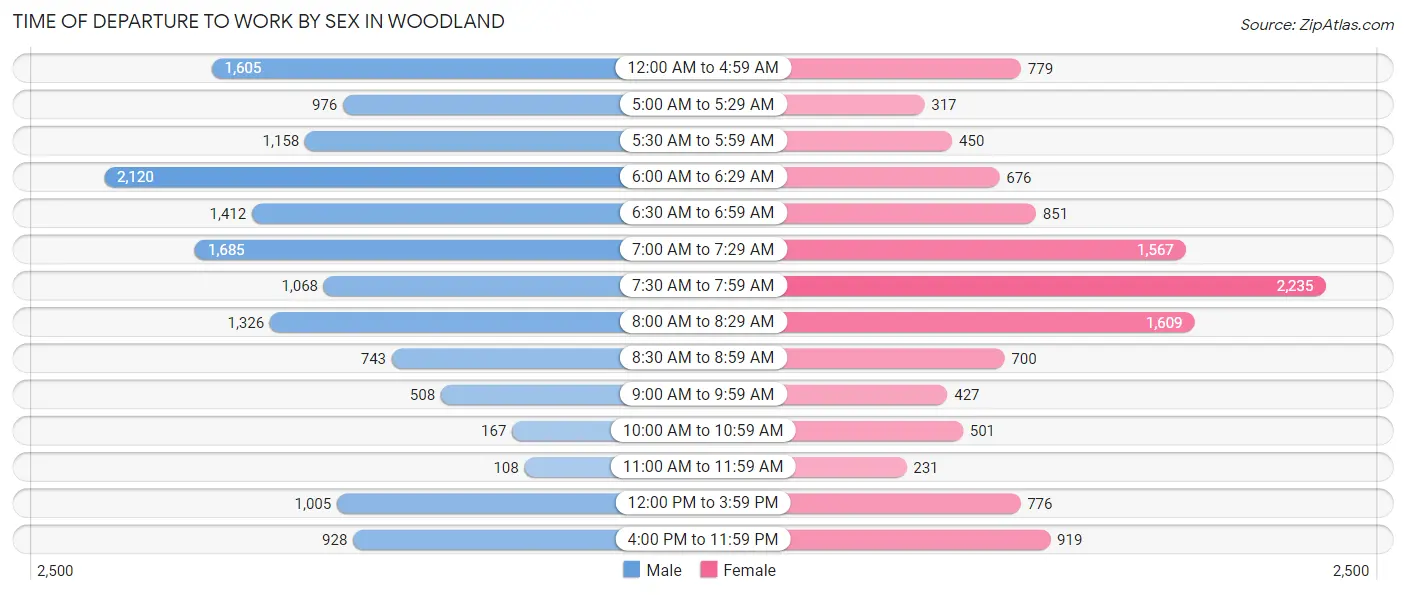
| Time of Departure | Male | Female |
| 12:00 AM to 4:59 AM | 1,605 (10.8%) | 779 (6.5%) |
| 5:00 AM to 5:29 AM | 976 (6.6%) | 317 (2.6%) |
| 5:30 AM to 5:59 AM | 1,158 (7.8%) | 450 (3.7%) |
| 6:00 AM to 6:29 AM | 2,120 (14.3%) | 676 (5.6%) |
| 6:30 AM to 6:59 AM | 1,412 (9.5%) | 851 (7.1%) |
| 7:00 AM to 7:29 AM | 1,685 (11.4%) | 1,567 (13.0%) |
| 7:30 AM to 7:59 AM | 1,068 (7.2%) | 2,235 (18.6%) |
| 8:00 AM to 8:29 AM | 1,326 (8.9%) | 1,609 (13.4%) |
| 8:30 AM to 8:59 AM | 743 (5.0%) | 700 (5.8%) |
| 9:00 AM to 9:59 AM | 508 (3.4%) | 427 (3.5%) |
| 10:00 AM to 10:59 AM | 167 (1.1%) | 501 (4.2%) |
| 11:00 AM to 11:59 AM | 108 (0.7%) | 231 (1.9%) |
| 12:00 PM to 3:59 PM | 1,005 (6.8%) | 776 (6.5%) |
| 4:00 PM to 11:59 PM | 928 (6.3%) | 919 (7.6%) |
| Total | 14,809 (100.0%) | 12,038 (100.0%) |
Housing Occupancy in Woodland
Occupancy by Ownership in Woodland
Of the total 21,078 dwellings in Woodland, owner-occupied units account for 11,827 (56.1%), while renter-occupied units make up 9,251 (43.9%).
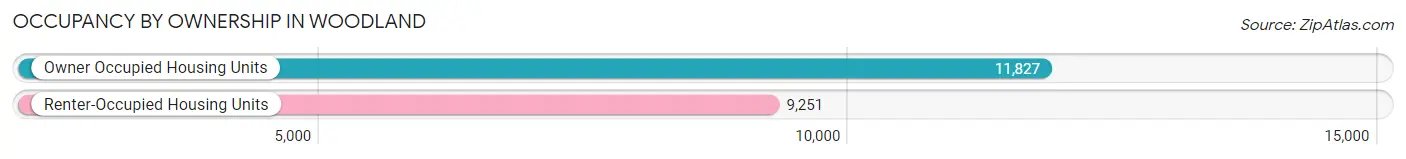
| Occupancy | # Housing Units | % Housing Units |
| Owner Occupied Housing Units | 11,827 | 56.1% |
| Renter-Occupied Housing Units | 9,251 | 43.9% |
| Total Occupied Housing Units | 21,078 | 100.0% |
Occupancy by Household Size in Woodland
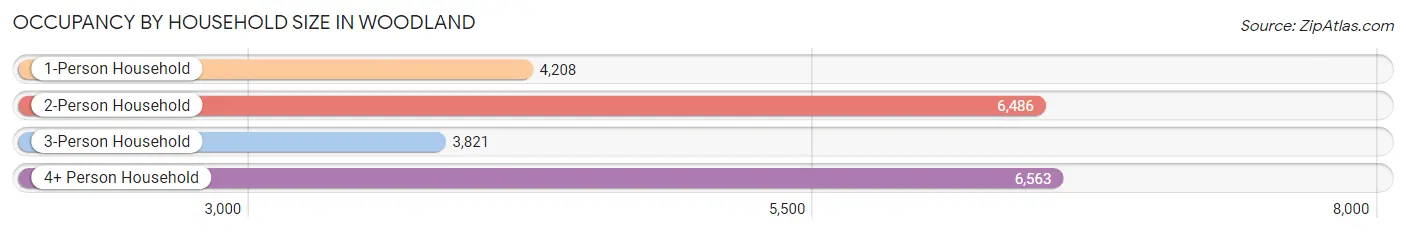
| Household Size | # Housing Units | % Housing Units |
| 1-Person Household | 4,208 | 20.0% |
| 2-Person Household | 6,486 | 30.8% |
| 3-Person Household | 3,821 | 18.1% |
| 4+ Person Household | 6,563 | 31.1% |
| Total Housing Units | 21,078 | 100.0% |
Occupancy by Ownership by Household Size in Woodland
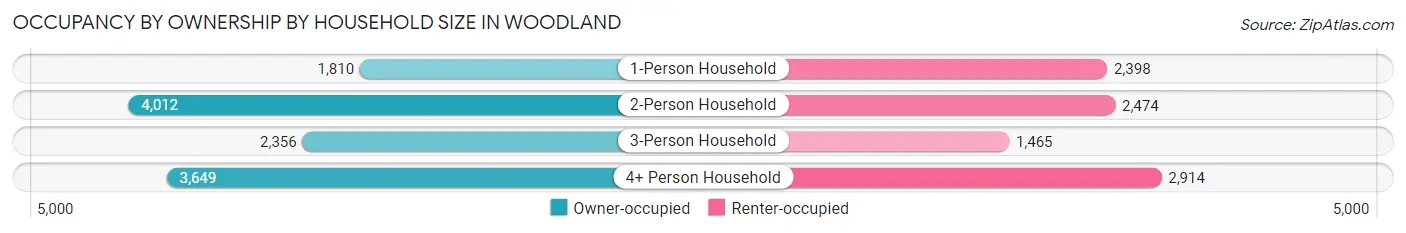
| Household Size | Owner-occupied | Renter-occupied |
| 1-Person Household | 1,810 (43.0%) | 2,398 (57.0%) |
| 2-Person Household | 4,012 (61.9%) | 2,474 (38.1%) |
| 3-Person Household | 2,356 (61.7%) | 1,465 (38.3%) |
| 4+ Person Household | 3,649 (55.6%) | 2,914 (44.4%) |
| Total Housing Units | 11,827 (56.1%) | 9,251 (43.9%) |
Occupancy by Educational Attainment in Woodland
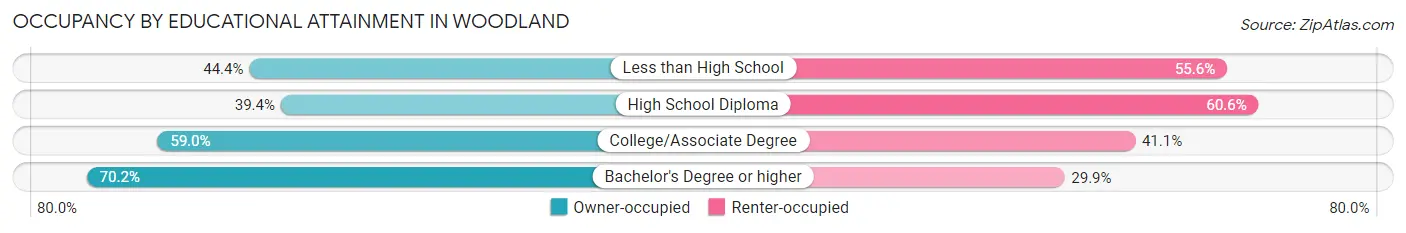
| Household Size | Owner-occupied | Renter-occupied |
| Less than High School | 1,387 (44.4%) | 1,740 (55.6%) |
| High School Diploma | 1,731 (39.4%) | 2,667 (60.6%) |
| College/Associate Degree | 4,202 (59.0%) | 2,926 (41.0%) |
| Bachelor's Degree or higher | 4,507 (70.2%) | 1,918 (29.8%) |
Occupancy by Age of Householder in Woodland
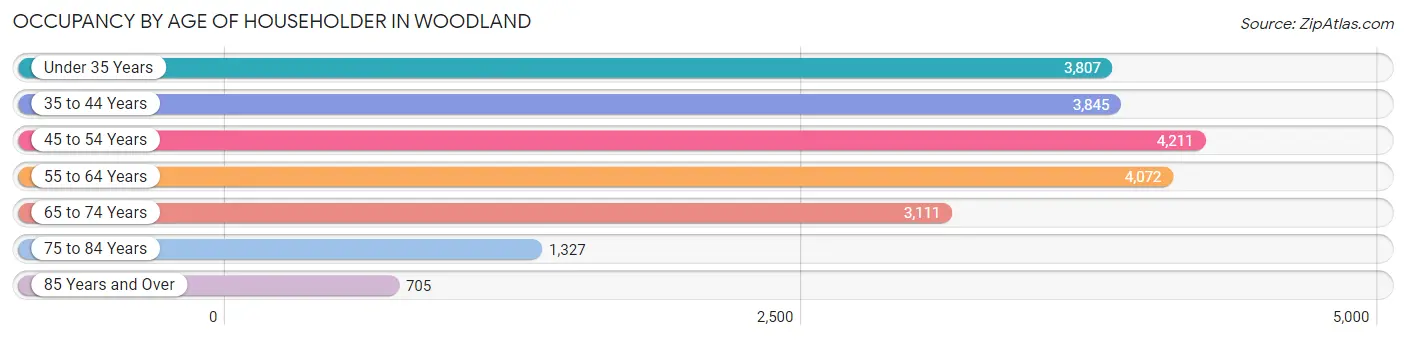
| Age Bracket | # Households | % Households |
| Under 35 Years | 3,807 | 18.1% |
| 35 to 44 Years | 3,845 | 18.2% |
| 45 to 54 Years | 4,211 | 20.0% |
| 55 to 64 Years | 4,072 | 19.3% |
| 65 to 74 Years | 3,111 | 14.8% |
| 75 to 84 Years | 1,327 | 6.3% |
| 85 Years and Over | 705 | 3.3% |
| Total | 21,078 | 100.0% |
Housing Finances in Woodland
Median Income by Occupancy in Woodland
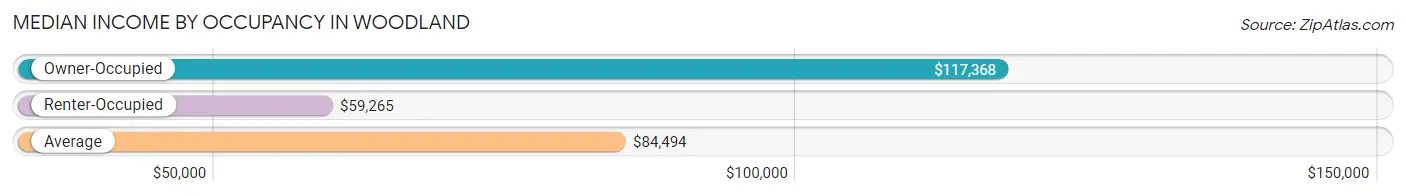
| Occupancy Type | # Households | Median Income |
| Owner-Occupied | 11,827 (56.1%) | $117,368 |
| Renter-Occupied | 9,251 (43.9%) | $59,265 |
| Average | 21,078 (100.0%) | $84,494 |
Occupancy by Householder Income Bracket in Woodland
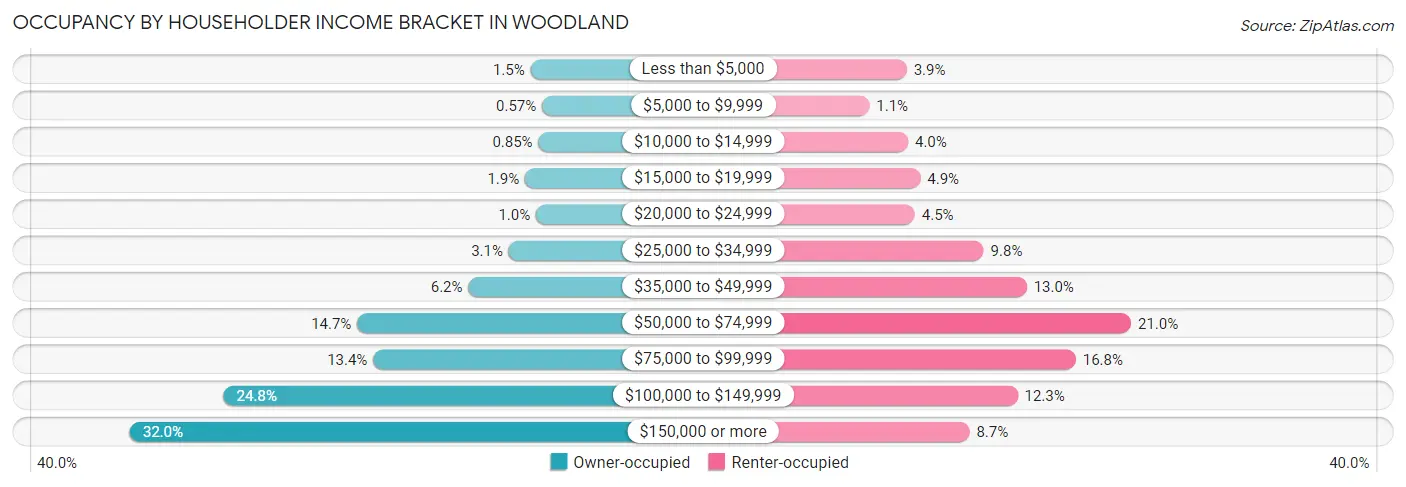
| Income Bracket | Owner-occupied | Renter-occupied |
| Less than $5,000 | 172 (1.5%) | 361 (3.9%) |
| $5,000 to $9,999 | 68 (0.6%) | 97 (1.1%) |
| $10,000 to $14,999 | 101 (0.9%) | 370 (4.0%) |
| $15,000 to $19,999 | 221 (1.9%) | 457 (4.9%) |
| $20,000 to $24,999 | 122 (1.0%) | 418 (4.5%) |
| $25,000 to $34,999 | 368 (3.1%) | 903 (9.8%) |
| $35,000 to $49,999 | 732 (6.2%) | 1,206 (13.0%) |
| $50,000 to $74,999 | 1,734 (14.7%) | 1,942 (21.0%) |
| $75,000 to $99,999 | 1,589 (13.4%) | 1,552 (16.8%) |
| $100,000 to $149,999 | 2,938 (24.8%) | 1,142 (12.3%) |
| $150,000 or more | 3,782 (32.0%) | 803 (8.7%) |
| Total | 11,827 (100.0%) | 9,251 (100.0%) |
Monthly Housing Cost Tiers in Woodland
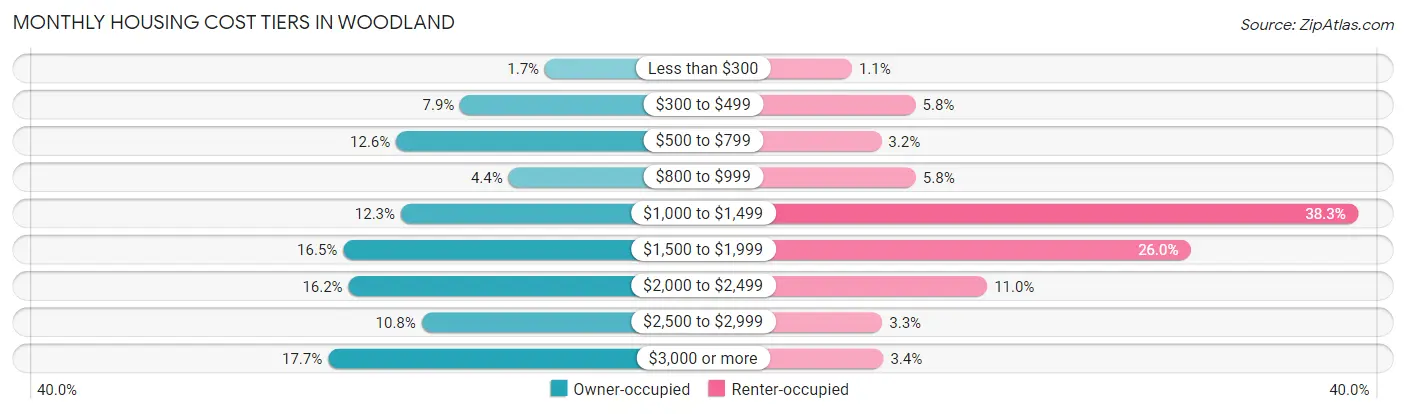
| Monthly Cost | Owner-occupied | Renter-occupied |
| Less than $300 | 199 (1.7%) | 99 (1.1%) |
| $300 to $499 | 937 (7.9%) | 533 (5.8%) |
| $500 to $799 | 1,495 (12.6%) | 300 (3.2%) |
| $800 to $999 | 516 (4.4%) | 535 (5.8%) |
| $1,000 to $1,499 | 1,454 (12.3%) | 3,543 (38.3%) |
| $1,500 to $1,999 | 1,956 (16.5%) | 2,403 (26.0%) |
| $2,000 to $2,499 | 1,910 (16.2%) | 1,020 (11.0%) |
| $2,500 to $2,999 | 1,273 (10.8%) | 306 (3.3%) |
| $3,000 or more | 2,087 (17.6%) | 314 (3.4%) |
| Total | 11,827 (100.0%) | 9,251 (100.0%) |
Physical Housing Characteristics in Woodland
Housing Structures in Woodland
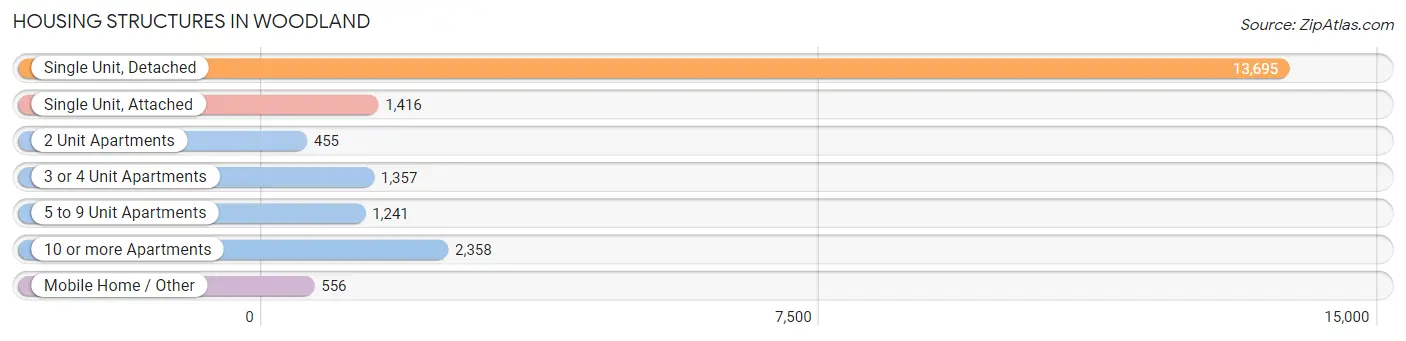
| Structure Type | # Housing Units | % Housing Units |
| Single Unit, Detached | 13,695 | 65.0% |
| Single Unit, Attached | 1,416 | 6.7% |
| 2 Unit Apartments | 455 | 2.2% |
| 3 or 4 Unit Apartments | 1,357 | 6.4% |
| 5 to 9 Unit Apartments | 1,241 | 5.9% |
| 10 or more Apartments | 2,358 | 11.2% |
| Mobile Home / Other | 556 | 2.6% |
| Total | 21,078 | 100.0% |
Housing Structures by Occupancy in Woodland
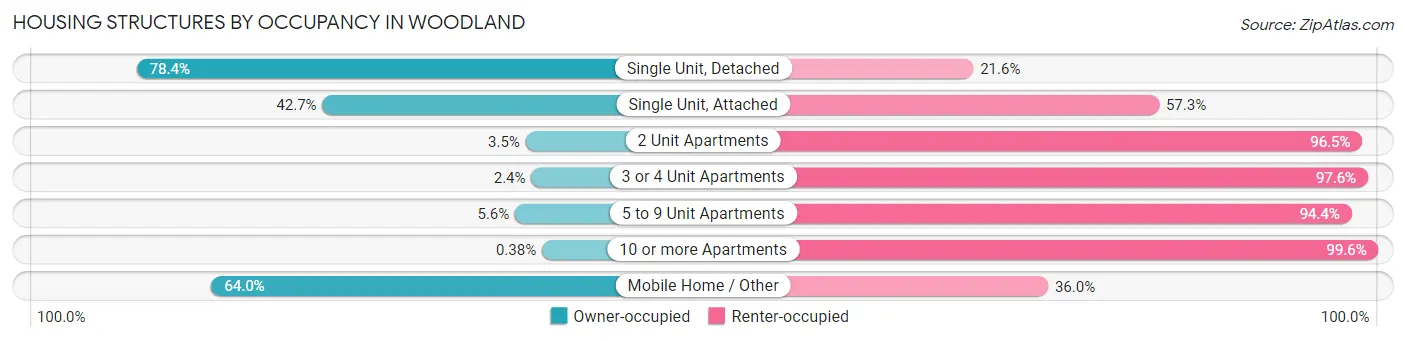
| Structure Type | Owner-occupied | Renter-occupied |
| Single Unit, Detached | 10,740 (78.4%) | 2,955 (21.6%) |
| Single Unit, Attached | 604 (42.7%) | 812 (57.3%) |
| 2 Unit Apartments | 16 (3.5%) | 439 (96.5%) |
| 3 or 4 Unit Apartments | 33 (2.4%) | 1,324 (97.6%) |
| 5 to 9 Unit Apartments | 69 (5.6%) | 1,172 (94.4%) |
| 10 or more Apartments | 9 (0.4%) | 2,349 (99.6%) |
| Mobile Home / Other | 356 (64.0%) | 200 (36.0%) |
| Total | 11,827 (56.1%) | 9,251 (43.9%) |
Housing Structures by Number of Rooms in Woodland
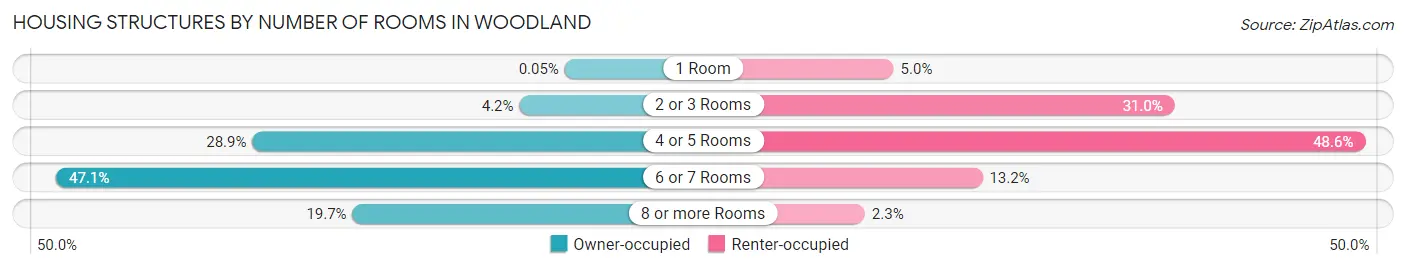
| Number of Rooms | Owner-occupied | Renter-occupied |
| 1 Room | 6 (0.1%) | 460 (5.0%) |
| 2 or 3 Rooms | 501 (4.2%) | 2,864 (31.0%) |
| 4 or 5 Rooms | 3,423 (28.9%) | 4,494 (48.6%) |
| 6 or 7 Rooms | 5,569 (47.1%) | 1,219 (13.2%) |
| 8 or more Rooms | 2,328 (19.7%) | 214 (2.3%) |
| Total | 11,827 (100.0%) | 9,251 (100.0%) |
Housing Structure by Heating Type in Woodland
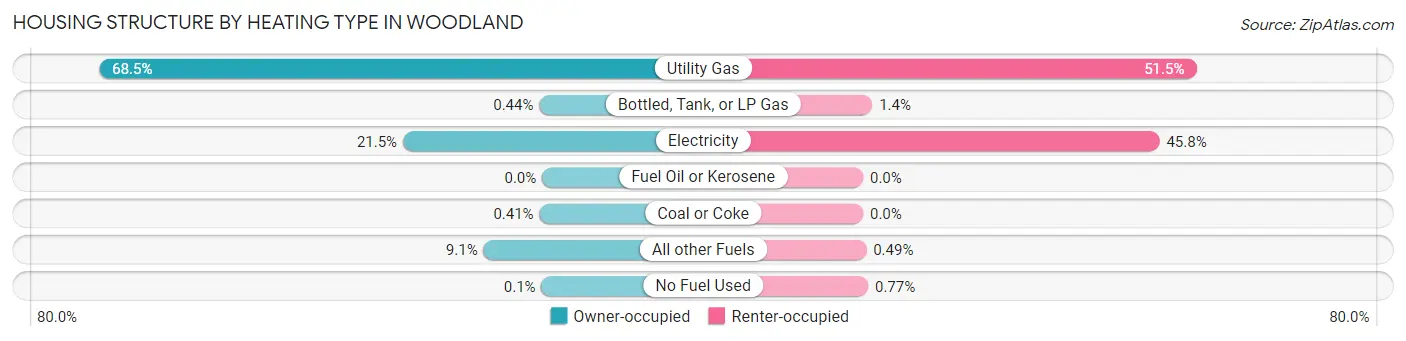
| Heating Type | Owner-occupied | Renter-occupied |
| Utility Gas | 8,100 (68.5%) | 4,764 (51.5%) |
| Bottled, Tank, or LP Gas | 52 (0.4%) | 131 (1.4%) |
| Electricity | 2,544 (21.5%) | 4,240 (45.8%) |
| Fuel Oil or Kerosene | 0 (0.0%) | 0 (0.0%) |
| Coal or Coke | 48 (0.4%) | 0 (0.0%) |
| All other Fuels | 1,071 (9.1%) | 45 (0.5%) |
| No Fuel Used | 12 (0.1%) | 71 (0.8%) |
| Total | 11,827 (100.0%) | 9,251 (100.0%) |
Household Vehicle Usage in Woodland
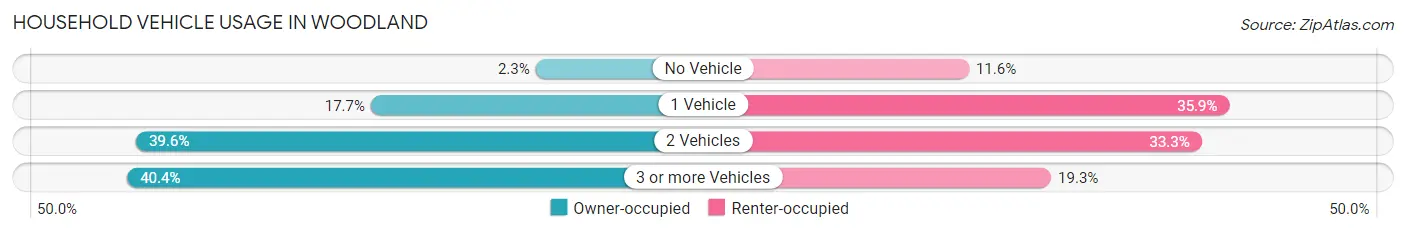
| Vehicles per Household | Owner-occupied | Renter-occupied |
| No Vehicle | 272 (2.3%) | 1,071 (11.6%) |
| 1 Vehicle | 2,091 (17.7%) | 3,319 (35.9%) |
| 2 Vehicles | 4,684 (39.6%) | 3,080 (33.3%) |
| 3 or more Vehicles | 4,780 (40.4%) | 1,781 (19.3%) |
| Total | 11,827 (100.0%) | 9,251 (100.0%) |
Real Estate & Mortgages in Woodland
Real Estate and Mortgage Overview in Woodland
| Characteristic | Without Mortgage | With Mortgage |
| Housing Units | 3,563 | 8,264 |
| Median Property Value | $438,300 | $490,200 |
| Median Household Income | $72,719 | $3,021 |
| Monthly Housing Costs | $625 | $2,087 |
| Real Estate Taxes | $2,596 | $106 |
Property Value by Mortgage Status in Woodland
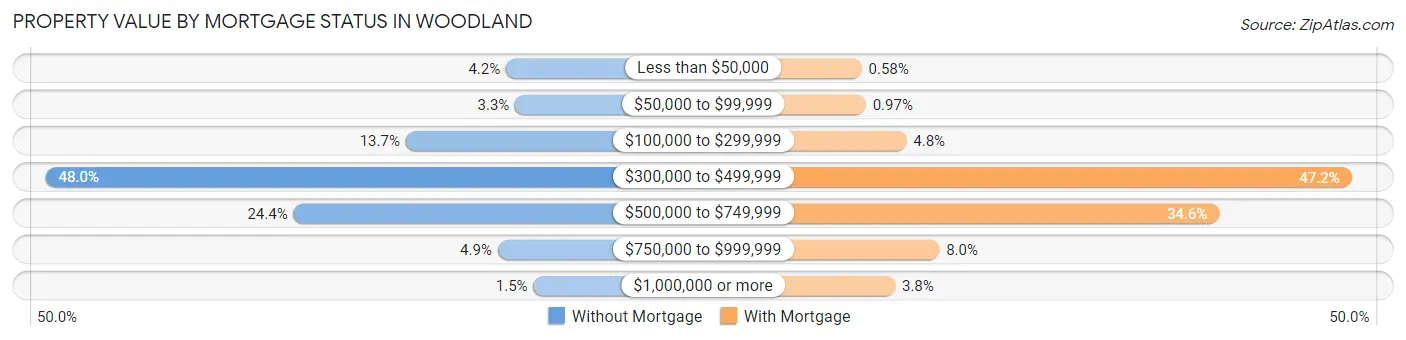
| Property Value | Without Mortgage | With Mortgage |
| Less than $50,000 | 148 (4.2%) | 48 (0.6%) |
| $50,000 to $99,999 | 117 (3.3%) | 80 (1.0%) |
| $100,000 to $299,999 | 488 (13.7%) | 400 (4.8%) |
| $300,000 to $499,999 | 1,710 (48.0%) | 3,904 (47.2%) |
| $500,000 to $749,999 | 869 (24.4%) | 2,862 (34.6%) |
| $750,000 to $999,999 | 176 (4.9%) | 659 (8.0%) |
| $1,000,000 or more | 55 (1.5%) | 311 (3.8%) |
| Total | 3,563 (100.0%) | 8,264 (100.0%) |
Household Income by Mortgage Status in Woodland
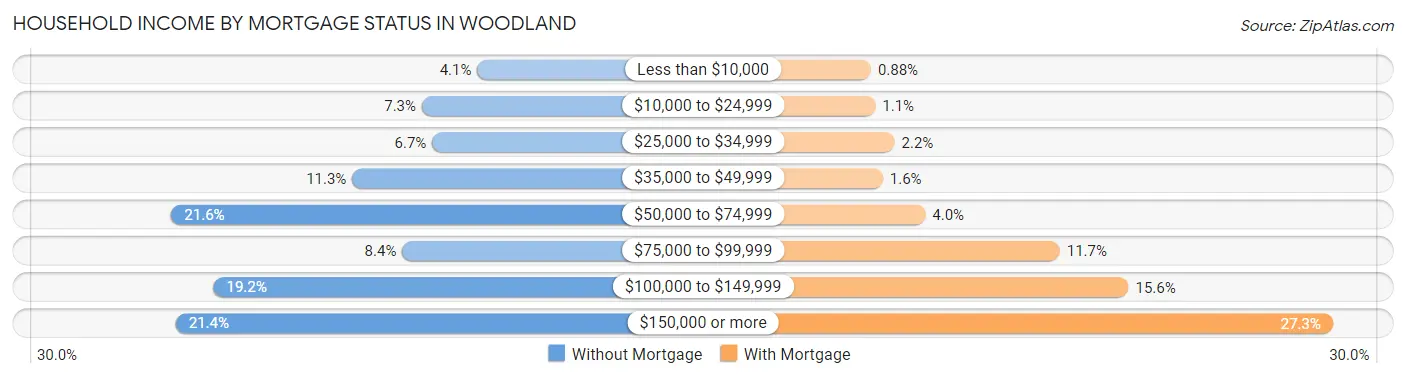
| Household Income | Without Mortgage | With Mortgage |
| Less than $10,000 | 147 (4.1%) | 73 (0.9%) |
| $10,000 to $24,999 | 260 (7.3%) | 93 (1.1%) |
| $25,000 to $34,999 | 239 (6.7%) | 184 (2.2%) |
| $35,000 to $49,999 | 402 (11.3%) | 129 (1.6%) |
| $50,000 to $74,999 | 770 (21.6%) | 330 (4.0%) |
| $75,000 to $99,999 | 300 (8.4%) | 964 (11.7%) |
| $100,000 to $149,999 | 684 (19.2%) | 1,289 (15.6%) |
| $150,000 or more | 761 (21.4%) | 2,254 (27.3%) |
| Total | 3,563 (100.0%) | 8,264 (100.0%) |
Property Value to Household Income Ratio in Woodland
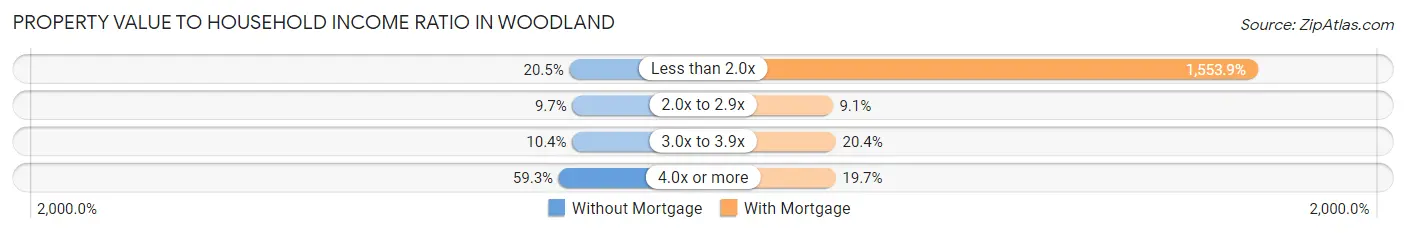
| Value-to-Income Ratio | Without Mortgage | With Mortgage |
| Less than 2.0x | 732 (20.5%) | 128,410 (1,553.9%) |
| 2.0x to 2.9x | 347 (9.7%) | 751 (9.1%) |
| 3.0x to 3.9x | 370 (10.4%) | 1,686 (20.4%) |
| 4.0x or more | 2,114 (59.3%) | 1,626 (19.7%) |
| Total | 3,563 (100.0%) | 8,264 (100.0%) |
Real Estate Taxes by Mortgage Status in Woodland
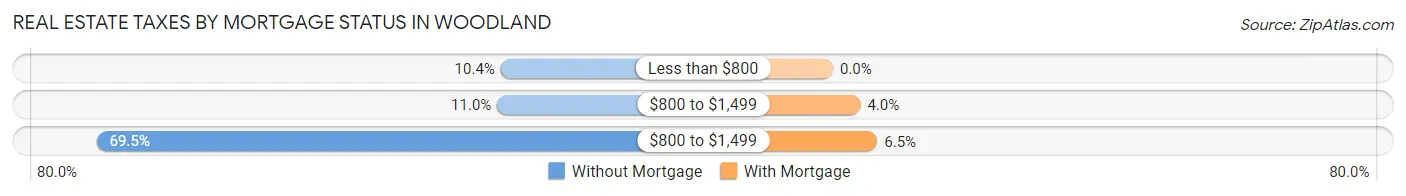
| Property Taxes | Without Mortgage | With Mortgage |
| Less than $800 | 372 (10.4%) | 0 (0.0%) |
| $800 to $1,499 | 390 (11.0%) | 332 (4.0%) |
| $800 to $1,499 | 2,476 (69.5%) | 535 (6.5%) |
| Total | 3,563 (100.0%) | 8,264 (100.0%) |
Health & Disability in Woodland
Health Insurance Coverage by Age in Woodland
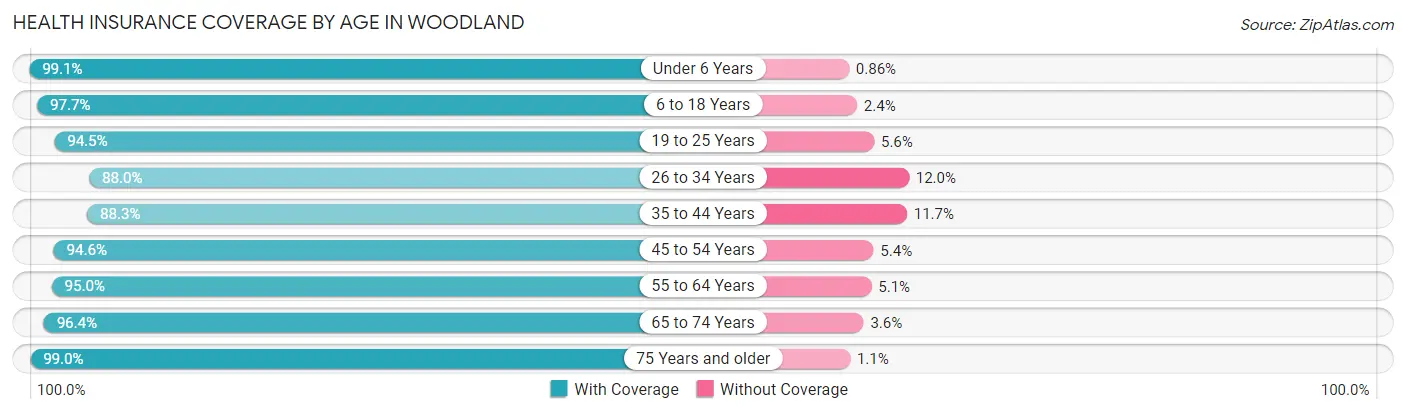
| Age Bracket | With Coverage | Without Coverage |
| Under 6 Years | 4,269 (99.1%) | 37 (0.9%) |
| 6 to 18 Years | 10,650 (97.7%) | 256 (2.4%) |
| 19 to 25 Years | 5,578 (94.5%) | 328 (5.6%) |
| 26 to 34 Years | 6,717 (88.0%) | 918 (12.0%) |
| 35 to 44 Years | 7,280 (88.3%) | 961 (11.7%) |
| 45 to 54 Years | 7,212 (94.6%) | 414 (5.4%) |
| 55 to 64 Years | 6,793 (95.0%) | 361 (5.1%) |
| 65 to 74 Years | 5,015 (96.4%) | 186 (3.6%) |
| 75 Years and older | 3,194 (99.0%) | 34 (1.1%) |
| Total | 56,708 (94.2%) | 3,495 (5.8%) |
Health Insurance Coverage by Citizenship Status in Woodland
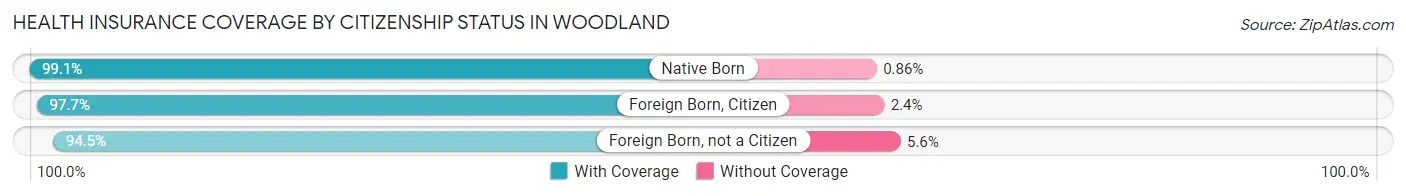
| Citizenship Status | With Coverage | Without Coverage |
| Native Born | 4,269 (99.1%) | 37 (0.9%) |
| Foreign Born, Citizen | 10,650 (97.7%) | 256 (2.4%) |
| Foreign Born, not a Citizen | 5,578 (94.5%) | 328 (5.6%) |
Health Insurance Coverage by Household Income in Woodland
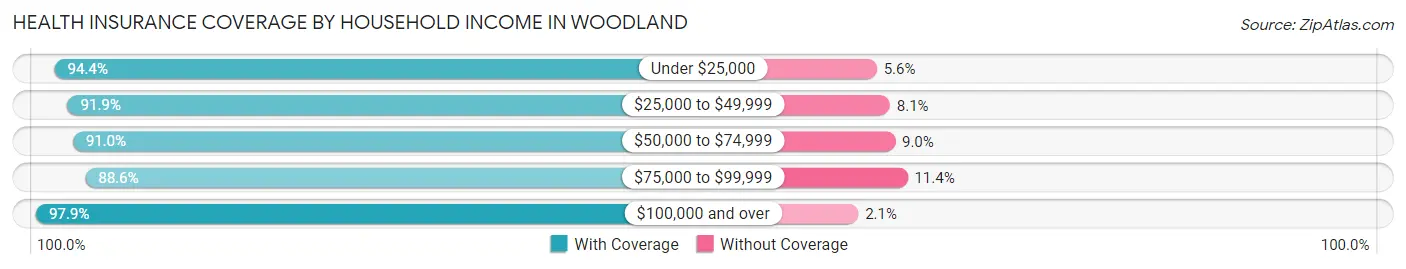
| Household Income | With Coverage | Without Coverage |
| Under $25,000 | 3,604 (94.4%) | 214 (5.6%) |
| $25,000 to $49,999 | 7,054 (91.9%) | 618 (8.1%) |
| $50,000 to $74,999 | 8,928 (91.0%) | 887 (9.0%) |
| $75,000 to $99,999 | 8,693 (88.6%) | 1,115 (11.4%) |
| $100,000 and over | 28,039 (97.9%) | 613 (2.1%) |
Public vs Private Health Insurance Coverage by Age in Woodland
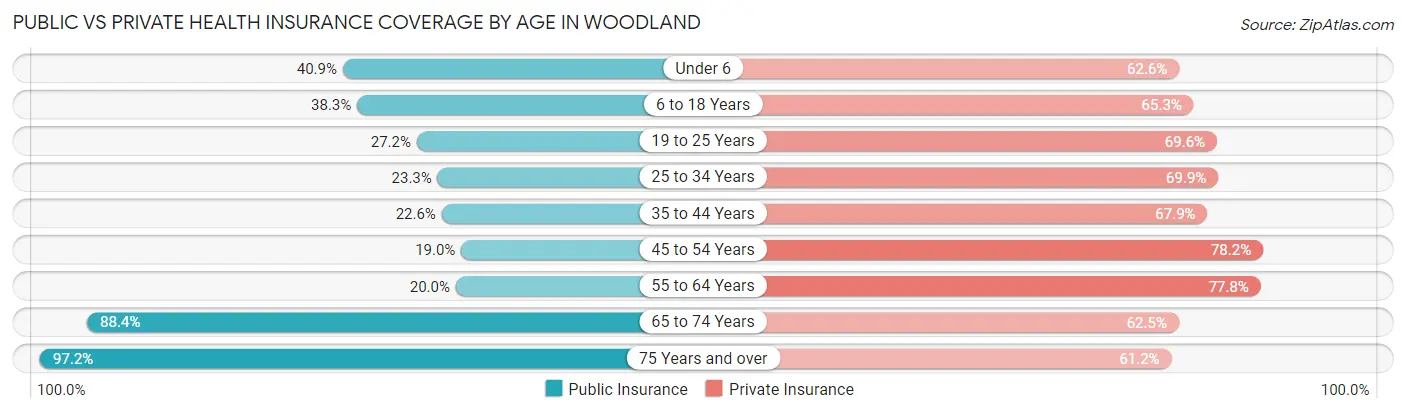
| Age Bracket | Public Insurance | Private Insurance |
| Under 6 | 1,763 (40.9%) | 2,696 (62.6%) |
| 6 to 18 Years | 4,175 (38.3%) | 7,122 (65.3%) |
| 19 to 25 Years | 1,607 (27.2%) | 4,112 (69.6%) |
| 25 to 34 Years | 1,782 (23.3%) | 5,333 (69.9%) |
| 35 to 44 Years | 1,861 (22.6%) | 5,592 (67.9%) |
| 45 to 54 Years | 1,446 (19.0%) | 5,961 (78.2%) |
| 55 to 64 Years | 1,428 (20.0%) | 5,562 (77.7%) |
| 65 to 74 Years | 4,597 (88.4%) | 3,252 (62.5%) |
| 75 Years and over | 3,136 (97.2%) | 1,975 (61.2%) |
| Total | 21,795 (36.2%) | 41,605 (69.1%) |
Disability Status by Sex by Age in Woodland
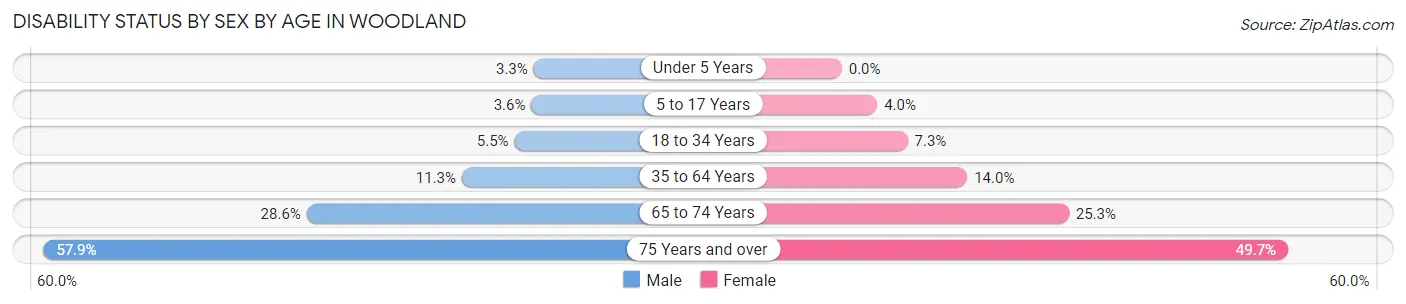
| Age Bracket | Male | Female |
| Under 5 Years | 67 (3.3%) | 0 (0.0%) |
| 5 to 17 Years | 183 (3.6%) | 219 (4.0%) |
| 18 to 34 Years | 397 (5.4%) | 519 (7.3%) |
| 35 to 64 Years | 1,313 (11.3%) | 1,594 (14.0%) |
| 65 to 74 Years | 693 (28.6%) | 702 (25.3%) |
| 75 Years and over | 783 (57.9%) | 932 (49.7%) |
Disability Class by Sex by Age in Woodland
Disability Class: Hearing Difficulty
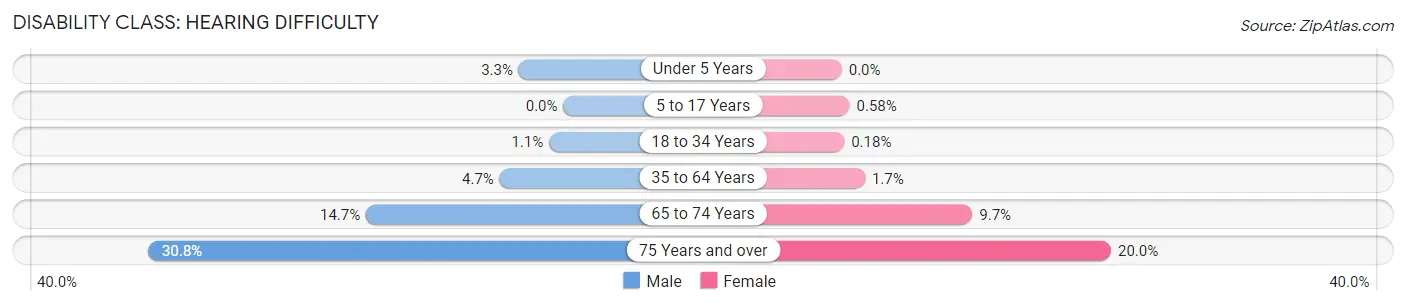
| Age Bracket | Male | Female |
| Under 5 Years | 67 (3.3%) | 0 (0.0%) |
| 5 to 17 Years | 0 (0.0%) | 32 (0.6%) |
| 18 to 34 Years | 77 (1.1%) | 13 (0.2%) |
| 35 to 64 Years | 549 (4.7%) | 196 (1.7%) |
| 65 to 74 Years | 355 (14.6%) | 269 (9.7%) |
| 75 Years and over | 416 (30.8%) | 375 (20.0%) |
Disability Class: Vision Difficulty
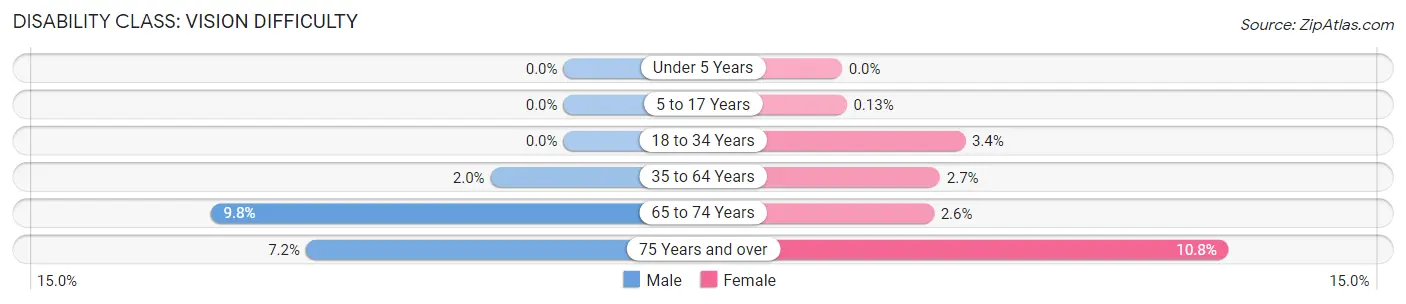
| Age Bracket | Male | Female |
| Under 5 Years | 0 (0.0%) | 0 (0.0%) |
| 5 to 17 Years | 0 (0.0%) | 7 (0.1%) |
| 18 to 34 Years | 0 (0.0%) | 243 (3.4%) |
| 35 to 64 Years | 236 (2.0%) | 312 (2.7%) |
| 65 to 74 Years | 238 (9.8%) | 71 (2.6%) |
| 75 Years and over | 97 (7.2%) | 202 (10.8%) |
Disability Class: Cognitive Difficulty
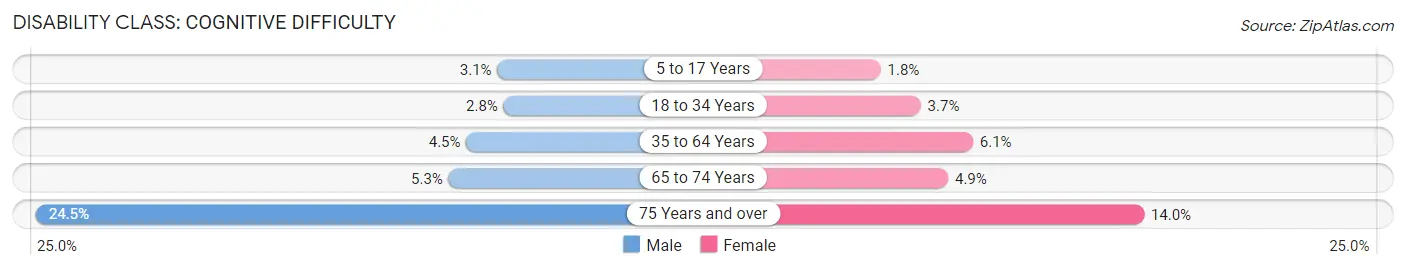
| Age Bracket | Male | Female |
| 5 to 17 Years | 157 (3.1%) | 100 (1.8%) |
| 18 to 34 Years | 202 (2.8%) | 259 (3.7%) |
| 35 to 64 Years | 522 (4.5%) | 694 (6.1%) |
| 65 to 74 Years | 129 (5.3%) | 137 (4.9%) |
| 75 Years and over | 331 (24.5%) | 263 (14.0%) |
Disability Class: Ambulatory Difficulty
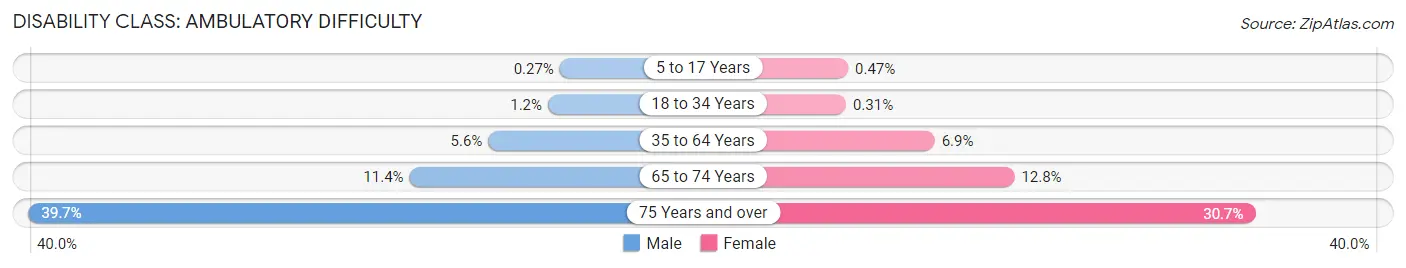
| Age Bracket | Male | Female |
| 5 to 17 Years | 14 (0.3%) | 26 (0.5%) |
| 18 to 34 Years | 84 (1.1%) | 22 (0.3%) |
| 35 to 64 Years | 648 (5.6%) | 787 (6.9%) |
| 65 to 74 Years | 277 (11.4%) | 356 (12.8%) |
| 75 Years and over | 537 (39.7%) | 576 (30.7%) |
Disability Class: Self-Care Difficulty
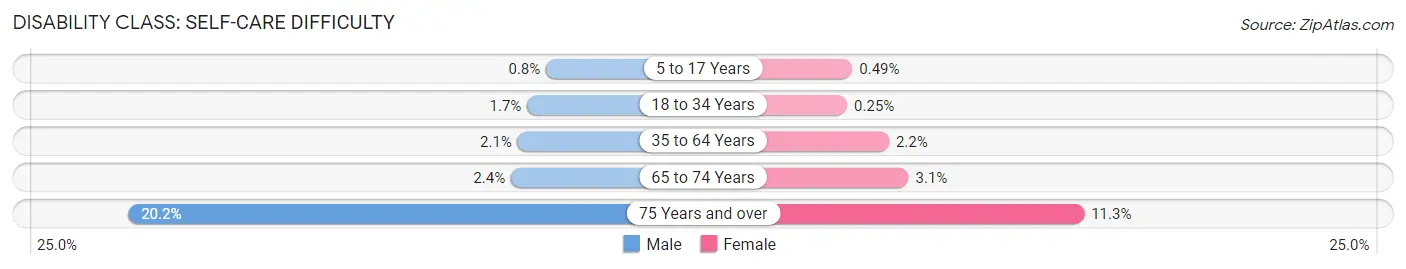
| Age Bracket | Male | Female |
| 5 to 17 Years | 41 (0.8%) | 27 (0.5%) |
| 18 to 34 Years | 122 (1.7%) | 18 (0.3%) |
| 35 to 64 Years | 246 (2.1%) | 250 (2.2%) |
| 65 to 74 Years | 59 (2.4%) | 86 (3.1%) |
| 75 Years and over | 273 (20.2%) | 211 (11.3%) |
Technology Access in Woodland
Computing Device Access in Woodland
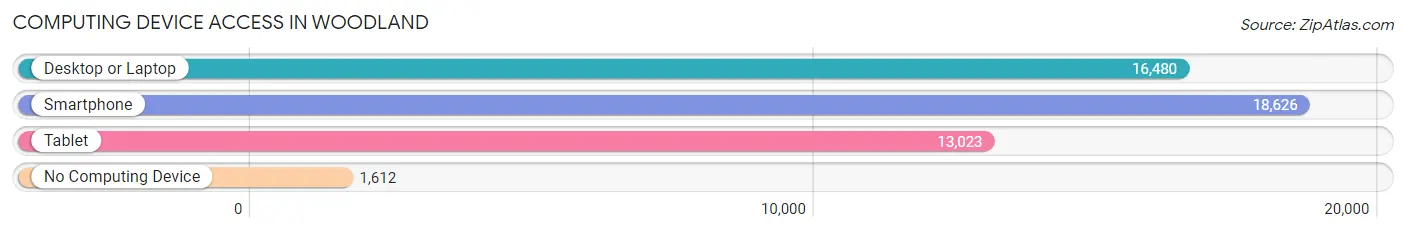
| Device Type | # Households | % Households |
| Desktop or Laptop | 16,480 | 78.2% |
| Smartphone | 18,626 | 88.4% |
| Tablet | 13,023 | 61.8% |
| No Computing Device | 1,612 | 7.6% |
| Total | 21,078 | 100.0% |
Internet Access in Woodland
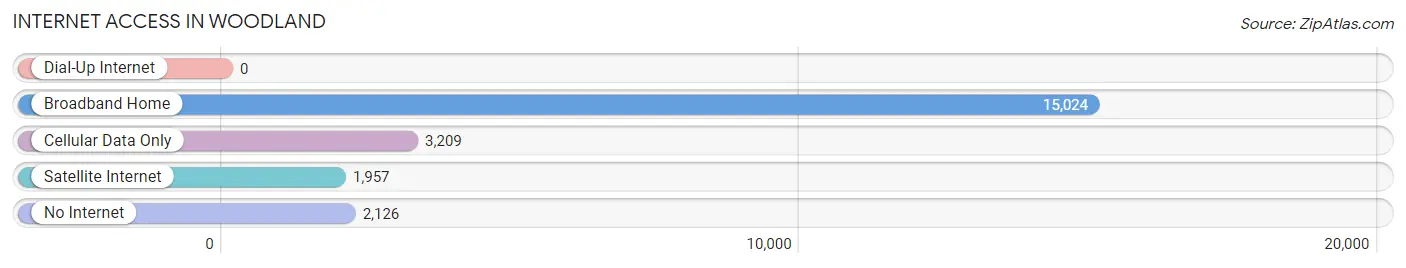
| Internet Type | # Households | % Households |
| Dial-Up Internet | 0 | 0.0% |
| Broadband Home | 15,024 | 71.3% |
| Cellular Data Only | 3,209 | 15.2% |
| Satellite Internet | 1,957 | 9.3% |
| No Internet | 2,126 | 10.1% |
| Total | 21,078 | 100.0% |
Woodland Summary
Woodland, California is a city located in Yolo County, California, United States. It is located approximately 15 miles northwest of Sacramento, the state capital. As of the 2010 census, the city had a population of 55,468.
Geography
Woodland is located at 38°41'23" North, 121°45'54" West (38.689, -121.765). It is situated in the Central Valley of California, in the Sacramento Valley. The city is located in the northern part of Yolo County, and is bordered by the cities of Davis to the east, West Sacramento to the south, and Winters to the west. The city is situated at an elevation of approximately 60 feet above sea level.
Climate
Woodland has a Mediterranean climate, with hot, dry summers and mild, wet winters. The average annual temperature is around 60°F, with an average high of around 90°F in the summer and an average low of around 40°F in the winter. The average annual precipitation is around 20 inches.
Demographics
As of the 2010 census, the population of Woodland was 55,468. The racial makeup of the city was 68.2% White, 4.2% African American, 0.7% Native American, 11.2% Asian, 0.3% Pacific Islander, 11.7% from other races, and 4.0% from two or more races. Hispanic or Latino of any race were 24.7% of the population.
Economy
Woodland is a major agricultural center in the Central Valley of California. The city is home to a number of large agricultural companies, including the J.R. Simplot Company, the largest potato processor in the world. Other major employers in the city include the Woodland Joint Unified School District, the Yolo County government, and the Woodland Healthcare District.
The city is also home to a number of small businesses, including restaurants, retail stores, and professional services. The city is served by a number of major highways, including Interstate 5, Highway 113, and Highway 16.
History
Woodland was founded in 1853 by John Sutter, Jr., the son of John Sutter, the founder of Sacramento. The city was originally named Yolo City, but was later changed to Woodland in 1858. The city was incorporated in 1871.
In the late 19th century, Woodland became a major agricultural center, with the development of the railroad and the introduction of irrigation. The city was also home to a number of large agricultural companies, including the J.R. Simplot Company, the largest potato processor in the world.
In the 20th century, Woodland continued to grow and develop, with the construction of a number of new schools, parks, and other public facilities. The city also became a major transportation hub, with the completion of Interstate 5 in the 1960s.
Today, Woodland is a thriving city, with a strong economy and a diverse population. The city is home to a number of large agricultural companies, as well as a number of small businesses. The city is also home to a number of parks, schools, and other public facilities.
Common Questions
What is Per Capita Income in Woodland?
Per Capita income in Woodland is $37,368.
What is the Median Family Income in Woodland?
Median Family Income in Woodland is $95,455.
What is the Median Household income in Woodland?
Median Household Income in Woodland is $84,494.
What is Income or Wage Gap in Woodland?
Income or Wage Gap in Woodland is 25.6%.
Women in Woodland earn 74.4 cents for every dollar earned by a man.
What is Family Income Deficit in Woodland?
Family Income Deficit in Woodland is $9,550.
Families that are below poverty line in Woodland earn $9,550 less on average than the poverty threshold level.
What is Inequality or Gini Index in Woodland?
Inequality or Gini Index in Woodland is 0.42.
What is the Total Population of Woodland?
Total Population of Woodland is 61,227.
What is the Total Male Population of Woodland?
Total Male Population of Woodland is 30,457.
What is the Total Female Population of Woodland?
Total Female Population of Woodland is 30,770.
What is the Ratio of Males per 100 Females in Woodland?
There are 98.98 Males per 100 Females in Woodland.
What is the Ratio of Females per 100 Males in Woodland?
There are 101.03 Females per 100 Males in Woodland.
What is the Median Population Age in Woodland?
Median Population Age in Woodland is 37.0 Years.
What is the Average Family Size in Woodland
Average Family Size in Woodland is 3.2 People.
What is the Average Household Size in Woodland
Average Household Size in Woodland is 2.9 People.
How Large is the Labor Force in Woodland?
There are 31,912 People in the Labor Forcein in Woodland.
What is the Percentage of People in the Labor Force in Woodland?
66.1% of People are in the Labor Force in Woodland.
What is the Unemployment Rate in Woodland?
Unemployment Rate in Woodland is 5.0%.