Lakeside, CA Map & Demographics
Lakeside Map
Lakeside Overview
$37,334
PER CAPITA INCOME
$109,861
AVG FAMILY INCOME
$87,386
AVG HOUSEHOLD INCOME
2.5%
WAGE / INCOME GAP [ % ]
97.5¢/ $1
WAGE / INCOME GAP [ $ ]
0.40
INEQUALITY / GINI INDEX
21,759
TOTAL POPULATION
10,258
MALE POPULATION
11,501
FEMALE POPULATION
89.19
MALES / 100 FEMALES
112.12
FEMALES / 100 MALES
38.4
MEDIAN AGE
3.5
AVG FAMILY SIZE
3.0
AVG HOUSEHOLD SIZE
10,352
LABOR FORCE [ PEOPLE ]
59.4%
PERCENT IN LABOR FORCE
7.7%
UNEMPLOYMENT RATE
Lakeside Zip Codes
Income in Lakeside
Income Overview in Lakeside
Per Capita Income in Lakeside is $37,334, while median incomes of families and households are $109,861 and $87,386 respectively.
| Characteristic | Number | Measure |
| Per Capita Income | 21,759 | $37,334 |
| Median Family Income | 5,061 | $109,861 |
| Mean Family Income | 5,061 | $125,641 |
| Median Household Income | 7,244 | $87,386 |
| Mean Household Income | 7,244 | $108,607 |
| Income Deficit | 5,061 | $0 |
| Wage / Income Gap (%) | 21,759 | 2.51% |
| Wage / Income Gap ($) | 21,759 | 97.49¢ per $1 |
| Gini / Inequality Index | 21,759 | 0.40 |
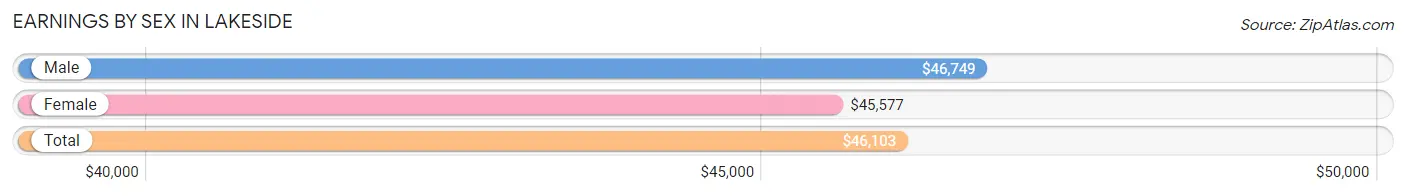
Earnings by Sex in Lakeside
Average Earnings in Lakeside are $46,103, $46,749 for men and $45,577 for women, a difference of 2.5%.
| Sex | Number | Average Earnings |
| Male | 5,472 (52.1%) | $46,749 |
| Female | 5,025 (47.9%) | $45,577 |
| Total | 10,497 (100.0%) | $46,103 |
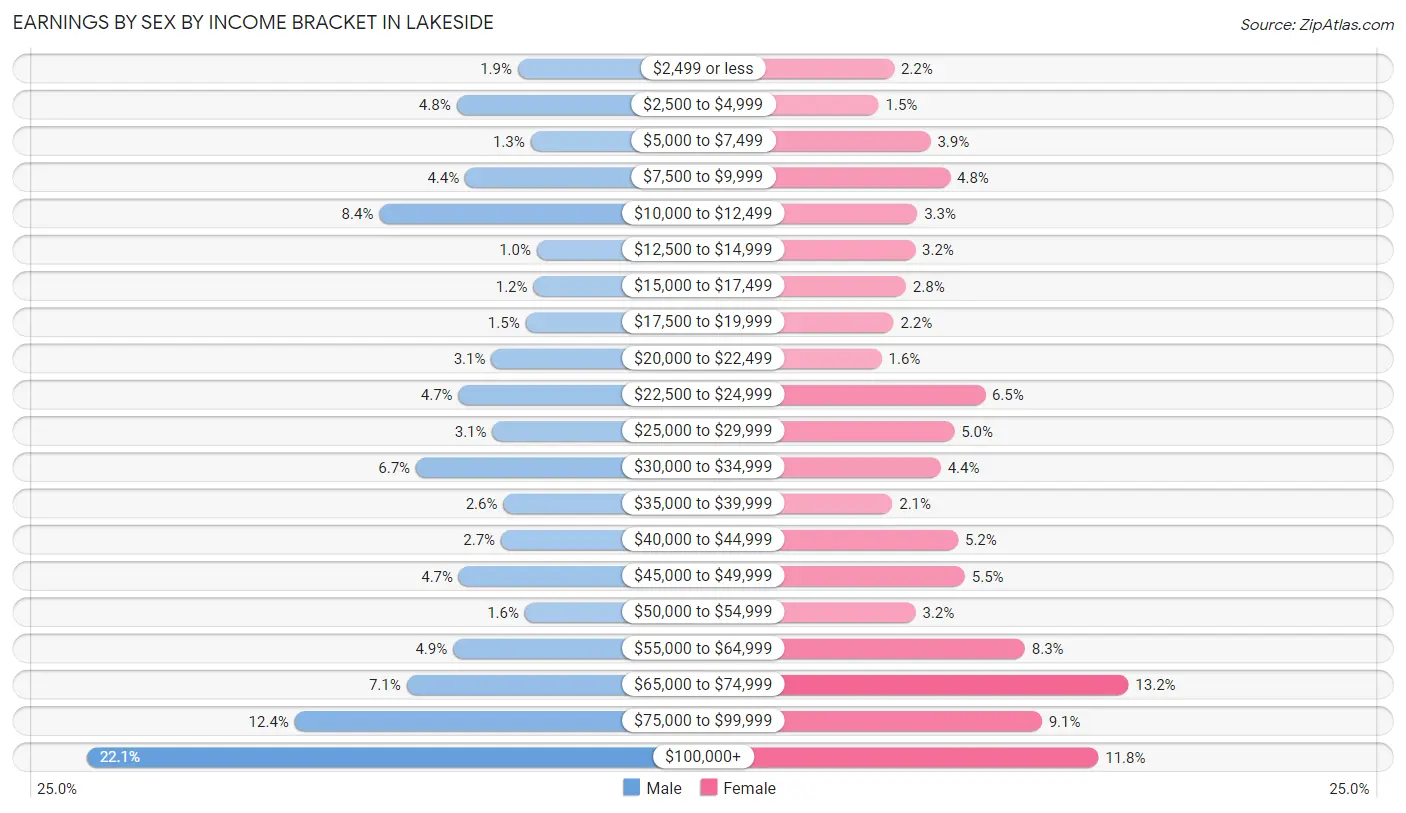
Earnings by Sex by Income Bracket in Lakeside
The most common earnings brackets in Lakeside are $100,000+ for men (1,209 | 22.1%) and $65,000 to $74,999 for women (663 | 13.2%).
| Income | Male | Female |
| $2,499 or less | 104 (1.9%) | 111 (2.2%) |
| $2,500 to $4,999 | 261 (4.8%) | 75 (1.5%) |
| $5,000 to $7,499 | 71 (1.3%) | 197 (3.9%) |
| $7,500 to $9,999 | 239 (4.4%) | 243 (4.8%) |
| $10,000 to $12,499 | 459 (8.4%) | 166 (3.3%) |
| $12,500 to $14,999 | 55 (1.0%) | 161 (3.2%) |
| $15,000 to $17,499 | 64 (1.2%) | 139 (2.8%) |
| $17,500 to $19,999 | 84 (1.5%) | 110 (2.2%) |
| $20,000 to $22,499 | 172 (3.1%) | 82 (1.6%) |
| $22,500 to $24,999 | 256 (4.7%) | 325 (6.5%) |
| $25,000 to $29,999 | 169 (3.1%) | 253 (5.0%) |
| $30,000 to $34,999 | 365 (6.7%) | 221 (4.4%) |
| $35,000 to $39,999 | 141 (2.6%) | 107 (2.1%) |
| $40,000 to $44,999 | 147 (2.7%) | 262 (5.2%) |
| $45,000 to $49,999 | 255 (4.7%) | 278 (5.5%) |
| $50,000 to $54,999 | 86 (1.6%) | 162 (3.2%) |
| $55,000 to $64,999 | 270 (4.9%) | 419 (8.3%) |
| $65,000 to $74,999 | 389 (7.1%) | 663 (13.2%) |
| $75,000 to $99,999 | 676 (12.3%) | 459 (9.1%) |
| $100,000+ | 1,209 (22.1%) | 592 (11.8%) |
| Total | 5,472 (100.0%) | 5,025 (100.0%) |
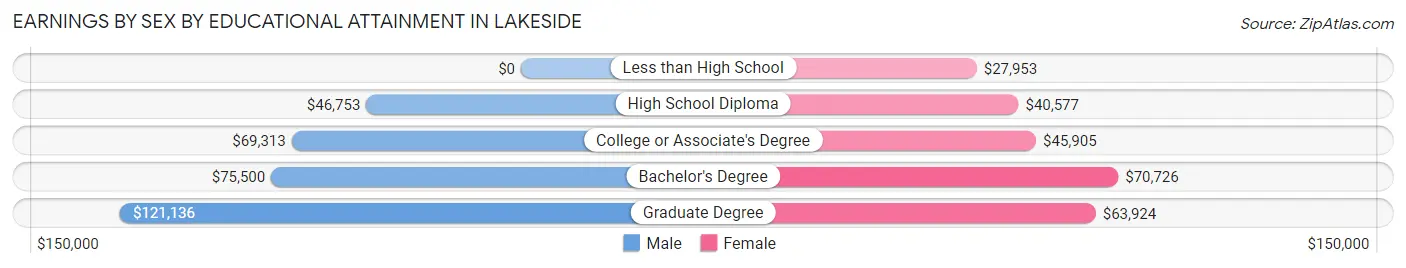
Earnings by Sex by Educational Attainment in Lakeside
Average earnings in Lakeside are $66,417 for men and $46,260 for women, a difference of 30.3%. Men with an educational attainment of graduate degree enjoy the highest average annual earnings of $121,136, while those with high school diploma education earn the least with $46,753. Women with an educational attainment of bachelor's degree earn the most with the average annual earnings of $70,726, while those with less than high school education have the smallest earnings of $27,953.
| Educational Attainment | Male Income | Female Income |
| Less than High School | - | - |
| High School Diploma | $46,753 | $40,577 |
| College or Associate's Degree | $69,313 | $45,905 |
| Bachelor's Degree | $75,500 | $70,726 |
| Graduate Degree | $121,136 | $63,924 |
| Total | $66,417 | $46,260 |
Family Income in Lakeside
Family Income Brackets in Lakeside
According to the Lakeside family income data, there are 1,164 families falling into the $100,000 to $149,999 income range, which is the most common income bracket and makes up 23.0% of all families. Conversely, the $10,000 to $14,999 income bracket is the least frequent group with only 10 families (0.2%) belonging to this category.
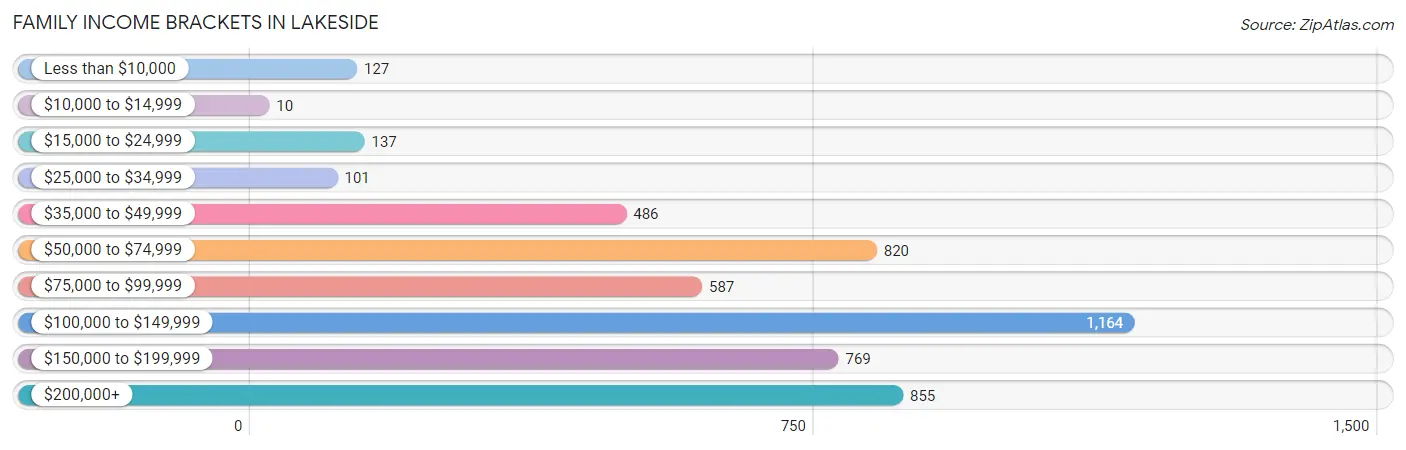
| Income Bracket | # Families | % Families |
| Less than $10,000 | 127 | 2.5% |
| $10,000 to $14,999 | 10 | 0.2% |
| $15,000 to $24,999 | 137 | 2.7% |
| $25,000 to $34,999 | 101 | 2.0% |
| $35,000 to $49,999 | 486 | 9.6% |
| $50,000 to $74,999 | 820 | 16.2% |
| $75,000 to $99,999 | 587 | 11.6% |
| $100,000 to $149,999 | 1,164 | 23.0% |
| $150,000 to $199,999 | 769 | 15.2% |
| $200,000+ | 855 | 16.9% |
Family Income by Famaliy Size in Lakeside
6-person families (189 | 3.7%) account for the highest median family income in Lakeside with $208,224 per family, while 2-person families (1,877 | 37.1%) have the highest median income of $47,882 per family member.
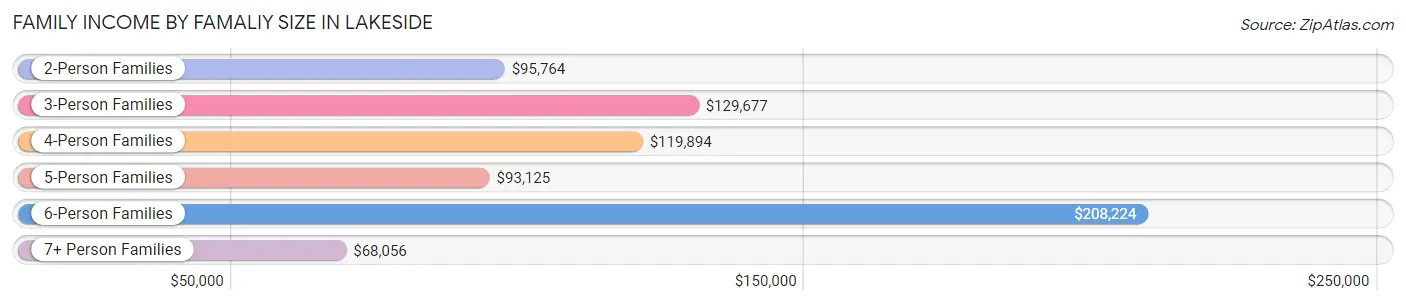
| Income Bracket | # Families | Median Income |
| 2-Person Families | 1,877 (37.1%) | $95,764 |
| 3-Person Families | 1,212 (23.9%) | $129,677 |
| 4-Person Families | 1,068 (21.1%) | $119,894 |
| 5-Person Families | 599 (11.8%) | $93,125 |
| 6-Person Families | 189 (3.7%) | $208,224 |
| 7+ Person Families | 116 (2.3%) | $68,056 |
| Total | 5,061 (100.0%) | $109,861 |
Family Income by Number of Earners in Lakeside
The median family income in Lakeside is $109,861, with families comprising 3+ earners (729) having the highest median family income of $183,661, while families with no earners (913) have the lowest median family income of $56,106, accounting for 14.4% and 18.0% of families, respectively.
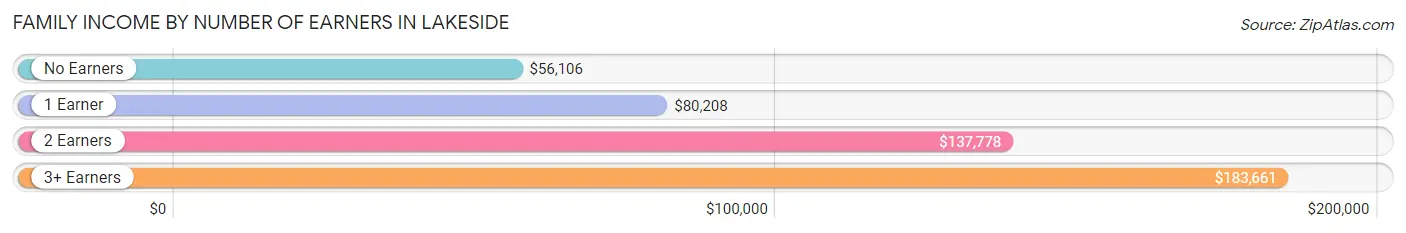
| Number of Earners | # Families | Median Income |
| No Earners | 913 (18.0%) | $56,106 |
| 1 Earner | 1,683 (33.3%) | $80,208 |
| 2 Earners | 1,736 (34.3%) | $137,778 |
| 3+ Earners | 729 (14.4%) | $183,661 |
| Total | 5,061 (100.0%) | $109,861 |
Household Income in Lakeside
Household Income Brackets in Lakeside
With 1,405 households falling in the category, the $100,000 to $149,999 income range is the most frequent in Lakeside, accounting for 19.4% of all households. In contrast, only 159 households (2.2%) fall into the $10,000 to $14,999 income bracket, making it the least populous group.
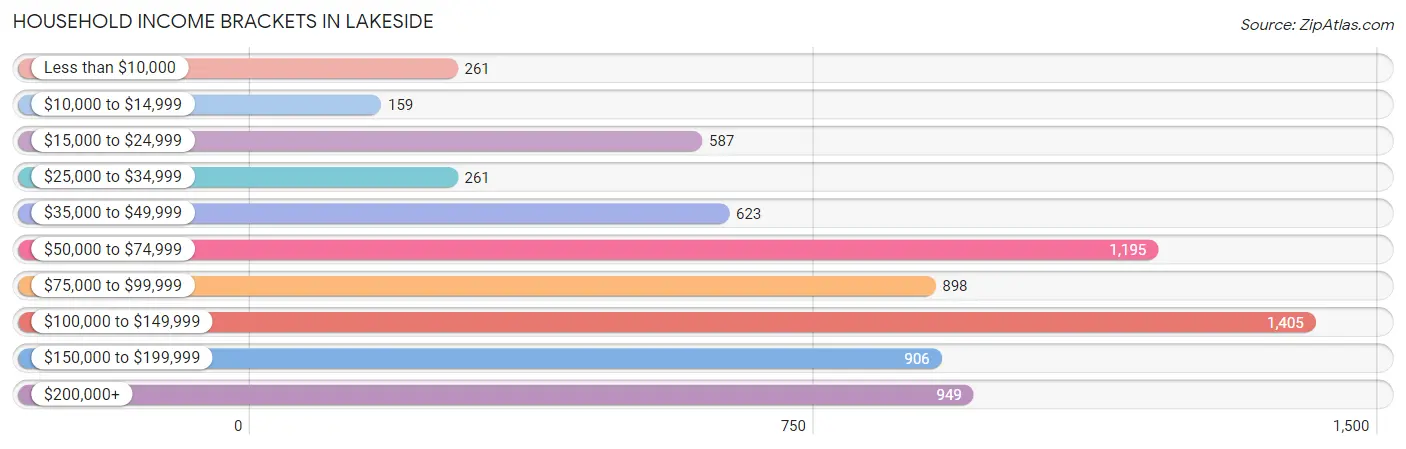
| Income Bracket | # Households | % Households |
| Less than $10,000 | 261 | 3.6% |
| $10,000 to $14,999 | 159 | 2.2% |
| $15,000 to $24,999 | 587 | 8.1% |
| $25,000 to $34,999 | 261 | 3.6% |
| $35,000 to $49,999 | 623 | 8.6% |
| $50,000 to $74,999 | 1,195 | 16.5% |
| $75,000 to $99,999 | 898 | 12.4% |
| $100,000 to $149,999 | 1,405 | 19.4% |
| $150,000 to $199,999 | 906 | 12.5% |
| $200,000+ | 949 | 13.1% |
Household Income by Householder Age in Lakeside
The median household income in Lakeside is $87,386, with the highest median household income of $137,969 found in the 15 to 24 years age bracket for the primary householder. A total of 372 households (5.1%) fall into this category. Meanwhile, the 65+ years age bracket for the primary householder has the lowest median household income of $54,643, with 2,440 households (33.7%) in this group.
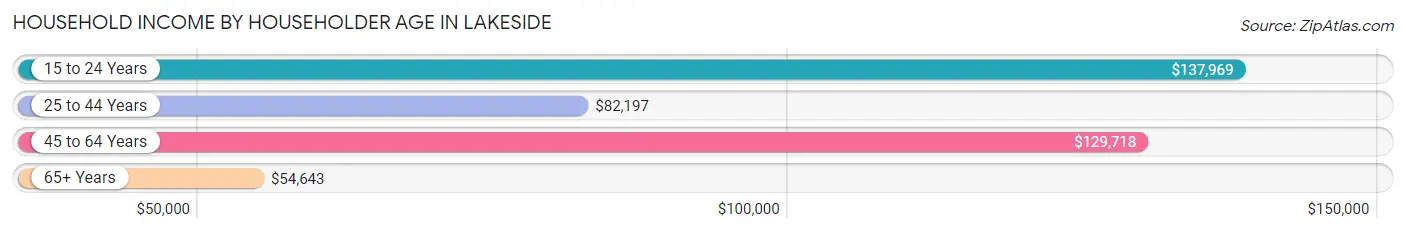
| Income Bracket | # Households | Median Income |
| 15 to 24 Years | 372 (5.1%) | $137,969 |
| 25 to 44 Years | 1,887 (26.1%) | $82,197 |
| 45 to 64 Years | 2,545 (35.1%) | $129,718 |
| 65+ Years | 2,440 (33.7%) | $54,643 |
| Total | 7,244 (100.0%) | $87,386 |
Poverty in Lakeside
Income Below Poverty by Sex and Age in Lakeside
With 6.9% poverty level for males and 8.9% for females among the residents of Lakeside, 35 to 44 year old males and 6 to 11 year old females are the most vulnerable to poverty, with 144 males (11.7%) and 164 females (22.4%) in their respective age groups living below the poverty level.
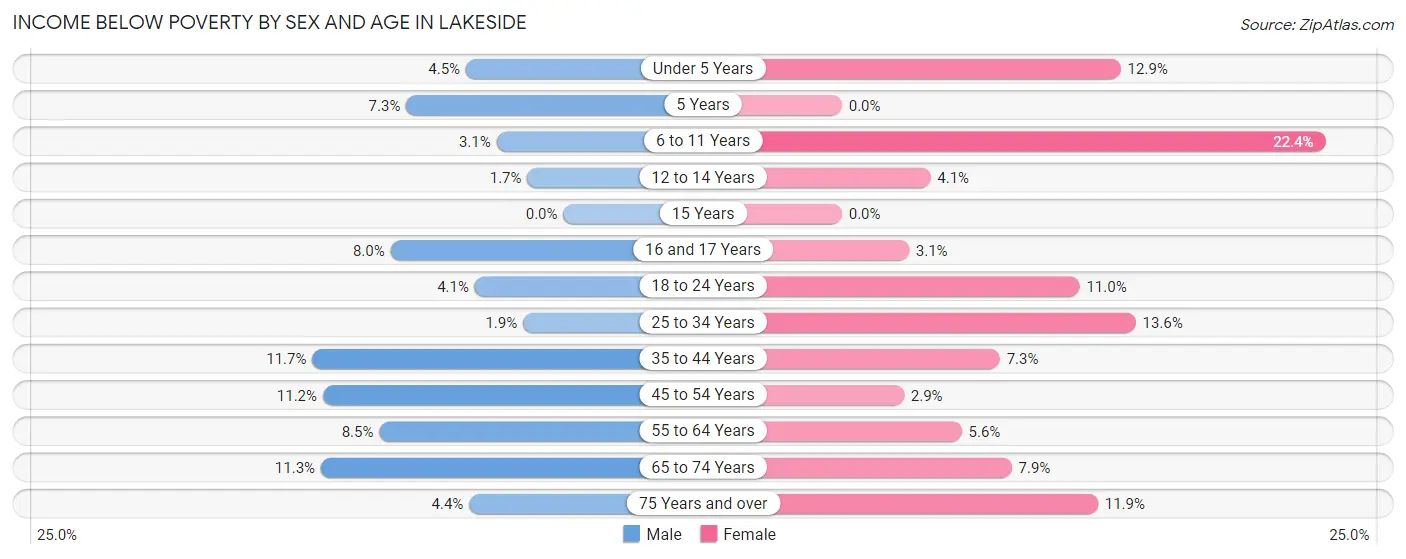
| Age Bracket | Male | Female |
| Under 5 Years | 27 (4.5%) | 88 (12.9%) |
| 5 Years | 7 (7.3%) | 0 (0.0%) |
| 6 to 11 Years | 24 (3.1%) | 164 (22.4%) |
| 12 to 14 Years | 5 (1.7%) | 26 (4.1%) |
| 15 Years | 0 (0.0%) | 0 (0.0%) |
| 16 and 17 Years | 34 (8.0%) | 9 (3.1%) |
| 18 to 24 Years | 56 (4.1%) | 121 (11.0%) |
| 25 to 34 Years | 21 (1.9%) | 180 (13.6%) |
| 35 to 44 Years | 144 (11.7%) | 99 (7.3%) |
| 45 to 54 Years | 110 (11.2%) | 35 (2.9%) |
| 55 to 64 Years | 108 (8.5%) | 77 (5.6%) |
| 65 to 74 Years | 124 (11.3%) | 108 (7.9%) |
| 75 Years and over | 39 (4.4%) | 107 (11.9%) |
| Total | 699 (6.9%) | 1,014 (8.9%) |
Income Above Poverty by Sex and Age in Lakeside
According to the poverty statistics in Lakeside, males aged 15 years and females aged 5 years are the age groups that are most secure financially, with 100.0% of males and 100.0% of females in these age groups living above the poverty line.
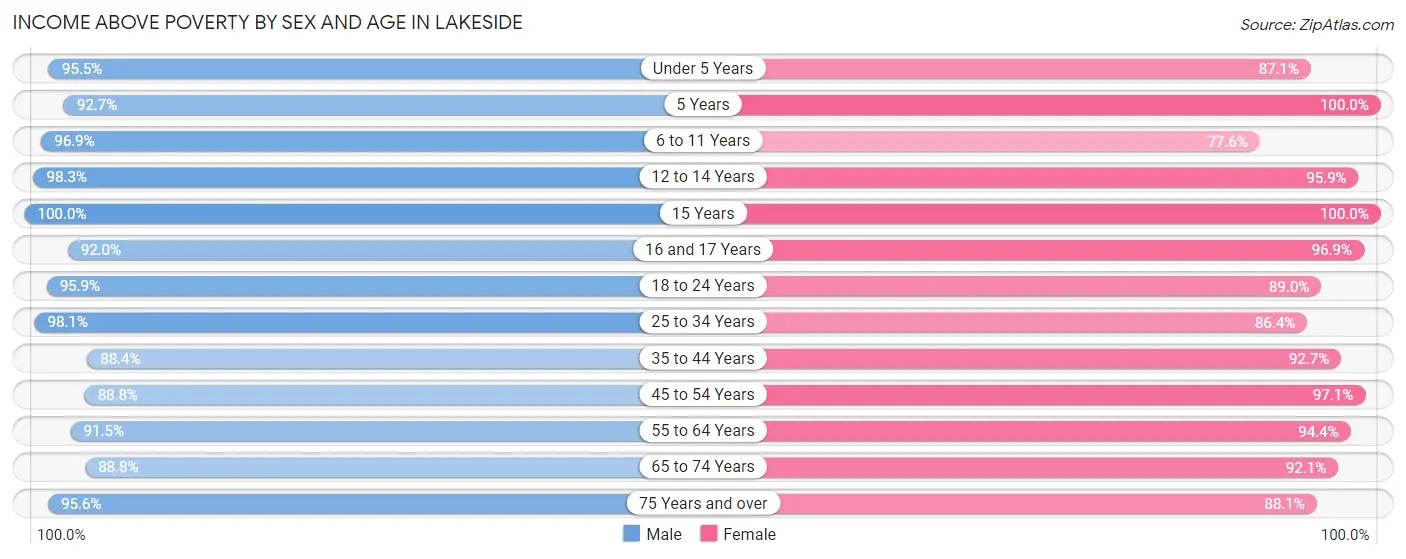
| Age Bracket | Male | Female |
| Under 5 Years | 571 (95.5%) | 592 (87.1%) |
| 5 Years | 89 (92.7%) | 276 (100.0%) |
| 6 to 11 Years | 750 (96.9%) | 567 (77.6%) |
| 12 to 14 Years | 295 (98.3%) | 607 (95.9%) |
| 15 Years | 46 (100.0%) | 103 (100.0%) |
| 16 and 17 Years | 390 (92.0%) | 280 (96.9%) |
| 18 to 24 Years | 1,306 (95.9%) | 976 (89.0%) |
| 25 to 34 Years | 1,105 (98.1%) | 1,141 (86.4%) |
| 35 to 44 Years | 1,092 (88.3%) | 1,252 (92.7%) |
| 45 to 54 Years | 876 (88.8%) | 1,180 (97.1%) |
| 55 to 64 Years | 1,157 (91.5%) | 1,309 (94.4%) |
| 65 to 74 Years | 978 (88.7%) | 1,262 (92.1%) |
| 75 Years and over | 854 (95.6%) | 794 (88.1%) |
| Total | 9,509 (93.1%) | 10,339 (91.1%) |
Income Below Poverty Among Married-Couple Families in Lakeside
The poverty statistics for married-couple families in Lakeside show that 1.6% or 61 of the total 3,712 families live below the poverty line. Families with no children have the highest poverty rate of 1.8%, comprising of 37 families. On the other hand, families with 1 or 2 children have the lowest poverty rate of 1.4%, which includes 17 families.
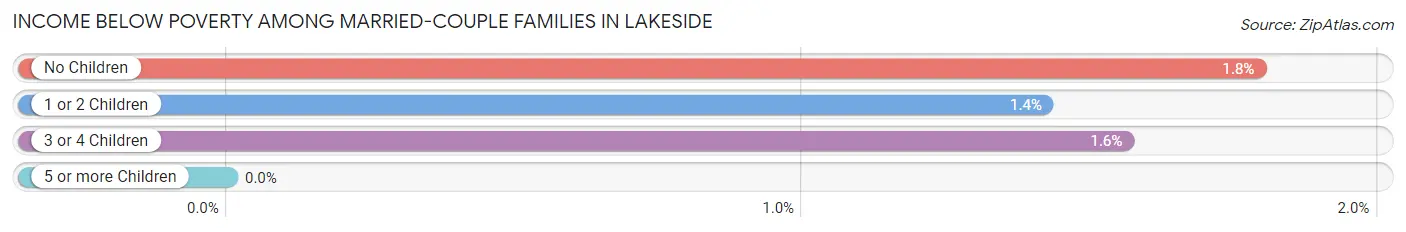
| Children | Above Poverty | Below Poverty |
| No Children | 2,028 (98.2%) | 37 (1.8%) |
| 1 or 2 Children | 1,181 (98.6%) | 17 (1.4%) |
| 3 or 4 Children | 442 (98.4%) | 7 (1.6%) |
| 5 or more Children | 0 (0.0%) | 0 (0.0%) |
| Total | 3,651 (98.4%) | 61 (1.6%) |
Income Below Poverty Among Single-Parent Households in Lakeside
According to the poverty data in Lakeside, 4.1% or 11 single-father households and 11.5% or 124 single-mother households are living below the poverty line. Among single-father households, those with 1 or 2 children have the highest poverty rate, with 6 households (16.7%) experiencing poverty. Likewise, among single-mother households, those with 3 or 4 children have the highest poverty rate, with 79 households (57.3%) falling below the poverty line.
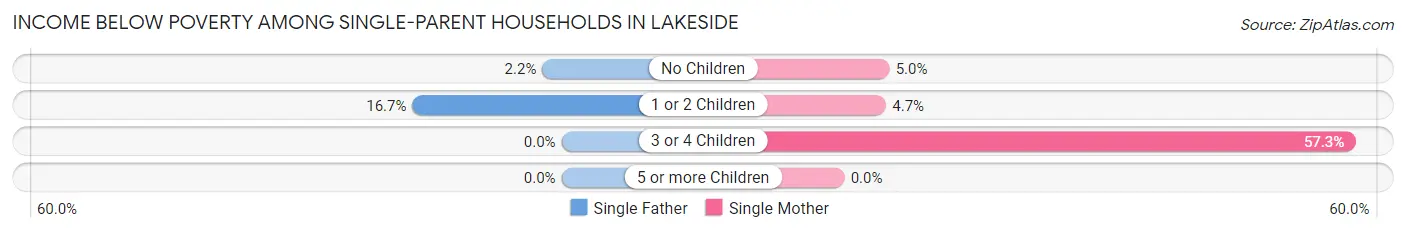
| Children | Single Father | Single Mother |
| No Children | 5 (2.1%) | 22 (5.0%) |
| 1 or 2 Children | 6 (16.7%) | 23 (4.7%) |
| 3 or 4 Children | 0 (0.0%) | 79 (57.3%) |
| 5 or more Children | 0 (0.0%) | 0 (0.0%) |
| Total | 11 (4.1%) | 124 (11.5%) |
Income Below Poverty Among Married-Couple vs Single-Parent Households in Lakeside
The poverty data for Lakeside shows that 61 of the married-couple family households (1.6%) and 135 of the single-parent households (10.0%) are living below the poverty level. Within the married-couple family households, those with no children have the highest poverty rate, with 37 households (1.8%) falling below the poverty line. Among the single-parent households, those with 3 or 4 children have the highest poverty rate, with 79 household (57.3%) living below poverty.
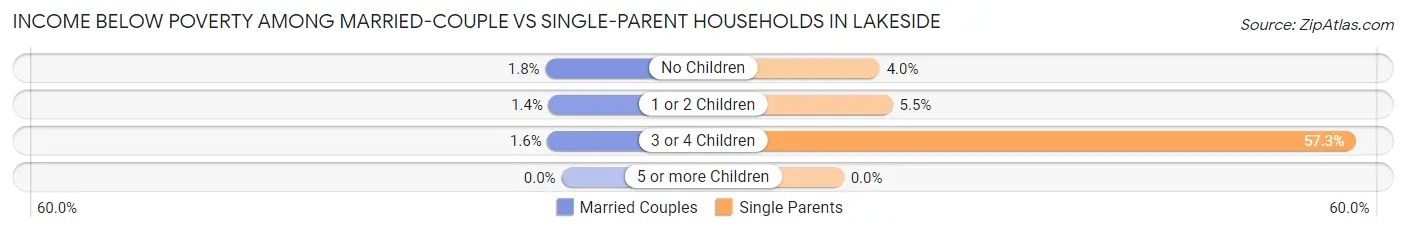
| Children | Married-Couple Families | Single-Parent Households |
| No Children | 37 (1.8%) | 27 (4.0%) |
| 1 or 2 Children | 17 (1.4%) | 29 (5.5%) |
| 3 or 4 Children | 7 (1.6%) | 79 (57.3%) |
| 5 or more Children | 0 (0.0%) | 0 (0.0%) |
| Total | 61 (1.6%) | 135 (10.0%) |
Race in Lakeside
The most populous races in Lakeside are White / Caucasian (17,536 | 80.6%), Hispanic or Latino (4,638 | 21.3%), and Two or more Races (2,226 | 10.2%).
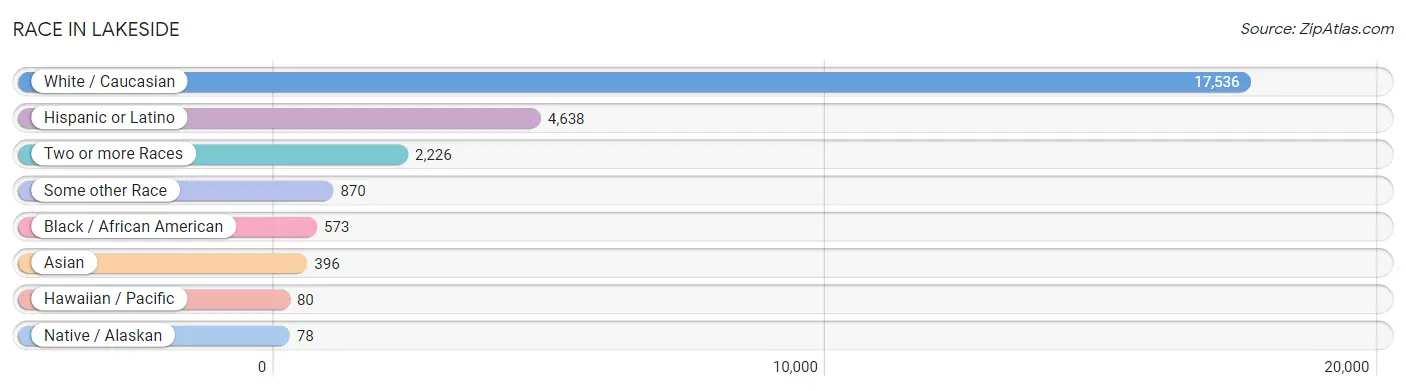
| Race | # Population | % Population |
| Asian | 396 | 1.8% |
| Black / African American | 573 | 2.6% |
| Hawaiian / Pacific | 80 | 0.4% |
| Hispanic or Latino | 4,638 | 21.3% |
| Native / Alaskan | 78 | 0.4% |
| White / Caucasian | 17,536 | 80.6% |
| Two or more Races | 2,226 | 10.2% |
| Some other Race | 870 | 4.0% |
| Total | 21,759 | 100.0% |
Ancestry in Lakeside
The most populous ancestries reported in Lakeside are Mexican (3,873 | 17.8%), German (3,155 | 14.5%), Irish (2,626 | 12.1%), English (2,104 | 9.7%), and Italian (1,623 | 7.5%), together accounting for 61.5% of all Lakeside residents.
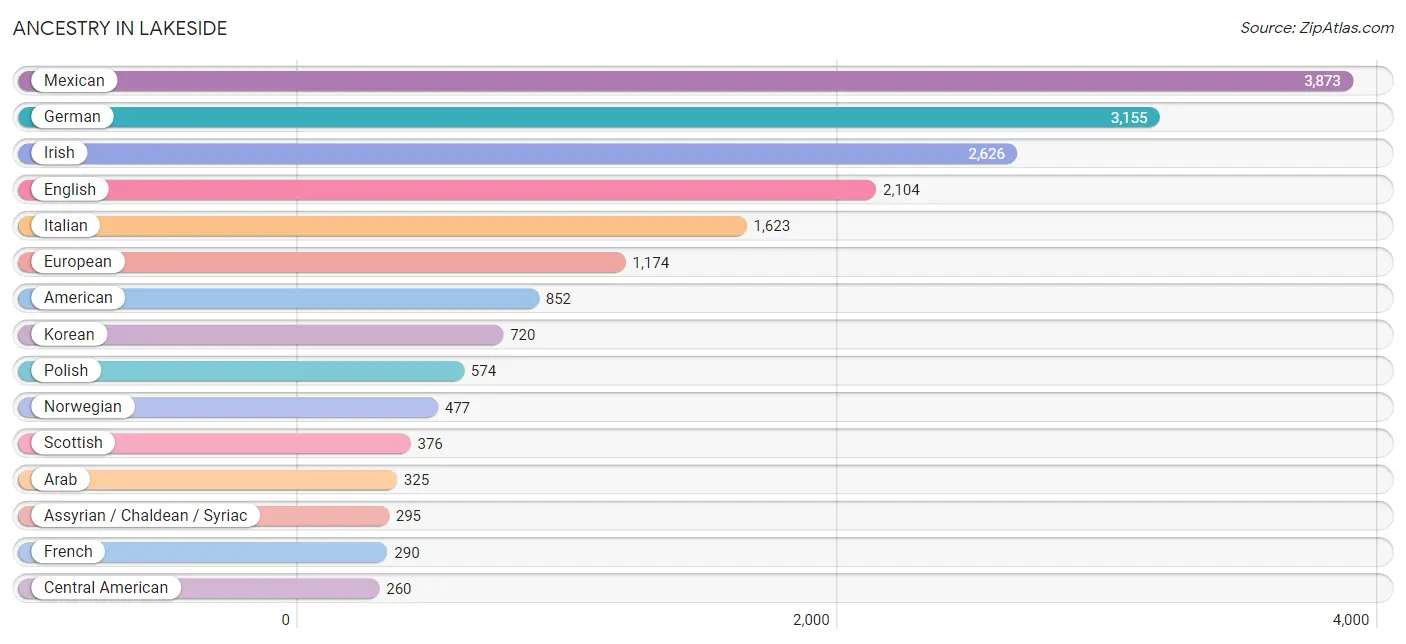
| Ancestry | # Population | % Population |
| American | 852 | 3.9% |
| Arab | 325 | 1.5% |
| Armenian | 9 | 0.0% |
| Assyrian / Chaldean / Syriac | 295 | 1.4% |
| Australian | 50 | 0.2% |
| Austrian | 15 | 0.1% |
| Bhutanese | 49 | 0.2% |
| Bolivian | 5 | 0.0% |
| British | 194 | 0.9% |
| Bulgarian | 13 | 0.1% |
| Burmese | 6 | 0.0% |
| Canadian | 36 | 0.2% |
| Central American | 260 | 1.2% |
| Cherokee | 77 | 0.4% |
| Cheyenne | 4 | 0.0% |
| Costa Rican | 60 | 0.3% |
| Czech | 52 | 0.2% |
| Czechoslovakian | 68 | 0.3% |
| Danish | 52 | 0.2% |
| Dutch | 219 | 1.0% |
| Eastern European | 20 | 0.1% |
| Ecuadorian | 34 | 0.2% |
| English | 2,104 | 9.7% |
| European | 1,174 | 5.4% |
| Finnish | 38 | 0.2% |
| French | 290 | 1.3% |
| French Canadian | 21 | 0.1% |
| German | 3,155 | 14.5% |
| Greek | 74 | 0.3% |
| Guamanian / Chamorro | 61 | 0.3% |
| Guatemalan | 40 | 0.2% |
| Hungarian | 77 | 0.4% |
| Iranian | 22 | 0.1% |
| Iraqi | 82 | 0.4% |
| Irish | 2,626 | 12.1% |
| Israeli | 93 | 0.4% |
| Italian | 1,623 | 7.5% |
| Korean | 720 | 3.3% |
| Laotian | 2 | 0.0% |
| Lebanese | 33 | 0.2% |
| Lithuanian | 27 | 0.1% |
| Mexican | 3,873 | 17.8% |
| Mexican American Indian | 4 | 0.0% |
| Moroccan | 51 | 0.2% |
| Native Hawaiian | 118 | 0.5% |
| Navajo | 6 | 0.0% |
| Northern European | 20 | 0.1% |
| Norwegian | 477 | 2.2% |
| Pakistani | 10 | 0.1% |
| Panamanian | 141 | 0.6% |
| Polish | 574 | 2.6% |
| Portuguese | 101 | 0.5% |
| Puerto Rican | 211 | 1.0% |
| Russian | 250 | 1.1% |
| Salvadoran | 19 | 0.1% |
| Scandinavian | 144 | 0.7% |
| Scotch-Irish | 177 | 0.8% |
| Scottish | 376 | 1.7% |
| Slavic | 21 | 0.1% |
| Slovene | 22 | 0.1% |
| South African | 27 | 0.1% |
| South American | 39 | 0.2% |
| Spanish | 119 | 0.5% |
| Sri Lankan | 33 | 0.2% |
| Subsaharan African | 27 | 0.1% |
| Swedish | 231 | 1.1% |
| Swiss | 64 | 0.3% |
| Thai | 66 | 0.3% |
| Ukrainian | 27 | 0.1% |
| Welsh | 47 | 0.2% |
| Yugoslavian | 82 | 0.4% | View All 71 Rows |
Immigrants in Lakeside
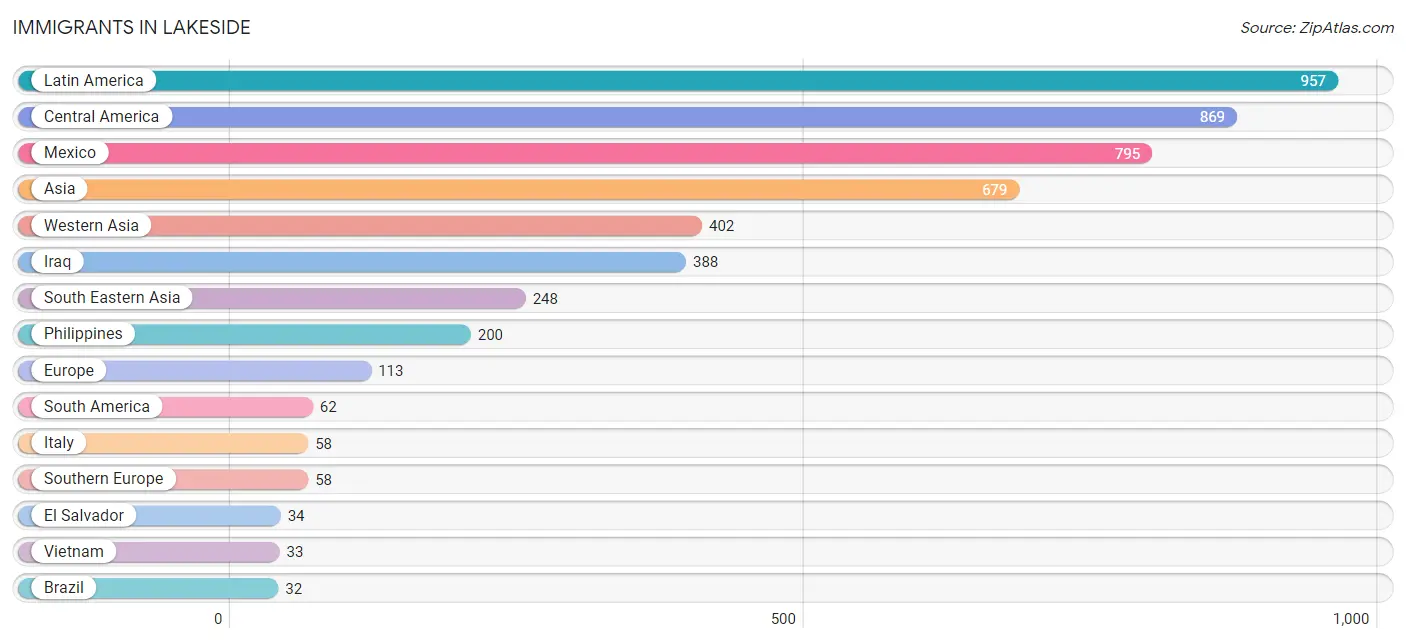
The most numerous immigrant groups reported in Lakeside came from Latin America (957 | 4.4%), Central America (869 | 4.0%), Mexico (795 | 3.6%), Asia (679 | 3.1%), and Western Asia (402 | 1.8%), together accounting for 17.0% of all Lakeside residents.
| Immigration Origin | # Population | % Population |
| Africa | 13 | 0.1% |
| Asia | 679 | 3.1% |
| Brazil | 32 | 0.2% |
| Bulgaria | 7 | 0.0% |
| Canada | 16 | 0.1% |
| Caribbean | 26 | 0.1% |
| Central America | 869 | 4.0% |
| China | 12 | 0.1% |
| Costa Rica | 29 | 0.1% |
| Dominican Republic | 26 | 0.1% |
| Eastern Asia | 29 | 0.1% |
| Eastern Europe | 7 | 0.0% |
| El Salvador | 34 | 0.2% |
| England | 19 | 0.1% |
| Europe | 113 | 0.5% |
| Germany | 24 | 0.1% |
| Guatemala | 11 | 0.1% |
| Guyana | 30 | 0.1% |
| Indonesia | 2 | 0.0% |
| Iraq | 388 | 1.8% |
| Israel | 14 | 0.1% |
| Italy | 58 | 0.3% |
| Japan | 17 | 0.1% |
| Latin America | 957 | 4.4% |
| Mexico | 795 | 3.6% |
| Nigeria | 7 | 0.0% |
| Northern Europe | 19 | 0.1% |
| Oceania | 23 | 0.1% |
| Philippines | 200 | 0.9% |
| South Africa | 6 | 0.0% |
| South America | 62 | 0.3% |
| South Eastern Asia | 248 | 1.1% |
| Southern Europe | 58 | 0.3% |
| Switzerland | 5 | 0.0% |
| Thailand | 13 | 0.1% |
| Vietnam | 33 | 0.2% |
| Western Africa | 7 | 0.0% |
| Western Asia | 402 | 1.8% |
| Western Europe | 29 | 0.1% | View All 39 Rows |
Sex and Age in Lakeside
Sex and Age in Lakeside
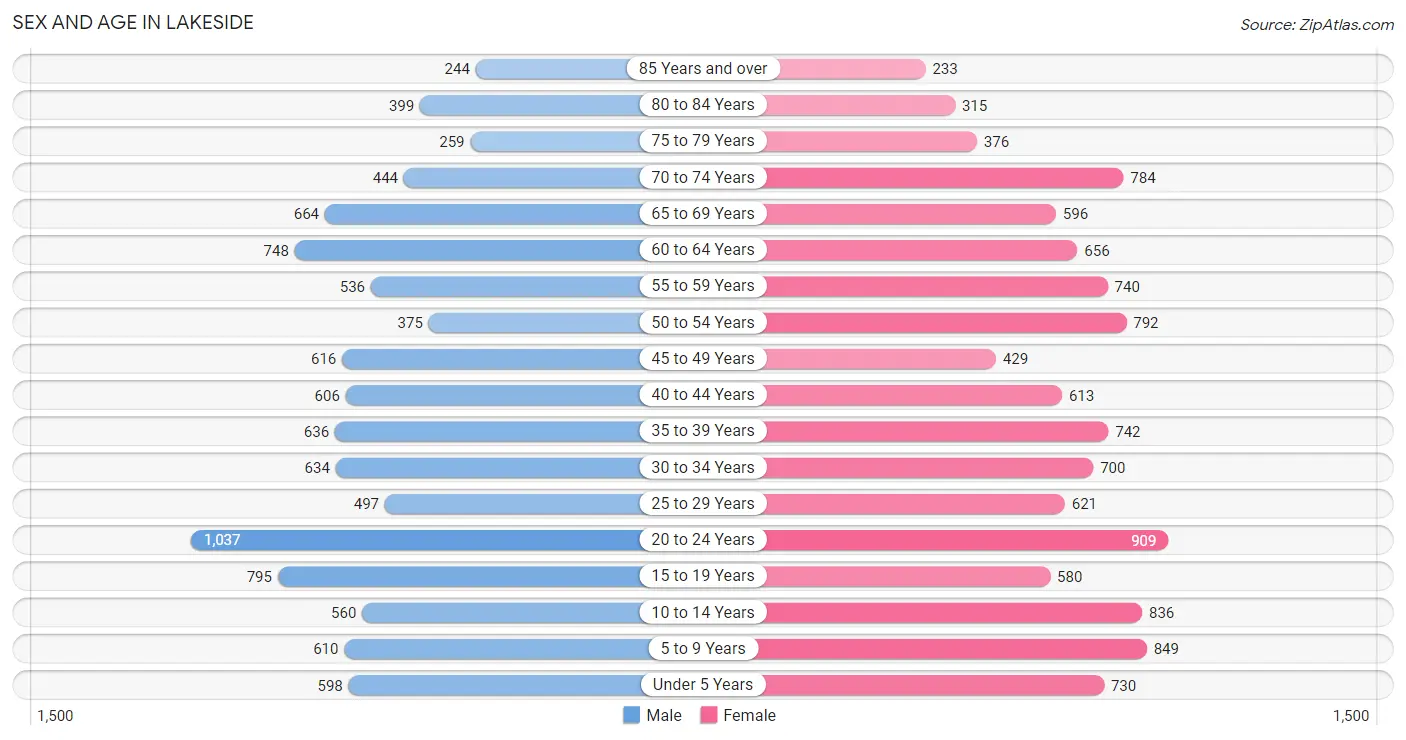
The most populous age groups in Lakeside are 20 to 24 Years (1,037 | 10.1%) for men and 20 to 24 Years (909 | 7.9%) for women.
| Age Bracket | Male | Female |
| Under 5 Years | 598 (5.8%) | 730 (6.4%) |
| 5 to 9 Years | 610 (5.9%) | 849 (7.4%) |
| 10 to 14 Years | 560 (5.5%) | 836 (7.3%) |
| 15 to 19 Years | 795 (7.7%) | 580 (5.0%) |
| 20 to 24 Years | 1,037 (10.1%) | 909 (7.9%) |
| 25 to 29 Years | 497 (4.8%) | 621 (5.4%) |
| 30 to 34 Years | 634 (6.2%) | 700 (6.1%) |
| 35 to 39 Years | 636 (6.2%) | 742 (6.5%) |
| 40 to 44 Years | 606 (5.9%) | 613 (5.3%) |
| 45 to 49 Years | 616 (6.0%) | 429 (3.7%) |
| 50 to 54 Years | 375 (3.7%) | 792 (6.9%) |
| 55 to 59 Years | 536 (5.2%) | 740 (6.4%) |
| 60 to 64 Years | 748 (7.3%) | 656 (5.7%) |
| 65 to 69 Years | 664 (6.5%) | 596 (5.2%) |
| 70 to 74 Years | 444 (4.3%) | 784 (6.8%) |
| 75 to 79 Years | 259 (2.5%) | 376 (3.3%) |
| 80 to 84 Years | 399 (3.9%) | 315 (2.7%) |
| 85 Years and over | 244 (2.4%) | 233 (2.0%) |
| Total | 10,258 (100.0%) | 11,501 (100.0%) |
Families and Households in Lakeside
Median Family Size in Lakeside
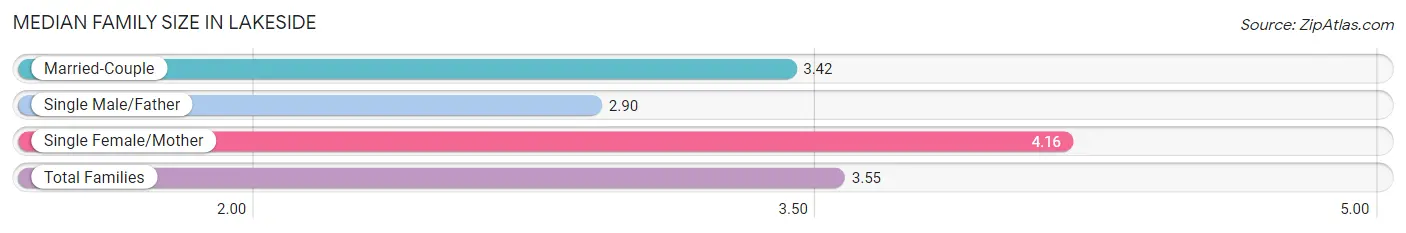
The median family size in Lakeside is 3.55 persons per family, with single female/mother families (1,080 | 21.3%) accounting for the largest median family size of 4.16 persons per family. On the other hand, single male/father families (269 | 5.3%) represent the smallest median family size with 2.90 persons per family.
| Family Type | # Families | Family Size |
| Married-Couple | 3,712 (73.4%) | 3.42 |
| Single Male/Father | 269 (5.3%) | 2.90 |
| Single Female/Mother | 1,080 (21.3%) | 4.16 |
| Total Families | 5,061 (100.0%) | 3.55 |
Median Household Size in Lakeside
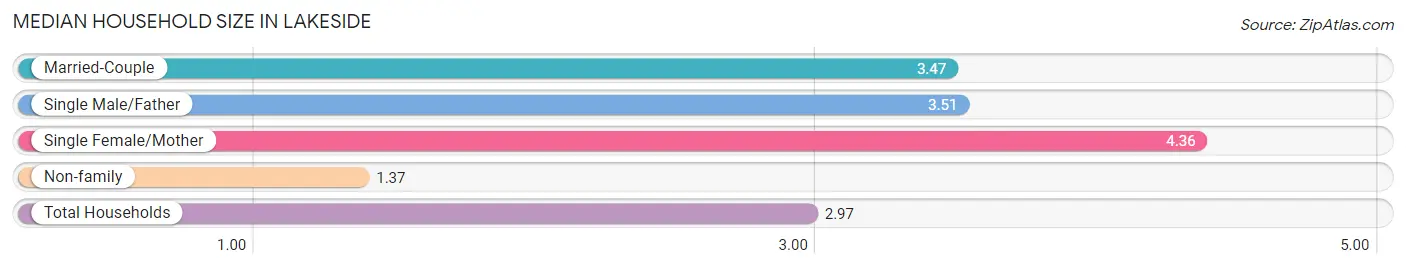
The median household size in Lakeside is 2.97 persons per household, with single female/mother households (1,080 | 14.9%) accounting for the largest median household size of 4.36 persons per household. non-family households (2,183 | 30.1%) represent the smallest median household size with 1.37 persons per household.
| Household Type | # Households | Household Size |
| Married-Couple | 3,712 (51.2%) | 3.47 |
| Single Male/Father | 269 (3.7%) | 3.51 |
| Single Female/Mother | 1,080 (14.9%) | 4.36 |
| Non-family | 2,183 (30.1%) | 1.37 |
| Total Households | 7,244 (100.0%) | 2.97 |
Household Size by Marriage Status in Lakeside
Out of a total of 7,244 households in Lakeside, 5,061 (69.9%) are family households, while 2,183 (30.1%) are nonfamily households. The most numerous type of family households are 2-person households, comprising 1,749, and the most common type of nonfamily households are 1-person households, comprising 1,437.
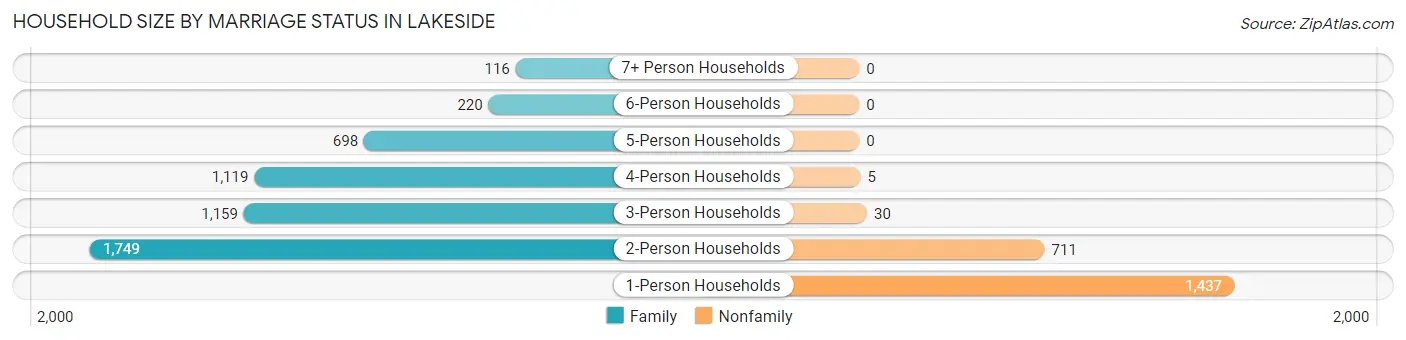
| Household Size | Family Households | Nonfamily Households |
| 1-Person Households | - | 1,437 (19.8%) |
| 2-Person Households | 1,749 (24.1%) | 711 (9.8%) |
| 3-Person Households | 1,159 (16.0%) | 30 (0.4%) |
| 4-Person Households | 1,119 (15.4%) | 5 (0.1%) |
| 5-Person Households | 698 (9.6%) | 0 (0.0%) |
| 6-Person Households | 220 (3.0%) | 0 (0.0%) |
| 7+ Person Households | 116 (1.6%) | 0 (0.0%) |
| Total | 5,061 (69.9%) | 2,183 (30.1%) |
Female Fertility in Lakeside
Fertility by Age in Lakeside
Average fertility rate in Lakeside is 72.0 births per 1,000 women. Women in the age bracket of 20 to 34 years have the highest fertility rate with 131.0 births per 1,000 women. Women in the age bracket of 20 to 34 years acount for 86.9% of all women with births.
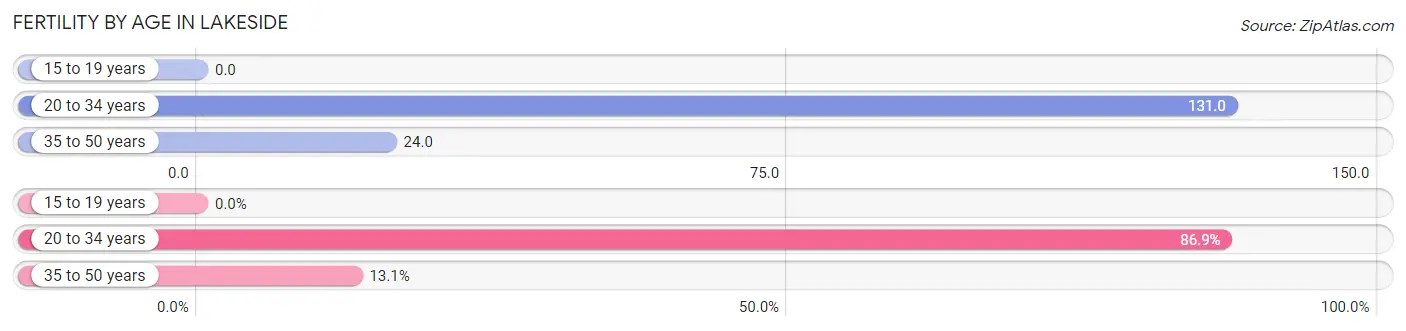
| Age Bracket | Women with Births | Births / 1,000 Women |
| 15 to 19 years | 0 (0.0%) | 0.0 |
| 20 to 34 years | 292 (86.9%) | 131.0 |
| 35 to 50 years | 44 (13.1%) | 24.0 |
| Total | 336 (100.0%) | 72.0 |
Fertility by Age by Marriage Status in Lakeside
97.3% of women with births (336) in Lakeside are married. The highest percentage of unmarried women with births falls into 20 to 34 years age bracket with 3.1% of them unmarried at the time of birth, while the lowest percentage of unmarried women with births belong to 35 to 50 years age bracket with 0.0% of them unmarried.
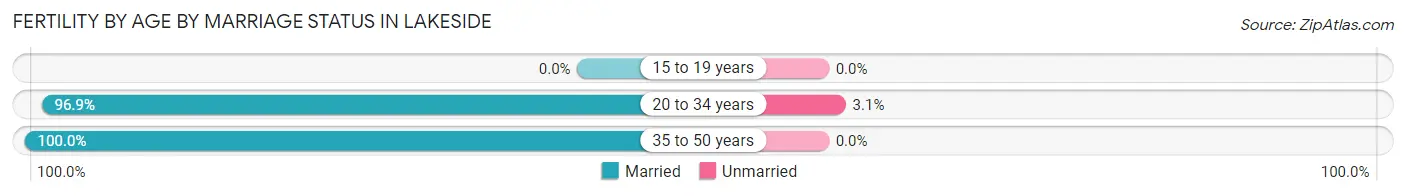
| Age Bracket | Married | Unmarried |
| 15 to 19 years | 0 (0.0%) | 0 (0.0%) |
| 20 to 34 years | 283 (96.9%) | 9 (3.1%) |
| 35 to 50 years | 44 (100.0%) | 0 (0.0%) |
| Total | 327 (97.3%) | 9 (2.7%) |
Fertility by Education in Lakeside
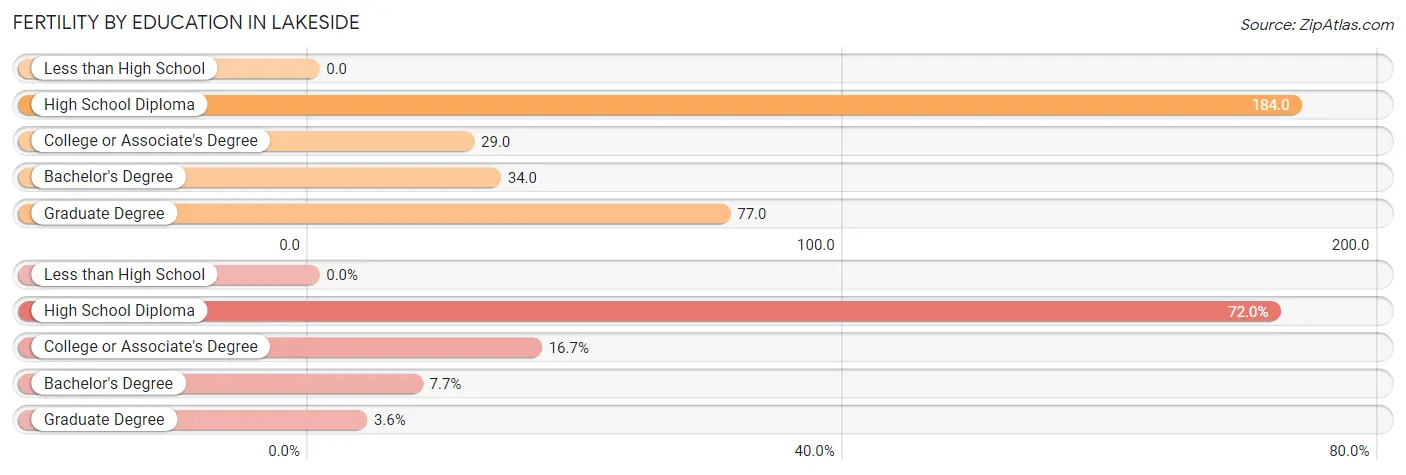
| Educational Attainment | Women with Births | Births / 1,000 Women |
| Less than High School | 0 (0.0%) | 0.0 |
| High School Diploma | 242 (72.0%) | 184.0 |
| College or Associate's Degree | 56 (16.7%) | 29.0 |
| Bachelor's Degree | 26 (7.7%) | 34.0 |
| Graduate Degree | 12 (3.6%) | 77.0 |
| Total | 336 (100.0%) | 72.0 |
Fertility by Education by Marriage Status in Lakeside
2.7% of women with births in Lakeside are unmarried. Women with the educational attainment of high school diploma are most likely to be married with 100.0% of them married at childbirth, while women with the educational attainment of college or associate's degree are least likely to be married with 16.1% of them unmarried at childbirth.
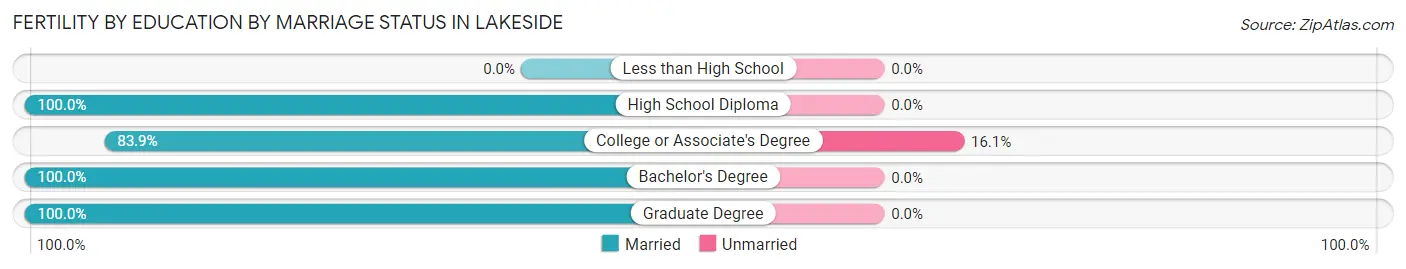
| Educational Attainment | Married | Unmarried |
| Less than High School | 0 (0.0%) | 0 (0.0%) |
| High School Diploma | 242 (100.0%) | 0 (0.0%) |
| College or Associate's Degree | 47 (83.9%) | 9 (16.1%) |
| Bachelor's Degree | 26 (100.0%) | 0 (0.0%) |
| Graduate Degree | 12 (100.0%) | 0 (0.0%) |
| Total | 327 (97.3%) | 9 (2.7%) |
Employment Characteristics in Lakeside
Employment by Class of Employer in Lakeside
Among the 9,245 employed individuals in Lakeside, private company employees (5,626 | 60.9%), local government employees (976 | 10.6%), and not-for-profit organizations (729 | 7.9%) make up the most common classes of employment.
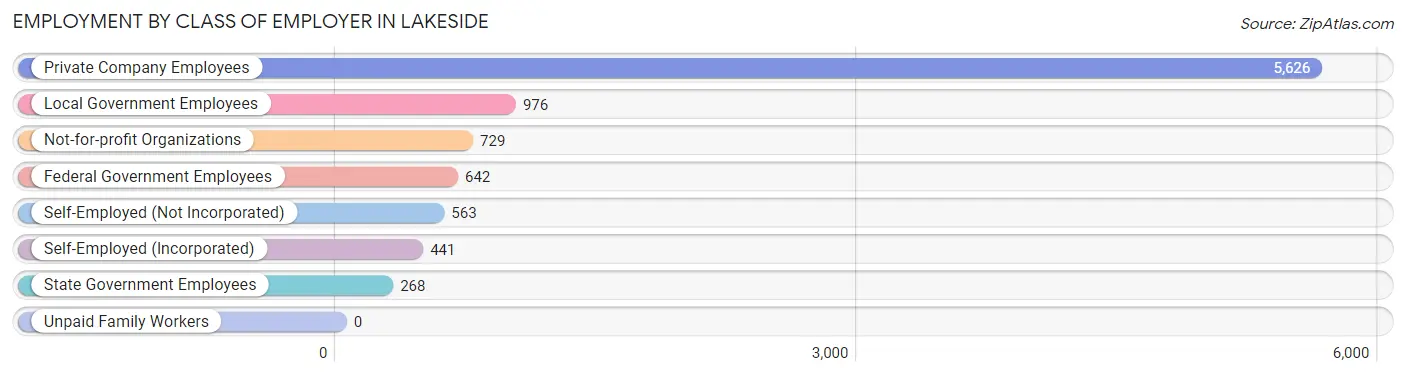
| Employer Class | # Employees | % Employees |
| Private Company Employees | 5,626 | 60.9% |
| Self-Employed (Incorporated) | 441 | 4.8% |
| Self-Employed (Not Incorporated) | 563 | 6.1% |
| Not-for-profit Organizations | 729 | 7.9% |
| Local Government Employees | 976 | 10.6% |
| State Government Employees | 268 | 2.9% |
| Federal Government Employees | 642 | 6.9% |
| Unpaid Family Workers | 0 | 0.0% |
| Total | 9,245 | 100.0% |
Employment Status by Age in Lakeside
According to the labor force statistics for Lakeside, out of the total population over 16 years of age (17,427), 59.4% or 10,352 individuals are in the labor force, with 7.7% or 797 of them unemployed. The age group with the highest labor force participation rate is 30 to 34 years, with 88.5% or 1,181 individuals in the labor force. Within the labor force, the 16 to 19 years age range has the highest percentage of unemployed individuals, with 25.3% or 125 of them being unemployed.
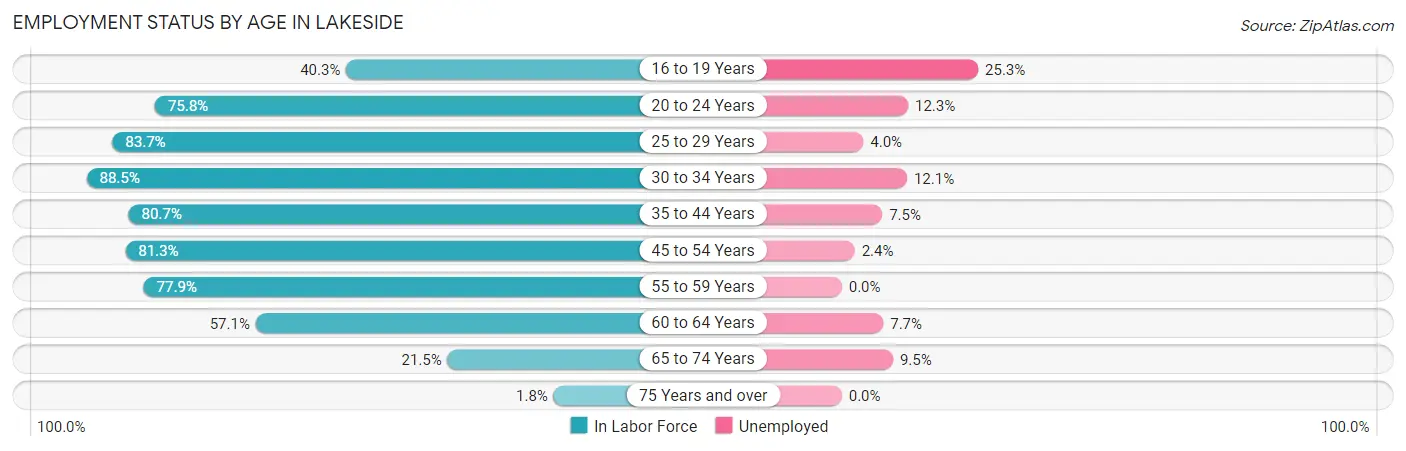
| Age Bracket | In Labor Force | Unemployed |
| 16 to 19 Years | 494 (40.3%) | 125 (25.3%) |
| 20 to 24 Years | 1,475 (75.8%) | 181 (12.3%) |
| 25 to 29 Years | 936 (83.7%) | 37 (4.0%) |
| 30 to 34 Years | 1,181 (88.5%) | 143 (12.1%) |
| 35 to 44 Years | 2,096 (80.7%) | 157 (7.5%) |
| 45 to 54 Years | 1,798 (81.3%) | 43 (2.4%) |
| 55 to 59 Years | 994 (77.9%) | 0 (0.0%) |
| 60 to 64 Years | 802 (57.1%) | 62 (7.7%) |
| 65 to 74 Years | 535 (21.5%) | 51 (9.5%) |
| 75 Years and over | 33 (1.8%) | 0 (0.0%) |
| Total | 10,352 (59.4%) | 797 (7.7%) |
Employment Status by Educational Attainment in Lakeside
According to labor force statistics for Lakeside, 78.5% of individuals (7,804) out of the total population between 25 and 64 years of age (9,941) are in the labor force, with 5.6% or 437 of them being unemployed. The group with the highest labor force participation rate are those with the educational attainment of bachelor's degree or higher, with 84.8% or 2,213 individuals in the labor force. Within the labor force, individuals with high school diploma education have the highest percentage of unemployment, with 10.7% or 216 of them being unemployed.
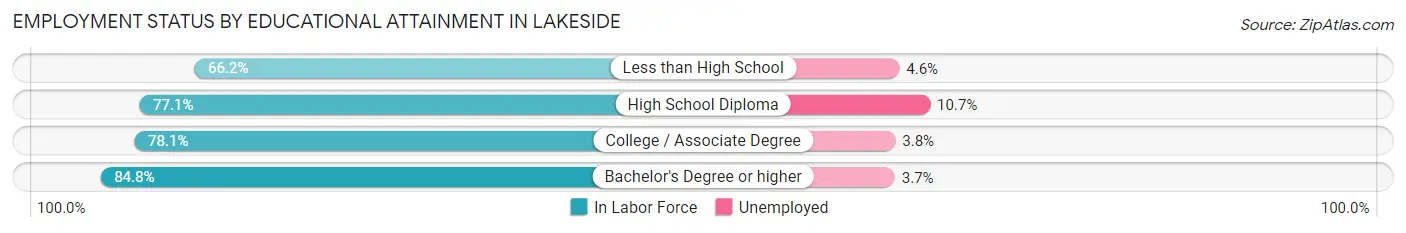
| Educational Attainment | In Labor Force | Unemployed |
| Less than High School | 588 (66.2%) | 41 (4.6%) |
| High School Diploma | 2,017 (77.1%) | 280 (10.7%) |
| College / Associate Degree | 2,989 (78.1%) | 145 (3.8%) |
| Bachelor's Degree or higher | 2,213 (84.8%) | 97 (3.7%) |
| Total | 7,804 (78.5%) | 557 (5.6%) |
Employment Occupations by Sex in Lakeside
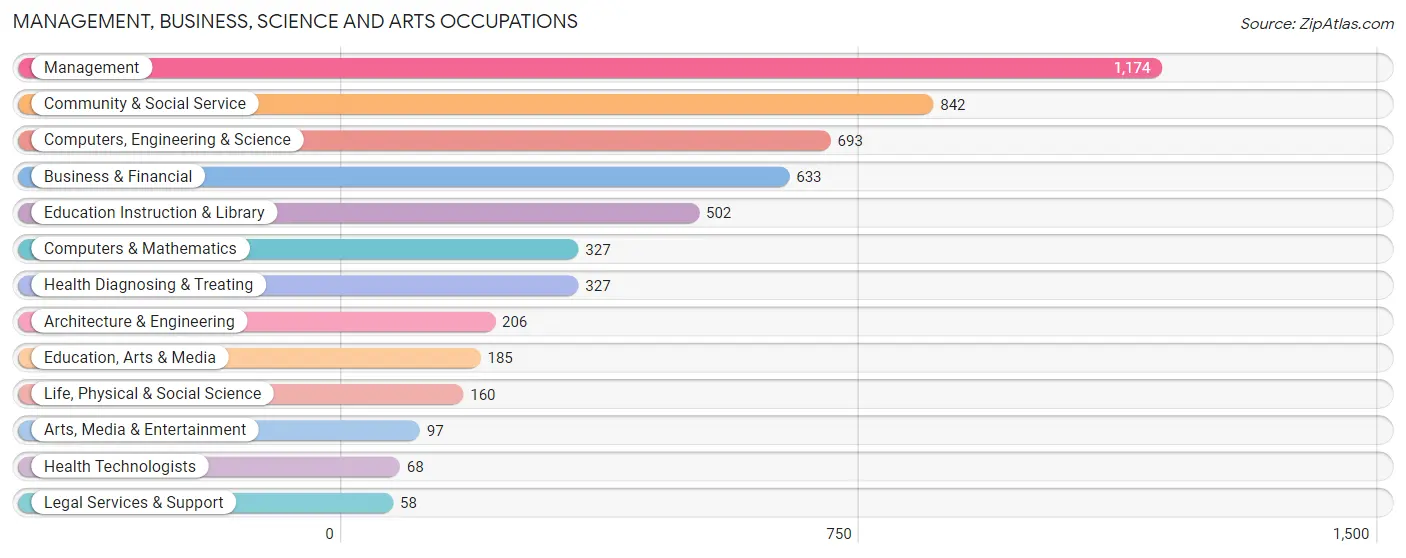
Management, Business, Science and Arts Occupations
The most common Management, Business, Science and Arts occupations in Lakeside are Management (1,174 | 12.5%), Community & Social Service (842 | 8.9%), Computers, Engineering & Science (693 | 7.4%), Business & Financial (633 | 6.7%), and Education Instruction & Library (502 | 5.3%).
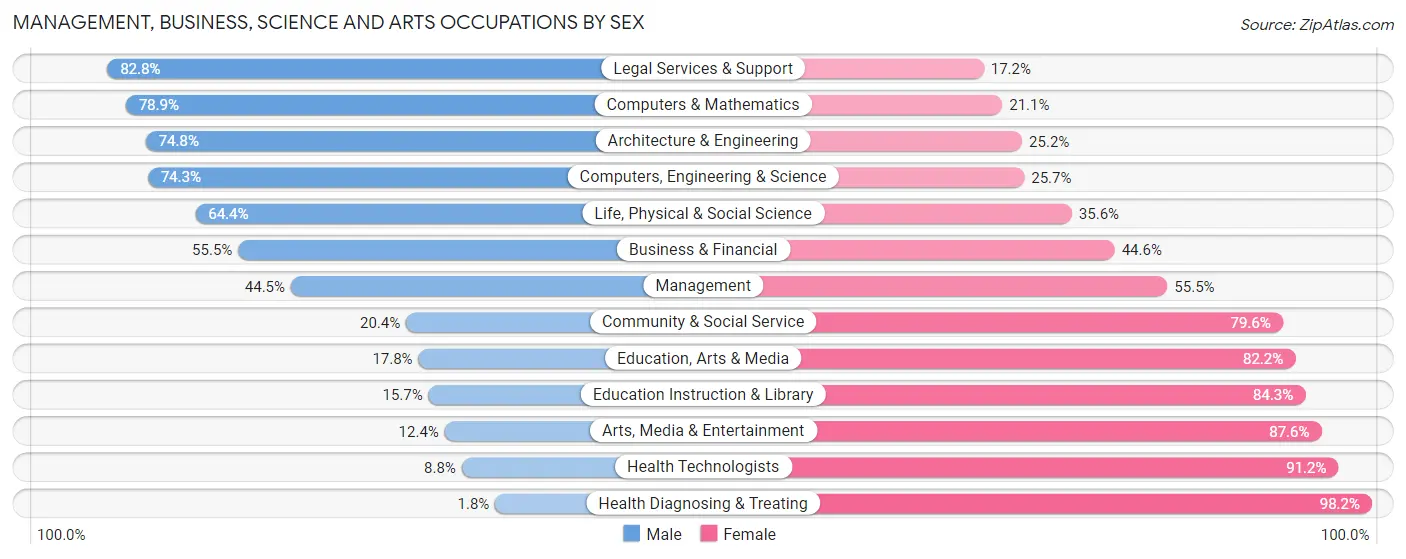
Management, Business, Science and Arts Occupations by Sex
Within the Management, Business, Science and Arts occupations in Lakeside, the most male-oriented occupations are Legal Services & Support (82.8%), Computers & Mathematics (78.9%), and Architecture & Engineering (74.8%), while the most female-oriented occupations are Health Diagnosing & Treating (98.2%), Health Technologists (91.2%), and Arts, Media & Entertainment (87.6%).
| Occupation | Male | Female |
| Management | 522 (44.5%) | 652 (55.5%) |
| Business & Financial | 351 (55.4%) | 282 (44.6%) |
| Computers, Engineering & Science | 515 (74.3%) | 178 (25.7%) |
| Computers & Mathematics | 258 (78.9%) | 69 (21.1%) |
| Architecture & Engineering | 154 (74.8%) | 52 (25.2%) |
| Life, Physical & Social Science | 103 (64.4%) | 57 (35.6%) |
| Community & Social Service | 172 (20.4%) | 670 (79.6%) |
| Education, Arts & Media | 33 (17.8%) | 152 (82.2%) |
| Legal Services & Support | 48 (82.8%) | 10 (17.2%) |
| Education Instruction & Library | 79 (15.7%) | 423 (84.3%) |
| Arts, Media & Entertainment | 12 (12.4%) | 85 (87.6%) |
| Health Diagnosing & Treating | 6 (1.8%) | 321 (98.2%) |
| Health Technologists | 6 (8.8%) | 62 (91.2%) |
| Total (Category) | 1,566 (42.7%) | 2,103 (57.3%) |
| Total (Overall) | 4,858 (51.6%) | 4,564 (48.4%) |
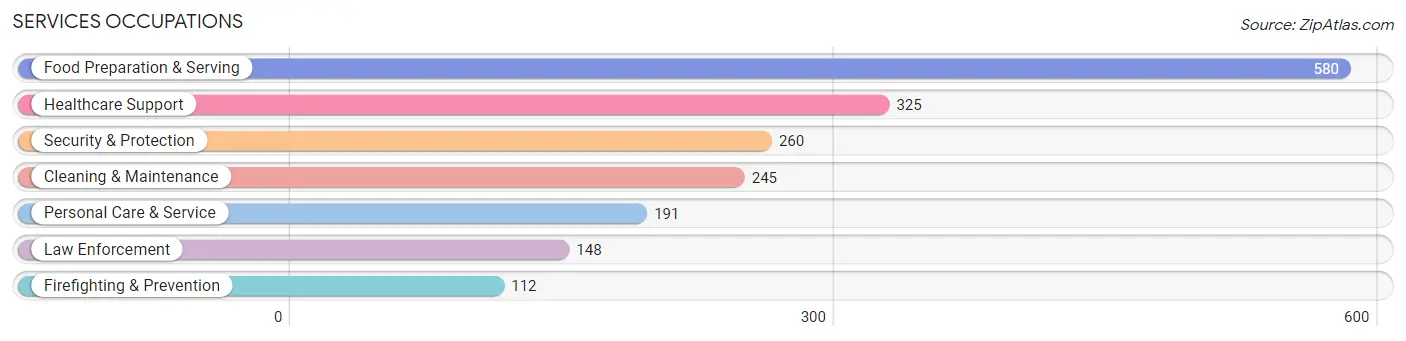
Services Occupations
The most common Services occupations in Lakeside are Food Preparation & Serving (580 | 6.2%), Healthcare Support (325 | 3.5%), Security & Protection (260 | 2.8%), Cleaning & Maintenance (245 | 2.6%), and Personal Care & Service (191 | 2.0%).
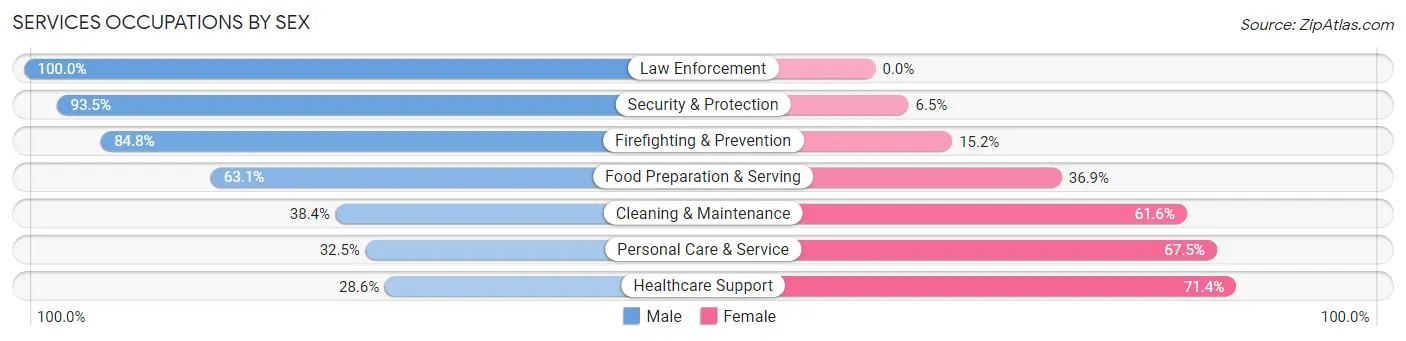
Services Occupations by Sex
Within the Services occupations in Lakeside, the most male-oriented occupations are Law Enforcement (100.0%), Security & Protection (93.5%), and Firefighting & Prevention (84.8%), while the most female-oriented occupations are Healthcare Support (71.4%), Personal Care & Service (67.5%), and Cleaning & Maintenance (61.6%).
| Occupation | Male | Female |
| Healthcare Support | 93 (28.6%) | 232 (71.4%) |
| Security & Protection | 243 (93.5%) | 17 (6.5%) |
| Firefighting & Prevention | 95 (84.8%) | 17 (15.2%) |
| Law Enforcement | 148 (100.0%) | 0 (0.0%) |
| Food Preparation & Serving | 366 (63.1%) | 214 (36.9%) |
| Cleaning & Maintenance | 94 (38.4%) | 151 (61.6%) |
| Personal Care & Service | 62 (32.5%) | 129 (67.5%) |
| Total (Category) | 858 (53.6%) | 743 (46.4%) |
| Total (Overall) | 4,858 (51.6%) | 4,564 (48.4%) |
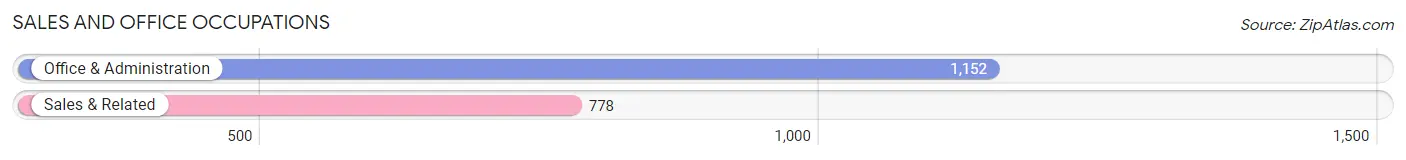
Sales and Office Occupations
The most common Sales and Office occupations in Lakeside are Office & Administration (1,152 | 12.2%), and Sales & Related (778 | 8.3%).
Sales and Office Occupations by Sex
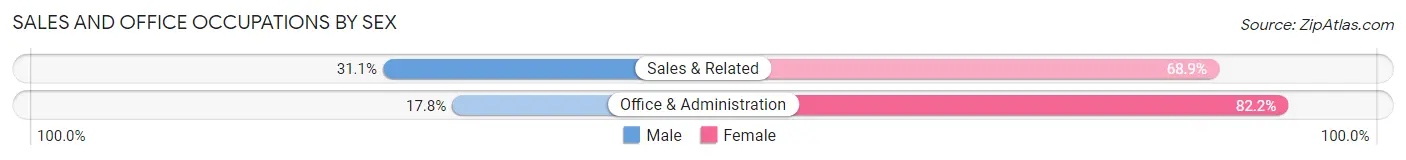
| Occupation | Male | Female |
| Sales & Related | 242 (31.1%) | 536 (68.9%) |
| Office & Administration | 205 (17.8%) | 947 (82.2%) |
| Total (Category) | 447 (23.2%) | 1,483 (76.8%) |
| Total (Overall) | 4,858 (51.6%) | 4,564 (48.4%) |
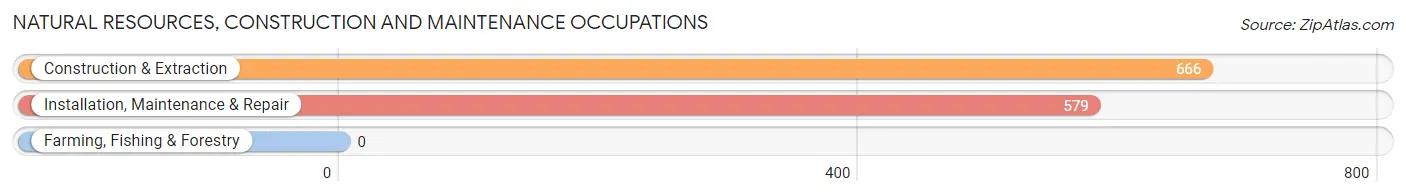
Natural Resources, Construction and Maintenance Occupations
The most common Natural Resources, Construction and Maintenance occupations in Lakeside are Construction & Extraction (666 | 7.1%), and Installation, Maintenance & Repair (579 | 6.1%).
Natural Resources, Construction and Maintenance Occupations by Sex
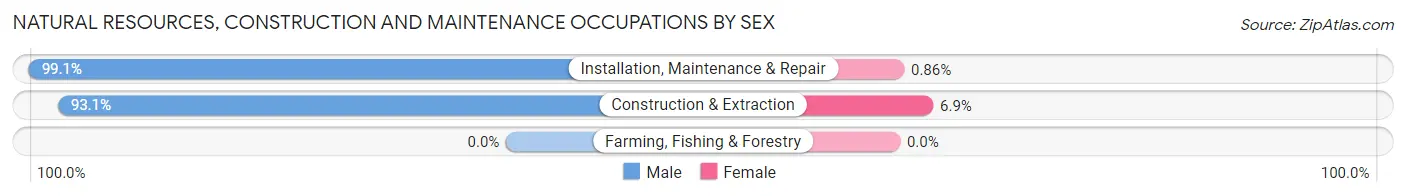
| Occupation | Male | Female |
| Farming, Fishing & Forestry | 0 (0.0%) | 0 (0.0%) |
| Construction & Extraction | 620 (93.1%) | 46 (6.9%) |
| Installation, Maintenance & Repair | 574 (99.1%) | 5 (0.9%) |
| Total (Category) | 1,194 (95.9%) | 51 (4.1%) |
| Total (Overall) | 4,858 (51.6%) | 4,564 (48.4%) |
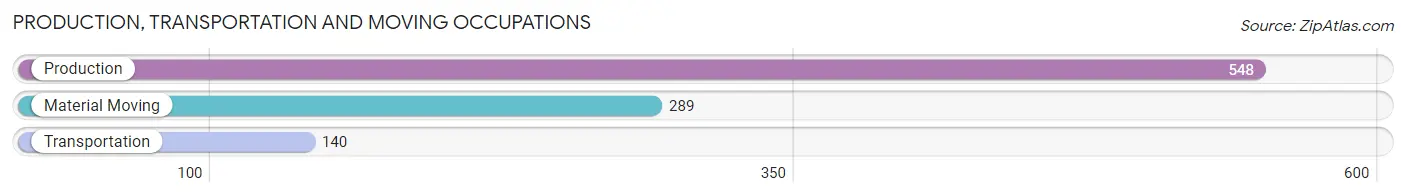
Production, Transportation and Moving Occupations
The most common Production, Transportation and Moving occupations in Lakeside are Production (548 | 5.8%), Material Moving (289 | 3.1%), and Transportation (140 | 1.5%).
Production, Transportation and Moving Occupations by Sex
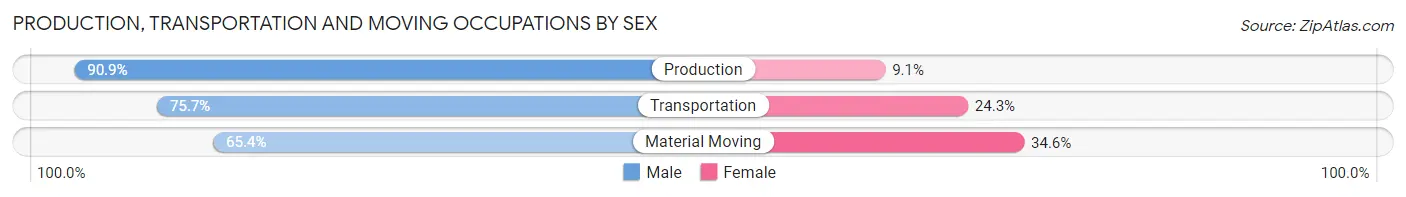
| Occupation | Male | Female |
| Production | 498 (90.9%) | 50 (9.1%) |
| Transportation | 106 (75.7%) | 34 (24.3%) |
| Material Moving | 189 (65.4%) | 100 (34.6%) |
| Total (Category) | 793 (81.2%) | 184 (18.8%) |
| Total (Overall) | 4,858 (51.6%) | 4,564 (48.4%) |
Employment Industries by Sex in Lakeside
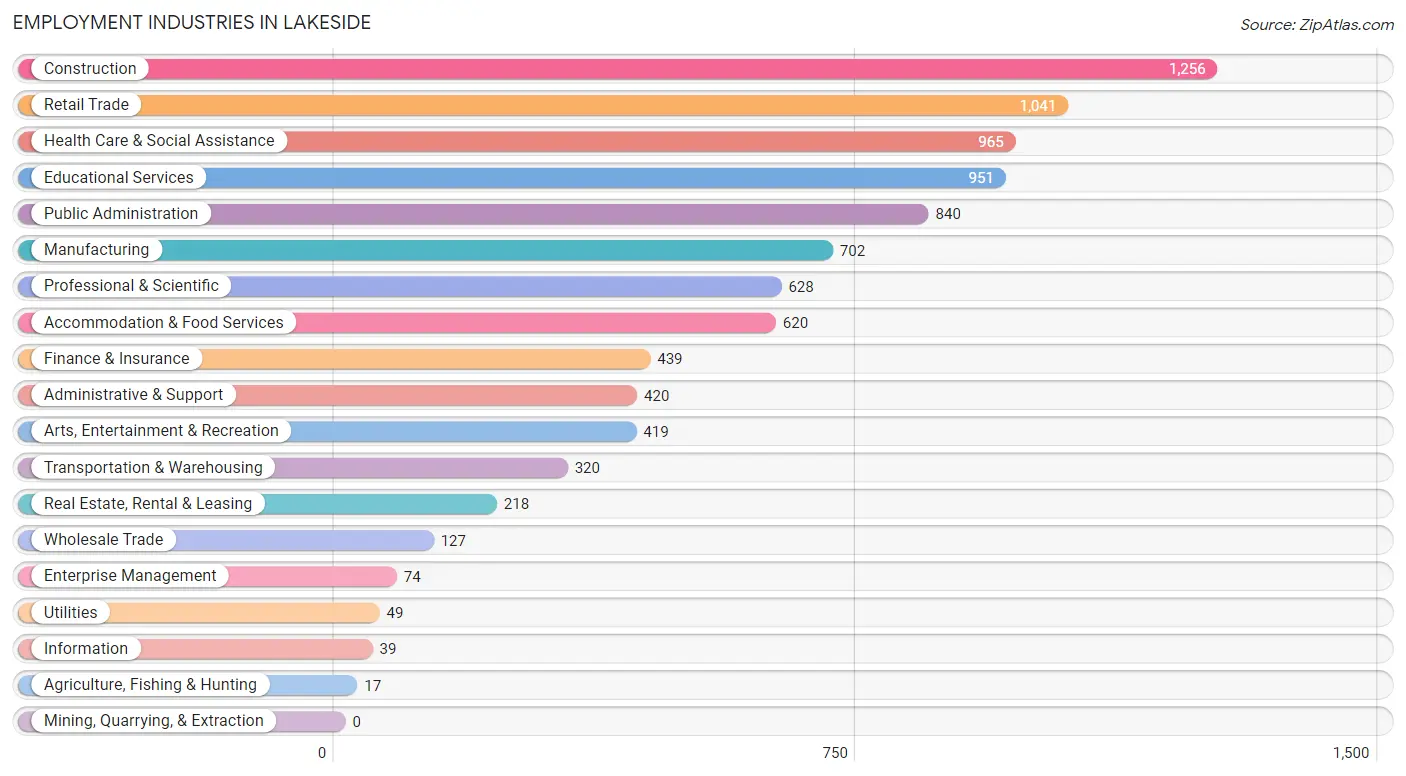
Employment Industries in Lakeside
The major employment industries in Lakeside include Construction (1,256 | 13.3%), Retail Trade (1,041 | 11.1%), Health Care & Social Assistance (965 | 10.2%), Educational Services (951 | 10.1%), and Public Administration (840 | 8.9%).
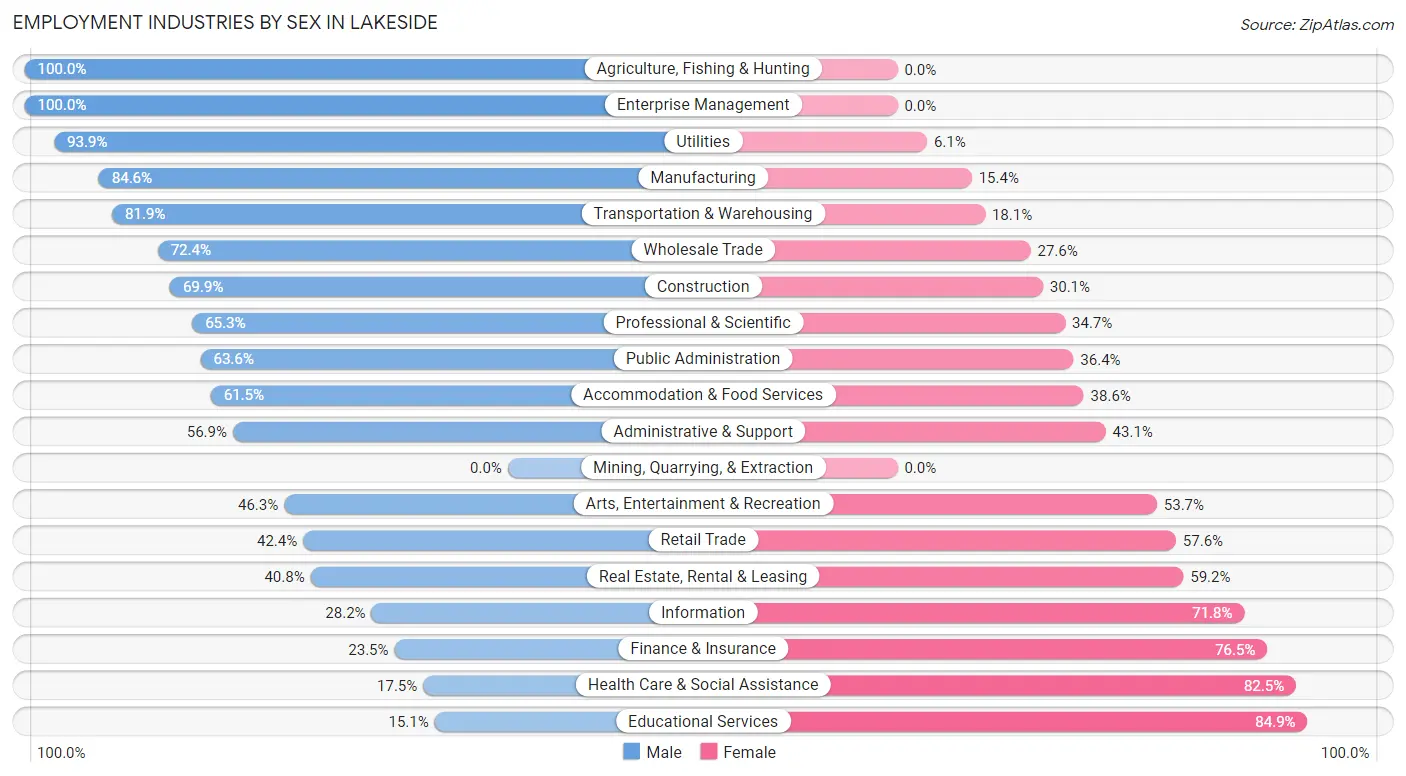
Employment Industries by Sex in Lakeside
The Lakeside industries that see more men than women are Agriculture, Fishing & Hunting (100.0%), Enterprise Management (100.0%), and Utilities (93.9%), whereas the industries that tend to have a higher number of women are Educational Services (84.9%), Health Care & Social Assistance (82.5%), and Finance & Insurance (76.5%).
| Industry | Male | Female |
| Agriculture, Fishing & Hunting | 17 (100.0%) | 0 (0.0%) |
| Mining, Quarrying, & Extraction | 0 (0.0%) | 0 (0.0%) |
| Construction | 878 (69.9%) | 378 (30.1%) |
| Manufacturing | 594 (84.6%) | 108 (15.4%) |
| Wholesale Trade | 92 (72.4%) | 35 (27.6%) |
| Retail Trade | 441 (42.4%) | 600 (57.6%) |
| Transportation & Warehousing | 262 (81.9%) | 58 (18.1%) |
| Utilities | 46 (93.9%) | 3 (6.1%) |
| Information | 11 (28.2%) | 28 (71.8%) |
| Finance & Insurance | 103 (23.5%) | 336 (76.5%) |
| Real Estate, Rental & Leasing | 89 (40.8%) | 129 (59.2%) |
| Professional & Scientific | 410 (65.3%) | 218 (34.7%) |
| Enterprise Management | 74 (100.0%) | 0 (0.0%) |
| Administrative & Support | 239 (56.9%) | 181 (43.1%) |
| Educational Services | 144 (15.1%) | 807 (84.9%) |
| Health Care & Social Assistance | 169 (17.5%) | 796 (82.5%) |
| Arts, Entertainment & Recreation | 194 (46.3%) | 225 (53.7%) |
| Accommodation & Food Services | 381 (61.5%) | 239 (38.6%) |
| Public Administration | 534 (63.6%) | 306 (36.4%) |
| Total | 4,858 (51.6%) | 4,564 (48.4%) |
Education in Lakeside
School Enrollment in Lakeside
The most common levels of schooling among the 5,273 students in Lakeside are high school (1,350 | 25.6%), college / undergraduate (1,137 | 21.6%), and middle school (1,052 | 20.0%).
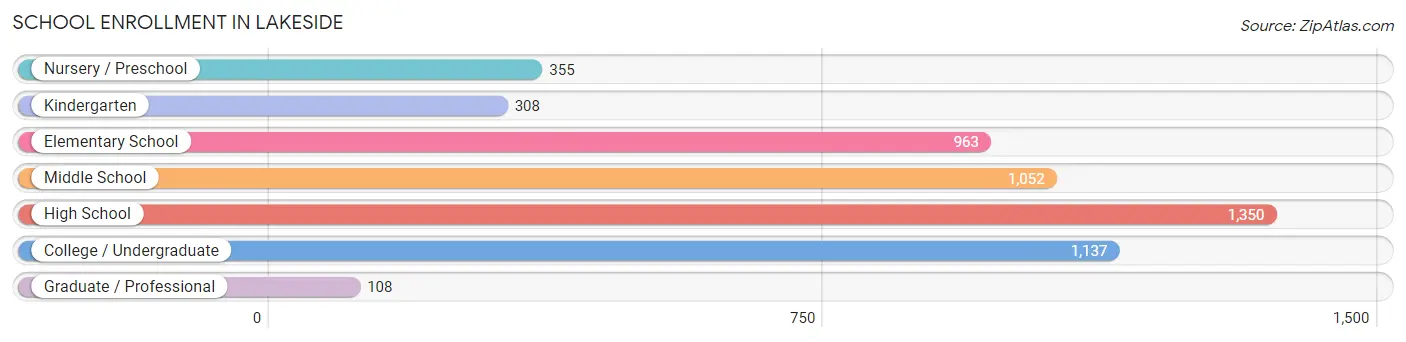
| School Level | # Students | % Students |
| Nursery / Preschool | 355 | 6.7% |
| Kindergarten | 308 | 5.8% |
| Elementary School | 963 | 18.3% |
| Middle School | 1,052 | 20.0% |
| High School | 1,350 | 25.6% |
| College / Undergraduate | 1,137 | 21.6% |
| Graduate / Professional | 108 | 2.1% |
| Total | 5,273 | 100.0% |
School Enrollment by Age by Funding Source in Lakeside
Out of a total of 5,273 students who are enrolled in schools in Lakeside, 596 (11.3%) attend a private institution, while the remaining 4,677 (88.7%) are enrolled in public schools. The age group of 3 to 4 year olds has the highest likelihood of being enrolled in private schools, with 123 (46.1% in the age bracket) enrolled. Conversely, the age group of 35 years and over has the lowest likelihood of being enrolled in a private school, with 255 (96.2% in the age bracket) attending a public institution.
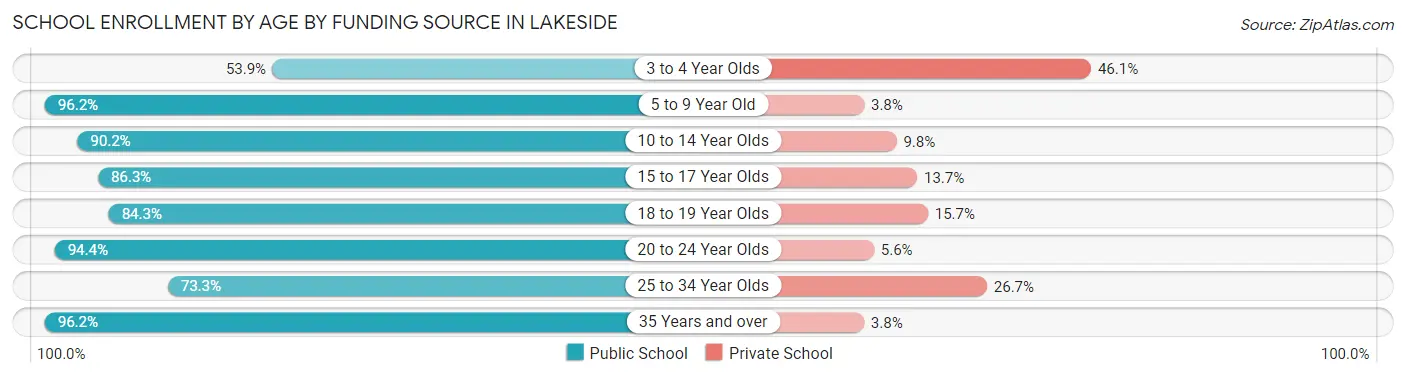
| Age Bracket | Public School | Private School |
| 3 to 4 Year Olds | 144 (53.9%) | 123 (46.1%) |
| 5 to 9 Year Old | 1,270 (96.2%) | 50 (3.8%) |
| 10 to 14 Year Olds | 1,209 (90.2%) | 132 (9.8%) |
| 15 to 17 Year Olds | 682 (86.3%) | 108 (13.7%) |
| 18 to 19 Year Olds | 393 (84.3%) | 73 (15.7%) |
| 20 to 24 Year Olds | 537 (94.4%) | 32 (5.6%) |
| 25 to 34 Year Olds | 187 (73.3%) | 68 (26.7%) |
| 35 Years and over | 255 (96.2%) | 10 (3.8%) |
| Total | 4,677 (88.7%) | 596 (11.3%) |
Educational Attainment by Field of Study in Lakeside
Business (830 | 22.4%), education (392 | 10.6%), liberal arts & history (391 | 10.5%), psychology (309 | 8.3%), and arts & humanities (295 | 8.0%) are the most common fields of study among 3,708 individuals in Lakeside who have obtained a bachelor's degree or higher.
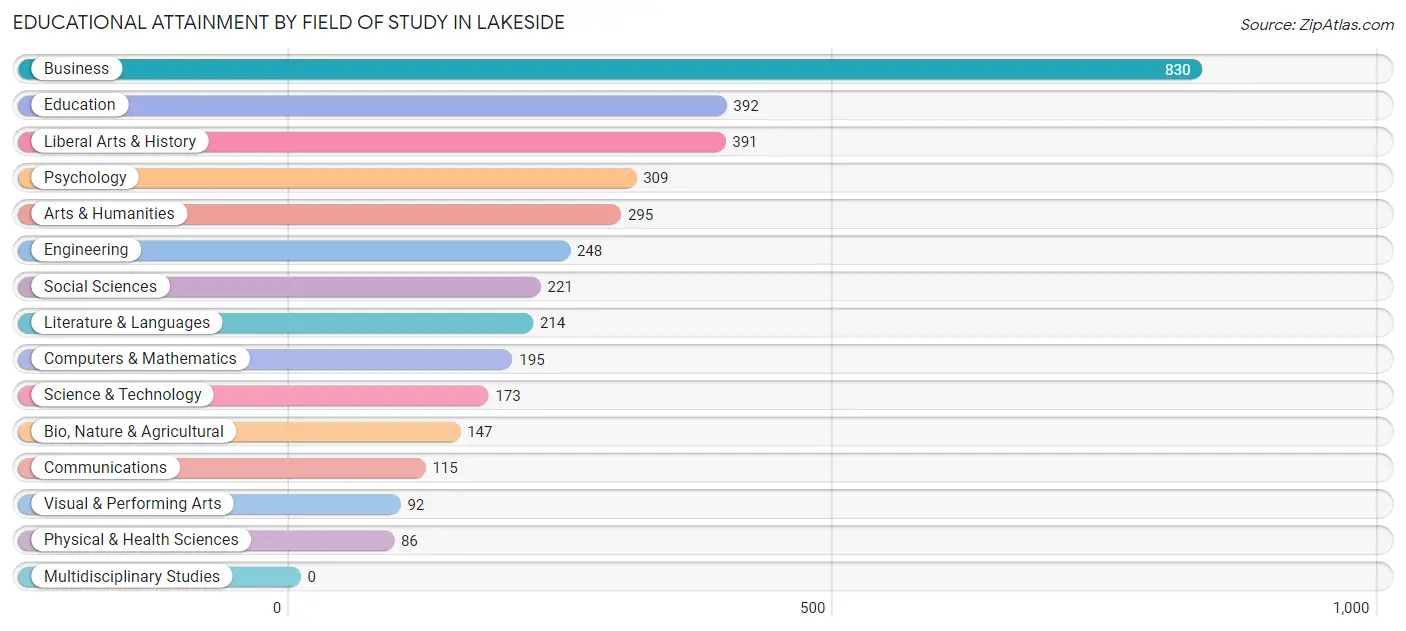
| Field of Study | # Graduates | % Graduates |
| Computers & Mathematics | 195 | 5.3% |
| Bio, Nature & Agricultural | 147 | 4.0% |
| Physical & Health Sciences | 86 | 2.3% |
| Psychology | 309 | 8.3% |
| Social Sciences | 221 | 6.0% |
| Engineering | 248 | 6.7% |
| Multidisciplinary Studies | 0 | 0.0% |
| Science & Technology | 173 | 4.7% |
| Business | 830 | 22.4% |
| Education | 392 | 10.6% |
| Literature & Languages | 214 | 5.8% |
| Liberal Arts & History | 391 | 10.5% |
| Visual & Performing Arts | 92 | 2.5% |
| Communications | 115 | 3.1% |
| Arts & Humanities | 295 | 8.0% |
| Total | 3,708 | 100.0% |
Transportation & Commute in Lakeside
Vehicle Availability by Sex in Lakeside
The most prevalent vehicle ownership categories in Lakeside are males with 2 vehicles (1,758, accounting for 36.3%) and females with 2 vehicles (1,636, making up 40.1%).
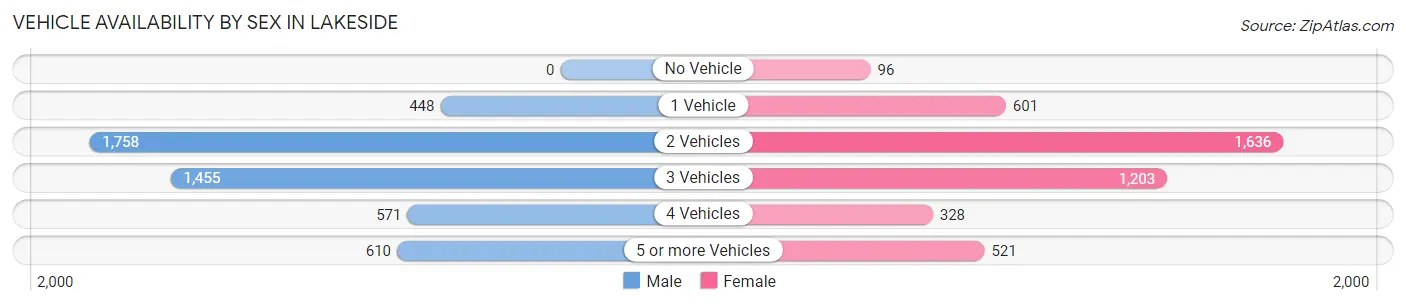
| Vehicles Available | Male | Female |
| No Vehicle | 0 (0.0%) | 96 (2.2%) |
| 1 Vehicle | 448 (9.2%) | 601 (13.7%) |
| 2 Vehicles | 1,758 (36.3%) | 1,636 (37.3%) |
| 3 Vehicles | 1,455 (30.0%) | 1,203 (27.4%) |
| 4 Vehicles | 571 (11.8%) | 328 (7.5%) |
| 5 or more Vehicles | 610 (12.6%) | 521 (11.9%) |
| Total | 4,842 (100.0%) | 4,385 (100.0%) |
Commute Time in Lakeside
The most frequently occuring commute durations in Lakeside are 15 to 19 minutes (1,586 commuters, 19.7%), 30 to 34 minutes (1,226 commuters, 15.2%), and 20 to 24 minutes (1,125 commuters, 14.0%).
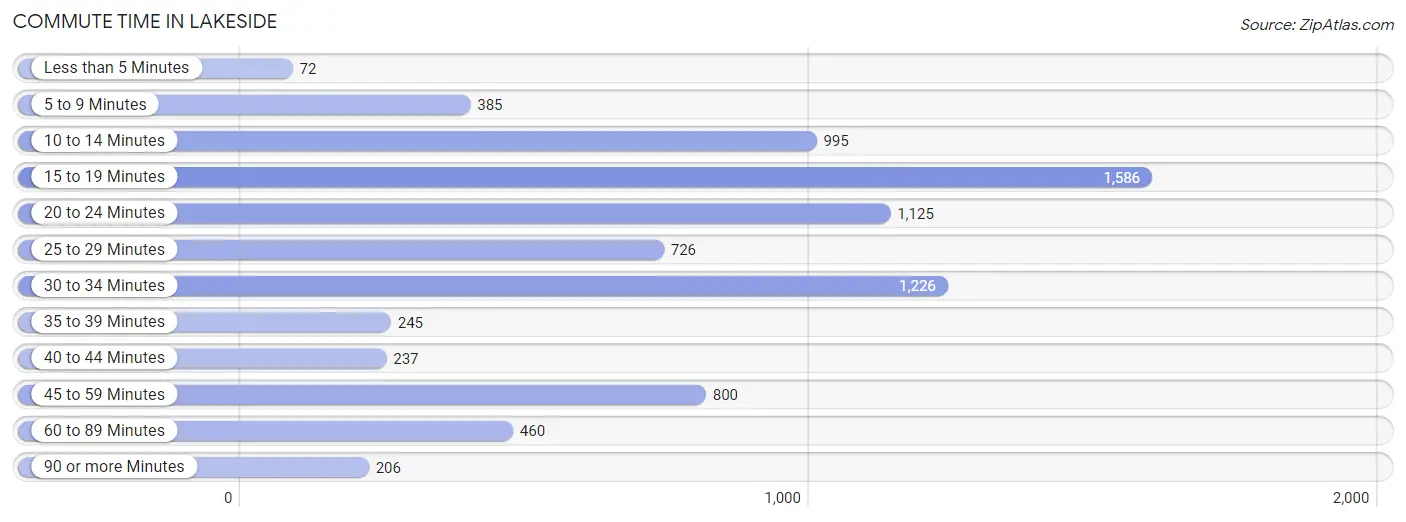
| Commute Time | # Commuters | % Commuters |
| Less than 5 Minutes | 72 | 0.9% |
| 5 to 9 Minutes | 385 | 4.8% |
| 10 to 14 Minutes | 995 | 12.3% |
| 15 to 19 Minutes | 1,586 | 19.7% |
| 20 to 24 Minutes | 1,125 | 14.0% |
| 25 to 29 Minutes | 726 | 9.0% |
| 30 to 34 Minutes | 1,226 | 15.2% |
| 35 to 39 Minutes | 245 | 3.0% |
| 40 to 44 Minutes | 237 | 2.9% |
| 45 to 59 Minutes | 800 | 9.9% |
| 60 to 89 Minutes | 460 | 5.7% |
| 90 or more Minutes | 206 | 2.5% |
Commute Time by Sex in Lakeside
The most common commute times in Lakeside are 15 to 19 minutes (1,042 commuters, 24.0%) for males and 10 to 14 minutes (605 commuters, 16.2%) for females.
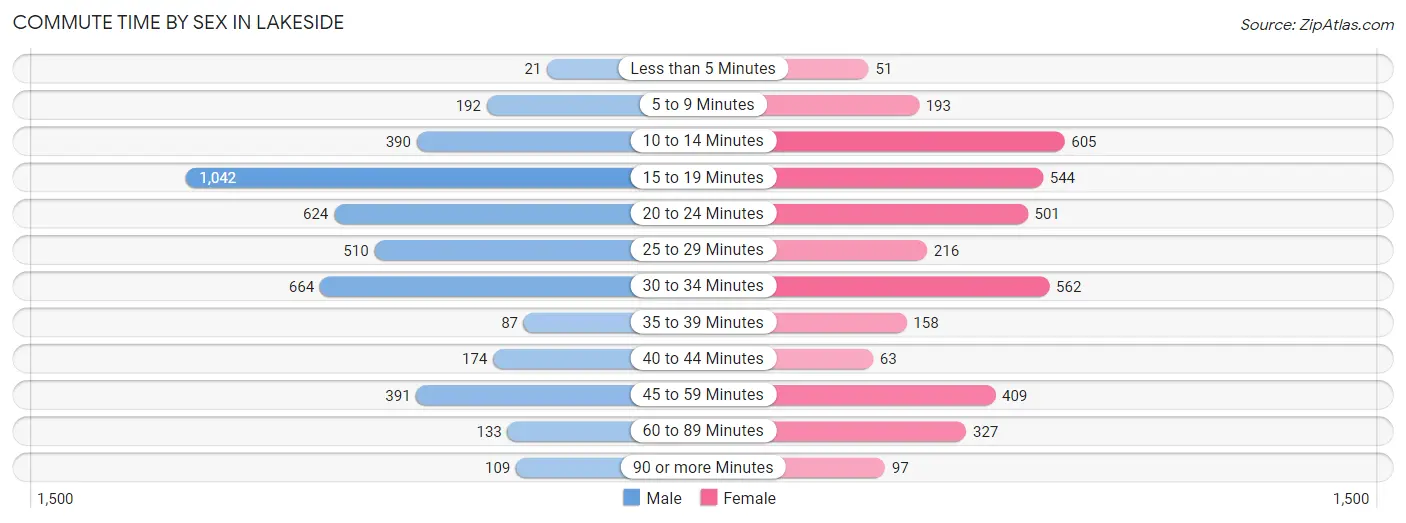
| Commute Time | Male | Female |
| Less than 5 Minutes | 21 (0.5%) | 51 (1.4%) |
| 5 to 9 Minutes | 192 (4.4%) | 193 (5.2%) |
| 10 to 14 Minutes | 390 (9.0%) | 605 (16.2%) |
| 15 to 19 Minutes | 1,042 (24.0%) | 544 (14.6%) |
| 20 to 24 Minutes | 624 (14.4%) | 501 (13.5%) |
| 25 to 29 Minutes | 510 (11.8%) | 216 (5.8%) |
| 30 to 34 Minutes | 664 (15.3%) | 562 (15.1%) |
| 35 to 39 Minutes | 87 (2.0%) | 158 (4.2%) |
| 40 to 44 Minutes | 174 (4.0%) | 63 (1.7%) |
| 45 to 59 Minutes | 391 (9.0%) | 409 (11.0%) |
| 60 to 89 Minutes | 133 (3.1%) | 327 (8.8%) |
| 90 or more Minutes | 109 (2.5%) | 97 (2.6%) |
Time of Departure to Work by Sex in Lakeside
The most frequent times of departure to work in Lakeside are 6:00 AM to 6:29 AM (700, 16.1%) for males and 6:30 AM to 6:59 AM (574, 15.4%) for females.
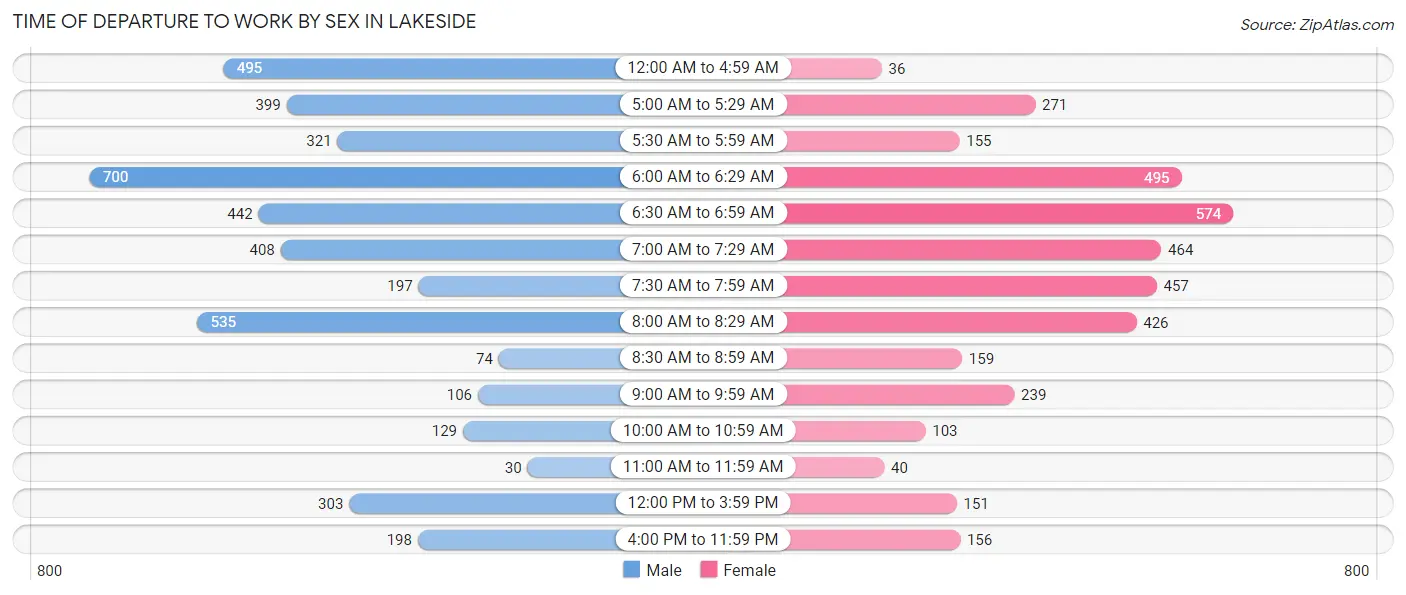
| Time of Departure | Male | Female |
| 12:00 AM to 4:59 AM | 495 (11.4%) | 36 (1.0%) |
| 5:00 AM to 5:29 AM | 399 (9.2%) | 271 (7.3%) |
| 5:30 AM to 5:59 AM | 321 (7.4%) | 155 (4.2%) |
| 6:00 AM to 6:29 AM | 700 (16.1%) | 495 (13.3%) |
| 6:30 AM to 6:59 AM | 442 (10.2%) | 574 (15.4%) |
| 7:00 AM to 7:29 AM | 408 (9.4%) | 464 (12.4%) |
| 7:30 AM to 7:59 AM | 197 (4.5%) | 457 (12.3%) |
| 8:00 AM to 8:29 AM | 535 (12.3%) | 426 (11.4%) |
| 8:30 AM to 8:59 AM | 74 (1.7%) | 159 (4.3%) |
| 9:00 AM to 9:59 AM | 106 (2.4%) | 239 (6.4%) |
| 10:00 AM to 10:59 AM | 129 (3.0%) | 103 (2.8%) |
| 11:00 AM to 11:59 AM | 30 (0.7%) | 40 (1.1%) |
| 12:00 PM to 3:59 PM | 303 (7.0%) | 151 (4.1%) |
| 4:00 PM to 11:59 PM | 198 (4.6%) | 156 (4.2%) |
| Total | 4,337 (100.0%) | 3,726 (100.0%) |
Housing Occupancy in Lakeside
Occupancy by Ownership in Lakeside
Of the total 383 dwellings in Lakeside, owner-occupied units account for 288 (75.2%), while renter-occupied units make up 95 (24.8%).
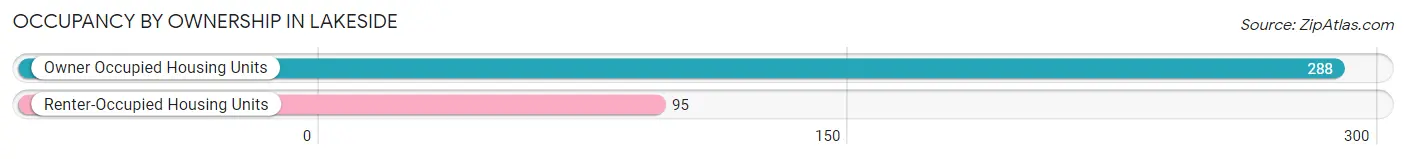
| Occupancy | # Housing Units | % Housing Units |
| Owner Occupied Housing Units | 288 | 75.2% |
| Renter-Occupied Housing Units | 95 | 24.8% |
| Total Occupied Housing Units | 383 | 100.0% |
Occupancy by Household Size in Lakeside
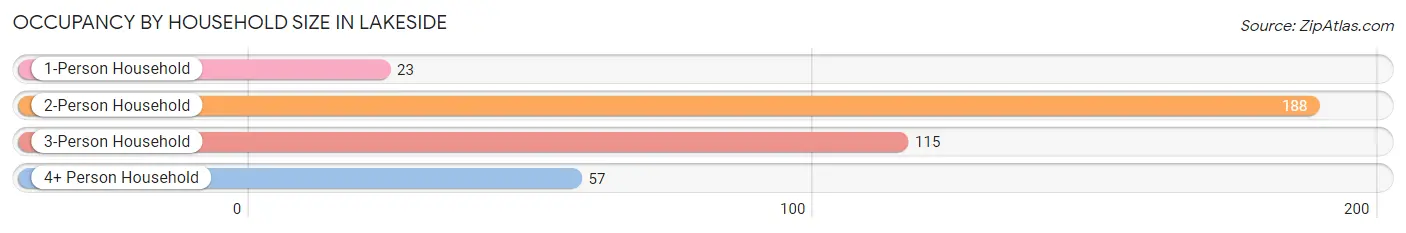
| Household Size | # Housing Units | % Housing Units |
| 1-Person Household | 23 | 6.0% |
| 2-Person Household | 188 | 49.1% |
| 3-Person Household | 115 | 30.0% |
| 4+ Person Household | 57 | 14.9% |
| Total Housing Units | 383 | 100.0% |
Occupancy by Ownership by Household Size in Lakeside
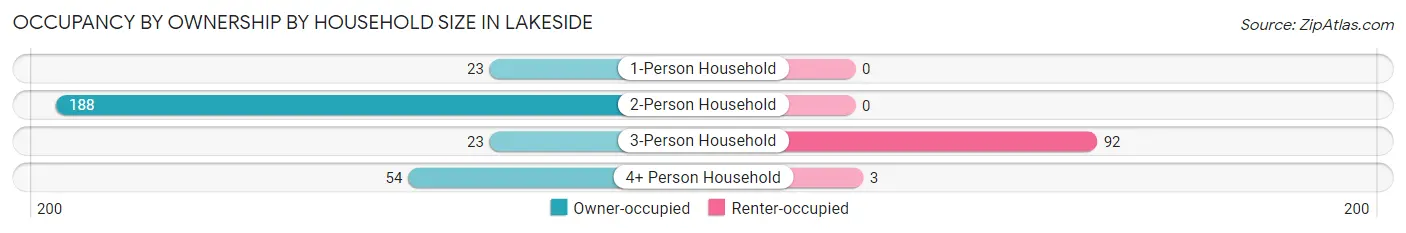
| Household Size | Owner-occupied | Renter-occupied |
| 1-Person Household | 23 (100.0%) | 0 (0.0%) |
| 2-Person Household | 188 (100.0%) | 0 (0.0%) |
| 3-Person Household | 23 (20.0%) | 92 (80.0%) |
| 4+ Person Household | 54 (94.7%) | 3 (5.3%) |
| Total Housing Units | 288 (75.2%) | 95 (24.8%) |
Occupancy by Educational Attainment in Lakeside
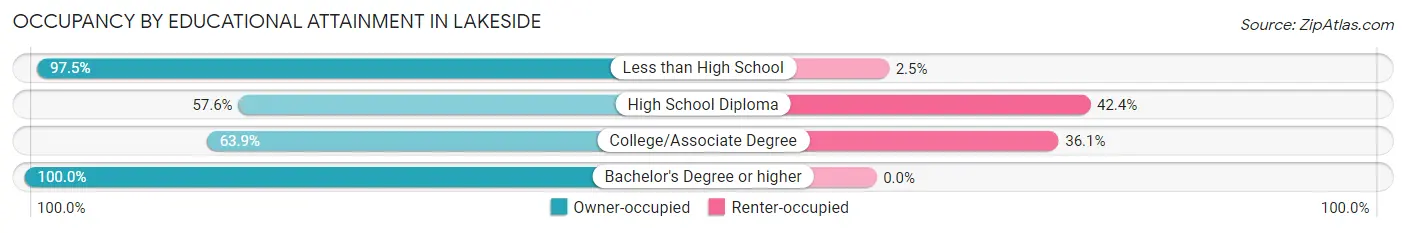
| Household Size | Owner-occupied | Renter-occupied |
| Less than High School | 118 (97.5%) | 3 (2.5%) |
| High School Diploma | 72 (57.6%) | 53 (42.4%) |
| College/Associate Degree | 69 (63.9%) | 39 (36.1%) |
| Bachelor's Degree or higher | 29 (100.0%) | 0 (0.0%) |
Occupancy by Age of Householder in Lakeside
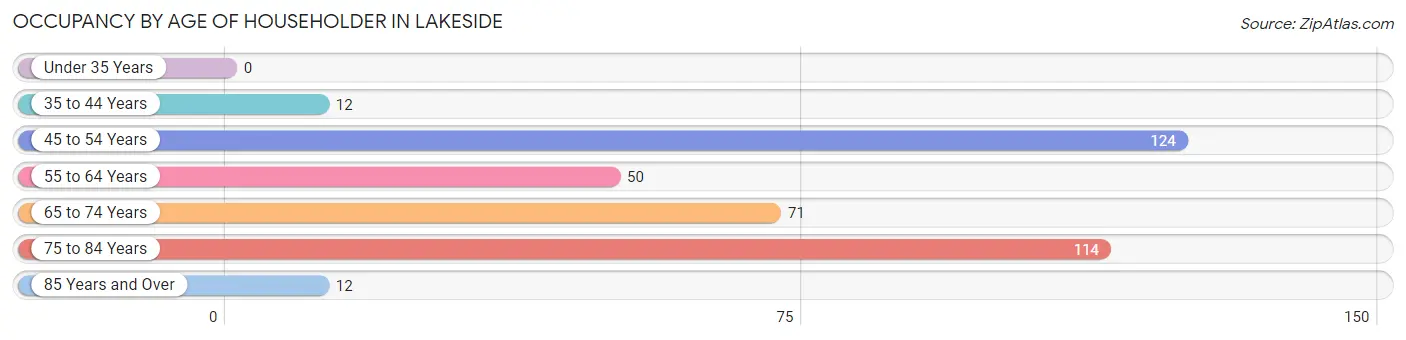
| Age Bracket | # Households | % Households |
| Under 35 Years | 0 | 0.0% |
| 35 to 44 Years | 12 | 3.1% |
| 45 to 54 Years | 124 | 32.4% |
| 55 to 64 Years | 50 | 13.1% |
| 65 to 74 Years | 71 | 18.5% |
| 75 to 84 Years | 114 | 29.8% |
| 85 Years and Over | 12 | 3.1% |
| Total | 383 | 100.0% |
Housing Finances in Lakeside
Median Income by Occupancy in Lakeside
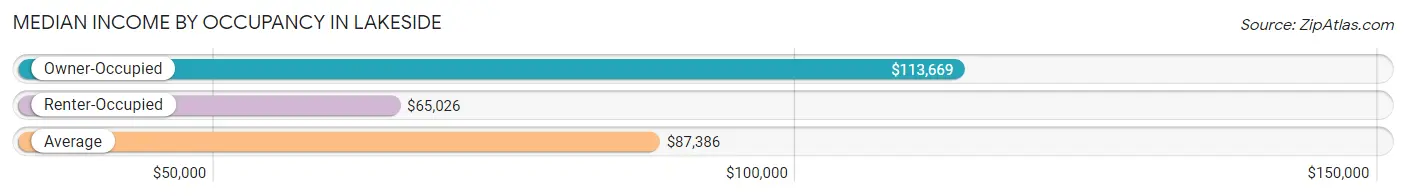
| Occupancy Type | # Households | Median Income |
| Owner-Occupied | 5,020 (69.3%) | $113,669 |
| Renter-Occupied | 2,224 (30.7%) | $65,026 |
| Average | 7,244 (100.0%) | $87,386 |
Occupancy by Householder Income Bracket in Lakeside
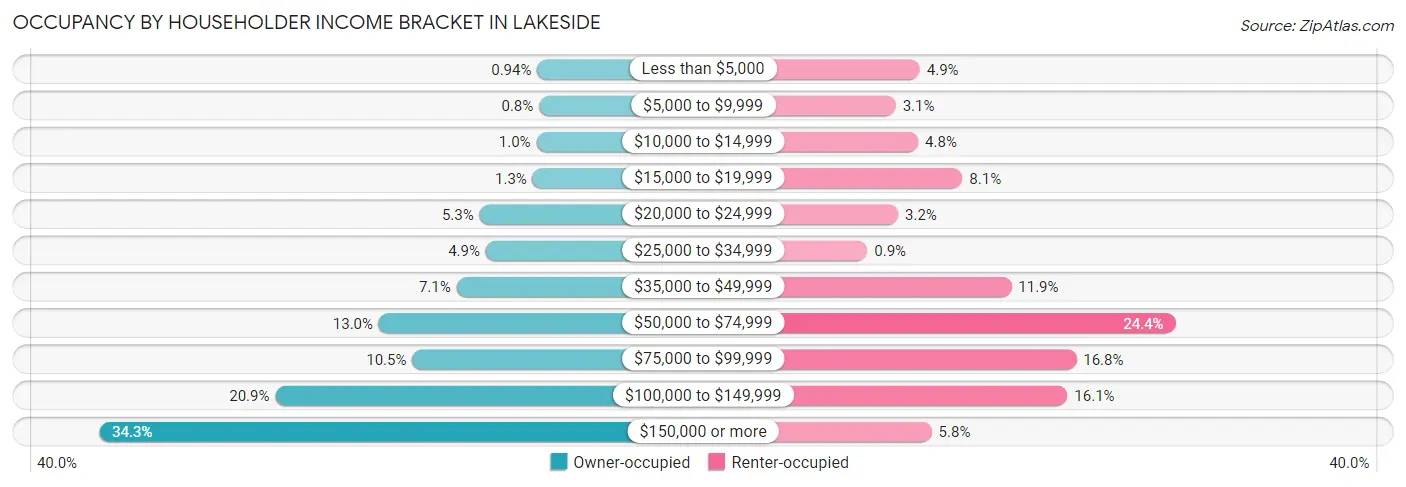
| Income Bracket | Owner-occupied | Renter-occupied |
| Less than $5,000 | 47 (0.9%) | 109 (4.9%) |
| $5,000 to $9,999 | 40 (0.8%) | 68 (3.1%) |
| $10,000 to $14,999 | 50 (1.0%) | 106 (4.8%) |
| $15,000 to $19,999 | 65 (1.3%) | 181 (8.1%) |
| $20,000 to $24,999 | 268 (5.3%) | 72 (3.2%) |
| $25,000 to $34,999 | 244 (4.9%) | 20 (0.9%) |
| $35,000 to $49,999 | 356 (7.1%) | 264 (11.9%) |
| $50,000 to $74,999 | 653 (13.0%) | 542 (24.4%) |
| $75,000 to $99,999 | 525 (10.5%) | 374 (16.8%) |
| $100,000 to $149,999 | 1,049 (20.9%) | 359 (16.1%) |
| $150,000 or more | 1,723 (34.3%) | 129 (5.8%) |
| Total | 5,020 (100.0%) | 2,224 (100.0%) |
Monthly Housing Cost Tiers in Lakeside
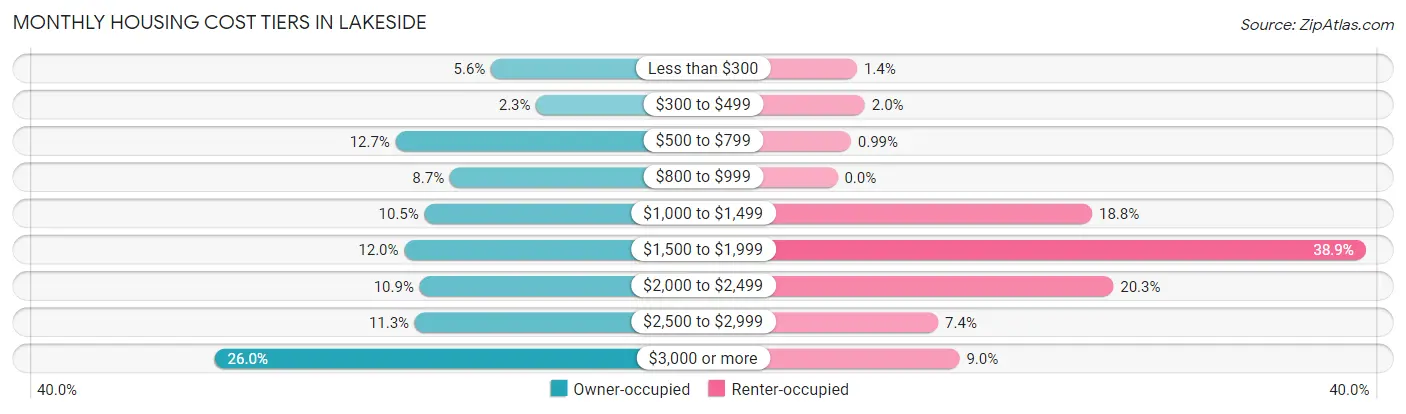
| Monthly Cost | Owner-occupied | Renter-occupied |
| Less than $300 | 283 (5.6%) | 32 (1.4%) |
| $300 to $499 | 116 (2.3%) | 45 (2.0%) |
| $500 to $799 | 636 (12.7%) | 22 (1.0%) |
| $800 to $999 | 435 (8.7%) | 0 (0.0%) |
| $1,000 to $1,499 | 529 (10.5%) | 417 (18.8%) |
| $1,500 to $1,999 | 604 (12.0%) | 865 (38.9%) |
| $2,000 to $2,499 | 547 (10.9%) | 452 (20.3%) |
| $2,500 to $2,999 | 565 (11.3%) | 165 (7.4%) |
| $3,000 or more | 1,305 (26.0%) | 200 (9.0%) |
| Total | 5,020 (100.0%) | 2,224 (100.0%) |
Physical Housing Characteristics in Lakeside
Housing Structures in Lakeside
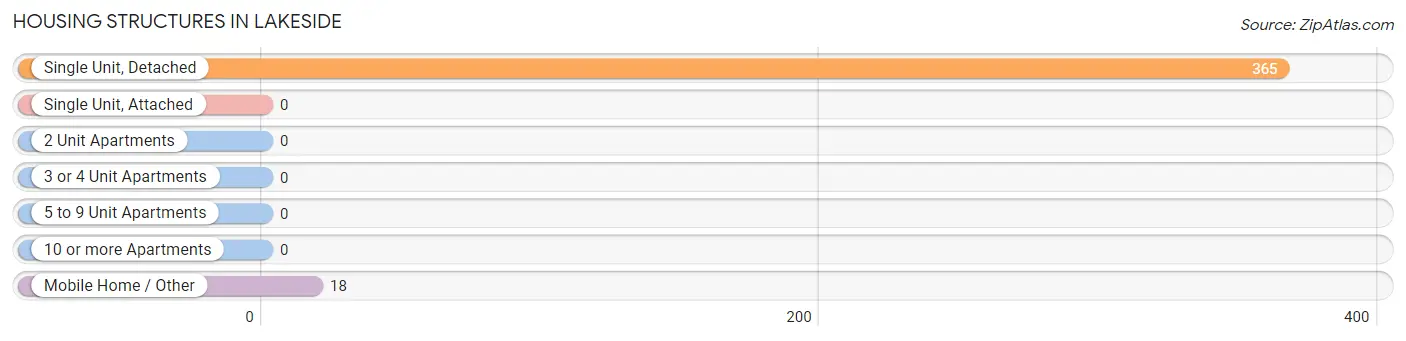
| Structure Type | # Housing Units | % Housing Units |
| Single Unit, Detached | 365 | 95.3% |
| Single Unit, Attached | 0 | 0.0% |
| 2 Unit Apartments | 0 | 0.0% |
| 3 or 4 Unit Apartments | 0 | 0.0% |
| 5 to 9 Unit Apartments | 0 | 0.0% |
| 10 or more Apartments | 0 | 0.0% |
| Mobile Home / Other | 18 | 4.7% |
| Total | 383 | 100.0% |
Housing Structures by Occupancy in Lakeside
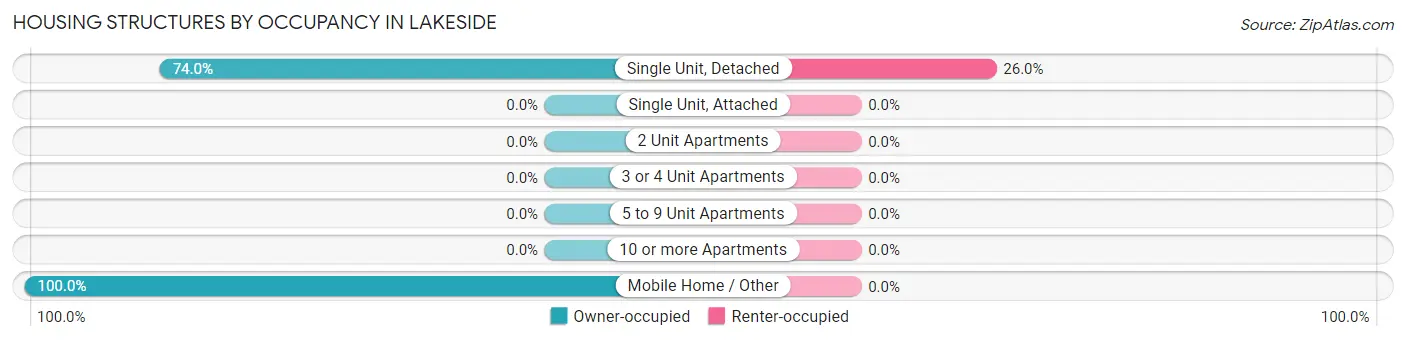
| Structure Type | Owner-occupied | Renter-occupied |
| Single Unit, Detached | 270 (74.0%) | 95 (26.0%) |
| Single Unit, Attached | 0 (0.0%) | 0 (0.0%) |
| 2 Unit Apartments | 0 (0.0%) | 0 (0.0%) |
| 3 or 4 Unit Apartments | 0 (0.0%) | 0 (0.0%) |
| 5 to 9 Unit Apartments | 0 (0.0%) | 0 (0.0%) |
| 10 or more Apartments | 0 (0.0%) | 0 (0.0%) |
| Mobile Home / Other | 18 (100.0%) | 0 (0.0%) |
| Total | 288 (75.2%) | 95 (24.8%) |
Housing Structures by Number of Rooms in Lakeside
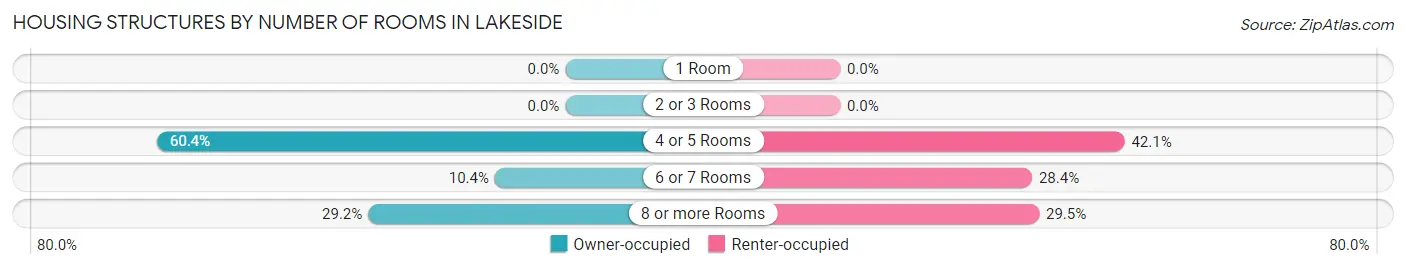
| Number of Rooms | Owner-occupied | Renter-occupied |
| 1 Room | 0 (0.0%) | 0 (0.0%) |
| 2 or 3 Rooms | 0 (0.0%) | 0 (0.0%) |
| 4 or 5 Rooms | 174 (60.4%) | 40 (42.1%) |
| 6 or 7 Rooms | 30 (10.4%) | 27 (28.4%) |
| 8 or more Rooms | 84 (29.2%) | 28 (29.5%) |
| Total | 288 (100.0%) | 95 (100.0%) |
Housing Structure by Heating Type in Lakeside
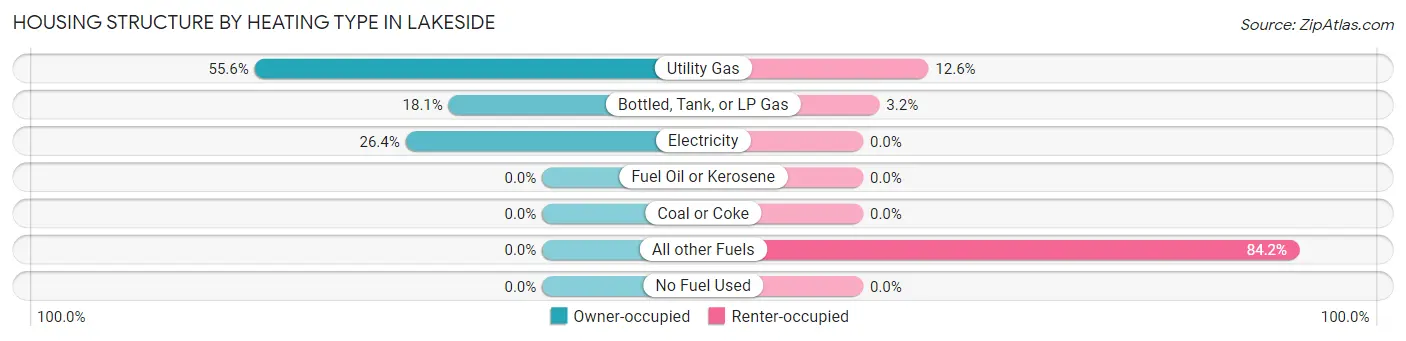
| Heating Type | Owner-occupied | Renter-occupied |
| Utility Gas | 160 (55.6%) | 12 (12.6%) |
| Bottled, Tank, or LP Gas | 52 (18.1%) | 3 (3.2%) |
| Electricity | 76 (26.4%) | 0 (0.0%) |
| Fuel Oil or Kerosene | 0 (0.0%) | 0 (0.0%) |
| Coal or Coke | 0 (0.0%) | 0 (0.0%) |
| All other Fuels | 0 (0.0%) | 80 (84.2%) |
| No Fuel Used | 0 (0.0%) | 0 (0.0%) |
| Total | 288 (100.0%) | 95 (100.0%) |
Household Vehicle Usage in Lakeside
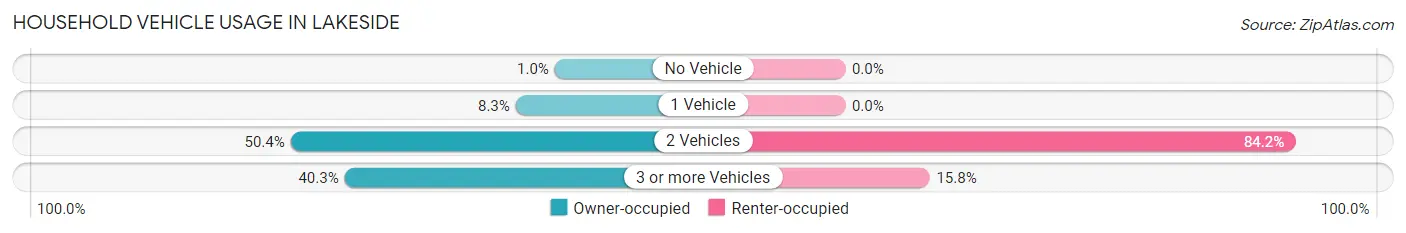
| Vehicles per Household | Owner-occupied | Renter-occupied |
| No Vehicle | 3 (1.0%) | 0 (0.0%) |
| 1 Vehicle | 24 (8.3%) | 0 (0.0%) |
| 2 Vehicles | 145 (50.3%) | 80 (84.2%) |
| 3 or more Vehicles | 116 (40.3%) | 15 (15.8%) |
| Total | 288 (100.0%) | 95 (100.0%) |
Real Estate & Mortgages in Lakeside
Real Estate and Mortgage Overview in Lakeside
| Characteristic | Without Mortgage | With Mortgage |
| Housing Units | 1,864 | 3,156 |
| Median Property Value | $307,400 | $617,200 |
| Median Household Income | $63,480 | $1,512 |
| Monthly Housing Costs | $777 | $1,286 |
| Real Estate Taxes | $2,507 | $199 |
Property Value by Mortgage Status in Lakeside
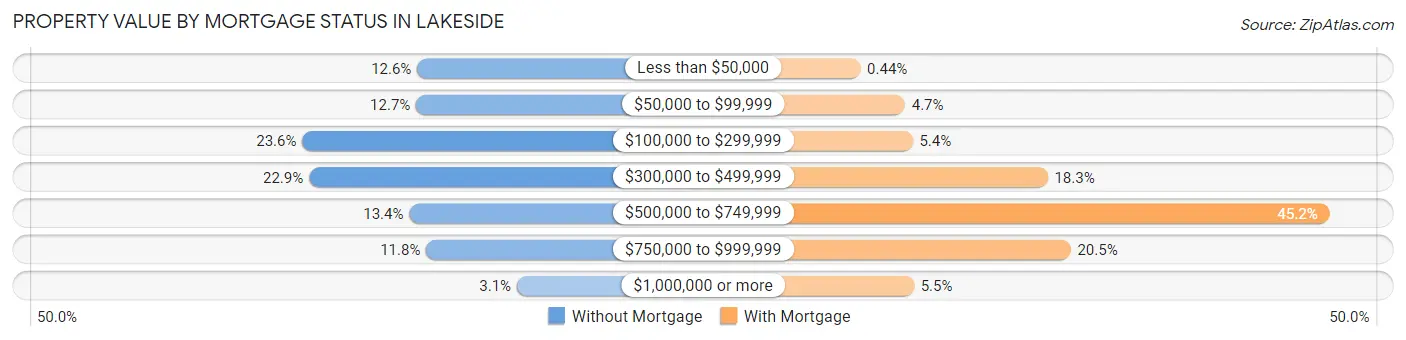
| Property Value | Without Mortgage | With Mortgage |
| Less than $50,000 | 235 (12.6%) | 14 (0.4%) |
| $50,000 to $99,999 | 237 (12.7%) | 148 (4.7%) |
| $100,000 to $299,999 | 439 (23.5%) | 171 (5.4%) |
| $300,000 to $499,999 | 427 (22.9%) | 577 (18.3%) |
| $500,000 to $749,999 | 249 (13.4%) | 1,425 (45.2%) |
| $750,000 to $999,999 | 219 (11.7%) | 646 (20.5%) |
| $1,000,000 or more | 58 (3.1%) | 175 (5.5%) |
| Total | 1,864 (100.0%) | 3,156 (100.0%) |
Household Income by Mortgage Status in Lakeside
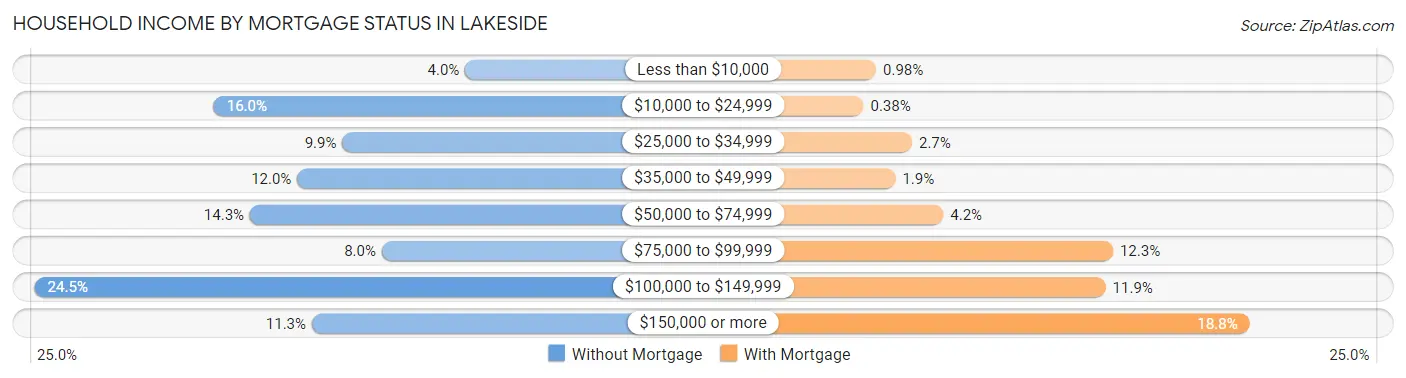
| Household Income | Without Mortgage | With Mortgage |
| Less than $10,000 | 75 (4.0%) | 31 (1.0%) |
| $10,000 to $24,999 | 298 (16.0%) | 12 (0.4%) |
| $25,000 to $34,999 | 184 (9.9%) | 85 (2.7%) |
| $35,000 to $49,999 | 224 (12.0%) | 60 (1.9%) |
| $50,000 to $74,999 | 266 (14.3%) | 132 (4.2%) |
| $75,000 to $99,999 | 149 (8.0%) | 387 (12.3%) |
| $100,000 to $149,999 | 457 (24.5%) | 376 (11.9%) |
| $150,000 or more | 211 (11.3%) | 592 (18.8%) |
| Total | 1,864 (100.0%) | 3,156 (100.0%) |
Property Value to Household Income Ratio in Lakeside
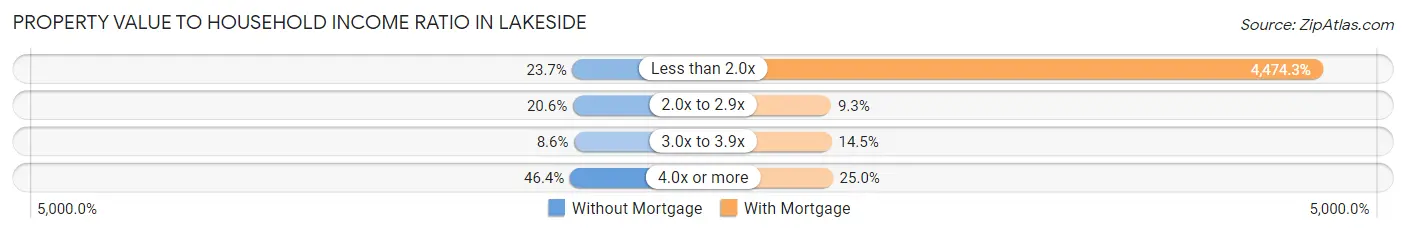
| Value-to-Income Ratio | Without Mortgage | With Mortgage |
| Less than 2.0x | 442 (23.7%) | 141,210 (4,474.3%) |
| 2.0x to 2.9x | 383 (20.5%) | 294 (9.3%) |
| 3.0x to 3.9x | 160 (8.6%) | 458 (14.5%) |
| 4.0x or more | 865 (46.4%) | 788 (25.0%) |
| Total | 1,864 (100.0%) | 3,156 (100.0%) |
Real Estate Taxes by Mortgage Status in Lakeside
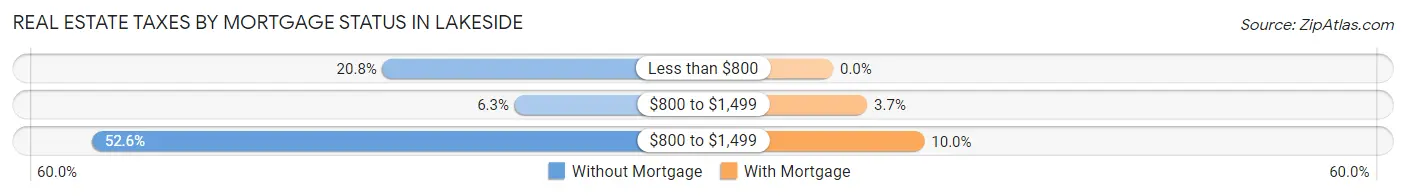
| Property Taxes | Without Mortgage | With Mortgage |
| Less than $800 | 387 (20.8%) | 0 (0.0%) |
| $800 to $1,499 | 117 (6.3%) | 118 (3.7%) |
| $800 to $1,499 | 981 (52.6%) | 316 (10.0%) |
| Total | 1,864 (100.0%) | 3,156 (100.0%) |
Health & Disability in Lakeside
Health Insurance Coverage by Age in Lakeside
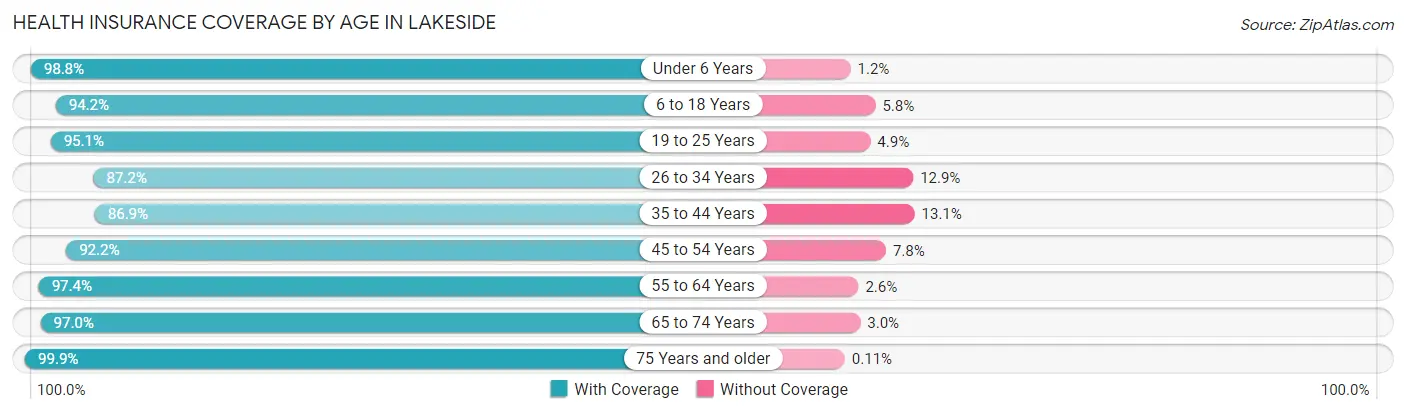
| Age Bracket | With Coverage | Without Coverage |
| Under 6 Years | 1,680 (98.8%) | 20 (1.2%) |
| 6 to 18 Years | 3,547 (94.2%) | 219 (5.8%) |
| 19 to 25 Years | 2,032 (95.1%) | 104 (4.9%) |
| 26 to 34 Years | 1,988 (87.2%) | 293 (12.9%) |
| 35 to 44 Years | 2,188 (86.9%) | 330 (13.1%) |
| 45 to 54 Years | 2,030 (92.2%) | 171 (7.8%) |
| 55 to 64 Years | 2,581 (97.4%) | 70 (2.6%) |
| 65 to 74 Years | 2,398 (97.0%) | 74 (3.0%) |
| 75 Years and older | 1,792 (99.9%) | 2 (0.1%) |
| Total | 20,236 (94.0%) | 1,283 (6.0%) |
Health Insurance Coverage by Citizenship Status in Lakeside
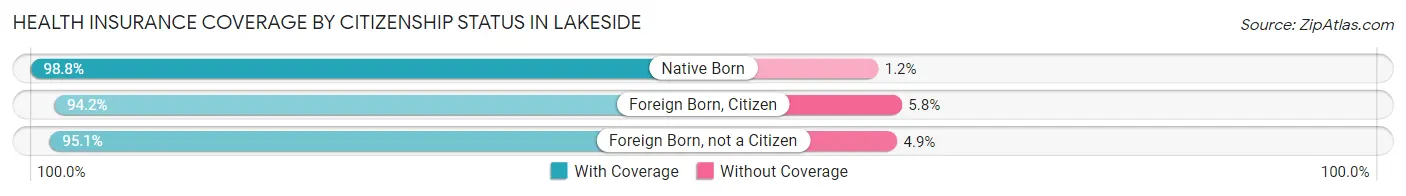
| Citizenship Status | With Coverage | Without Coverage |
| Native Born | 1,680 (98.8%) | 20 (1.2%) |
| Foreign Born, Citizen | 3,547 (94.2%) | 219 (5.8%) |
| Foreign Born, not a Citizen | 2,032 (95.1%) | 104 (4.9%) |
Health Insurance Coverage by Household Income in Lakeside
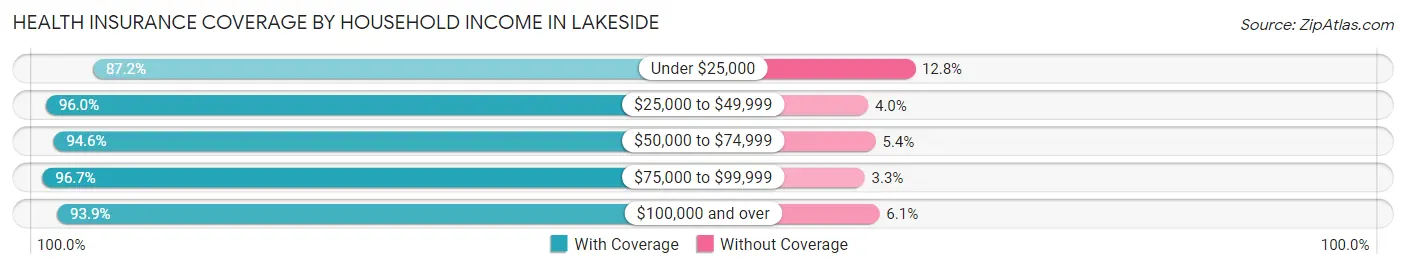
| Household Income | With Coverage | Without Coverage |
| Under $25,000 | 1,544 (87.2%) | 226 (12.8%) |
| $25,000 to $49,999 | 1,979 (96.0%) | 82 (4.0%) |
| $50,000 to $74,999 | 3,954 (94.6%) | 225 (5.4%) |
| $75,000 to $99,999 | 2,437 (96.7%) | 84 (3.3%) |
| $100,000 and over | 10,196 (93.9%) | 664 (6.1%) |
Public vs Private Health Insurance Coverage by Age in Lakeside
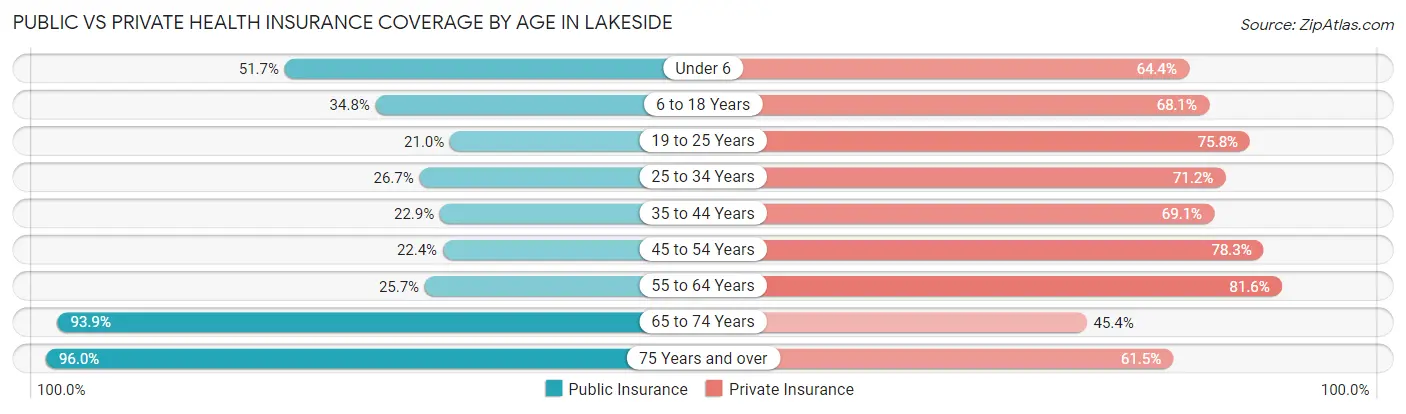
| Age Bracket | Public Insurance | Private Insurance |
| Under 6 | 879 (51.7%) | 1,095 (64.4%) |
| 6 to 18 Years | 1,312 (34.8%) | 2,565 (68.1%) |
| 19 to 25 Years | 449 (21.0%) | 1,618 (75.7%) |
| 25 to 34 Years | 609 (26.7%) | 1,623 (71.2%) |
| 35 to 44 Years | 576 (22.9%) | 1,739 (69.1%) |
| 45 to 54 Years | 492 (22.4%) | 1,723 (78.3%) |
| 55 to 64 Years | 681 (25.7%) | 2,164 (81.6%) |
| 65 to 74 Years | 2,321 (93.9%) | 1,123 (45.4%) |
| 75 Years and over | 1,723 (96.0%) | 1,103 (61.5%) |
| Total | 9,042 (42.0%) | 14,753 (68.6%) |
Disability Status by Sex by Age in Lakeside
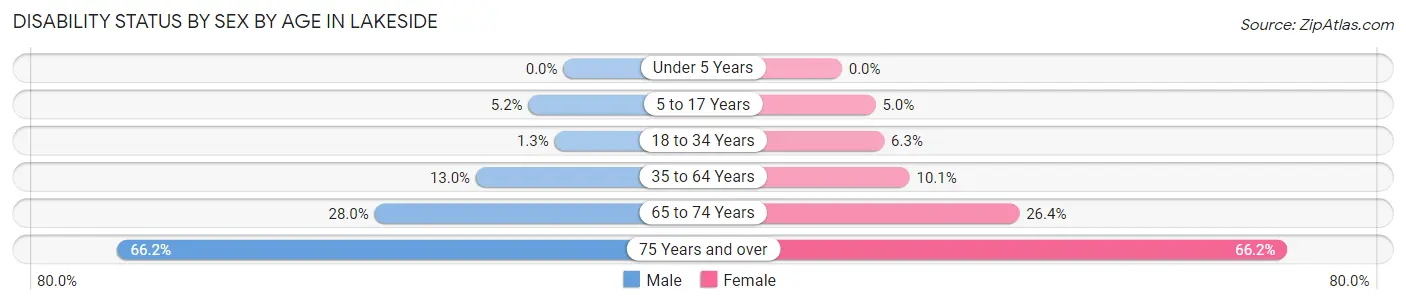
| Age Bracket | Male | Female |
| Under 5 Years | 0 (0.0%) | 0 (0.0%) |
| 5 to 17 Years | 85 (5.2%) | 104 (5.0%) |
| 18 to 34 Years | 32 (1.3%) | 151 (6.3%) |
| 35 to 64 Years | 447 (13.0%) | 395 (10.1%) |
| 65 to 74 Years | 309 (28.0%) | 361 (26.4%) |
| 75 Years and over | 591 (66.2%) | 596 (66.1%) |
Disability Class by Sex by Age in Lakeside
Disability Class: Hearing Difficulty
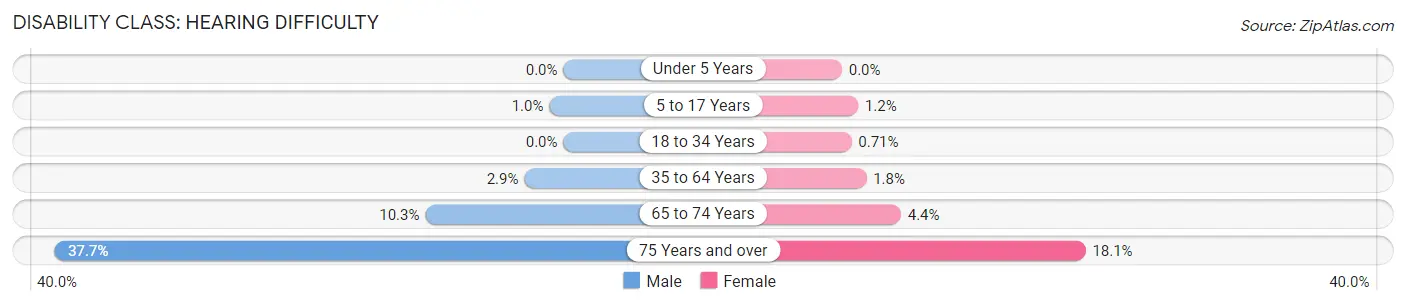
| Age Bracket | Male | Female |
| Under 5 Years | 0 (0.0%) | 0 (0.0%) |
| 5 to 17 Years | 17 (1.0%) | 25 (1.2%) |
| 18 to 34 Years | 0 (0.0%) | 17 (0.7%) |
| 35 to 64 Years | 100 (2.9%) | 71 (1.8%) |
| 65 to 74 Years | 113 (10.2%) | 60 (4.4%) |
| 75 Years and over | 337 (37.7%) | 163 (18.1%) |
Disability Class: Vision Difficulty
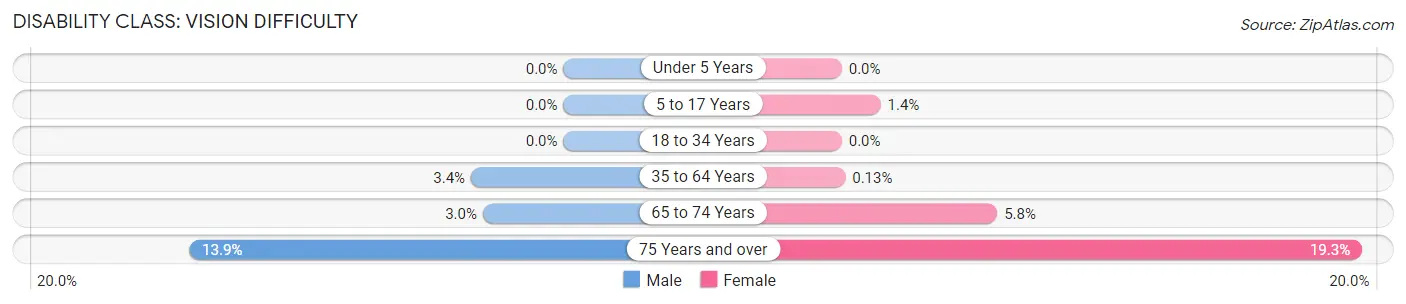
| Age Bracket | Male | Female |
| Under 5 Years | 0 (0.0%) | 0 (0.0%) |
| 5 to 17 Years | 0 (0.0%) | 30 (1.4%) |
| 18 to 34 Years | 0 (0.0%) | 0 (0.0%) |
| 35 to 64 Years | 118 (3.4%) | 5 (0.1%) |
| 65 to 74 Years | 33 (3.0%) | 79 (5.8%) |
| 75 Years and over | 124 (13.9%) | 174 (19.3%) |
Disability Class: Cognitive Difficulty
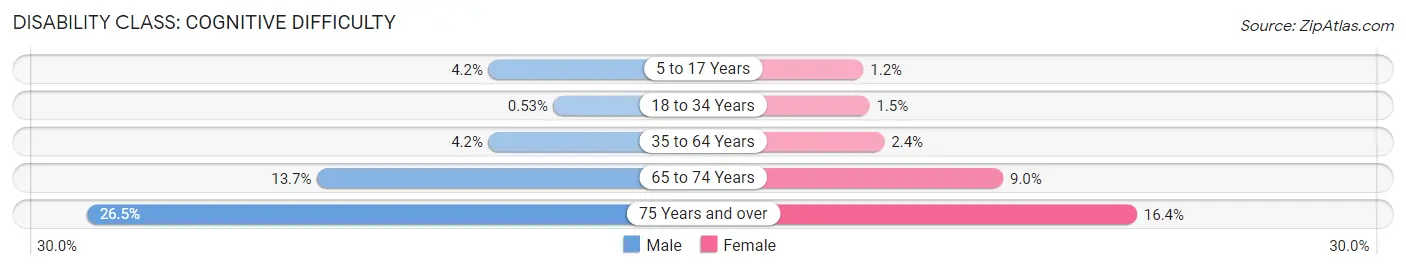
| Age Bracket | Male | Female |
| 5 to 17 Years | 68 (4.2%) | 25 (1.2%) |
| 18 to 34 Years | 13 (0.5%) | 37 (1.5%) |
| 35 to 64 Years | 143 (4.2%) | 93 (2.4%) |
| 65 to 74 Years | 151 (13.7%) | 123 (9.0%) |
| 75 Years and over | 237 (26.5%) | 148 (16.4%) |
Disability Class: Ambulatory Difficulty
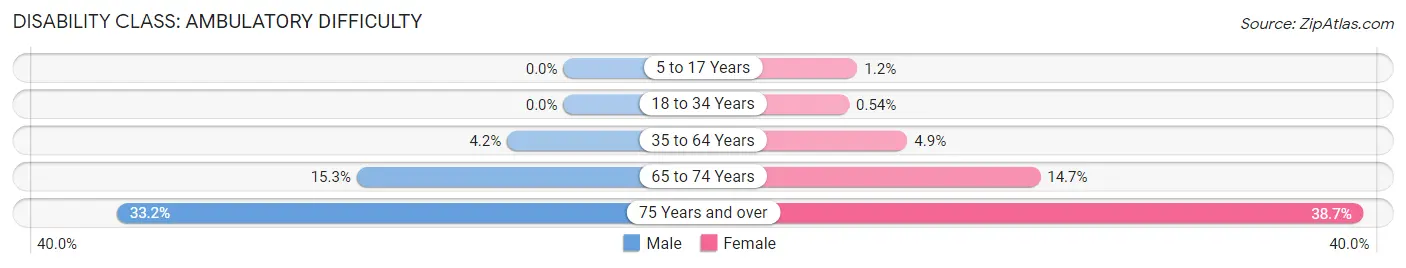
| Age Bracket | Male | Female |
| 5 to 17 Years | 0 (0.0%) | 24 (1.2%) |
| 18 to 34 Years | 0 (0.0%) | 13 (0.5%) |
| 35 to 64 Years | 144 (4.2%) | 191 (4.9%) |
| 65 to 74 Years | 169 (15.3%) | 202 (14.7%) |
| 75 Years and over | 296 (33.2%) | 349 (38.7%) |
Disability Class: Self-Care Difficulty
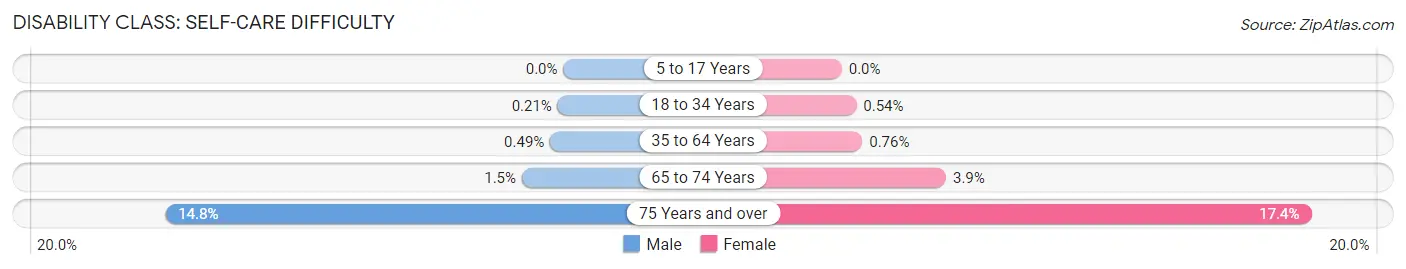
| Age Bracket | Male | Female |
| 5 to 17 Years | 0 (0.0%) | 0 (0.0%) |
| 18 to 34 Years | 5 (0.2%) | 13 (0.5%) |
| 35 to 64 Years | 17 (0.5%) | 30 (0.8%) |
| 65 to 74 Years | 17 (1.5%) | 53 (3.9%) |
| 75 Years and over | 132 (14.8%) | 157 (17.4%) |
Technology Access in Lakeside
Computing Device Access in Lakeside
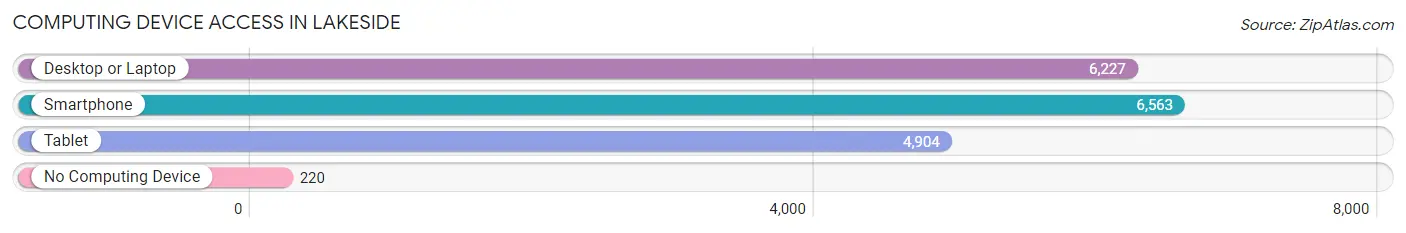
| Device Type | # Households | % Households |
| Desktop or Laptop | 6,227 | 86.0% |
| Smartphone | 6,563 | 90.6% |
| Tablet | 4,904 | 67.7% |
| No Computing Device | 220 | 3.0% |
| Total | 7,244 | 100.0% |
Internet Access in Lakeside
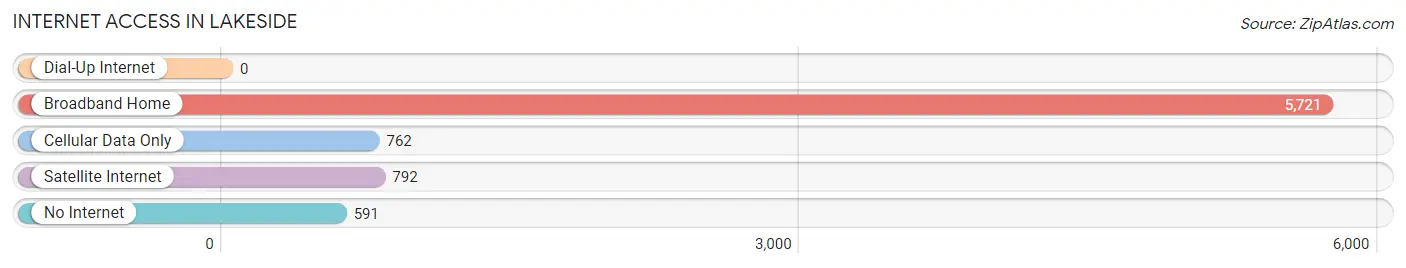
| Internet Type | # Households | % Households |
| Dial-Up Internet | 0 | 0.0% |
| Broadband Home | 5,721 | 79.0% |
| Cellular Data Only | 762 | 10.5% |
| Satellite Internet | 792 | 10.9% |
| No Internet | 591 | 8.2% |
| Total | 7,244 | 100.0% |
Lakeside Summary
Lakeside is a census-designated place (CDP) located in San Diego County, California, United States. The population was 20,648 at the 2010 census, up from 19,560 as of the 2000 census. Lakeside is located east of El Cajon and includes a small reservoir, Lake Jennings.
History
Lakeside was founded in 1886 by Charles W. and Mary Richardson. The Richardsons were originally from Lakeside, Ohio, and they named their new home after their old one. The area was originally used for cattle grazing and farming. In the early 1900s, Lakeside became a popular destination for people looking to escape the city and enjoy the outdoors. The area was also known for its many resorts and recreational activities.
In the 1920s, Lakeside began to grow rapidly as people moved to the area for its rural atmosphere and proximity to San Diego. The population increased from 1,000 in 1920 to over 10,000 by 1930. During this time, the area was known for its many resorts, including the Lakeside Inn, which was built in 1924.
In the 1950s, Lakeside began to experience a population boom as people moved to the area for its rural atmosphere and proximity to San Diego. The population increased from 10,000 in 1950 to over 20,000 by 1960. During this time, the area was known for its many resorts, including the Lakeside Inn, which was built in 1924.
Geography
Lakeside is located at 32°49'25" North, 116°59'17" West (32.823607, -116.987945). According to the United States Census Bureau, the CDP has a total area of 8.3 square miles (21.5 km2), all land.
Economy
Lakeside's economy is largely based on agriculture and tourism. The area is home to several farms, including the Lakeside Organic Farm, which produces organic fruits and vegetables. The area is also home to several wineries, including the Lakeside Winery, which produces award-winning wines.
The area is also home to several resorts and recreational activities, including the Lakeside Inn, which was built in 1924. The area is also home to several golf courses, including the Lakeside Golf Course, which was built in 1924.
Demographics
As of the 2010 census, there were 20,648 people, 7,845 households, and 5,717 families residing in the CDP. The population density was 2,478.3 people per square mile (957.2/km2). There were 8,345 housing units at an average density of 1,006.2 per square mile (389.2/km2). The racial makeup of the CDP was 79.2% White, 1.3% African American, 0.7% Native American, 1.2% Asian, 0.2% Pacific Islander, 13.7% from other races, and 3.8% from two or more races. Hispanic or Latino of any race were 28.2% of the population.
There were 7,845 households, out of which 33.2% had children under the age of 18 living with them, 51.2% were married couples living together, 13.3% had a female householder with no husband present, and 29.7% were non-families. 22.7% of all households were made up of individuals, and 8.2% had someone living alone who was 65 years of age or older. The average household size was 2.60 and the average family size was 3.05.
In the CDP, the population was spread out, with 25.2% under the age of 18, 8.2% from 18 to 24, 28.2% from 25 to 44, 25.2% from 45 to 64, and 13.2% who were 65 years of age or older. The median age was 37 years. For every 100 females, there were 97.2 males. For every 100 females age 18 and over, there were 94.2 males.
The median income for a household in the CDP was $45,813, and the median income for a family was $50,919. Males had a median income of $37,813 versus $30,917 for females. The per capita income for the CDP was $20,919. About 8.2% of families and 10.3% of the population were below the poverty line, including 14.2% of those under age 18 and 6.2% of those age 65 or over.
Common Questions
What is Per Capita Income in Lakeside?
Per Capita income in Lakeside is $37,334.
What is the Median Family Income in Lakeside?
Median Family Income in Lakeside is $109,861.
What is the Median Household income in Lakeside?
Median Household Income in Lakeside is $87,386.
What is Income or Wage Gap in Lakeside?
Income or Wage Gap in Lakeside is 2.5%.
Women in Lakeside earn 97.5 cents for every dollar earned by a man.
What is Inequality or Gini Index in Lakeside?
Inequality or Gini Index in Lakeside is 0.40.
What is the Total Population of Lakeside?
Total Population of Lakeside is 21,759.
What is the Total Male Population of Lakeside?
Total Male Population of Lakeside is 10,258.
What is the Total Female Population of Lakeside?
Total Female Population of Lakeside is 11,501.
What is the Ratio of Males per 100 Females in Lakeside?
There are 89.19 Males per 100 Females in Lakeside.
What is the Ratio of Females per 100 Males in Lakeside?
There are 112.12 Females per 100 Males in Lakeside.
What is the Median Population Age in Lakeside?
Median Population Age in Lakeside is 38.4 Years.
What is the Average Family Size in Lakeside
Average Family Size in Lakeside is 3.5 People.
What is the Average Household Size in Lakeside
Average Household Size in Lakeside is 3.0 People.
How Large is the Labor Force in Lakeside?
There are 10,352 People in the Labor Forcein in Lakeside.
What is the Percentage of People in the Labor Force in Lakeside?
59.4% of People are in the Labor Force in Lakeside.
What is the Unemployment Rate in Lakeside?
Unemployment Rate in Lakeside is 7.7%.