Rohnert Park, CA Map & Demographics
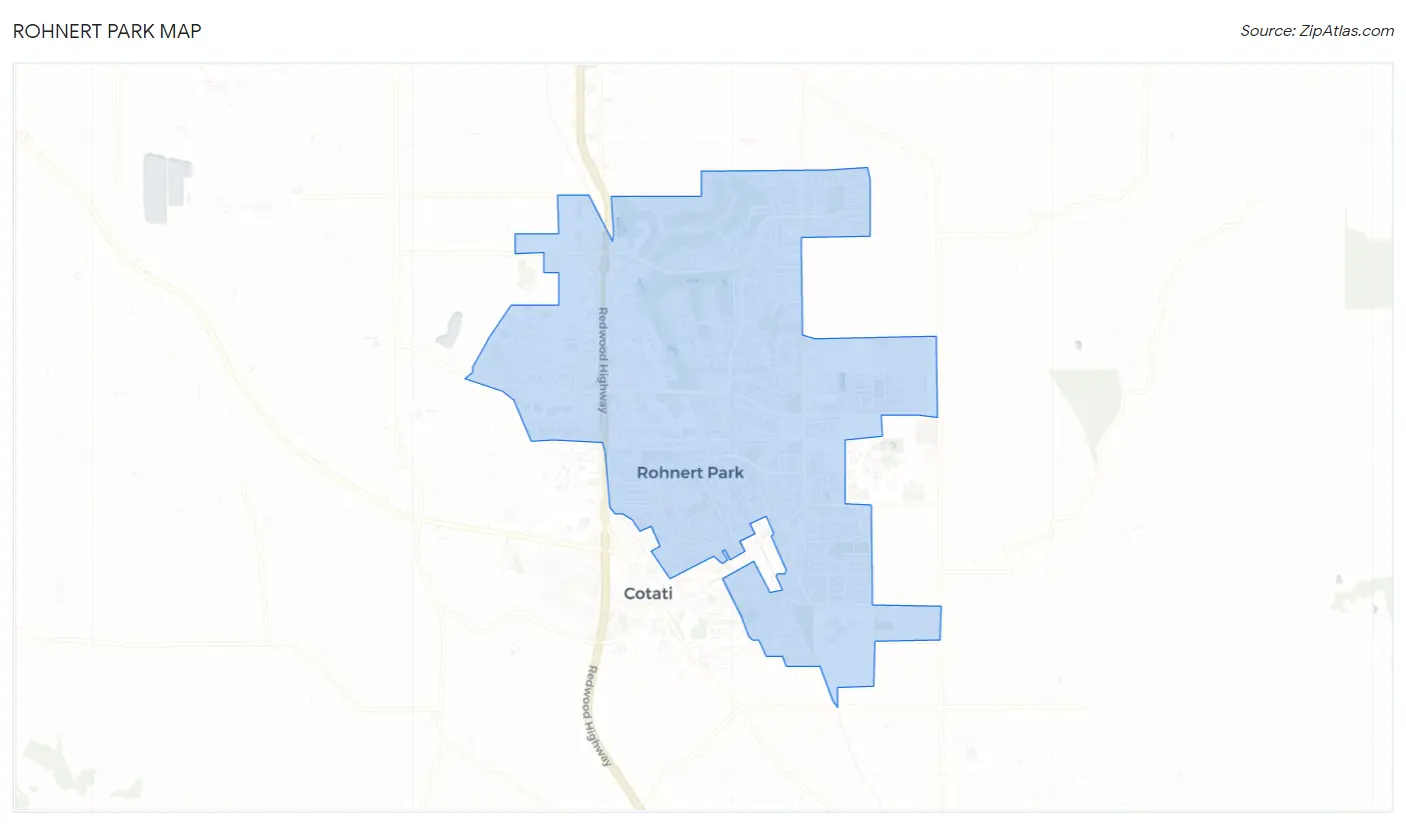
Rohnert Park Map
Rohnert Park Overview
$45,294
PER CAPITA INCOME
$110,873
AVG FAMILY INCOME
$93,322
AVG HOUSEHOLD INCOME
33.9%
WAGE / INCOME GAP [ % ]
66.1¢/ $1
WAGE / INCOME GAP [ $ ]
$11,710
FAMILY INCOME DEFICIT
0.43
INEQUALITY / GINI INDEX
44,461
TOTAL POPULATION
21,670
MALE POPULATION
22,791
FEMALE POPULATION
95.08
MALES / 100 FEMALES
105.17
FEMALES / 100 MALES
35.4
MEDIAN AGE
3.2
AVG FAMILY SIZE
2.6
AVG HOUSEHOLD SIZE
25,801
LABOR FORCE [ PEOPLE ]
71.0%
PERCENT IN LABOR FORCE
4.8%
UNEMPLOYMENT RATE
Rohnert Park Zip Codes
Rohnert Park Area Codes
Income in Rohnert Park
Income Overview in Rohnert Park
Per Capita Income in Rohnert Park is $45,294, while median incomes of families and households are $110,873 and $93,322 respectively.
| Characteristic | Number | Measure |
| Per Capita Income | 44,461 | $45,294 |
| Median Family Income | 10,241 | $110,873 |
| Mean Family Income | 10,241 | $137,485 |
| Median Household Income | 16,979 | $93,322 |
| Mean Household Income | 16,979 | $118,345 |
| Income Deficit | 10,241 | $11,710 |
| Wage / Income Gap (%) | 44,461 | 33.86% |
| Wage / Income Gap ($) | 44,461 | 66.14¢ per $1 |
| Gini / Inequality Index | 44,461 | 0.43 |
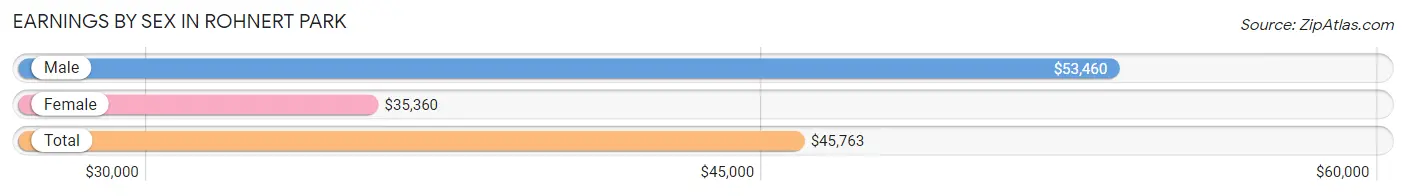
Earnings by Sex in Rohnert Park
Average Earnings in Rohnert Park are $45,763, $53,460 for men and $35,360 for women, a difference of 33.9%.
| Sex | Number | Average Earnings |
| Male | 14,192 (52.7%) | $53,460 |
| Female | 12,759 (47.3%) | $35,360 |
| Total | 26,951 (100.0%) | $45,763 |
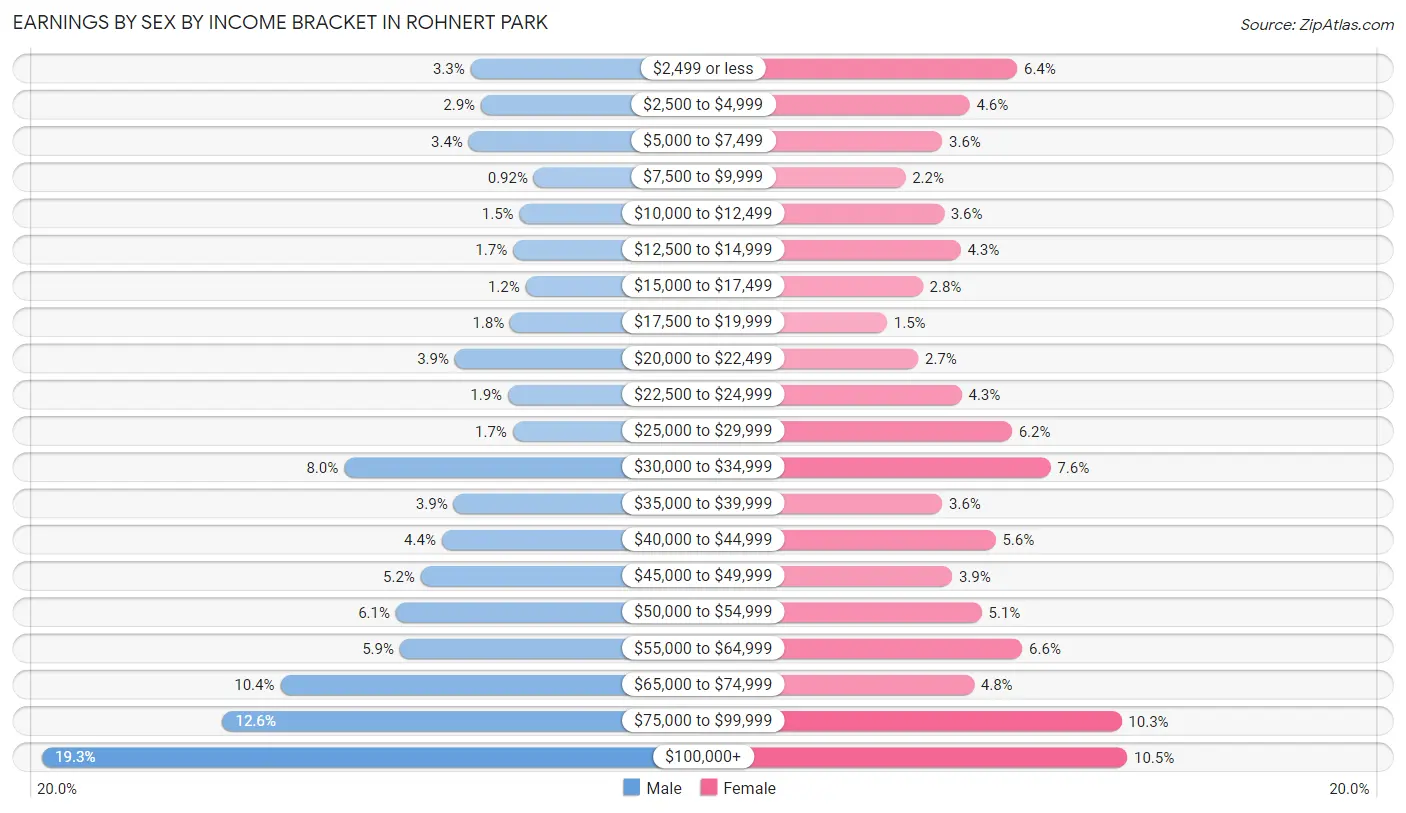
Earnings by Sex by Income Bracket in Rohnert Park
The most common earnings brackets in Rohnert Park are $100,000+ for men (2,745 | 19.3%) and $100,000+ for women (1,340 | 10.5%).
| Income | Male | Female |
| $2,499 or less | 467 (3.3%) | 814 (6.4%) |
| $2,500 to $4,999 | 411 (2.9%) | 587 (4.6%) |
| $5,000 to $7,499 | 477 (3.4%) | 456 (3.6%) |
| $7,500 to $9,999 | 130 (0.9%) | 280 (2.2%) |
| $10,000 to $12,499 | 207 (1.5%) | 463 (3.6%) |
| $12,500 to $14,999 | 241 (1.7%) | 543 (4.3%) |
| $15,000 to $17,499 | 174 (1.2%) | 362 (2.8%) |
| $17,500 to $19,999 | 257 (1.8%) | 191 (1.5%) |
| $20,000 to $22,499 | 550 (3.9%) | 341 (2.7%) |
| $22,500 to $24,999 | 268 (1.9%) | 549 (4.3%) |
| $25,000 to $29,999 | 243 (1.7%) | 789 (6.2%) |
| $30,000 to $34,999 | 1,140 (8.0%) | 973 (7.6%) |
| $35,000 to $39,999 | 558 (3.9%) | 455 (3.6%) |
| $40,000 to $44,999 | 620 (4.4%) | 711 (5.6%) |
| $45,000 to $49,999 | 733 (5.2%) | 503 (3.9%) |
| $50,000 to $54,999 | 864 (6.1%) | 644 (5.1%) |
| $55,000 to $64,999 | 843 (5.9%) | 838 (6.6%) |
| $65,000 to $74,999 | 1,479 (10.4%) | 607 (4.8%) |
| $75,000 to $99,999 | 1,785 (12.6%) | 1,313 (10.3%) |
| $100,000+ | 2,745 (19.3%) | 1,340 (10.5%) |
| Total | 14,192 (100.0%) | 12,759 (100.0%) |
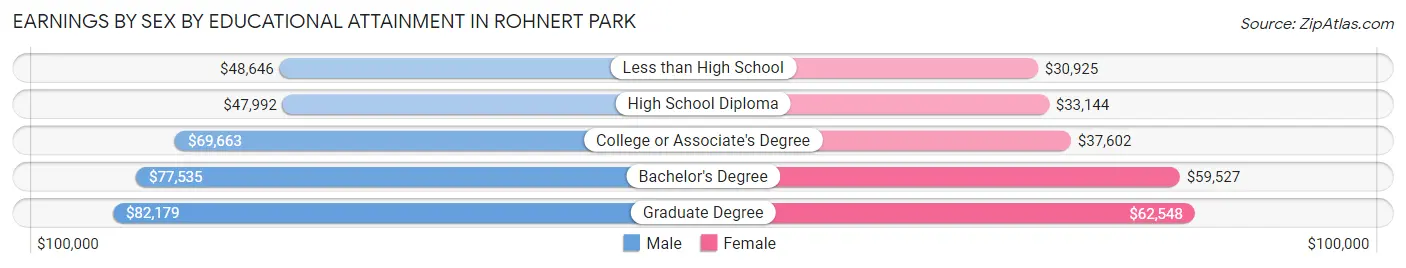
Earnings by Sex by Educational Attainment in Rohnert Park
Average earnings in Rohnert Park are $63,172 for men and $45,177 for women, a difference of 28.5%. Men with an educational attainment of graduate degree enjoy the highest average annual earnings of $82,179, while those with high school diploma education earn the least with $47,992. Women with an educational attainment of graduate degree earn the most with the average annual earnings of $62,548, while those with less than high school education have the smallest earnings of $30,925.
| Educational Attainment | Male Income | Female Income |
| Less than High School | $48,646 | $30,925 |
| High School Diploma | $47,992 | $33,144 |
| College or Associate's Degree | $69,663 | $37,602 |
| Bachelor's Degree | $77,535 | $59,527 |
| Graduate Degree | $82,179 | $62,548 |
| Total | $63,172 | $45,177 |
Family Income in Rohnert Park
Family Income Brackets in Rohnert Park
According to the Rohnert Park family income data, there are 2,294 families falling into the $100,000 to $149,999 income range, which is the most common income bracket and makes up 22.4% of all families. Conversely, the $10,000 to $14,999 income bracket is the least frequent group with only 113 families (1.1%) belonging to this category.
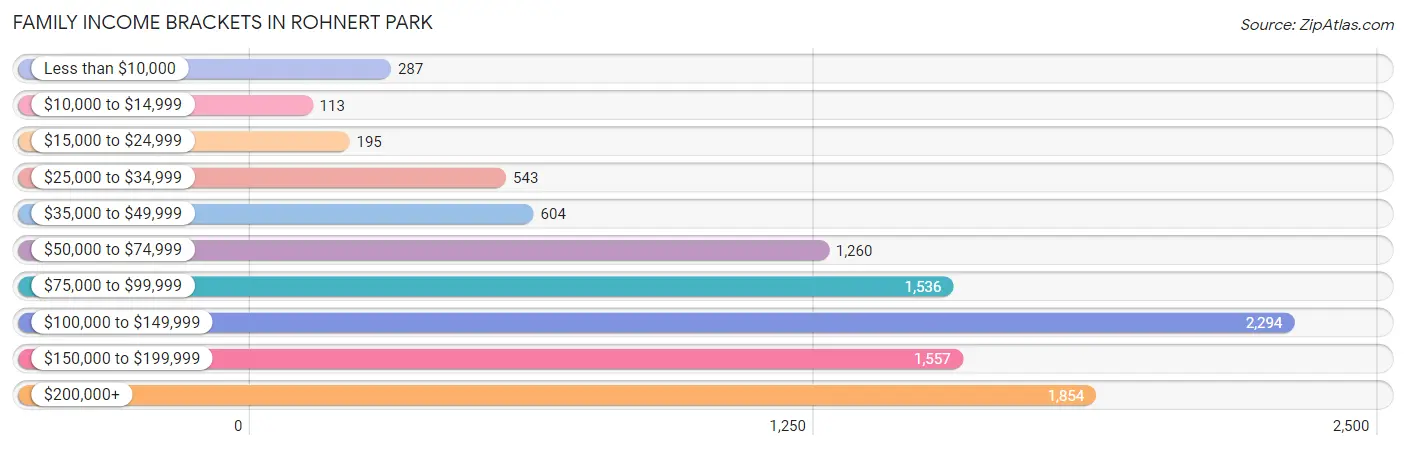
| Income Bracket | # Families | % Families |
| Less than $10,000 | 287 | 2.8% |
| $10,000 to $14,999 | 113 | 1.1% |
| $15,000 to $24,999 | 195 | 1.9% |
| $25,000 to $34,999 | 543 | 5.3% |
| $35,000 to $49,999 | 604 | 5.9% |
| $50,000 to $74,999 | 1,260 | 12.3% |
| $75,000 to $99,999 | 1,536 | 15.0% |
| $100,000 to $149,999 | 2,294 | 22.4% |
| $150,000 to $199,999 | 1,557 | 15.2% |
| $200,000+ | 1,854 | 18.1% |
Family Income by Famaliy Size in Rohnert Park
6-person families (461 | 4.5%) account for the highest median family income in Rohnert Park with $250,001 per family, while 2-person families (4,509 | 44.0%) have the highest median income of $50,356 per family member.
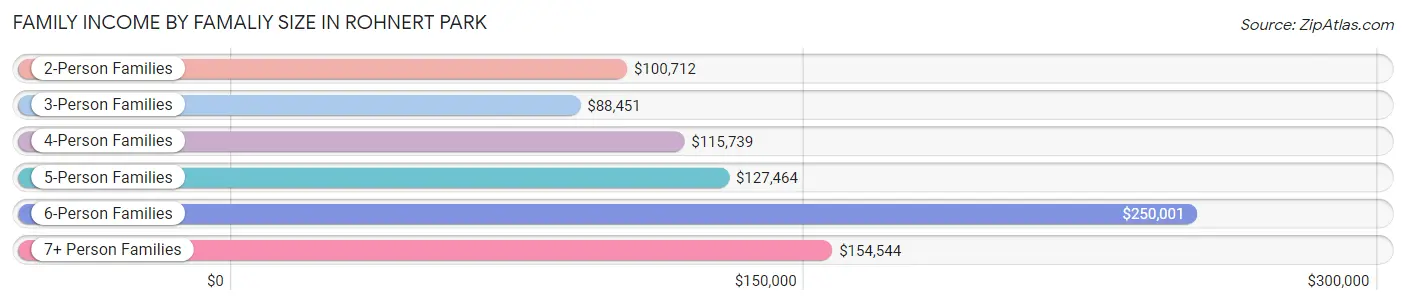
| Income Bracket | # Families | Median Income |
| 2-Person Families | 4,509 (44.0%) | $100,712 |
| 3-Person Families | 2,453 (23.9%) | $88,451 |
| 4-Person Families | 1,615 (15.8%) | $115,739 |
| 5-Person Families | 1,012 (9.9%) | $127,464 |
| 6-Person Families | 461 (4.5%) | $250,001 |
| 7+ Person Families | 191 (1.9%) | $154,544 |
| Total | 10,241 (100.0%) | $110,873 |
Family Income by Number of Earners in Rohnert Park
The median family income in Rohnert Park is $110,873, with families comprising 3+ earners (1,552) having the highest median family income of $155,245, while families with no earners (1,086) have the lowest median family income of $60,409, accounting for 15.1% and 10.6% of families, respectively.
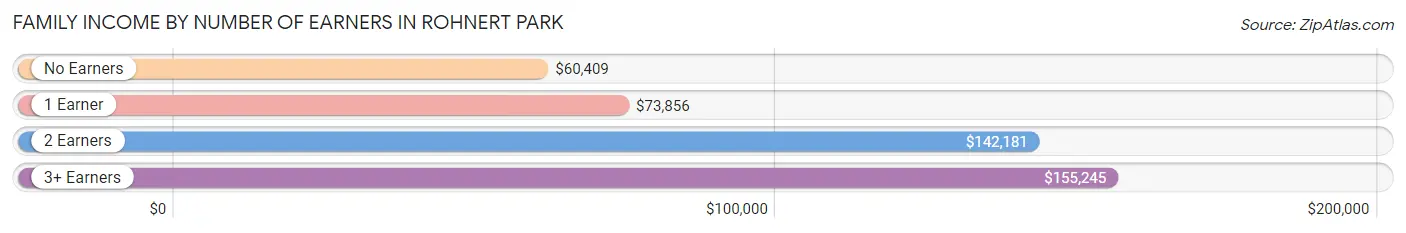
| Number of Earners | # Families | Median Income |
| No Earners | 1,086 (10.6%) | $60,409 |
| 1 Earner | 3,076 (30.0%) | $73,856 |
| 2 Earners | 4,527 (44.2%) | $142,181 |
| 3+ Earners | 1,552 (15.1%) | $155,245 |
| Total | 10,241 (100.0%) | $110,873 |
Household Income in Rohnert Park
Household Income Brackets in Rohnert Park
With 3,328 households falling in the category, the $100,000 to $149,999 income range is the most frequent in Rohnert Park, accounting for 19.6% of all households. In contrast, only 407 households (2.4%) fall into the $10,000 to $14,999 income bracket, making it the least populous group.
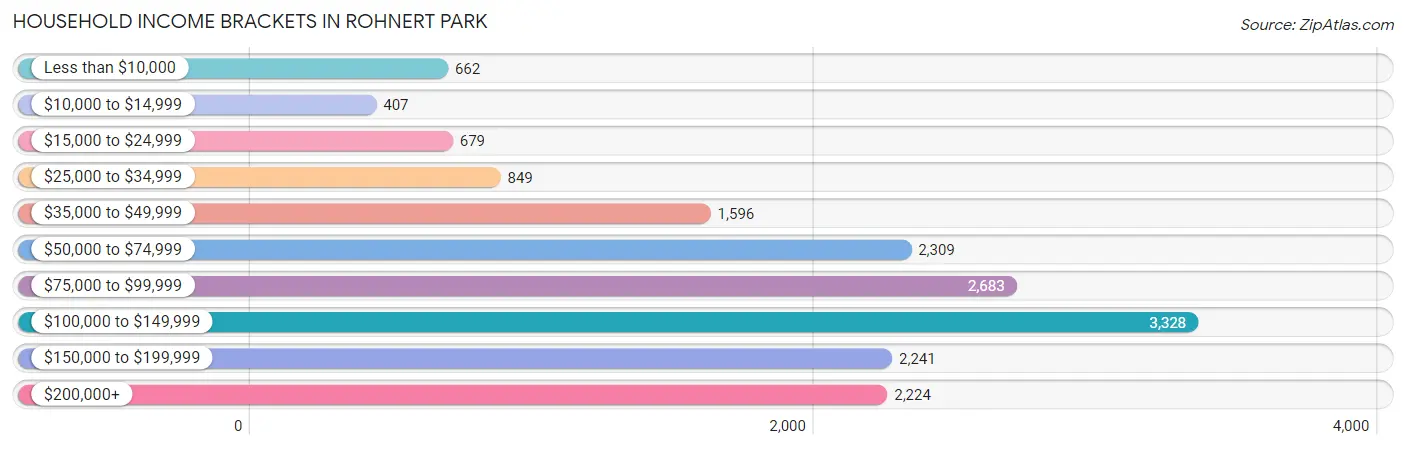
| Income Bracket | # Households | % Households |
| Less than $10,000 | 662 | 3.9% |
| $10,000 to $14,999 | 407 | 2.4% |
| $15,000 to $24,999 | 679 | 4.0% |
| $25,000 to $34,999 | 849 | 5.0% |
| $35,000 to $49,999 | 1,596 | 9.4% |
| $50,000 to $74,999 | 2,309 | 13.6% |
| $75,000 to $99,999 | 2,683 | 15.8% |
| $100,000 to $149,999 | 3,328 | 19.6% |
| $150,000 to $199,999 | 2,241 | 13.2% |
| $200,000+ | 2,224 | 13.1% |
Household Income by Householder Age in Rohnert Park
The median household income in Rohnert Park is $93,322, with the highest median household income of $113,320 found in the 45 to 64 years age bracket for the primary householder. A total of 5,756 households (33.9%) fall into this category. Meanwhile, the 65+ years age bracket for the primary householder has the lowest median household income of $62,632, with 3,838 households (22.6%) in this group.
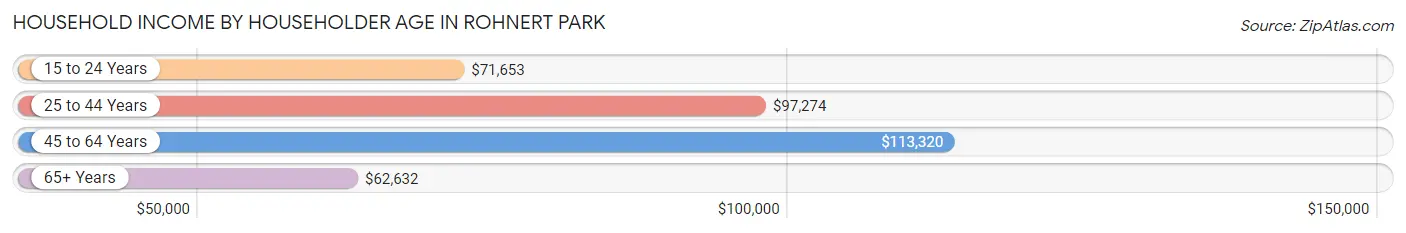
| Income Bracket | # Households | Median Income |
| 15 to 24 Years | 1,342 (7.9%) | $71,653 |
| 25 to 44 Years | 6,043 (35.6%) | $97,274 |
| 45 to 64 Years | 5,756 (33.9%) | $113,320 |
| 65+ Years | 3,838 (22.6%) | $62,632 |
| Total | 16,979 (100.0%) | $93,322 |
Poverty in Rohnert Park
Income Below Poverty by Sex and Age in Rohnert Park
With 7.6% poverty level for males and 11.7% for females among the residents of Rohnert Park, 15 year old males and 18 to 24 year old females are the most vulnerable to poverty, with 61 males (23.4%) and 1,029 females (31.8%) in their respective age groups living below the poverty level.
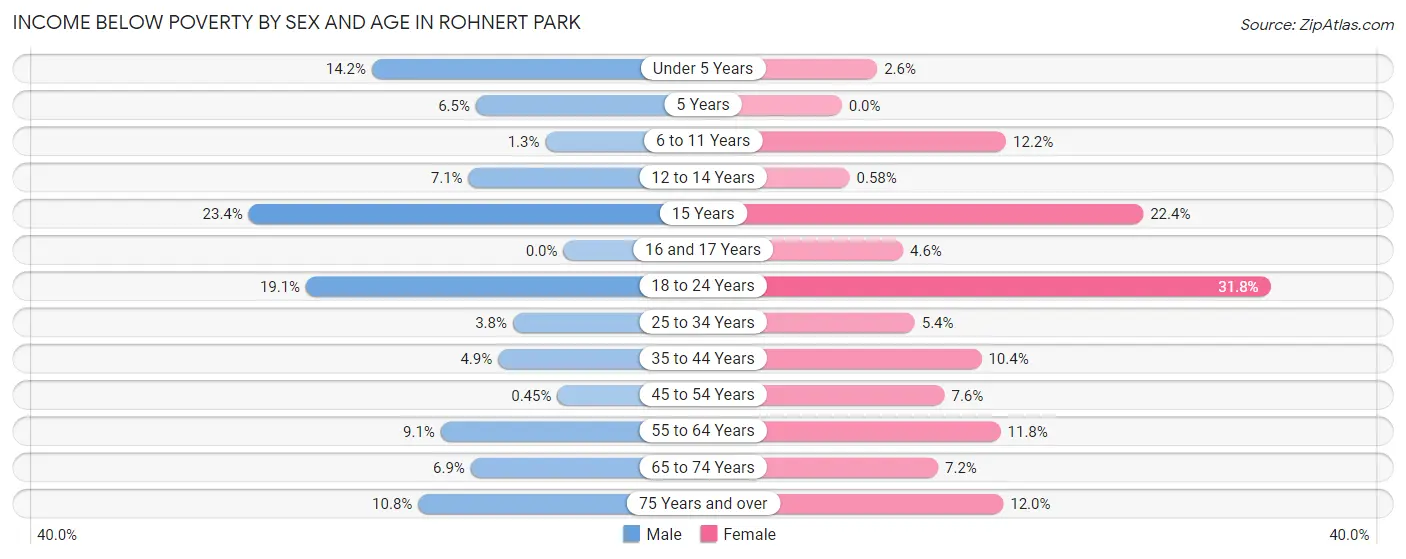
| Age Bracket | Male | Female |
| Under 5 Years | 206 (14.2%) | 33 (2.6%) |
| 5 Years | 18 (6.5%) | 0 (0.0%) |
| 6 to 11 Years | 20 (1.3%) | 187 (12.2%) |
| 12 to 14 Years | 27 (7.0%) | 5 (0.6%) |
| 15 Years | 61 (23.4%) | 77 (22.4%) |
| 16 and 17 Years | 0 (0.0%) | 27 (4.5%) |
| 18 to 24 Years | 501 (19.1%) | 1,029 (31.8%) |
| 25 to 34 Years | 134 (3.7%) | 191 (5.4%) |
| 35 to 44 Years | 160 (4.9%) | 292 (10.4%) |
| 45 to 54 Years | 10 (0.4%) | 148 (7.6%) |
| 55 to 64 Years | 255 (9.1%) | 371 (11.8%) |
| 65 to 74 Years | 131 (6.9%) | 147 (7.1%) |
| 75 Years and over | 108 (10.8%) | 157 (12.0%) |
| Total | 1,631 (7.6%) | 2,664 (11.7%) |
Income Above Poverty by Sex and Age in Rohnert Park
According to the poverty statistics in Rohnert Park, males aged 16 and 17 years and females aged 5 years are the age groups that are most secure financially, with 100.0% of males and 100.0% of females in these age groups living above the poverty line.
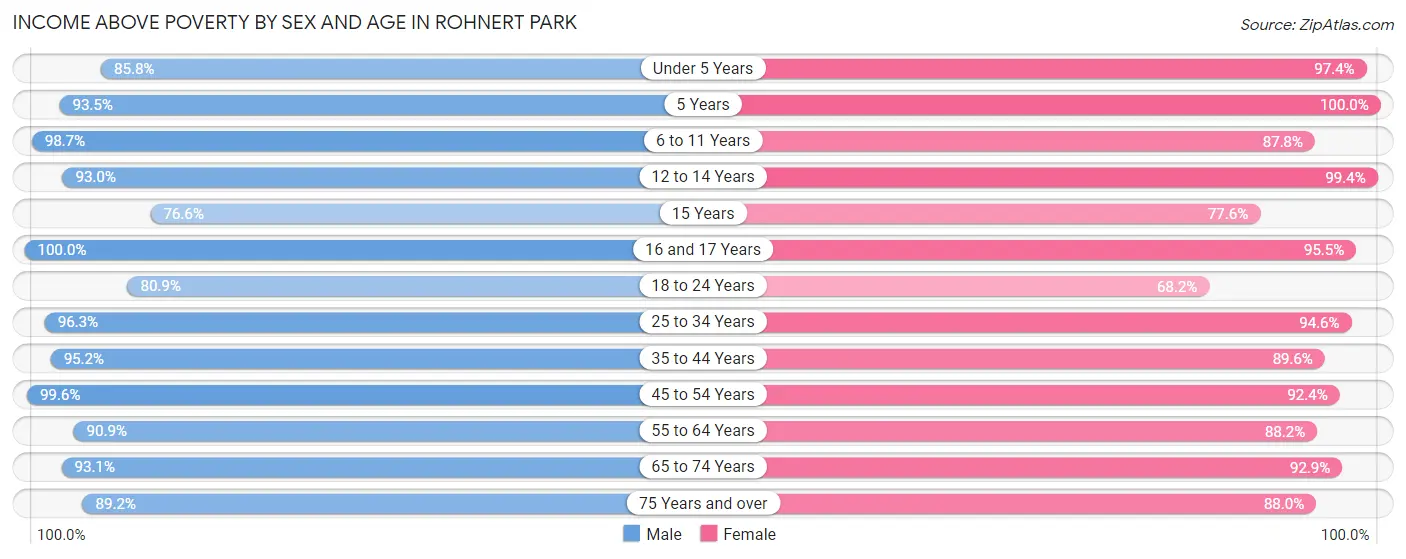
| Age Bracket | Male | Female |
| Under 5 Years | 1,243 (85.8%) | 1,221 (97.4%) |
| 5 Years | 259 (93.5%) | 152 (100.0%) |
| 6 to 11 Years | 1,478 (98.7%) | 1,346 (87.8%) |
| 12 to 14 Years | 356 (92.9%) | 862 (99.4%) |
| 15 Years | 200 (76.6%) | 267 (77.6%) |
| 16 and 17 Years | 187 (100.0%) | 566 (95.5%) |
| 18 to 24 Years | 2,120 (80.9%) | 2,205 (68.2%) |
| 25 to 34 Years | 3,442 (96.3%) | 3,334 (94.6%) |
| 35 to 44 Years | 3,136 (95.2%) | 2,524 (89.6%) |
| 45 to 54 Years | 2,219 (99.6%) | 1,792 (92.4%) |
| 55 to 64 Years | 2,544 (90.9%) | 2,775 (88.2%) |
| 65 to 74 Years | 1,773 (93.1%) | 1,908 (92.8%) |
| 75 Years and over | 894 (89.2%) | 1,152 (88.0%) |
| Total | 19,851 (92.4%) | 20,104 (88.3%) |
Income Below Poverty Among Married-Couple Families in Rohnert Park
The poverty statistics for married-couple families in Rohnert Park show that 2.2% or 165 of the total 7,318 families live below the poverty line. Families with no children have the highest poverty rate of 2.8%, comprising of 123 families. On the other hand, families with 5 or more children have the lowest poverty rate of 0.0%, which includes 0 families.
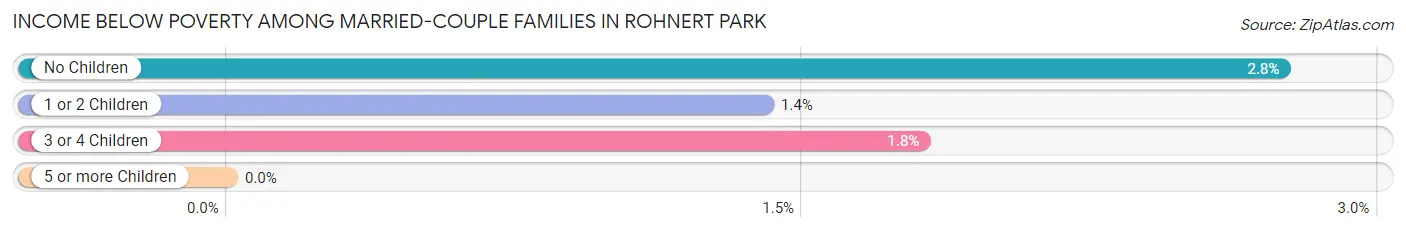
| Children | Above Poverty | Below Poverty |
| No Children | 4,351 (97.3%) | 123 (2.8%) |
| 1 or 2 Children | 2,117 (98.6%) | 30 (1.4%) |
| 3 or 4 Children | 650 (98.2%) | 12 (1.8%) |
| 5 or more Children | 35 (100.0%) | 0 (0.0%) |
| Total | 7,153 (97.8%) | 165 (2.2%) |
Income Below Poverty Among Single-Parent Households in Rohnert Park
According to the poverty data in Rohnert Park, 14.2% or 133 single-father households and 12.2% or 243 single-mother households are living below the poverty line. Among single-father households, those with 1 or 2 children have the highest poverty rate, with 75 households (15.7%) experiencing poverty. Likewise, among single-mother households, those with 1 or 2 children have the highest poverty rate, with 236 households (20.0%) falling below the poverty line.

| Children | Single Father | Single Mother |
| No Children | 58 (14.0%) | 7 (1.2%) |
| 1 or 2 Children | 75 (15.7%) | 236 (20.0%) |
| 3 or 4 Children | 0 (0.0%) | 0 (0.0%) |
| 5 or more Children | 0 (0.0%) | 0 (0.0%) |
| Total | 133 (14.2%) | 243 (12.2%) |
Income Below Poverty Among Married-Couple vs Single-Parent Households in Rohnert Park
The poverty data for Rohnert Park shows that 165 of the married-couple family households (2.2%) and 376 of the single-parent households (12.9%) are living below the poverty level. Within the married-couple family households, those with no children have the highest poverty rate, with 123 households (2.8%) falling below the poverty line. Among the single-parent households, those with 1 or 2 children have the highest poverty rate, with 311 household (18.8%) living below poverty.
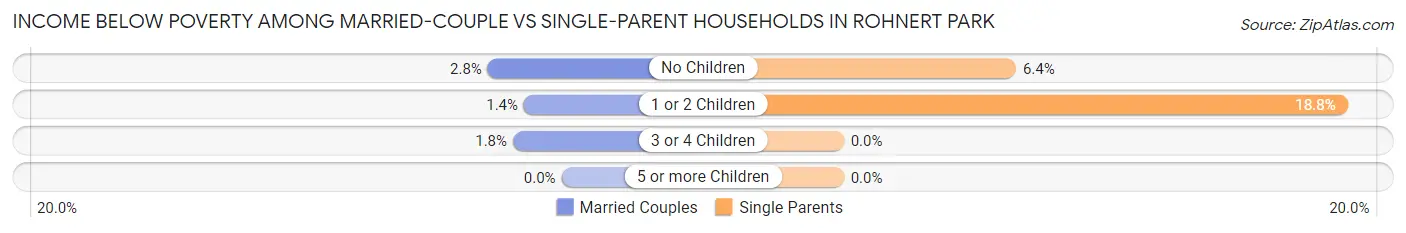
| Children | Married-Couple Families | Single-Parent Households |
| No Children | 123 (2.8%) | 65 (6.4%) |
| 1 or 2 Children | 30 (1.4%) | 311 (18.8%) |
| 3 or 4 Children | 12 (1.8%) | 0 (0.0%) |
| 5 or more Children | 0 (0.0%) | 0 (0.0%) |
| Total | 165 (2.2%) | 376 (12.9%) |
Race in Rohnert Park
The most populous races in Rohnert Park are White / Caucasian (27,952 | 62.9%), Hispanic or Latino (13,768 | 31.0%), and Two or more Races (7,444 | 16.7%).
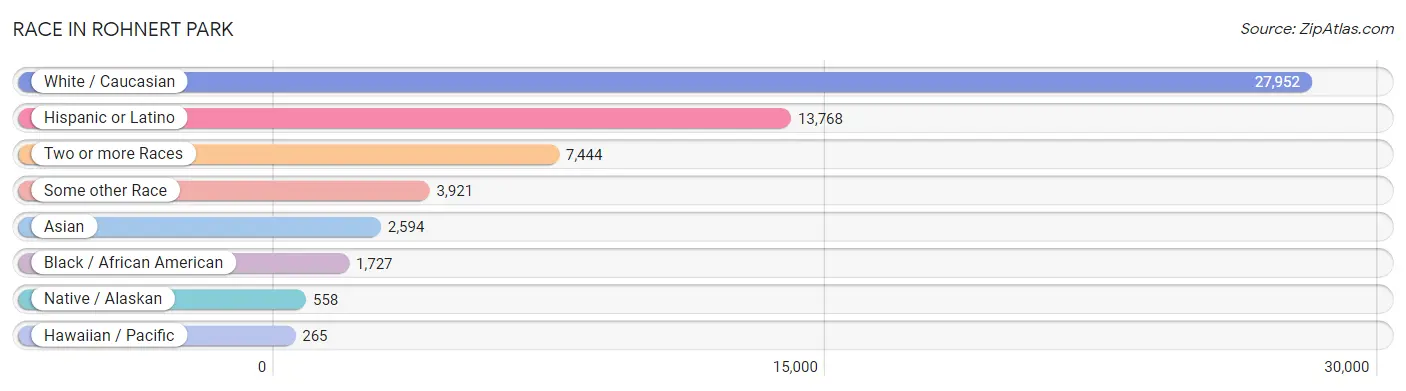
| Race | # Population | % Population |
| Asian | 2,594 | 5.8% |
| Black / African American | 1,727 | 3.9% |
| Hawaiian / Pacific | 265 | 0.6% |
| Hispanic or Latino | 13,768 | 31.0% |
| Native / Alaskan | 558 | 1.3% |
| White / Caucasian | 27,952 | 62.9% |
| Two or more Races | 7,444 | 16.7% |
| Some other Race | 3,921 | 8.8% |
| Total | 44,461 | 100.0% |
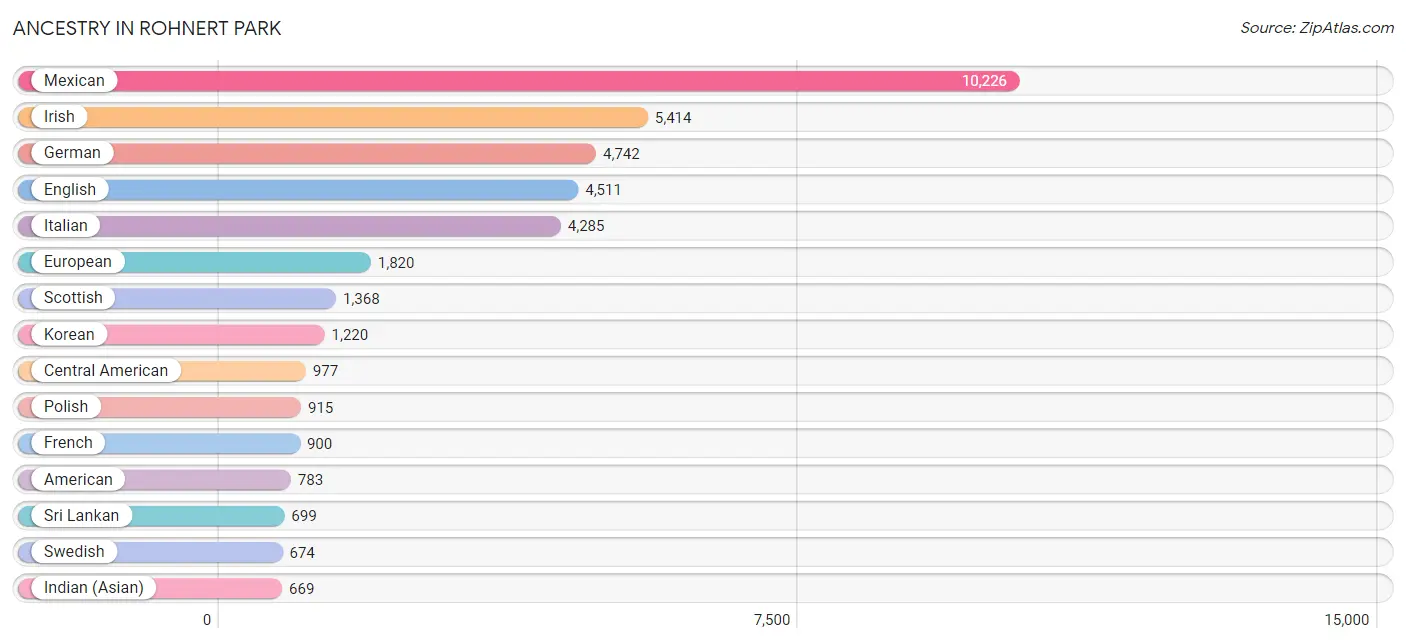
Ancestry in Rohnert Park
The most populous ancestries reported in Rohnert Park are Mexican (10,226 | 23.0%), Irish (5,414 | 12.2%), German (4,742 | 10.7%), English (4,511 | 10.2%), and Italian (4,285 | 9.6%), together accounting for 65.6% of all Rohnert Park residents.
| Ancestry | # Population | % Population |
| African | 80 | 0.2% |
| American | 783 | 1.8% |
| Apache | 290 | 0.6% |
| Arab | 509 | 1.1% |
| Argentinean | 15 | 0.0% |
| Armenian | 23 | 0.1% |
| Assyrian / Chaldean / Syriac | 187 | 0.4% |
| Australian | 31 | 0.1% |
| Austrian | 88 | 0.2% |
| Basque | 25 | 0.1% |
| Belgian | 105 | 0.2% |
| Bhutanese | 187 | 0.4% |
| Blackfeet | 30 | 0.1% |
| Bolivian | 20 | 0.0% |
| Brazilian | 74 | 0.2% |
| British | 299 | 0.7% |
| Burmese | 227 | 0.5% |
| Canadian | 42 | 0.1% |
| Celtic | 21 | 0.1% |
| Central American | 977 | 2.2% |
| Central American Indian | 354 | 0.8% |
| Cherokee | 179 | 0.4% |
| Chilean | 27 | 0.1% |
| Colombian | 251 | 0.6% |
| Cree | 13 | 0.0% |
| Creek | 17 | 0.0% |
| Croatian | 57 | 0.1% |
| Cuban | 125 | 0.3% |
| Czech | 115 | 0.3% |
| Czechoslovakian | 37 | 0.1% |
| Danish | 595 | 1.3% |
| Dominican | 12 | 0.0% |
| Dutch | 339 | 0.8% |
| Eastern European | 82 | 0.2% |
| Egyptian | 60 | 0.1% |
| English | 4,511 | 10.2% |
| Ethiopian | 22 | 0.1% |
| European | 1,820 | 4.1% |
| Finnish | 111 | 0.3% |
| French | 900 | 2.0% |
| French Canadian | 260 | 0.6% |
| German | 4,742 | 10.7% |
| Greek | 321 | 0.7% |
| Guamanian / Chamorro | 11 | 0.0% |
| Guatemalan | 259 | 0.6% |
| Haitian | 281 | 0.6% |
| Honduran | 33 | 0.1% |
| Hopi | 26 | 0.1% |
| Hungarian | 104 | 0.2% |
| Indian (Asian) | 669 | 1.5% |
| Inupiat | 10 | 0.0% |
| Iranian | 27 | 0.1% |
| Irish | 5,414 | 12.2% |
| Iroquois | 31 | 0.1% |
| Israeli | 20 | 0.0% |
| Italian | 4,285 | 9.6% |
| Japanese | 109 | 0.3% |
| Jordanian | 77 | 0.2% |
| Korean | 1,220 | 2.7% |
| Lebanese | 165 | 0.4% |
| Lithuanian | 124 | 0.3% |
| Malaysian | 30 | 0.1% |
| Maltese | 9 | 0.0% |
| Mexican | 10,226 | 23.0% |
| Mexican American Indian | 86 | 0.2% |
| Moroccan | 28 | 0.1% |
| Native Hawaiian | 30 | 0.1% |
| Navajo | 74 | 0.2% |
| Nicaraguan | 164 | 0.4% |
| Northern European | 157 | 0.4% |
| Norwegian | 665 | 1.5% |
| Pakistani | 11 | 0.0% |
| Palestinian | 30 | 0.1% |
| Peruvian | 251 | 0.6% |
| Polish | 915 | 2.1% |
| Portuguese | 611 | 1.4% |
| Puerto Rican | 326 | 0.7% |
| Romanian | 99 | 0.2% |
| Russian | 331 | 0.7% |
| Salvadoran | 521 | 1.2% |
| Samoan | 77 | 0.2% |
| Scandinavian | 334 | 0.7% |
| Scotch-Irish | 509 | 1.1% |
| Scottish | 1,368 | 3.1% |
| Sioux | 6 | 0.0% |
| Slavic | 13 | 0.0% |
| Slovak | 215 | 0.5% |
| South American | 622 | 1.4% |
| South American Indian | 43 | 0.1% |
| Spaniard | 283 | 0.6% |
| Spanish | 375 | 0.8% |
| Sri Lankan | 699 | 1.6% |
| Subsaharan African | 169 | 0.4% |
| Swedish | 674 | 1.5% |
| Swiss | 217 | 0.5% |
| Thai | 533 | 1.2% |
| Tongan | 15 | 0.0% |
| Ugandan | 50 | 0.1% |
| Ukrainian | 214 | 0.5% |
| Venezuelan | 37 | 0.1% |
| Welsh | 218 | 0.5% |
| Yugoslavian | 40 | 0.1% |
| Yup'ik | 29 | 0.1% | View All 103 Rows |
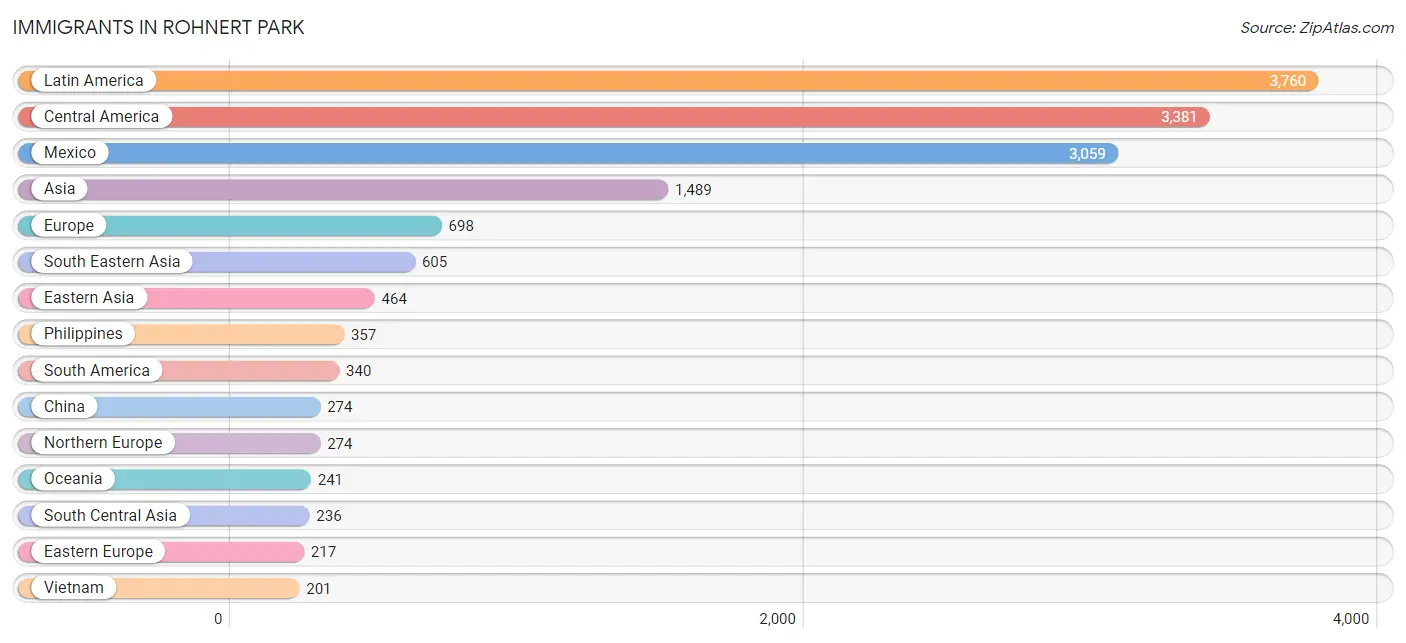
Immigrants in Rohnert Park
The most numerous immigrant groups reported in Rohnert Park came from Latin America (3,760 | 8.5%), Central America (3,381 | 7.6%), Mexico (3,059 | 6.9%), Asia (1,489 | 3.4%), and Europe (698 | 1.6%), together accounting for 27.9% of all Rohnert Park residents.
| Immigration Origin | # Population | % Population |
| Africa | 148 | 0.3% |
| Asia | 1,489 | 3.4% |
| Australia | 32 | 0.1% |
| Azores | 13 | 0.0% |
| Belarus | 8 | 0.0% |
| Brazil | 45 | 0.1% |
| Cambodia | 36 | 0.1% |
| Canada | 128 | 0.3% |
| Caribbean | 39 | 0.1% |
| Central America | 3,381 | 7.6% |
| China | 274 | 0.6% |
| Colombia | 122 | 0.3% |
| Denmark | 18 | 0.0% |
| Eastern Africa | 67 | 0.2% |
| Eastern Asia | 464 | 1.0% |
| Eastern Europe | 217 | 0.5% |
| Egypt | 60 | 0.1% |
| El Salvador | 160 | 0.4% |
| England | 4 | 0.0% |
| Europe | 698 | 1.6% |
| Fiji | 194 | 0.4% |
| France | 57 | 0.1% |
| Germany | 99 | 0.2% |
| Guatemala | 104 | 0.2% |
| Haiti | 39 | 0.1% |
| Honduras | 6 | 0.0% |
| Hong Kong | 14 | 0.0% |
| Hungary | 23 | 0.1% |
| India | 145 | 0.3% |
| Iran | 6 | 0.0% |
| Ireland | 38 | 0.1% |
| Israel | 20 | 0.0% |
| Jordan | 54 | 0.1% |
| Kenya | 17 | 0.0% |
| Korea | 190 | 0.4% |
| Latin America | 3,760 | 8.5% |
| Lebanon | 6 | 0.0% |
| Mexico | 3,059 | 6.9% |
| Morocco | 21 | 0.1% |
| Nepal | 77 | 0.2% |
| Nicaragua | 52 | 0.1% |
| Northern Africa | 81 | 0.2% |
| Northern Europe | 274 | 0.6% |
| Oceania | 241 | 0.5% |
| Pakistan | 8 | 0.0% |
| Peru | 173 | 0.4% |
| Philippines | 357 | 0.8% |
| Poland | 76 | 0.2% |
| Portugal | 44 | 0.1% |
| Romania | 45 | 0.1% |
| South America | 340 | 0.8% |
| South Central Asia | 236 | 0.5% |
| South Eastern Asia | 605 | 1.4% |
| Southern Europe | 51 | 0.1% |
| Spain | 7 | 0.0% |
| Taiwan | 37 | 0.1% |
| Thailand | 11 | 0.0% |
| Uganda | 50 | 0.1% |
| Ukraine | 65 | 0.2% |
| Vietnam | 201 | 0.4% |
| Western Asia | 184 | 0.4% |
| Western Europe | 156 | 0.4% | View All 62 Rows |
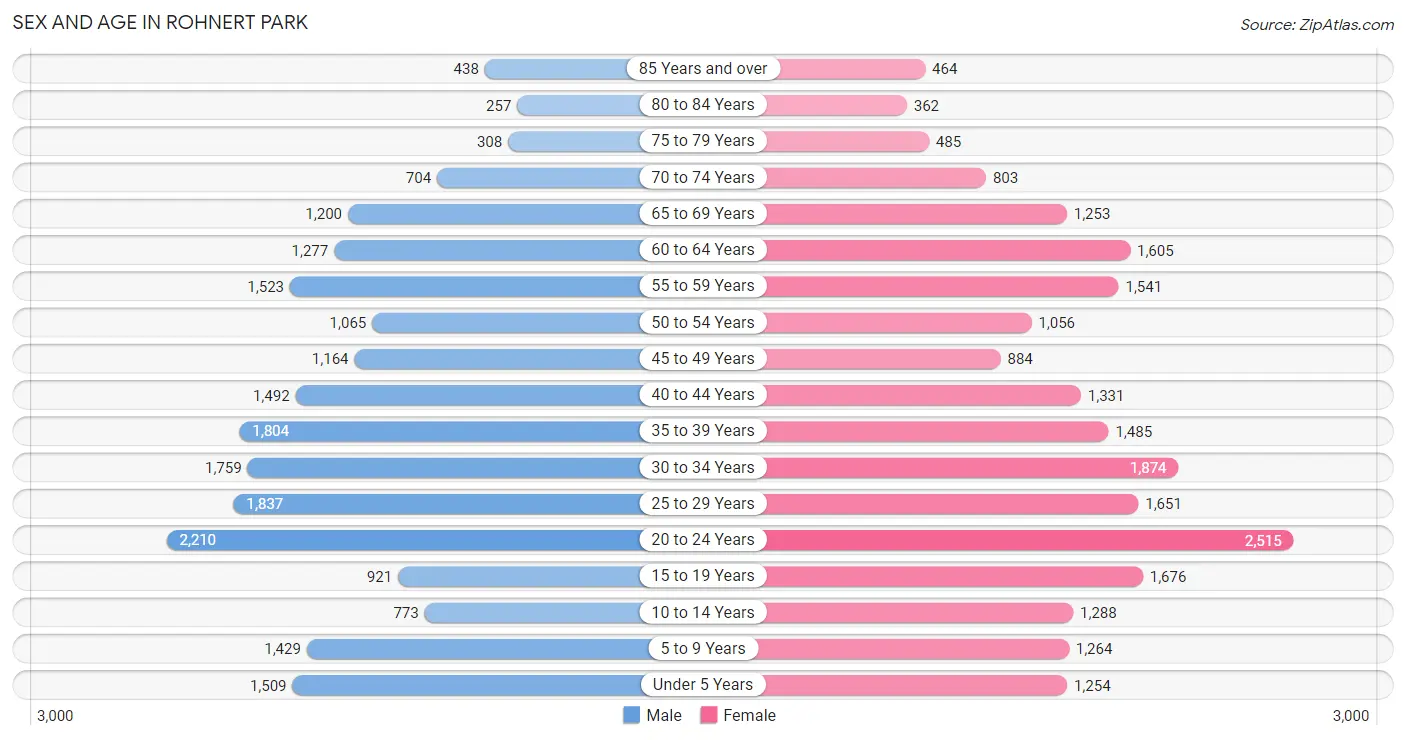
Sex and Age in Rohnert Park
Sex and Age in Rohnert Park
The most populous age groups in Rohnert Park are 20 to 24 Years (2,210 | 10.2%) for men and 20 to 24 Years (2,515 | 11.0%) for women.
| Age Bracket | Male | Female |
| Under 5 Years | 1,509 (7.0%) | 1,254 (5.5%) |
| 5 to 9 Years | 1,429 (6.6%) | 1,264 (5.6%) |
| 10 to 14 Years | 773 (3.6%) | 1,288 (5.7%) |
| 15 to 19 Years | 921 (4.3%) | 1,676 (7.3%) |
| 20 to 24 Years | 2,210 (10.2%) | 2,515 (11.0%) |
| 25 to 29 Years | 1,837 (8.5%) | 1,651 (7.2%) |
| 30 to 34 Years | 1,759 (8.1%) | 1,874 (8.2%) |
| 35 to 39 Years | 1,804 (8.3%) | 1,485 (6.5%) |
| 40 to 44 Years | 1,492 (6.9%) | 1,331 (5.8%) |
| 45 to 49 Years | 1,164 (5.4%) | 884 (3.9%) |
| 50 to 54 Years | 1,065 (4.9%) | 1,056 (4.6%) |
| 55 to 59 Years | 1,523 (7.0%) | 1,541 (6.8%) |
| 60 to 64 Years | 1,277 (5.9%) | 1,605 (7.0%) |
| 65 to 69 Years | 1,200 (5.5%) | 1,253 (5.5%) |
| 70 to 74 Years | 704 (3.3%) | 803 (3.5%) |
| 75 to 79 Years | 308 (1.4%) | 485 (2.1%) |
| 80 to 84 Years | 257 (1.2%) | 362 (1.6%) |
| 85 Years and over | 438 (2.0%) | 464 (2.0%) |
| Total | 21,670 (100.0%) | 22,791 (100.0%) |
Families and Households in Rohnert Park
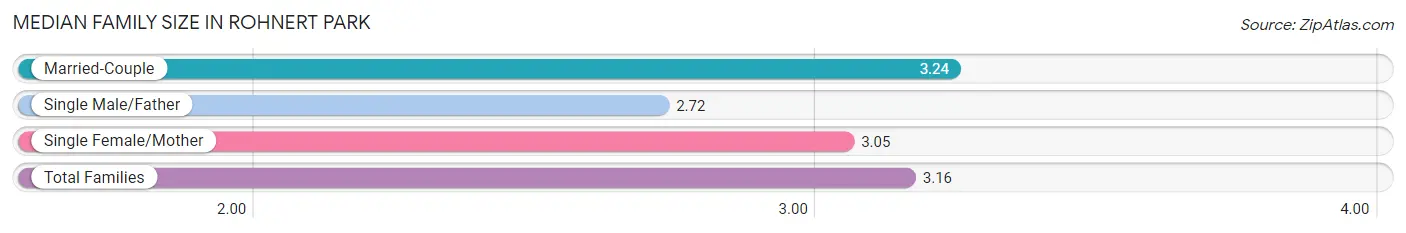
Median Family Size in Rohnert Park
The median family size in Rohnert Park is 3.16 persons per family, with married-couple families (7,318 | 71.5%) accounting for the largest median family size of 3.24 persons per family. On the other hand, single male/father families (939 | 9.2%) represent the smallest median family size with 2.72 persons per family.
| Family Type | # Families | Family Size |
| Married-Couple | 7,318 (71.5%) | 3.24 |
| Single Male/Father | 939 (9.2%) | 2.72 |
| Single Female/Mother | 1,984 (19.4%) | 3.05 |
| Total Families | 10,241 (100.0%) | 3.16 |
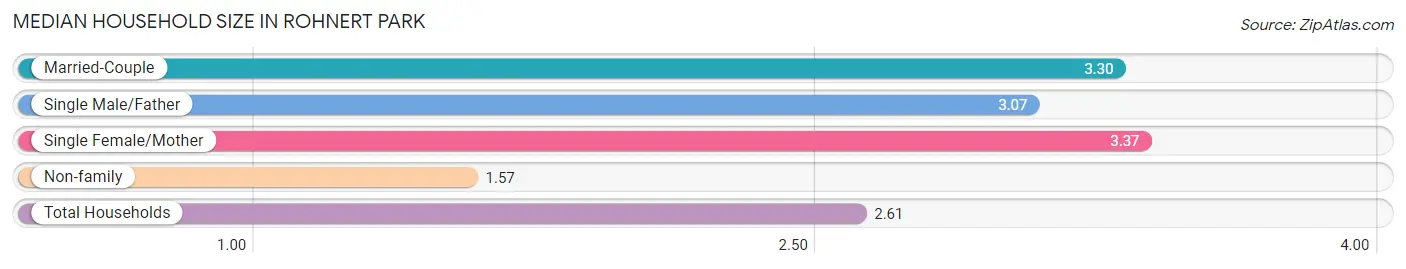
Median Household Size in Rohnert Park
The median household size in Rohnert Park is 2.61 persons per household, with single female/mother households (1,984 | 11.7%) accounting for the largest median household size of 3.37 persons per household. non-family households (6,738 | 39.7%) represent the smallest median household size with 1.57 persons per household.
| Household Type | # Households | Household Size |
| Married-Couple | 7,318 (43.1%) | 3.30 |
| Single Male/Father | 939 (5.5%) | 3.07 |
| Single Female/Mother | 1,984 (11.7%) | 3.37 |
| Non-family | 6,738 (39.7%) | 1.57 |
| Total Households | 16,979 (100.0%) | 2.61 |
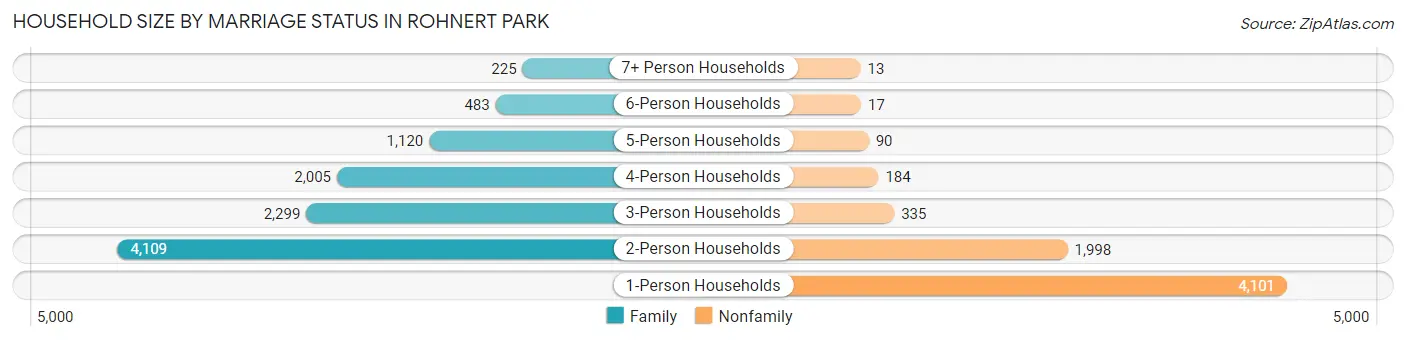
Household Size by Marriage Status in Rohnert Park
Out of a total of 16,979 households in Rohnert Park, 10,241 (60.3%) are family households, while 6,738 (39.7%) are nonfamily households. The most numerous type of family households are 2-person households, comprising 4,109, and the most common type of nonfamily households are 1-person households, comprising 4,101.
| Household Size | Family Households | Nonfamily Households |
| 1-Person Households | - | 4,101 (24.1%) |
| 2-Person Households | 4,109 (24.2%) | 1,998 (11.8%) |
| 3-Person Households | 2,299 (13.5%) | 335 (2.0%) |
| 4-Person Households | 2,005 (11.8%) | 184 (1.1%) |
| 5-Person Households | 1,120 (6.6%) | 90 (0.5%) |
| 6-Person Households | 483 (2.8%) | 17 (0.1%) |
| 7+ Person Households | 225 (1.3%) | 13 (0.1%) |
| Total | 10,241 (60.3%) | 6,738 (39.7%) |
Female Fertility in Rohnert Park
Fertility by Age in Rohnert Park
Average fertility rate in Rohnert Park is 40.0 births per 1,000 women. Women in the age bracket of 20 to 34 years have the highest fertility rate with 56.0 births per 1,000 women. Women in the age bracket of 20 to 34 years acount for 72.5% of all women with births.
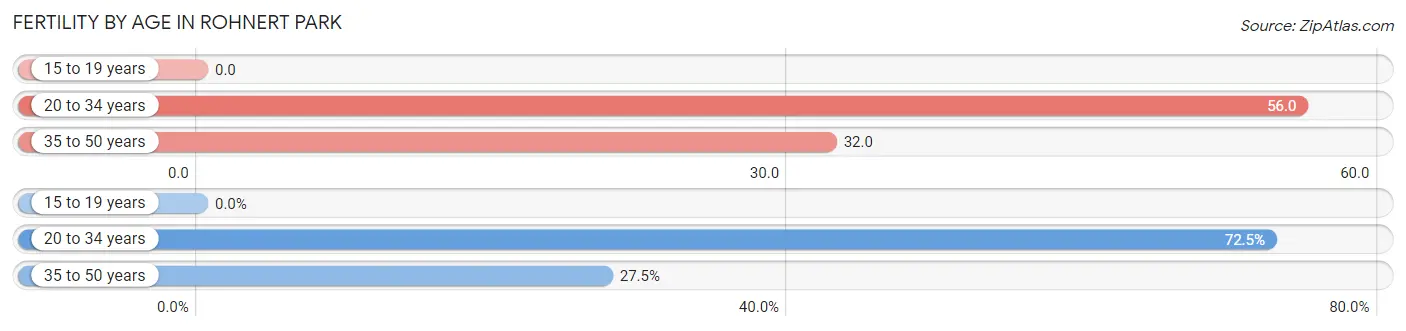
| Age Bracket | Women with Births | Births / 1,000 Women |
| 15 to 19 years | 0 (0.0%) | 0.0 |
| 20 to 34 years | 338 (72.5%) | 56.0 |
| 35 to 50 years | 128 (27.5%) | 32.0 |
| Total | 466 (100.0%) | 40.0 |
Fertility by Age by Marriage Status in Rohnert Park
60.5% of women with births (466) in Rohnert Park are married. The highest percentage of unmarried women with births falls into 35 to 50 years age bracket with 45.3% of them unmarried at the time of birth, while the lowest percentage of unmarried women with births belong to 20 to 34 years age bracket with 37.3% of them unmarried.
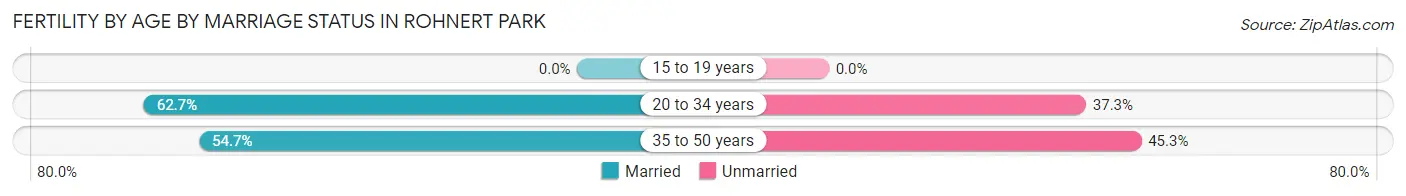
| Age Bracket | Married | Unmarried |
| 15 to 19 years | 0 (0.0%) | 0 (0.0%) |
| 20 to 34 years | 212 (62.7%) | 126 (37.3%) |
| 35 to 50 years | 70 (54.7%) | 58 (45.3%) |
| Total | 282 (60.5%) | 184 (39.5%) |
Fertility by Education in Rohnert Park
Average fertility rate in Rohnert Park is 40.0 births per 1,000 women. Women with the education attainment of high school diploma have the highest fertility rate of 99.0 births per 1,000 women, while women with the education attainment of less than high school have the lowest fertility at 10.0 births per 1,000 women. Women with the education attainment of high school diploma represent 44.9% of all women with births.
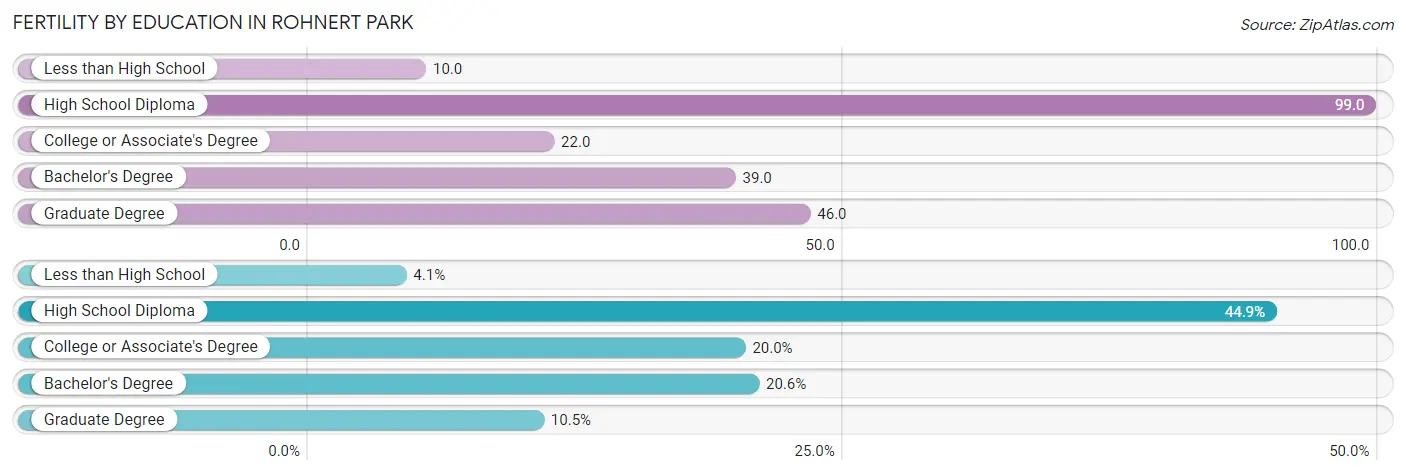
| Educational Attainment | Women with Births | Births / 1,000 Women |
| Less than High School | 19 (4.1%) | 10.0 |
| High School Diploma | 209 (44.9%) | 99.0 |
| College or Associate's Degree | 93 (20.0%) | 22.0 |
| Bachelor's Degree | 96 (20.6%) | 39.0 |
| Graduate Degree | 49 (10.5%) | 46.0 |
| Total | 466 (100.0%) | 40.0 |
Fertility by Education by Marriage Status in Rohnert Park
39.5% of women with births in Rohnert Park are unmarried. Women with the educational attainment of less than high school are most likely to be married with 100.0% of them married at childbirth, while women with the educational attainment of high school diploma are least likely to be married with 64.1% of them unmarried at childbirth.
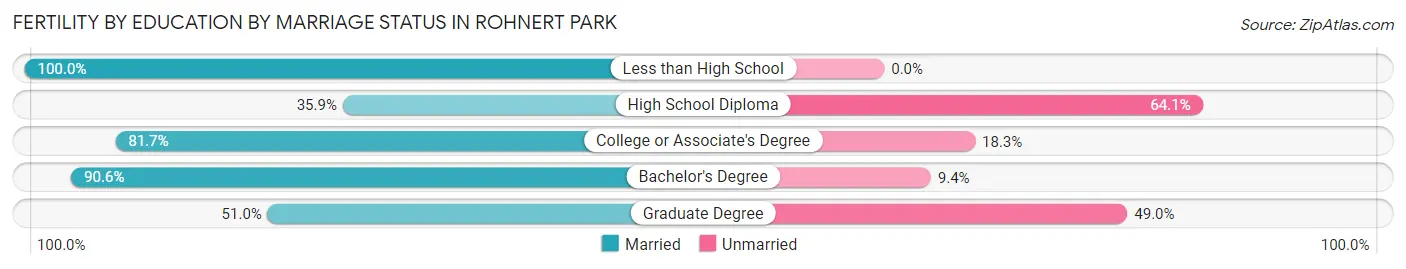
| Educational Attainment | Married | Unmarried |
| Less than High School | 19 (100.0%) | 0 (0.0%) |
| High School Diploma | 75 (35.9%) | 134 (64.1%) |
| College or Associate's Degree | 76 (81.7%) | 17 (18.3%) |
| Bachelor's Degree | 87 (90.6%) | 9 (9.4%) |
| Graduate Degree | 25 (51.0%) | 24 (49.0%) |
| Total | 282 (60.5%) | 184 (39.5%) |
Employment Characteristics in Rohnert Park
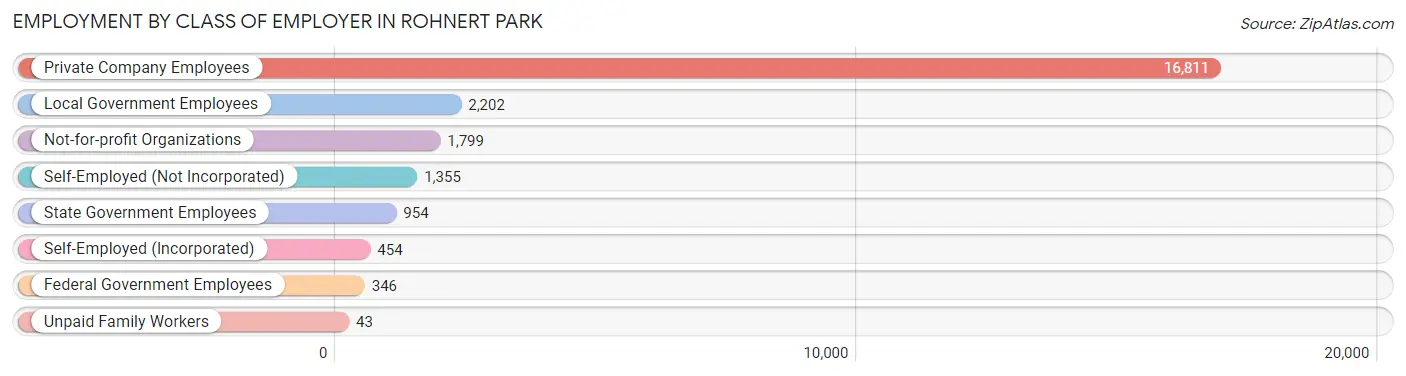
Employment by Class of Employer in Rohnert Park
Among the 23,964 employed individuals in Rohnert Park, private company employees (16,811 | 70.2%), local government employees (2,202 | 9.2%), and not-for-profit organizations (1,799 | 7.5%) make up the most common classes of employment.
| Employer Class | # Employees | % Employees |
| Private Company Employees | 16,811 | 70.2% |
| Self-Employed (Incorporated) | 454 | 1.9% |
| Self-Employed (Not Incorporated) | 1,355 | 5.7% |
| Not-for-profit Organizations | 1,799 | 7.5% |
| Local Government Employees | 2,202 | 9.2% |
| State Government Employees | 954 | 4.0% |
| Federal Government Employees | 346 | 1.4% |
| Unpaid Family Workers | 43 | 0.2% |
| Total | 23,964 | 100.0% |
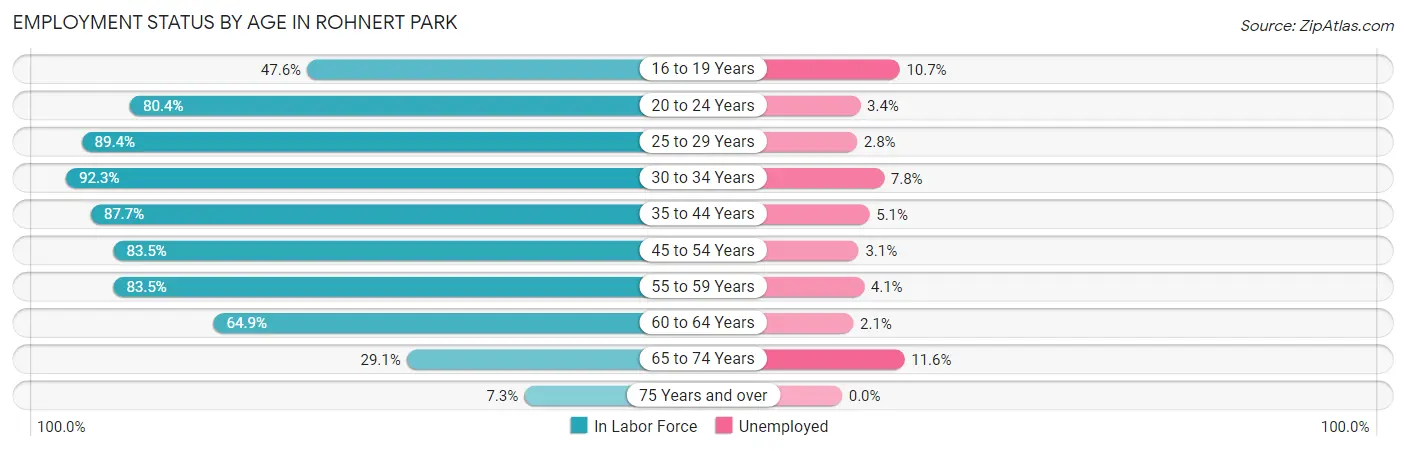
Employment Status by Age in Rohnert Park
According to the labor force statistics for Rohnert Park, out of the total population over 16 years of age (36,339), 71.0% or 25,801 individuals are in the labor force, with 4.8% or 1,238 of them unemployed. The age group with the highest labor force participation rate is 30 to 34 years, with 92.3% or 3,353 individuals in the labor force. Within the labor force, the 65 to 74 years age range has the highest percentage of unemployed individuals, with 11.6% or 134 of them being unemployed.
| Age Bracket | In Labor Force | Unemployed |
| 16 to 19 Years | 948 (47.6%) | 101 (10.7%) |
| 20 to 24 Years | 3,799 (80.4%) | 129 (3.4%) |
| 25 to 29 Years | 3,118 (89.4%) | 87 (2.8%) |
| 30 to 34 Years | 3,353 (92.3%) | 262 (7.8%) |
| 35 to 44 Years | 5,360 (87.7%) | 273 (5.1%) |
| 45 to 54 Years | 3,481 (83.5%) | 108 (3.1%) |
| 55 to 59 Years | 2,558 (83.5%) | 105 (4.1%) |
| 60 to 64 Years | 1,870 (64.9%) | 39 (2.1%) |
| 65 to 74 Years | 1,152 (29.1%) | 134 (11.6%) |
| 75 Years and over | 169 (7.3%) | 0 (0.0%) |
| Total | 25,801 (71.0%) | 1,238 (4.8%) |
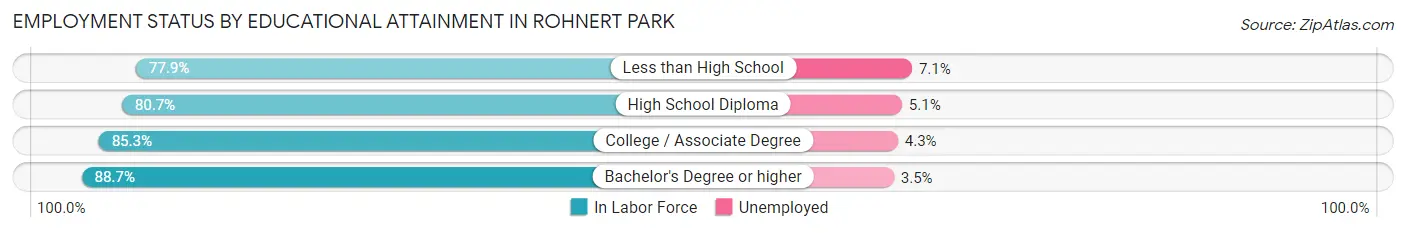
Employment Status by Educational Attainment in Rohnert Park
According to labor force statistics for Rohnert Park, 84.6% of individuals (19,752) out of the total population between 25 and 64 years of age (23,348) are in the labor force, with 4.4% or 869 of them being unemployed. The group with the highest labor force participation rate are those with the educational attainment of bachelor's degree or higher, with 88.7% or 6,287 individuals in the labor force. Within the labor force, individuals with less than high school education have the highest percentage of unemployment, with 7.1% or 119 of them being unemployed.
| Educational Attainment | In Labor Force | Unemployed |
| Less than High School | 1,676 (77.9%) | 153 (7.1%) |
| High School Diploma | 4,463 (80.7%) | 282 (5.1%) |
| College / Associate Degree | 7,318 (85.3%) | 369 (4.3%) |
| Bachelor's Degree or higher | 6,287 (88.7%) | 248 (3.5%) |
| Total | 19,752 (84.6%) | 1,027 (4.4%) |
Employment Occupations by Sex in Rohnert Park
Management, Business, Science and Arts Occupations
The most common Management, Business, Science and Arts occupations in Rohnert Park are Community & Social Service (2,484 | 10.1%), Management (2,287 | 9.3%), Health Diagnosing & Treating (1,402 | 5.7%), Computers, Engineering & Science (1,379 | 5.6%), and Education Instruction & Library (1,306 | 5.3%).
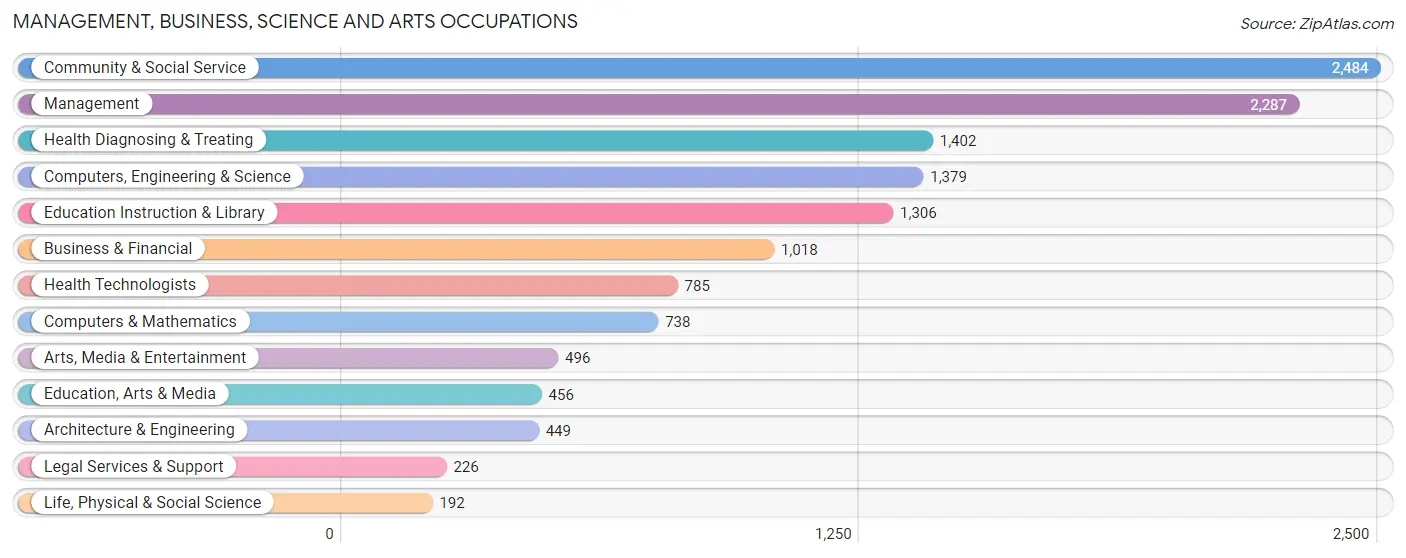
Management, Business, Science and Arts Occupations by Sex
Within the Management, Business, Science and Arts occupations in Rohnert Park, the most male-oriented occupations are Computers & Mathematics (86.2%), Computers, Engineering & Science (78.0%), and Architecture & Engineering (77.7%), while the most female-oriented occupations are Education, Arts & Media (90.3%), Education Instruction & Library (83.4%), and Community & Social Service (75.6%).
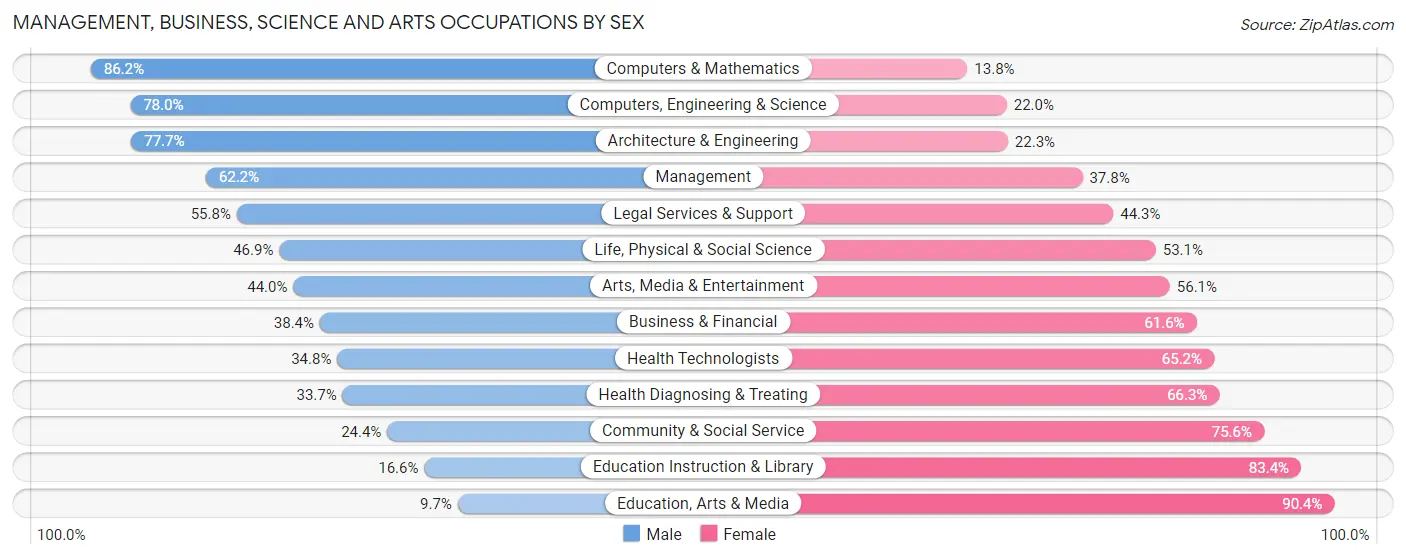
| Occupation | Male | Female |
| Management | 1,422 (62.2%) | 865 (37.8%) |
| Business & Financial | 391 (38.4%) | 627 (61.6%) |
| Computers, Engineering & Science | 1,075 (78.0%) | 304 (22.0%) |
| Computers & Mathematics | 636 (86.2%) | 102 (13.8%) |
| Architecture & Engineering | 349 (77.7%) | 100 (22.3%) |
| Life, Physical & Social Science | 90 (46.9%) | 102 (53.1%) |
| Community & Social Service | 605 (24.4%) | 1,879 (75.6%) |
| Education, Arts & Media | 44 (9.7%) | 412 (90.3%) |
| Legal Services & Support | 126 (55.7%) | 100 (44.3%) |
| Education Instruction & Library | 217 (16.6%) | 1,089 (83.4%) |
| Arts, Media & Entertainment | 218 (44.0%) | 278 (56.0%) |
| Health Diagnosing & Treating | 472 (33.7%) | 930 (66.3%) |
| Health Technologists | 273 (34.8%) | 512 (65.2%) |
| Total (Category) | 3,965 (46.3%) | 4,605 (53.7%) |
| Total (Overall) | 13,052 (53.2%) | 11,458 (46.8%) |
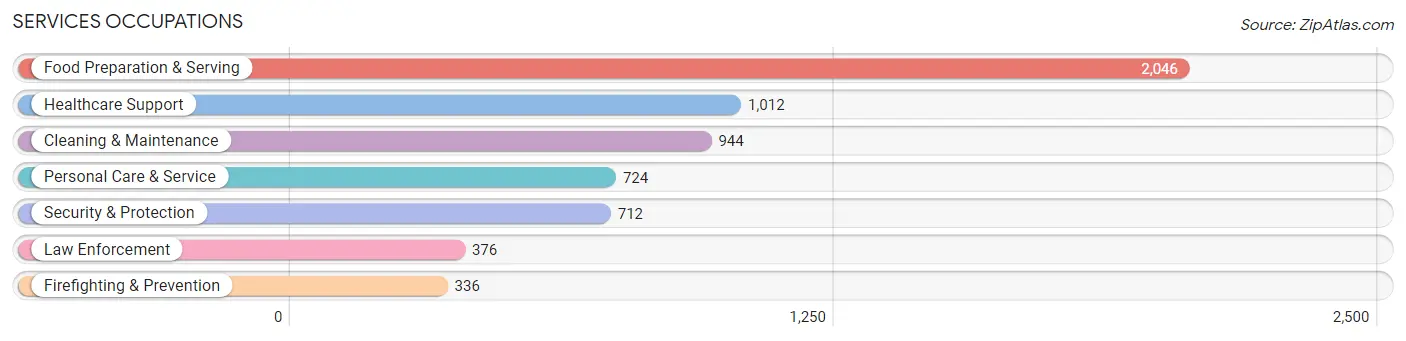
Services Occupations
The most common Services occupations in Rohnert Park are Food Preparation & Serving (2,046 | 8.4%), Healthcare Support (1,012 | 4.1%), Cleaning & Maintenance (944 | 3.8%), Personal Care & Service (724 | 2.9%), and Security & Protection (712 | 2.9%).
Services Occupations by Sex
Within the Services occupations in Rohnert Park, the most male-oriented occupations are Firefighting & Prevention (83.9%), Security & Protection (72.5%), and Cleaning & Maintenance (72.5%), while the most female-oriented occupations are Healthcare Support (95.1%), Personal Care & Service (68.1%), and Food Preparation & Serving (40.8%).
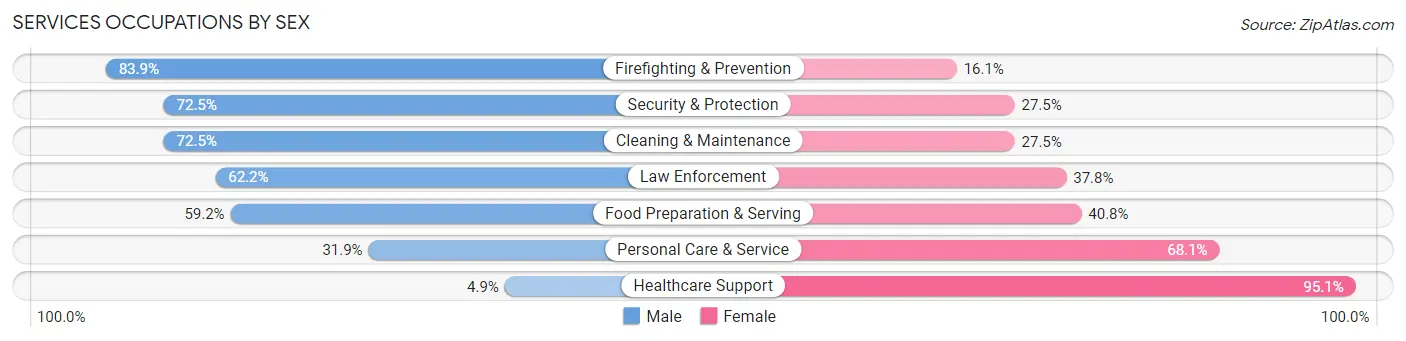
| Occupation | Male | Female |
| Healthcare Support | 50 (4.9%) | 962 (95.1%) |
| Security & Protection | 516 (72.5%) | 196 (27.5%) |
| Firefighting & Prevention | 282 (83.9%) | 54 (16.1%) |
| Law Enforcement | 234 (62.2%) | 142 (37.8%) |
| Food Preparation & Serving | 1,212 (59.2%) | 834 (40.8%) |
| Cleaning & Maintenance | 684 (72.5%) | 260 (27.5%) |
| Personal Care & Service | 231 (31.9%) | 493 (68.1%) |
| Total (Category) | 2,693 (49.5%) | 2,745 (50.5%) |
| Total (Overall) | 13,052 (53.2%) | 11,458 (46.8%) |
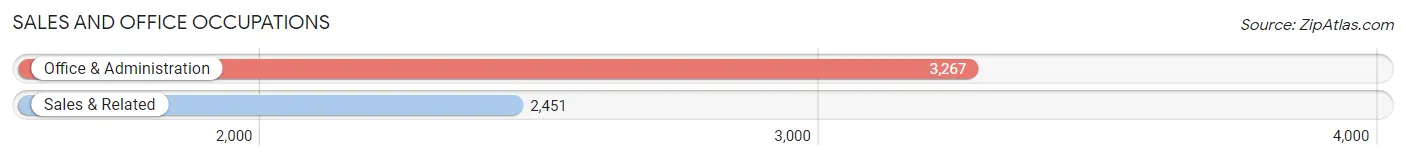
Sales and Office Occupations
The most common Sales and Office occupations in Rohnert Park are Office & Administration (3,267 | 13.3%), and Sales & Related (2,451 | 10.0%).
Sales and Office Occupations by Sex
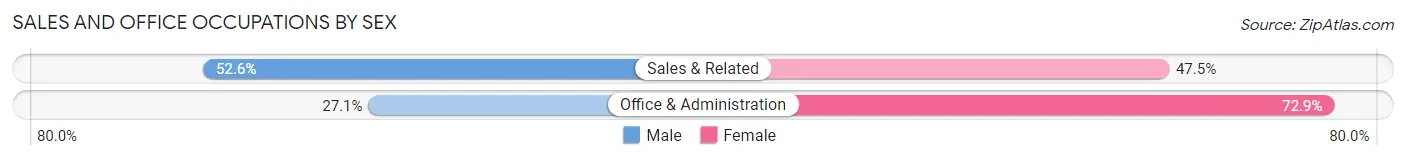
| Occupation | Male | Female |
| Sales & Related | 1,288 (52.5%) | 1,163 (47.4%) |
| Office & Administration | 886 (27.1%) | 2,381 (72.9%) |
| Total (Category) | 2,174 (38.0%) | 3,544 (62.0%) |
| Total (Overall) | 13,052 (53.2%) | 11,458 (46.8%) |
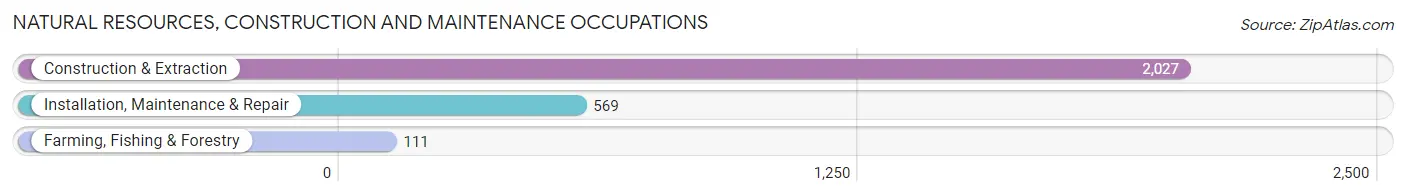
Natural Resources, Construction and Maintenance Occupations
The most common Natural Resources, Construction and Maintenance occupations in Rohnert Park are Construction & Extraction (2,027 | 8.3%), Installation, Maintenance & Repair (569 | 2.3%), and Farming, Fishing & Forestry (111 | 0.4%).
Natural Resources, Construction and Maintenance Occupations by Sex
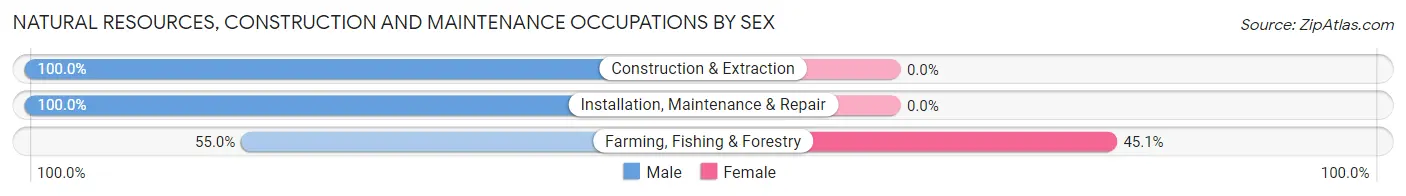
| Occupation | Male | Female |
| Farming, Fishing & Forestry | 61 (54.9%) | 50 (45.1%) |
| Construction & Extraction | 2,027 (100.0%) | 0 (0.0%) |
| Installation, Maintenance & Repair | 569 (100.0%) | 0 (0.0%) |
| Total (Category) | 2,657 (98.2%) | 50 (1.8%) |
| Total (Overall) | 13,052 (53.2%) | 11,458 (46.8%) |
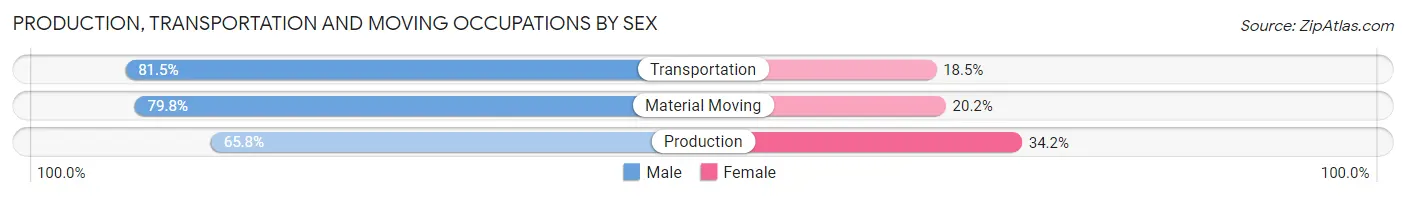
Production, Transportation and Moving Occupations
The most common Production, Transportation and Moving occupations in Rohnert Park are Production (755 | 3.1%), Material Moving (683 | 2.8%), and Transportation (639 | 2.6%).
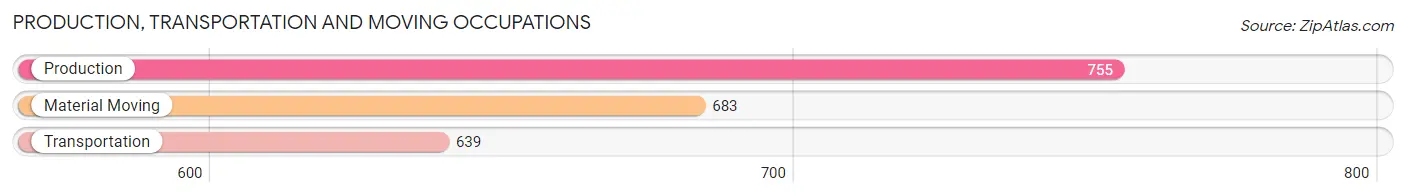
Production, Transportation and Moving Occupations by Sex
| Occupation | Male | Female |
| Production | 497 (65.8%) | 258 (34.2%) |
| Transportation | 521 (81.5%) | 118 (18.5%) |
| Material Moving | 545 (79.8%) | 138 (20.2%) |
| Total (Category) | 1,563 (75.2%) | 514 (24.7%) |
| Total (Overall) | 13,052 (53.2%) | 11,458 (46.8%) |
Employment Industries by Sex in Rohnert Park
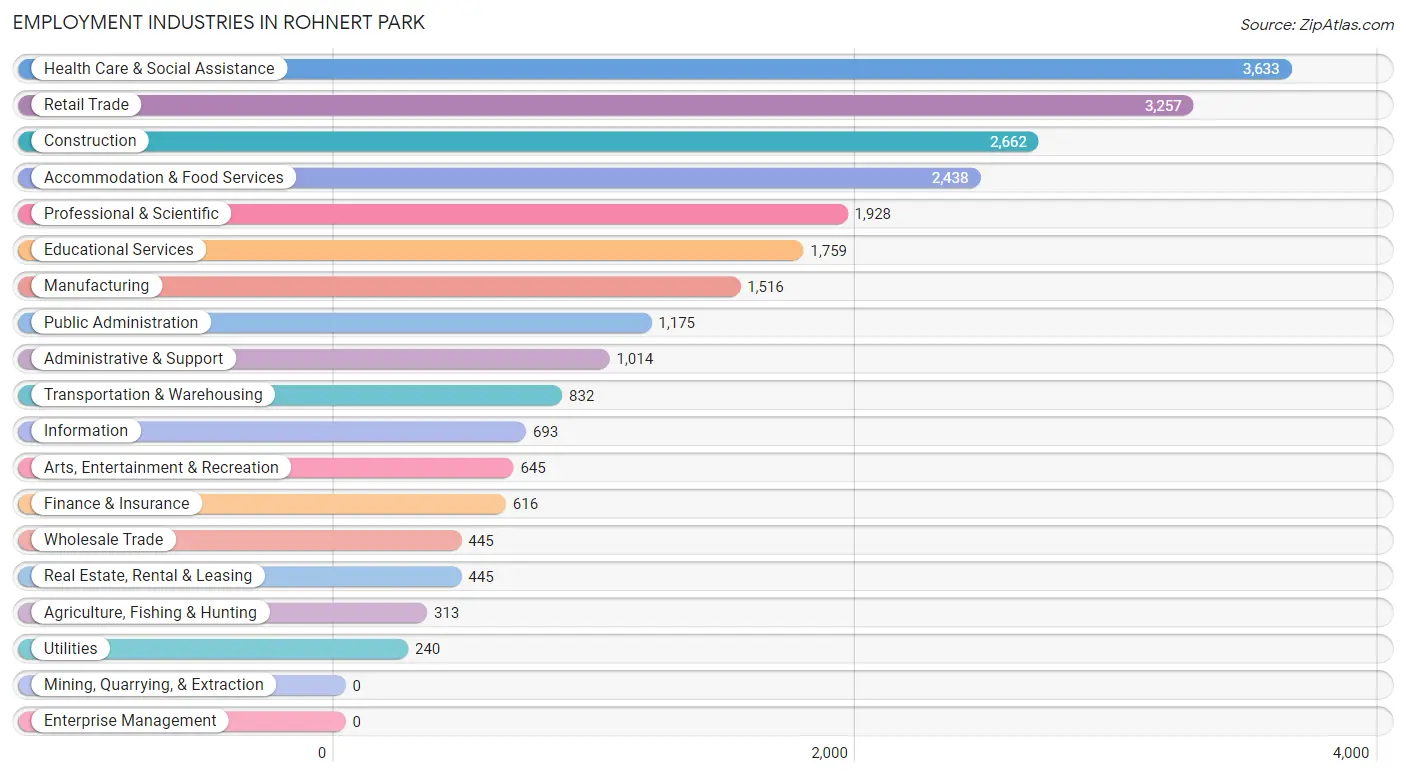
Employment Industries in Rohnert Park
The major employment industries in Rohnert Park include Health Care & Social Assistance (3,633 | 14.8%), Retail Trade (3,257 | 13.3%), Construction (2,662 | 10.9%), Accommodation & Food Services (2,438 | 10.0%), and Professional & Scientific (1,928 | 7.9%).
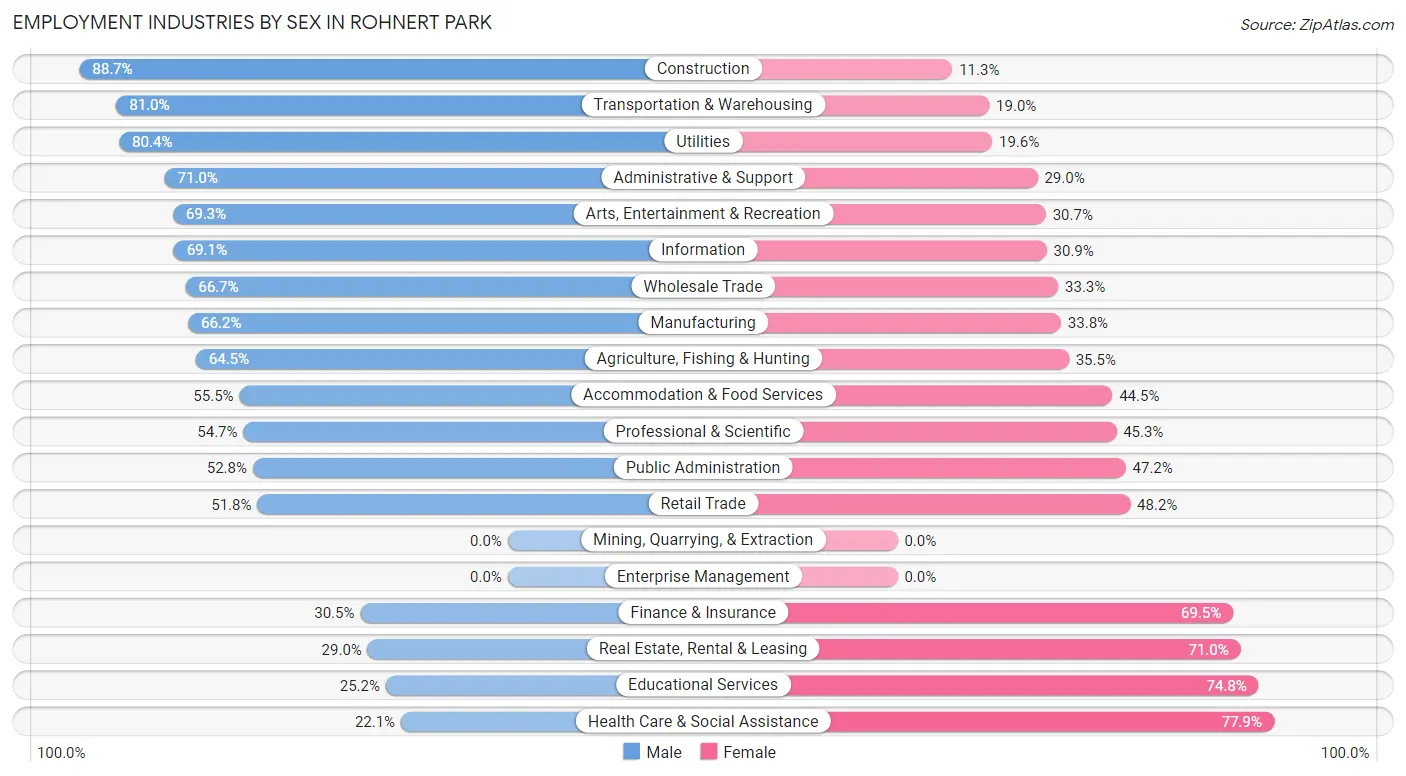
Employment Industries by Sex in Rohnert Park
The Rohnert Park industries that see more men than women are Construction (88.7%), Transportation & Warehousing (81.0%), and Utilities (80.4%), whereas the industries that tend to have a higher number of women are Health Care & Social Assistance (77.9%), Educational Services (74.8%), and Real Estate, Rental & Leasing (71.0%).
| Industry | Male | Female |
| Agriculture, Fishing & Hunting | 202 (64.5%) | 111 (35.5%) |
| Mining, Quarrying, & Extraction | 0 (0.0%) | 0 (0.0%) |
| Construction | 2,360 (88.7%) | 302 (11.3%) |
| Manufacturing | 1,003 (66.2%) | 513 (33.8%) |
| Wholesale Trade | 297 (66.7%) | 148 (33.3%) |
| Retail Trade | 1,688 (51.8%) | 1,569 (48.2%) |
| Transportation & Warehousing | 674 (81.0%) | 158 (19.0%) |
| Utilities | 193 (80.4%) | 47 (19.6%) |
| Information | 479 (69.1%) | 214 (30.9%) |
| Finance & Insurance | 188 (30.5%) | 428 (69.5%) |
| Real Estate, Rental & Leasing | 129 (29.0%) | 316 (71.0%) |
| Professional & Scientific | 1,055 (54.7%) | 873 (45.3%) |
| Enterprise Management | 0 (0.0%) | 0 (0.0%) |
| Administrative & Support | 720 (71.0%) | 294 (29.0%) |
| Educational Services | 444 (25.2%) | 1,315 (74.8%) |
| Health Care & Social Assistance | 803 (22.1%) | 2,830 (77.9%) |
| Arts, Entertainment & Recreation | 447 (69.3%) | 198 (30.7%) |
| Accommodation & Food Services | 1,354 (55.5%) | 1,084 (44.5%) |
| Public Administration | 620 (52.8%) | 555 (47.2%) |
| Total | 13,052 (53.2%) | 11,458 (46.8%) |
Education in Rohnert Park
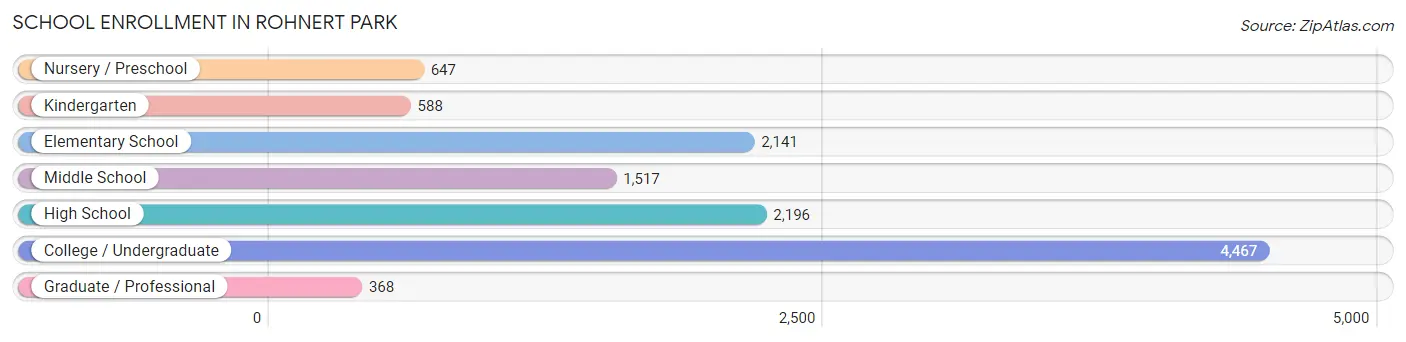
School Enrollment in Rohnert Park
The most common levels of schooling among the 11,924 students in Rohnert Park are college / undergraduate (4,467 | 37.5%), high school (2,196 | 18.4%), and elementary school (2,141 | 18.0%).
| School Level | # Students | % Students |
| Nursery / Preschool | 647 | 5.4% |
| Kindergarten | 588 | 4.9% |
| Elementary School | 2,141 | 18.0% |
| Middle School | 1,517 | 12.7% |
| High School | 2,196 | 18.4% |
| College / Undergraduate | 4,467 | 37.5% |
| Graduate / Professional | 368 | 3.1% |
| Total | 11,924 | 100.0% |
School Enrollment by Age by Funding Source in Rohnert Park
Out of a total of 11,924 students who are enrolled in schools in Rohnert Park, 1,025 (8.6%) attend a private institution, while the remaining 10,899 (91.4%) are enrolled in public schools. The age group of 3 to 4 year olds has the highest likelihood of being enrolled in private schools, with 242 (45.9% in the age bracket) enrolled. Conversely, the age group of 18 to 19 year olds has the lowest likelihood of being enrolled in a private school, with 942 (100.0% in the age bracket) attending a public institution.
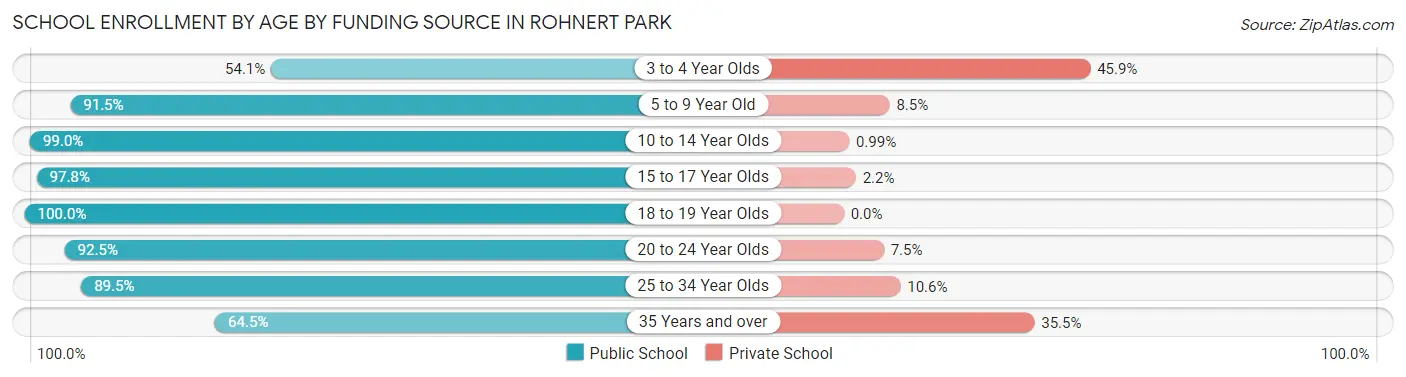
| Age Bracket | Public School | Private School |
| 3 to 4 Year Olds | 285 (54.1%) | 242 (45.9%) |
| 5 to 9 Year Old | 2,381 (91.5%) | 222 (8.5%) |
| 10 to 14 Year Olds | 1,997 (99.0%) | 20 (1.0%) |
| 15 to 17 Year Olds | 1,354 (97.8%) | 31 (2.2%) |
| 18 to 19 Year Olds | 942 (100.0%) | 0 (0.0%) |
| 20 to 24 Year Olds | 2,442 (92.5%) | 197 (7.5%) |
| 25 to 34 Year Olds | 1,179 (89.4%) | 139 (10.5%) |
| 35 Years and over | 318 (64.5%) | 175 (35.5%) |
| Total | 10,899 (91.4%) | 1,025 (8.6%) |
Educational Attainment by Field of Study in Rohnert Park
Business (1,990 | 19.2%), social sciences (1,193 | 11.5%), science & technology (993 | 9.6%), visual & performing arts (922 | 8.9%), and literature & languages (680 | 6.6%) are the most common fields of study among 10,365 individuals in Rohnert Park who have obtained a bachelor's degree or higher.
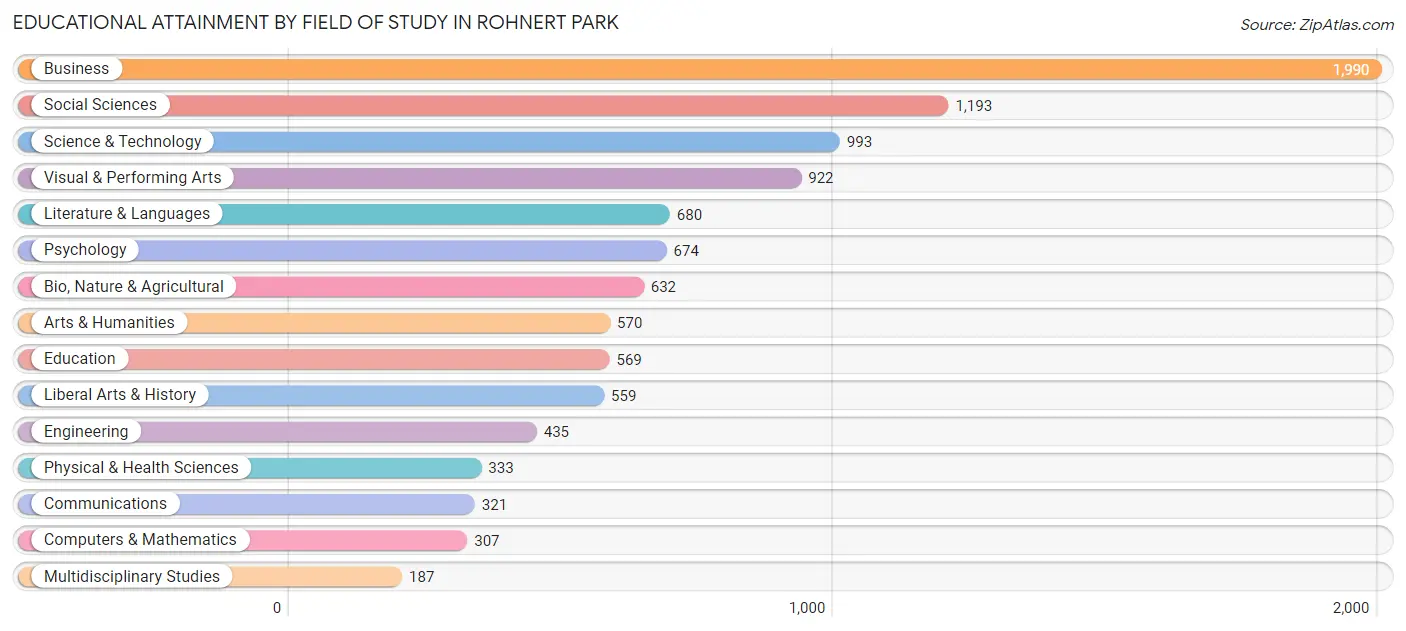
| Field of Study | # Graduates | % Graduates |
| Computers & Mathematics | 307 | 3.0% |
| Bio, Nature & Agricultural | 632 | 6.1% |
| Physical & Health Sciences | 333 | 3.2% |
| Psychology | 674 | 6.5% |
| Social Sciences | 1,193 | 11.5% |
| Engineering | 435 | 4.2% |
| Multidisciplinary Studies | 187 | 1.8% |
| Science & Technology | 993 | 9.6% |
| Business | 1,990 | 19.2% |
| Education | 569 | 5.5% |
| Literature & Languages | 680 | 6.6% |
| Liberal Arts & History | 559 | 5.4% |
| Visual & Performing Arts | 922 | 8.9% |
| Communications | 321 | 3.1% |
| Arts & Humanities | 570 | 5.5% |
| Total | 10,365 | 100.0% |
Transportation & Commute in Rohnert Park
Vehicle Availability by Sex in Rohnert Park
The most prevalent vehicle ownership categories in Rohnert Park are males with 2 vehicles (5,059, accounting for 39.5%) and females with 2 vehicles (4,630, making up 45.7%).
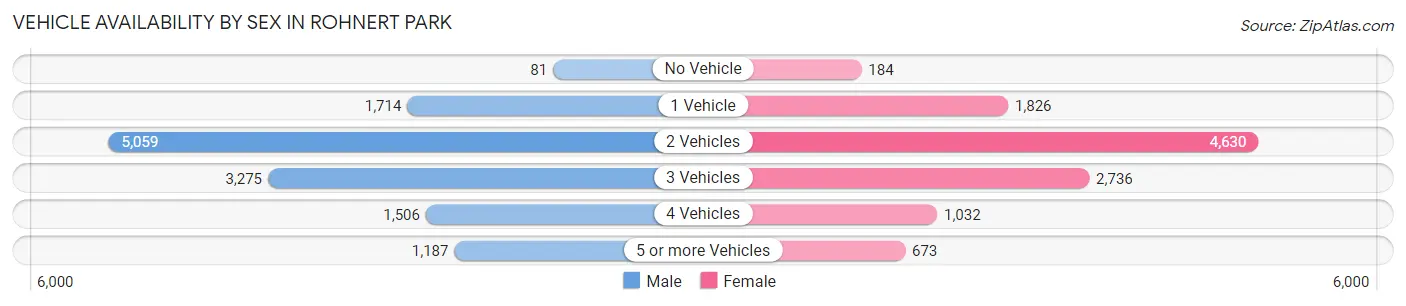
| Vehicles Available | Male | Female |
| No Vehicle | 81 (0.6%) | 184 (1.7%) |
| 1 Vehicle | 1,714 (13.4%) | 1,826 (16.5%) |
| 2 Vehicles | 5,059 (39.5%) | 4,630 (41.8%) |
| 3 Vehicles | 3,275 (25.5%) | 2,736 (24.7%) |
| 4 Vehicles | 1,506 (11.7%) | 1,032 (9.3%) |
| 5 or more Vehicles | 1,187 (9.3%) | 673 (6.1%) |
| Total | 12,822 (100.0%) | 11,081 (100.0%) |
Commute Time in Rohnert Park
The most frequently occuring commute durations in Rohnert Park are 20 to 24 minutes (3,658 commuters, 16.9%), 15 to 19 minutes (3,309 commuters, 15.2%), and 10 to 14 minutes (2,718 commuters, 12.5%).
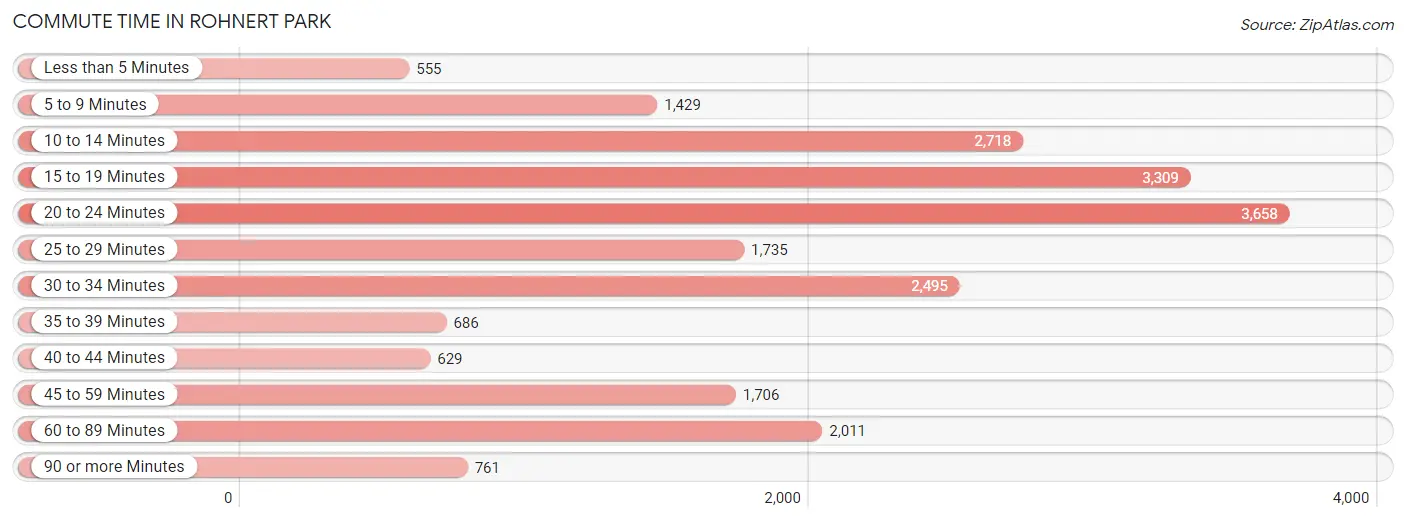
| Commute Time | # Commuters | % Commuters |
| Less than 5 Minutes | 555 | 2.6% |
| 5 to 9 Minutes | 1,429 | 6.6% |
| 10 to 14 Minutes | 2,718 | 12.5% |
| 15 to 19 Minutes | 3,309 | 15.2% |
| 20 to 24 Minutes | 3,658 | 16.9% |
| 25 to 29 Minutes | 1,735 | 8.0% |
| 30 to 34 Minutes | 2,495 | 11.5% |
| 35 to 39 Minutes | 686 | 3.2% |
| 40 to 44 Minutes | 629 | 2.9% |
| 45 to 59 Minutes | 1,706 | 7.9% |
| 60 to 89 Minutes | 2,011 | 9.3% |
| 90 or more Minutes | 761 | 3.5% |
Commute Time by Sex in Rohnert Park
The most common commute times in Rohnert Park are 10 to 14 minutes (1,780 commuters, 15.0%) for males and 20 to 24 minutes (1,935 commuters, 19.7%) for females.
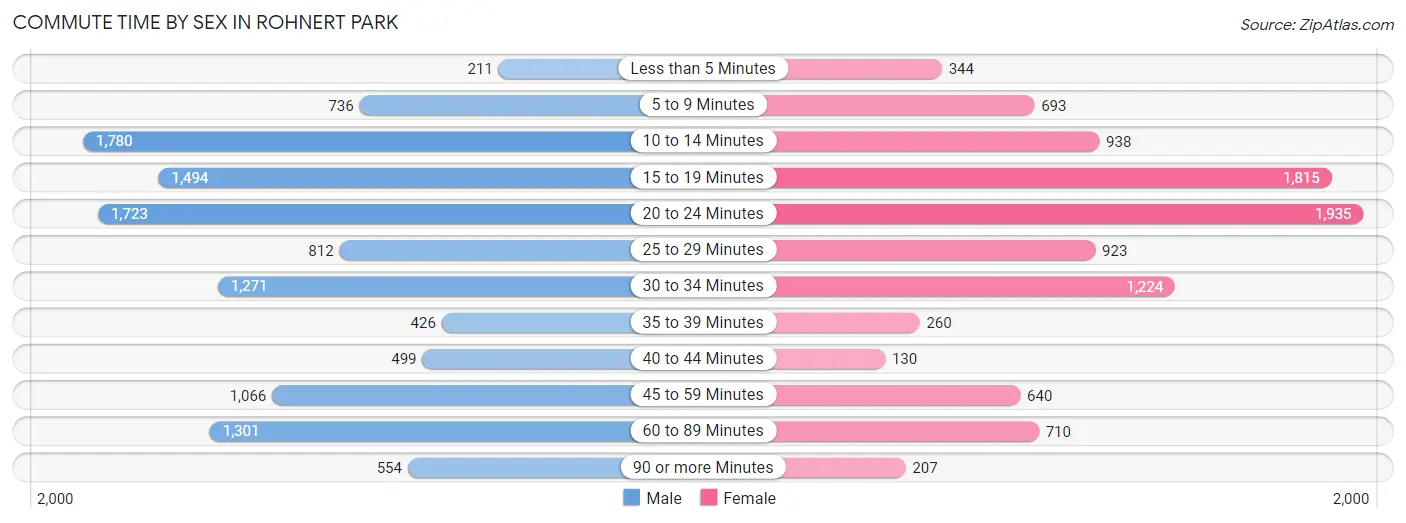
| Commute Time | Male | Female |
| Less than 5 Minutes | 211 (1.8%) | 344 (3.5%) |
| 5 to 9 Minutes | 736 (6.2%) | 693 (7.1%) |
| 10 to 14 Minutes | 1,780 (15.0%) | 938 (9.6%) |
| 15 to 19 Minutes | 1,494 (12.6%) | 1,815 (18.5%) |
| 20 to 24 Minutes | 1,723 (14.5%) | 1,935 (19.7%) |
| 25 to 29 Minutes | 812 (6.8%) | 923 (9.4%) |
| 30 to 34 Minutes | 1,271 (10.7%) | 1,224 (12.5%) |
| 35 to 39 Minutes | 426 (3.6%) | 260 (2.6%) |
| 40 to 44 Minutes | 499 (4.2%) | 130 (1.3%) |
| 45 to 59 Minutes | 1,066 (9.0%) | 640 (6.5%) |
| 60 to 89 Minutes | 1,301 (11.0%) | 710 (7.2%) |
| 90 or more Minutes | 554 (4.7%) | 207 (2.1%) |
Time of Departure to Work by Sex in Rohnert Park
The most frequent times of departure to work in Rohnert Park are 7:00 AM to 7:29 AM (1,668, 14.1%) for males and 7:30 AM to 7:59 AM (1,636, 16.7%) for females.
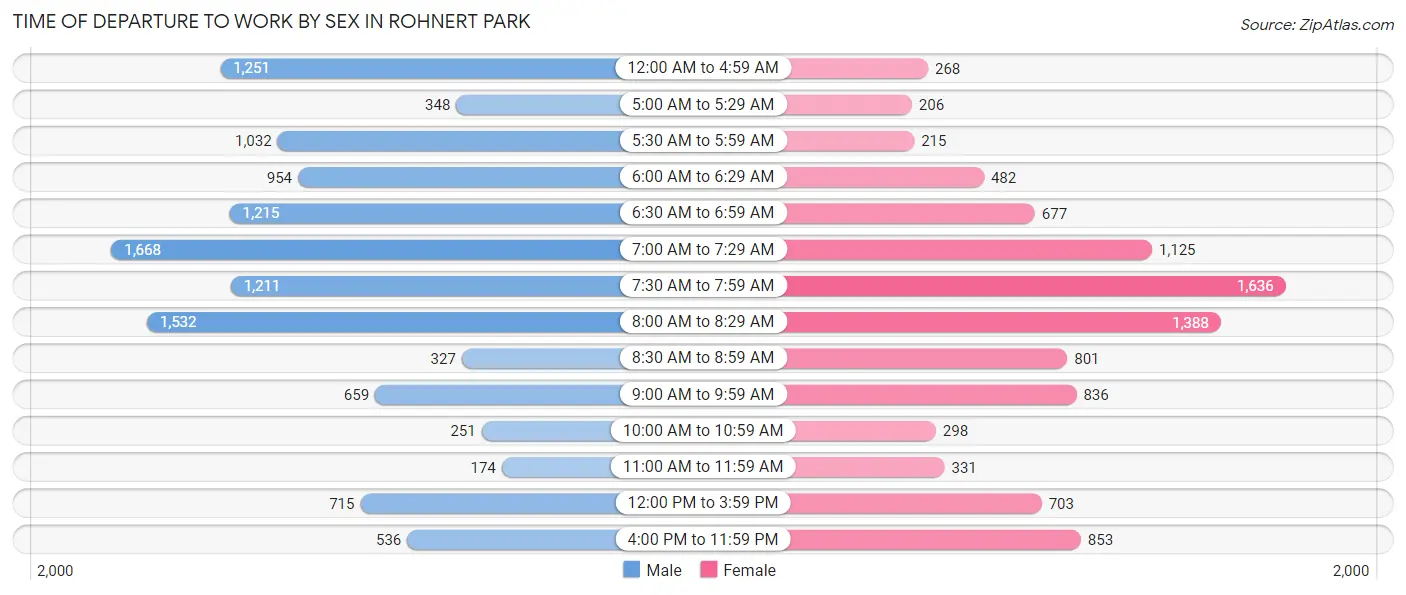
| Time of Departure | Male | Female |
| 12:00 AM to 4:59 AM | 1,251 (10.5%) | 268 (2.7%) |
| 5:00 AM to 5:29 AM | 348 (2.9%) | 206 (2.1%) |
| 5:30 AM to 5:59 AM | 1,032 (8.7%) | 215 (2.2%) |
| 6:00 AM to 6:29 AM | 954 (8.0%) | 482 (4.9%) |
| 6:30 AM to 6:59 AM | 1,215 (10.2%) | 677 (6.9%) |
| 7:00 AM to 7:29 AM | 1,668 (14.1%) | 1,125 (11.5%) |
| 7:30 AM to 7:59 AM | 1,211 (10.2%) | 1,636 (16.7%) |
| 8:00 AM to 8:29 AM | 1,532 (12.9%) | 1,388 (14.1%) |
| 8:30 AM to 8:59 AM | 327 (2.8%) | 801 (8.2%) |
| 9:00 AM to 9:59 AM | 659 (5.6%) | 836 (8.5%) |
| 10:00 AM to 10:59 AM | 251 (2.1%) | 298 (3.0%) |
| 11:00 AM to 11:59 AM | 174 (1.5%) | 331 (3.4%) |
| 12:00 PM to 3:59 PM | 715 (6.0%) | 703 (7.2%) |
| 4:00 PM to 11:59 PM | 536 (4.5%) | 853 (8.7%) |
| Total | 11,873 (100.0%) | 9,819 (100.0%) |
Housing Occupancy in Rohnert Park
Occupancy by Ownership in Rohnert Park
Of the total 16,979 dwellings in Rohnert Park, owner-occupied units account for 8,546 (50.3%), while renter-occupied units make up 8,433 (49.7%).
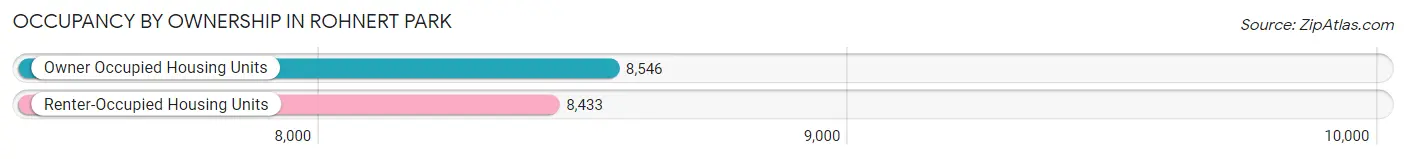
| Occupancy | # Housing Units | % Housing Units |
| Owner Occupied Housing Units | 8,546 | 50.3% |
| Renter-Occupied Housing Units | 8,433 | 49.7% |
| Total Occupied Housing Units | 16,979 | 100.0% |
Occupancy by Household Size in Rohnert Park
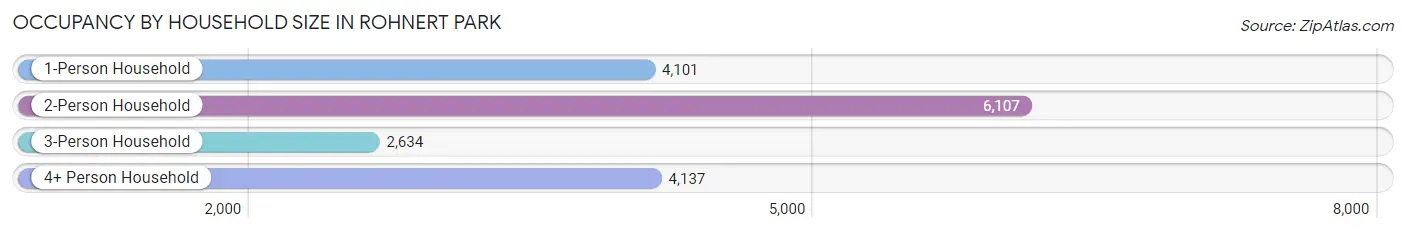
| Household Size | # Housing Units | % Housing Units |
| 1-Person Household | 4,101 | 24.1% |
| 2-Person Household | 6,107 | 36.0% |
| 3-Person Household | 2,634 | 15.5% |
| 4+ Person Household | 4,137 | 24.4% |
| Total Housing Units | 16,979 | 100.0% |
Occupancy by Ownership by Household Size in Rohnert Park
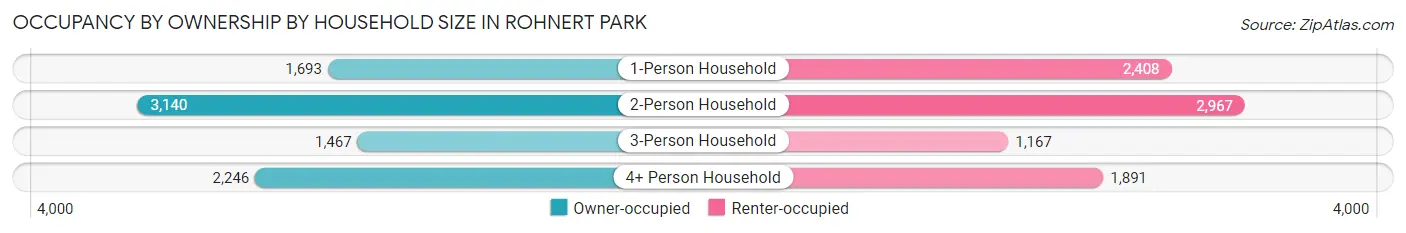
| Household Size | Owner-occupied | Renter-occupied |
| 1-Person Household | 1,693 (41.3%) | 2,408 (58.7%) |
| 2-Person Household | 3,140 (51.4%) | 2,967 (48.6%) |
| 3-Person Household | 1,467 (55.7%) | 1,167 (44.3%) |
| 4+ Person Household | 2,246 (54.3%) | 1,891 (45.7%) |
| Total Housing Units | 8,546 (50.3%) | 8,433 (49.7%) |
Occupancy by Educational Attainment in Rohnert Park
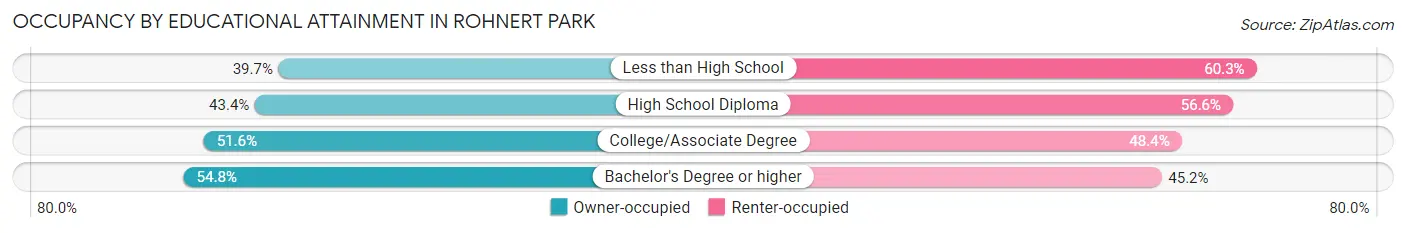
| Household Size | Owner-occupied | Renter-occupied |
| Less than High School | 385 (39.7%) | 585 (60.3%) |
| High School Diploma | 1,513 (43.4%) | 1,971 (56.6%) |
| College/Associate Degree | 3,427 (51.6%) | 3,217 (48.4%) |
| Bachelor's Degree or higher | 3,221 (54.8%) | 2,660 (45.2%) |
Occupancy by Age of Householder in Rohnert Park
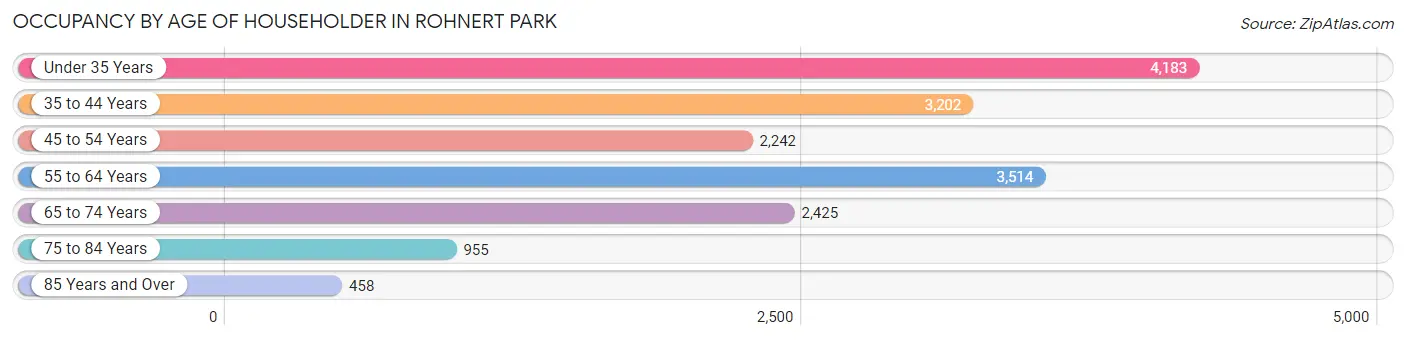
| Age Bracket | # Households | % Households |
| Under 35 Years | 4,183 | 24.6% |
| 35 to 44 Years | 3,202 | 18.9% |
| 45 to 54 Years | 2,242 | 13.2% |
| 55 to 64 Years | 3,514 | 20.7% |
| 65 to 74 Years | 2,425 | 14.3% |
| 75 to 84 Years | 955 | 5.6% |
| 85 Years and Over | 458 | 2.7% |
| Total | 16,979 | 100.0% |
Housing Finances in Rohnert Park
Median Income by Occupancy in Rohnert Park
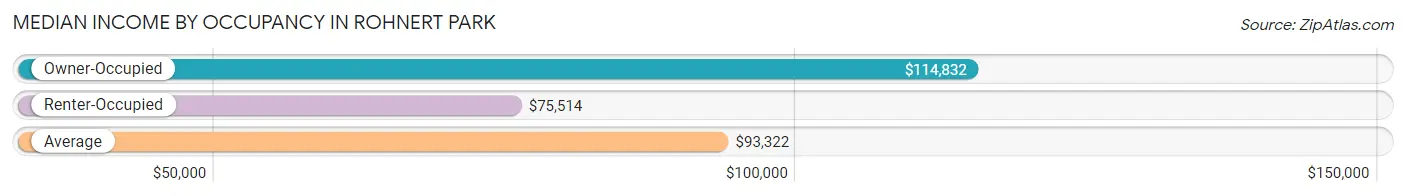
| Occupancy Type | # Households | Median Income |
| Owner-Occupied | 8,546 (50.3%) | $114,832 |
| Renter-Occupied | 8,433 (49.7%) | $75,514 |
| Average | 16,979 (100.0%) | $93,322 |
Occupancy by Householder Income Bracket in Rohnert Park
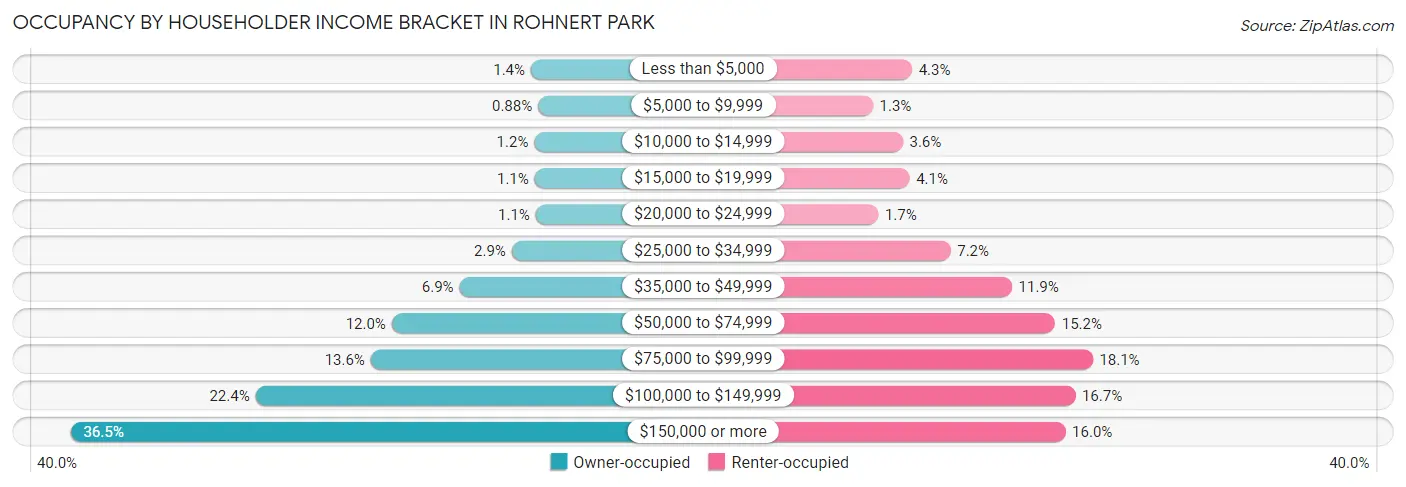
| Income Bracket | Owner-occupied | Renter-occupied |
| Less than $5,000 | 122 (1.4%) | 361 (4.3%) |
| $5,000 to $9,999 | 75 (0.9%) | 110 (1.3%) |
| $10,000 to $14,999 | 100 (1.2%) | 302 (3.6%) |
| $15,000 to $19,999 | 97 (1.1%) | 345 (4.1%) |
| $20,000 to $24,999 | 91 (1.1%) | 144 (1.7%) |
| $25,000 to $34,999 | 247 (2.9%) | 609 (7.2%) |
| $35,000 to $49,999 | 587 (6.9%) | 1,003 (11.9%) |
| $50,000 to $74,999 | 1,028 (12.0%) | 1,280 (15.2%) |
| $75,000 to $99,999 | 1,165 (13.6%) | 1,522 (18.0%) |
| $100,000 to $149,999 | 1,915 (22.4%) | 1,410 (16.7%) |
| $150,000 or more | 3,119 (36.5%) | 1,347 (16.0%) |
| Total | 8,546 (100.0%) | 8,433 (100.0%) |
Monthly Housing Cost Tiers in Rohnert Park
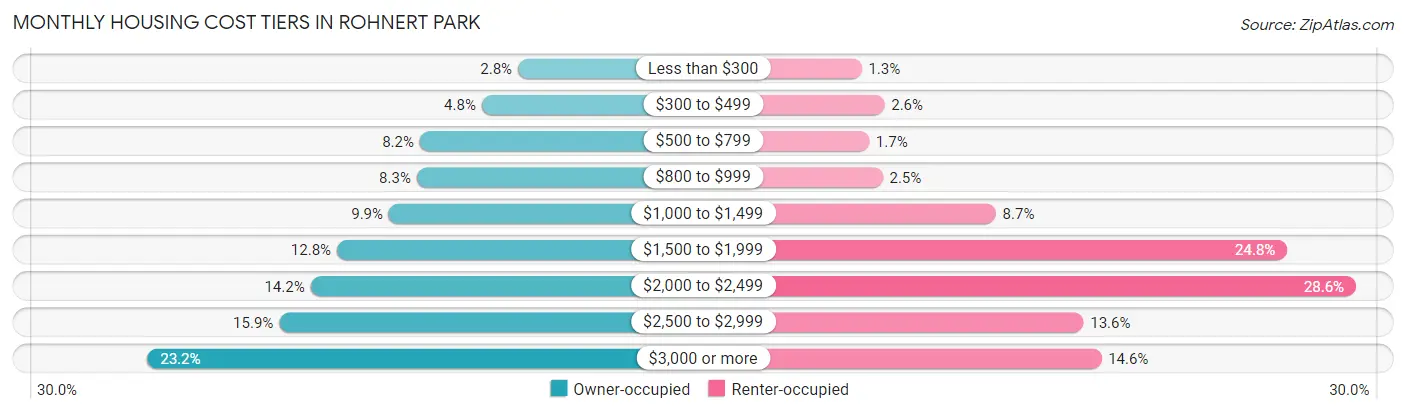
| Monthly Cost | Owner-occupied | Renter-occupied |
| Less than $300 | 235 (2.8%) | 112 (1.3%) |
| $300 to $499 | 406 (4.8%) | 218 (2.6%) |
| $500 to $799 | 698 (8.2%) | 147 (1.7%) |
| $800 to $999 | 713 (8.3%) | 210 (2.5%) |
| $1,000 to $1,499 | 844 (9.9%) | 737 (8.7%) |
| $1,500 to $1,999 | 1,090 (12.8%) | 2,095 (24.8%) |
| $2,000 to $2,499 | 1,214 (14.2%) | 2,415 (28.6%) |
| $2,500 to $2,999 | 1,362 (15.9%) | 1,145 (13.6%) |
| $3,000 or more | 1,984 (23.2%) | 1,229 (14.6%) |
| Total | 8,546 (100.0%) | 8,433 (100.0%) |
Physical Housing Characteristics in Rohnert Park
Housing Structures in Rohnert Park
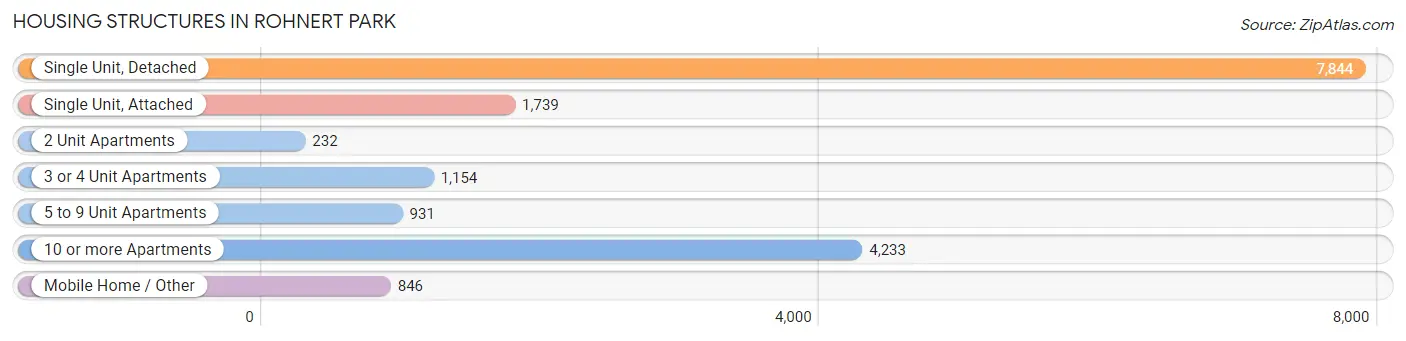
| Structure Type | # Housing Units | % Housing Units |
| Single Unit, Detached | 7,844 | 46.2% |
| Single Unit, Attached | 1,739 | 10.2% |
| 2 Unit Apartments | 232 | 1.4% |
| 3 or 4 Unit Apartments | 1,154 | 6.8% |
| 5 to 9 Unit Apartments | 931 | 5.5% |
| 10 or more Apartments | 4,233 | 24.9% |
| Mobile Home / Other | 846 | 5.0% |
| Total | 16,979 | 100.0% |
Housing Structures by Occupancy in Rohnert Park
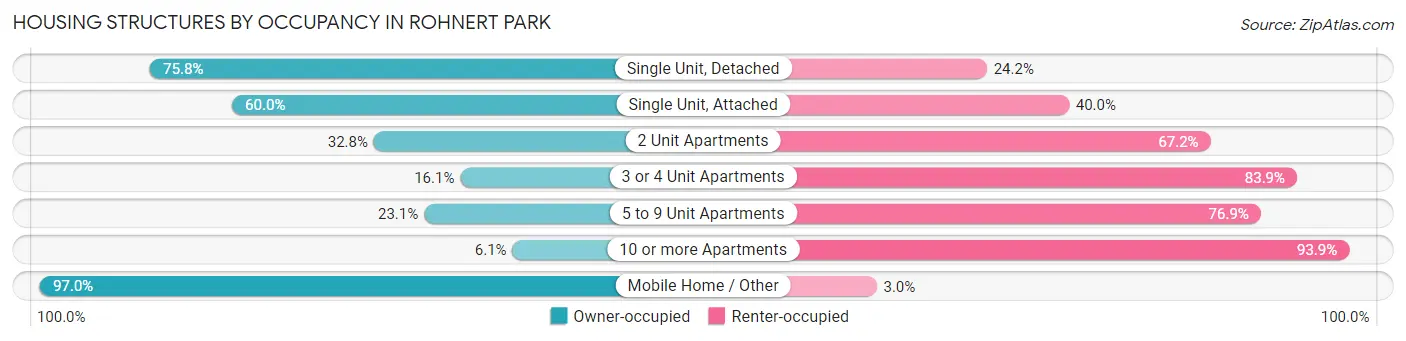
| Structure Type | Owner-occupied | Renter-occupied |
| Single Unit, Detached | 5,947 (75.8%) | 1,897 (24.2%) |
| Single Unit, Attached | 1,044 (60.0%) | 695 (40.0%) |
| 2 Unit Apartments | 76 (32.8%) | 156 (67.2%) |
| 3 or 4 Unit Apartments | 186 (16.1%) | 968 (83.9%) |
| 5 to 9 Unit Apartments | 215 (23.1%) | 716 (76.9%) |
| 10 or more Apartments | 257 (6.1%) | 3,976 (93.9%) |
| Mobile Home / Other | 821 (97.0%) | 25 (3.0%) |
| Total | 8,546 (50.3%) | 8,433 (49.7%) |
Housing Structures by Number of Rooms in Rohnert Park
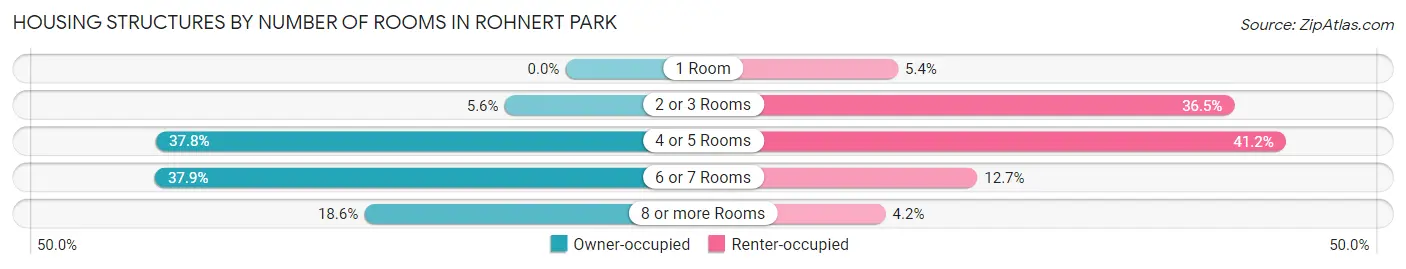
| Number of Rooms | Owner-occupied | Renter-occupied |
| 1 Room | 0 (0.0%) | 454 (5.4%) |
| 2 or 3 Rooms | 481 (5.6%) | 3,075 (36.5%) |
| 4 or 5 Rooms | 3,233 (37.8%) | 3,475 (41.2%) |
| 6 or 7 Rooms | 3,242 (37.9%) | 1,072 (12.7%) |
| 8 or more Rooms | 1,590 (18.6%) | 357 (4.2%) |
| Total | 8,546 (100.0%) | 8,433 (100.0%) |
Housing Structure by Heating Type in Rohnert Park
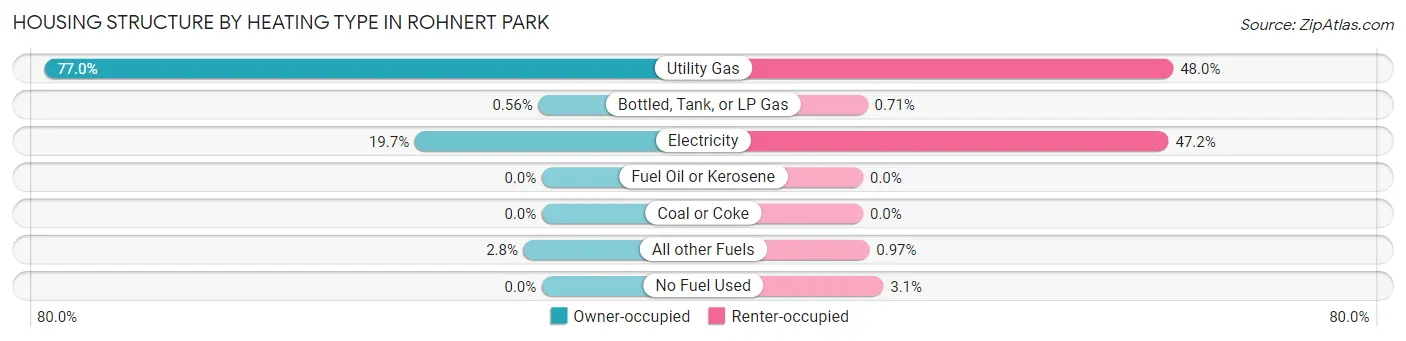
| Heating Type | Owner-occupied | Renter-occupied |
| Utility Gas | 6,577 (77.0%) | 4,044 (47.9%) |
| Bottled, Tank, or LP Gas | 48 (0.6%) | 60 (0.7%) |
| Electricity | 1,679 (19.7%) | 3,983 (47.2%) |
| Fuel Oil or Kerosene | 0 (0.0%) | 0 (0.0%) |
| Coal or Coke | 0 (0.0%) | 0 (0.0%) |
| All other Fuels | 242 (2.8%) | 82 (1.0%) |
| No Fuel Used | 0 (0.0%) | 264 (3.1%) |
| Total | 8,546 (100.0%) | 8,433 (100.0%) |
Household Vehicle Usage in Rohnert Park
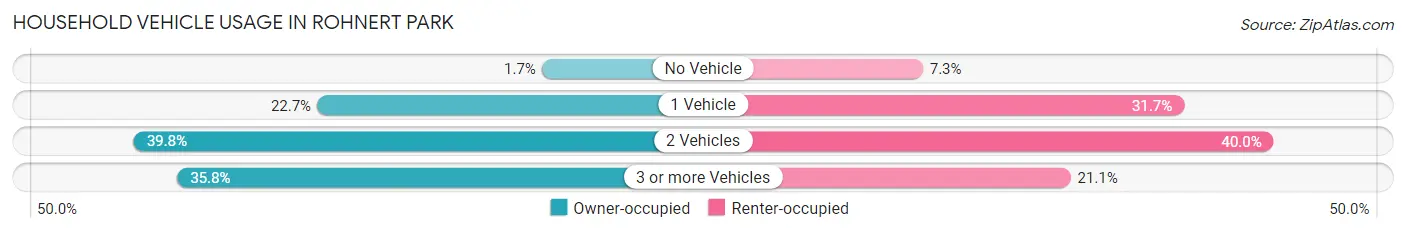
| Vehicles per Household | Owner-occupied | Renter-occupied |
| No Vehicle | 148 (1.7%) | 613 (7.3%) |
| 1 Vehicle | 1,941 (22.7%) | 2,670 (31.7%) |
| 2 Vehicles | 3,402 (39.8%) | 3,374 (40.0%) |
| 3 or more Vehicles | 3,055 (35.7%) | 1,776 (21.1%) |
| Total | 8,546 (100.0%) | 8,433 (100.0%) |
Real Estate & Mortgages in Rohnert Park
Real Estate and Mortgage Overview in Rohnert Park
| Characteristic | Without Mortgage | With Mortgage |
| Housing Units | 2,648 | 5,898 |
| Median Property Value | $561,100 | $636,100 |
| Median Household Income | $80,403 | $2,415 |
| Monthly Housing Costs | $818 | $1,984 |
| Real Estate Taxes | $3,478 | $122 |
Property Value by Mortgage Status in Rohnert Park
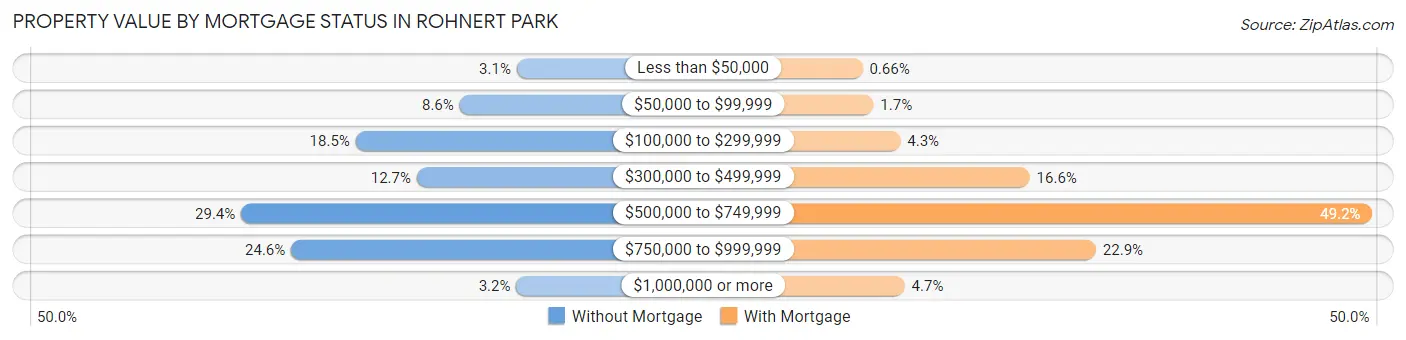
| Property Value | Without Mortgage | With Mortgage |
| Less than $50,000 | 83 (3.1%) | 39 (0.7%) |
| $50,000 to $99,999 | 227 (8.6%) | 100 (1.7%) |
| $100,000 to $299,999 | 489 (18.5%) | 252 (4.3%) |
| $300,000 to $499,999 | 335 (12.7%) | 978 (16.6%) |
| $500,000 to $749,999 | 778 (29.4%) | 2,903 (49.2%) |
| $750,000 to $999,999 | 652 (24.6%) | 1,350 (22.9%) |
| $1,000,000 or more | 84 (3.2%) | 276 (4.7%) |
| Total | 2,648 (100.0%) | 5,898 (100.0%) |
Household Income by Mortgage Status in Rohnert Park
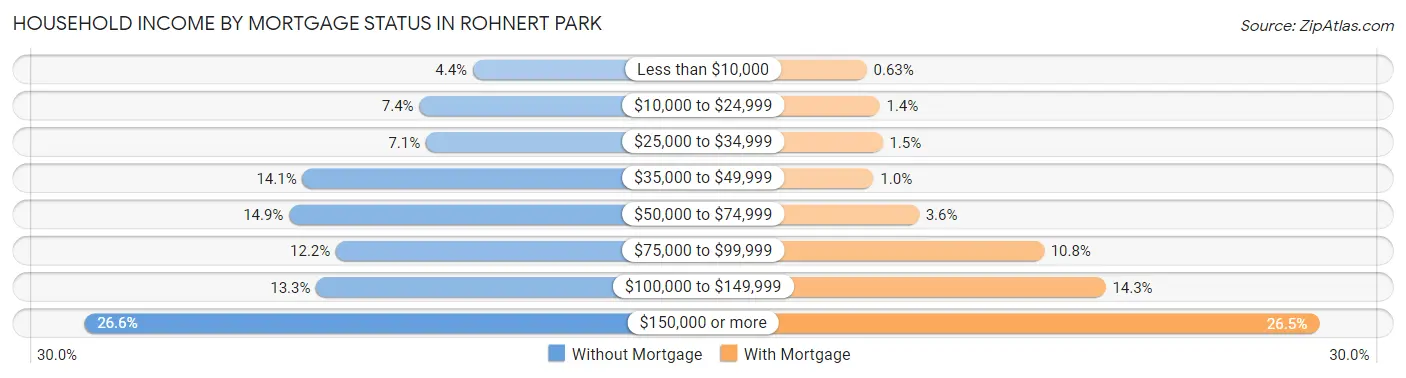
| Household Income | Without Mortgage | With Mortgage |
| Less than $10,000 | 116 (4.4%) | 37 (0.6%) |
| $10,000 to $24,999 | 197 (7.4%) | 81 (1.4%) |
| $25,000 to $34,999 | 187 (7.1%) | 91 (1.5%) |
| $35,000 to $49,999 | 374 (14.1%) | 60 (1.0%) |
| $50,000 to $74,999 | 394 (14.9%) | 213 (3.6%) |
| $75,000 to $99,999 | 323 (12.2%) | 634 (10.7%) |
| $100,000 to $149,999 | 353 (13.3%) | 842 (14.3%) |
| $150,000 or more | 704 (26.6%) | 1,562 (26.5%) |
| Total | 2,648 (100.0%) | 5,898 (100.0%) |
Property Value to Household Income Ratio in Rohnert Park
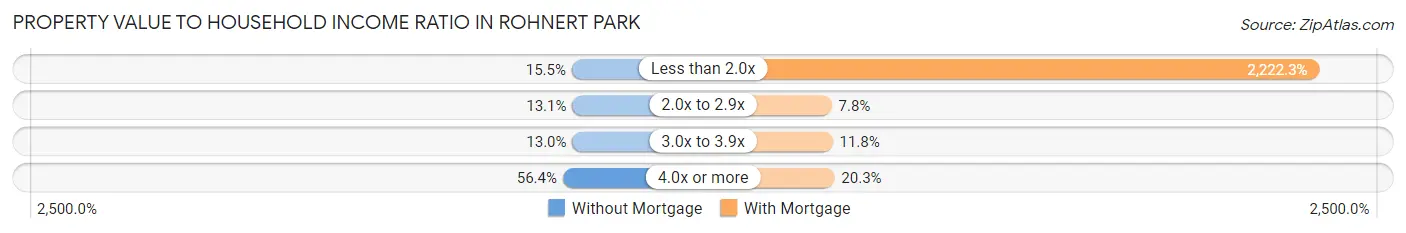
| Value-to-Income Ratio | Without Mortgage | With Mortgage |
| Less than 2.0x | 411 (15.5%) | 131,071 (2,222.3%) |
| 2.0x to 2.9x | 348 (13.1%) | 458 (7.8%) |
| 3.0x to 3.9x | 345 (13.0%) | 697 (11.8%) |
| 4.0x or more | 1,494 (56.4%) | 1,199 (20.3%) |
| Total | 2,648 (100.0%) | 5,898 (100.0%) |
Real Estate Taxes by Mortgage Status in Rohnert Park
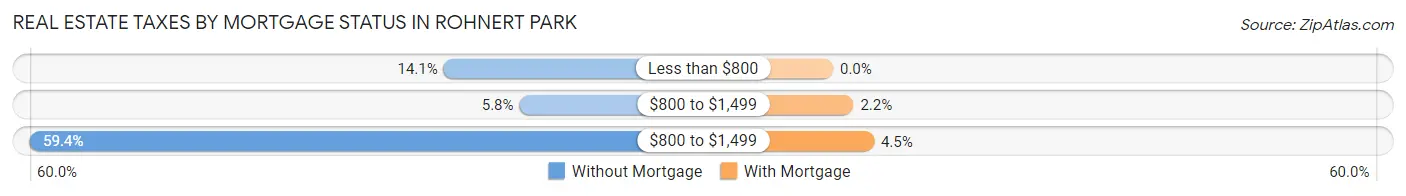
| Property Taxes | Without Mortgage | With Mortgage |
| Less than $800 | 373 (14.1%) | 0 (0.0%) |
| $800 to $1,499 | 153 (5.8%) | 132 (2.2%) |
| $800 to $1,499 | 1,573 (59.4%) | 264 (4.5%) |
| Total | 2,648 (100.0%) | 5,898 (100.0%) |
Health & Disability in Rohnert Park
Health Insurance Coverage by Age in Rohnert Park
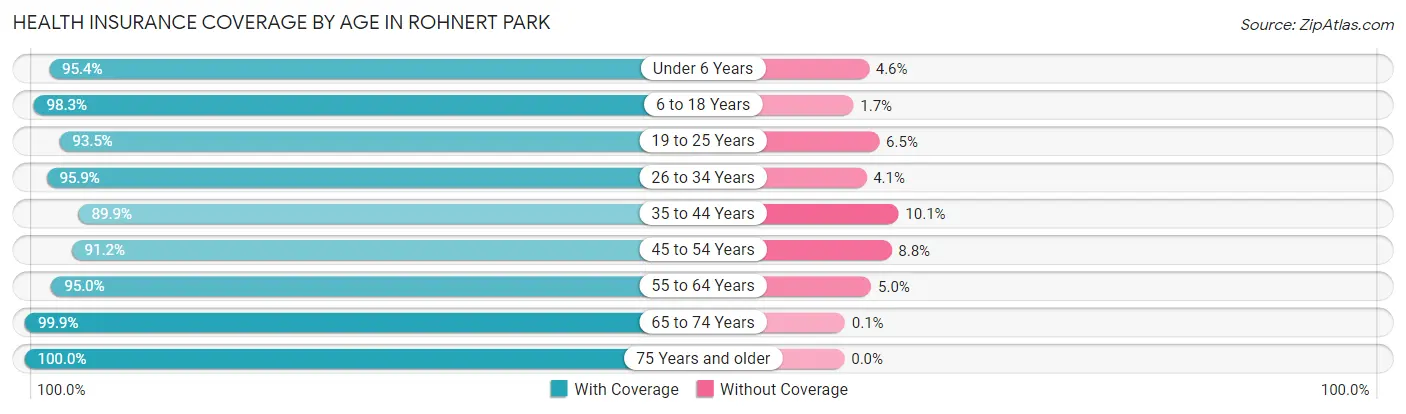
| Age Bracket | With Coverage | Without Coverage |
| Under 6 Years | 3,046 (95.4%) | 146 (4.6%) |
| 6 to 18 Years | 6,206 (98.3%) | 107 (1.7%) |
| 19 to 25 Years | 5,709 (93.5%) | 397 (6.5%) |
| 26 to 34 Years | 6,040 (95.9%) | 257 (4.1%) |
| 35 to 44 Years | 5,495 (89.9%) | 617 (10.1%) |
| 45 to 54 Years | 3,793 (91.2%) | 365 (8.8%) |
| 55 to 64 Years | 5,648 (95.0%) | 297 (5.0%) |
| 65 to 74 Years | 3,955 (99.9%) | 4 (0.1%) |
| 75 Years and older | 2,311 (100.0%) | 0 (0.0%) |
| Total | 42,203 (95.1%) | 2,190 (4.9%) |
Health Insurance Coverage by Citizenship Status in Rohnert Park
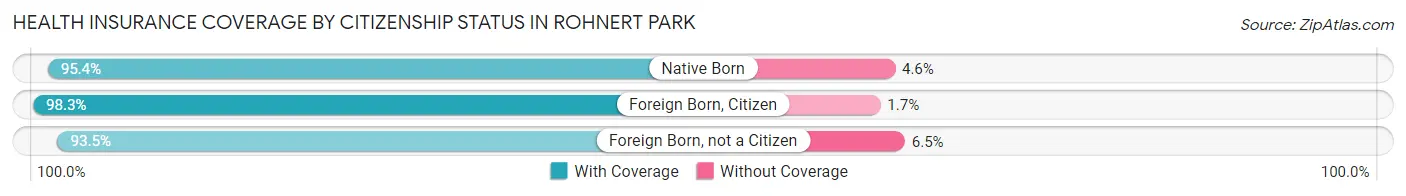
| Citizenship Status | With Coverage | Without Coverage |
| Native Born | 3,046 (95.4%) | 146 (4.6%) |
| Foreign Born, Citizen | 6,206 (98.3%) | 107 (1.7%) |
| Foreign Born, not a Citizen | 5,709 (93.5%) | 397 (6.5%) |
Health Insurance Coverage by Household Income in Rohnert Park
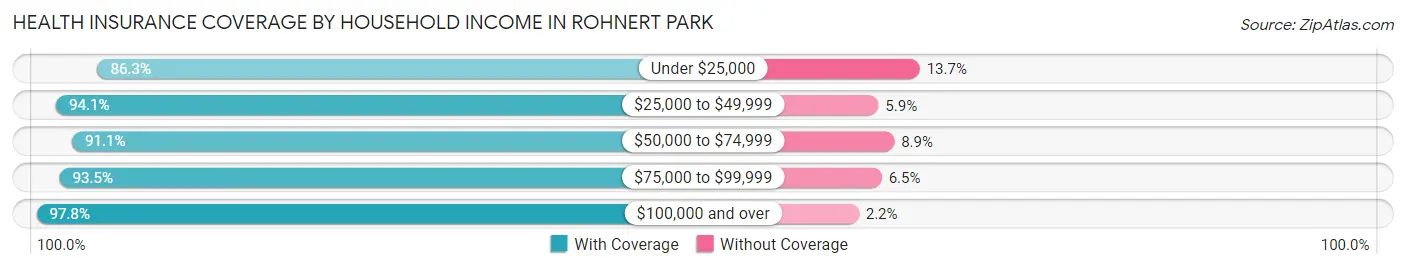
| Household Income | With Coverage | Without Coverage |
| Under $25,000 | 2,595 (86.3%) | 411 (13.7%) |
| $25,000 to $49,999 | 4,544 (94.1%) | 286 (5.9%) |
| $50,000 to $74,999 | 5,032 (91.1%) | 491 (8.9%) |
| $75,000 to $99,999 | 6,689 (93.5%) | 468 (6.5%) |
| $100,000 and over | 23,147 (97.8%) | 530 (2.2%) |
Public vs Private Health Insurance Coverage by Age in Rohnert Park
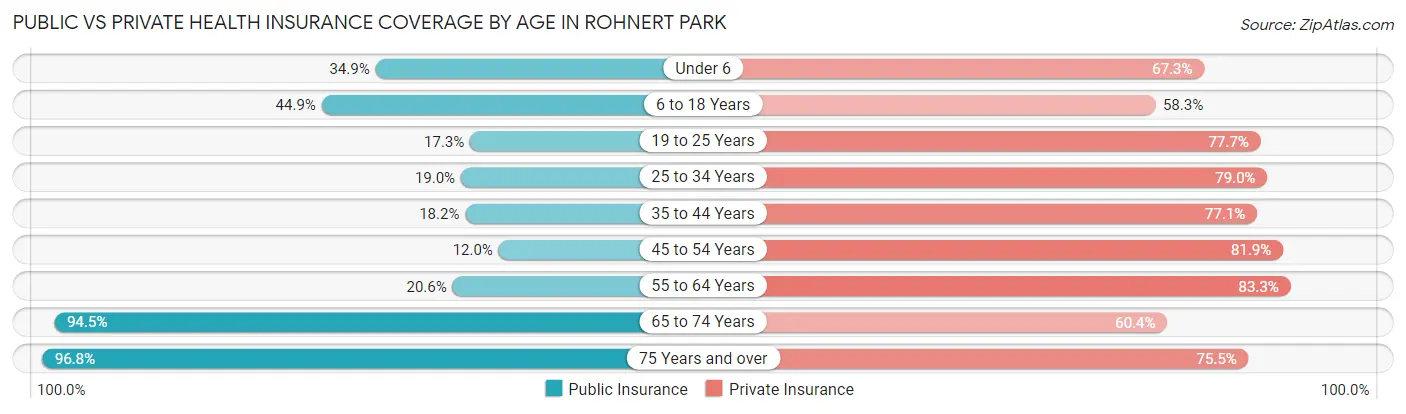
| Age Bracket | Public Insurance | Private Insurance |
| Under 6 | 1,113 (34.9%) | 2,148 (67.3%) |
| 6 to 18 Years | 2,832 (44.9%) | 3,682 (58.3%) |
| 19 to 25 Years | 1,057 (17.3%) | 4,747 (77.7%) |
| 25 to 34 Years | 1,197 (19.0%) | 4,974 (79.0%) |
| 35 to 44 Years | 1,113 (18.2%) | 4,712 (77.1%) |
| 45 to 54 Years | 499 (12.0%) | 3,406 (81.9%) |
| 55 to 64 Years | 1,223 (20.6%) | 4,953 (83.3%) |
| 65 to 74 Years | 3,743 (94.5%) | 2,392 (60.4%) |
| 75 Years and over | 2,237 (96.8%) | 1,745 (75.5%) |
| Total | 15,014 (33.8%) | 32,759 (73.8%) |
Disability Status by Sex by Age in Rohnert Park
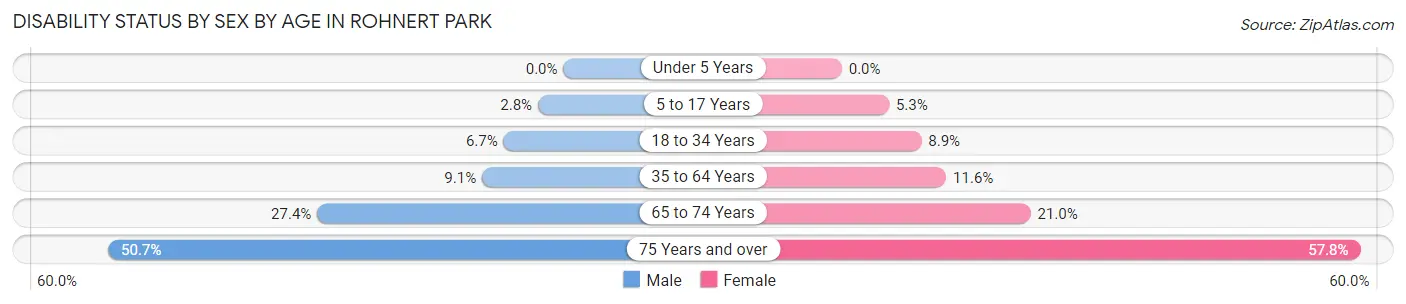
| Age Bracket | Male | Female |
| Under 5 Years | 0 (0.0%) | 0 (0.0%) |
| 5 to 17 Years | 75 (2.8%) | 183 (5.2%) |
| 18 to 34 Years | 418 (6.7%) | 596 (8.9%) |
| 35 to 64 Years | 753 (9.1%) | 918 (11.6%) |
| 65 to 74 Years | 522 (27.4%) | 432 (21.0%) |
| 75 Years and over | 508 (50.7%) | 756 (57.8%) |
Disability Class by Sex by Age in Rohnert Park
Disability Class: Hearing Difficulty
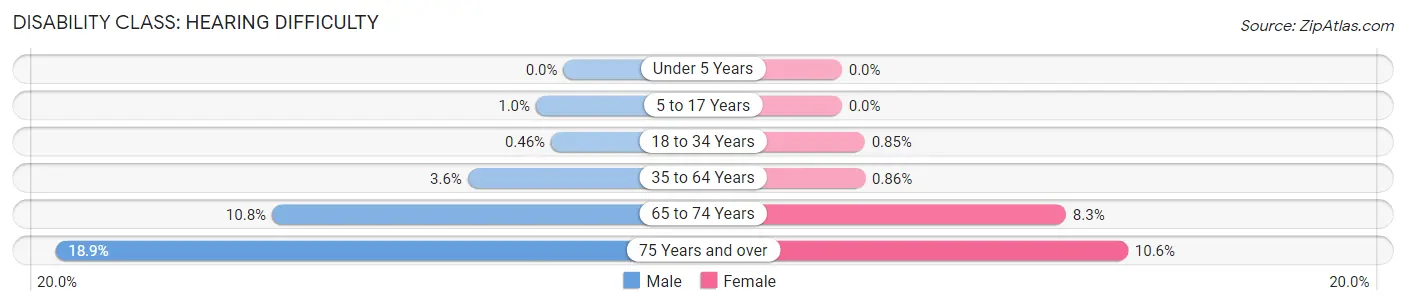
| Age Bracket | Male | Female |
| Under 5 Years | 0 (0.0%) | 0 (0.0%) |
| 5 to 17 Years | 27 (1.0%) | 0 (0.0%) |
| 18 to 34 Years | 29 (0.5%) | 57 (0.9%) |
| 35 to 64 Years | 295 (3.5%) | 68 (0.9%) |
| 65 to 74 Years | 206 (10.8%) | 171 (8.3%) |
| 75 Years and over | 189 (18.9%) | 139 (10.6%) |
Disability Class: Vision Difficulty
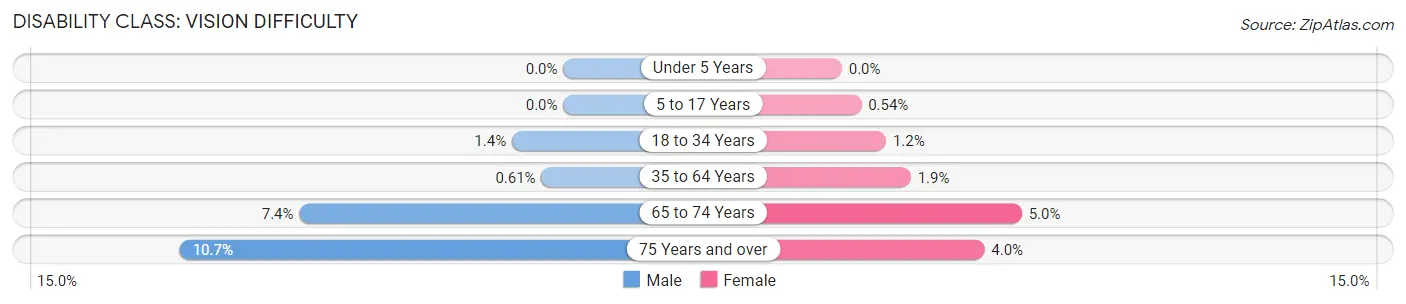
| Age Bracket | Male | Female |
| Under 5 Years | 0 (0.0%) | 0 (0.0%) |
| 5 to 17 Years | 0 (0.0%) | 19 (0.5%) |
| 18 to 34 Years | 90 (1.4%) | 83 (1.2%) |
| 35 to 64 Years | 51 (0.6%) | 152 (1.9%) |
| 65 to 74 Years | 140 (7.3%) | 103 (5.0%) |
| 75 Years and over | 107 (10.7%) | 52 (4.0%) |
Disability Class: Cognitive Difficulty
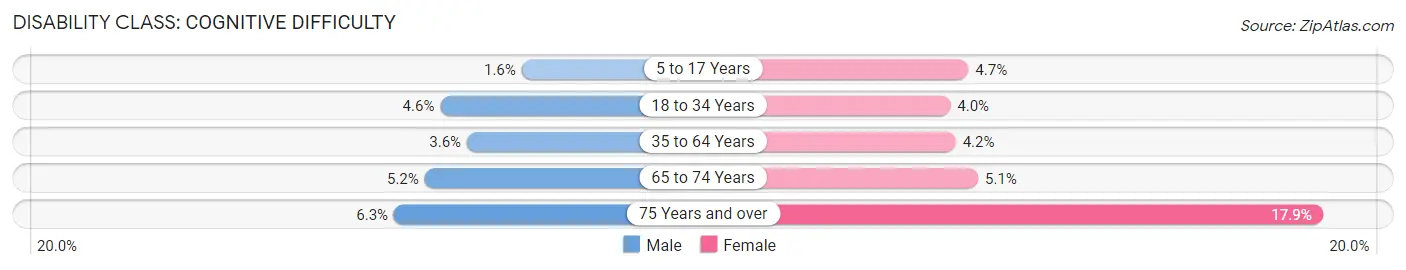
| Age Bracket | Male | Female |
| 5 to 17 Years | 41 (1.5%) | 164 (4.7%) |
| 18 to 34 Years | 287 (4.6%) | 271 (4.0%) |
| 35 to 64 Years | 298 (3.6%) | 334 (4.2%) |
| 65 to 74 Years | 98 (5.1%) | 104 (5.1%) |
| 75 Years and over | 63 (6.3%) | 234 (17.9%) |
Disability Class: Ambulatory Difficulty
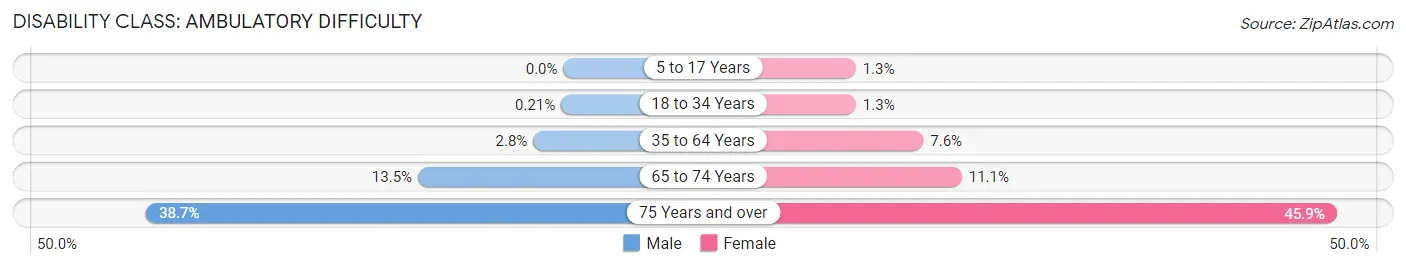
| Age Bracket | Male | Female |
| 5 to 17 Years | 0 (0.0%) | 45 (1.3%) |
| 18 to 34 Years | 13 (0.2%) | 88 (1.3%) |
| 35 to 64 Years | 233 (2.8%) | 598 (7.6%) |
| 65 to 74 Years | 257 (13.5%) | 229 (11.1%) |
| 75 Years and over | 388 (38.7%) | 601 (45.9%) |
Disability Class: Self-Care Difficulty
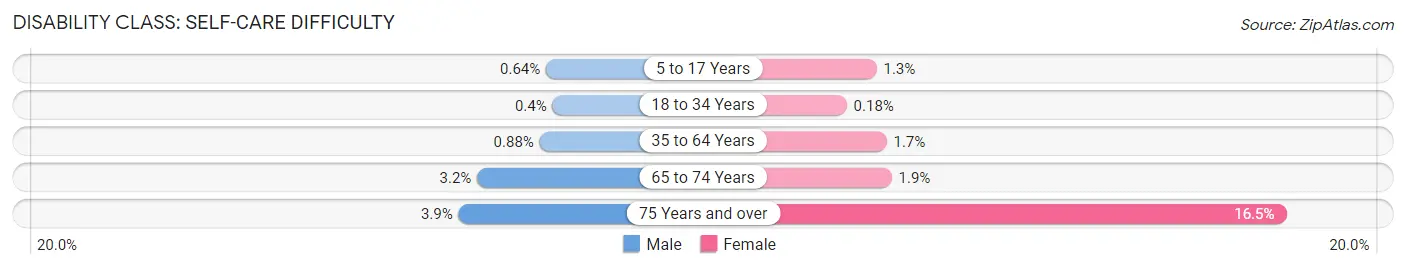
| Age Bracket | Male | Female |
| 5 to 17 Years | 17 (0.6%) | 45 (1.3%) |
| 18 to 34 Years | 25 (0.4%) | 12 (0.2%) |
| 35 to 64 Years | 73 (0.9%) | 131 (1.7%) |
| 65 to 74 Years | 61 (3.2%) | 38 (1.8%) |
| 75 Years and over | 39 (3.9%) | 216 (16.5%) |
Technology Access in Rohnert Park
Computing Device Access in Rohnert Park
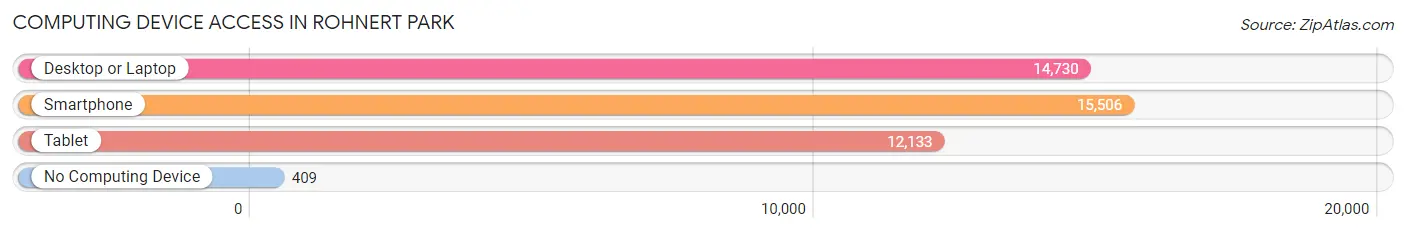
| Device Type | # Households | % Households |
| Desktop or Laptop | 14,730 | 86.8% |
| Smartphone | 15,506 | 91.3% |
| Tablet | 12,133 | 71.5% |
| No Computing Device | 409 | 2.4% |
| Total | 16,979 | 100.0% |
Internet Access in Rohnert Park
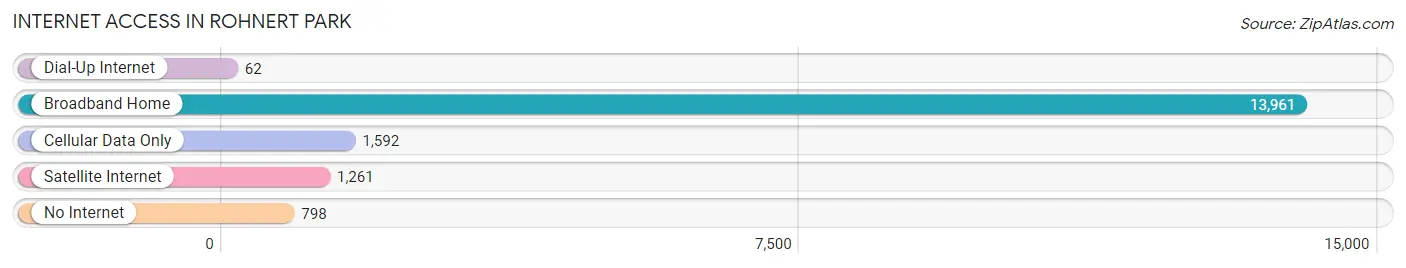
| Internet Type | # Households | % Households |
| Dial-Up Internet | 62 | 0.4% |
| Broadband Home | 13,961 | 82.2% |
| Cellular Data Only | 1,592 | 9.4% |
| Satellite Internet | 1,261 | 7.4% |
| No Internet | 798 | 4.7% |
| Total | 16,979 | 100.0% |
Rohnert Park Summary
Rohnert Park is a city located in Sonoma County, California, United States, approximately 50 miles north of San Francisco. It was incorporated in 1962 and is home to a population of approximately 40,000 people. The city is known for its diverse population, its vibrant economy, and its commitment to sustainability.
History
Rohnert Park was founded in 1962 by the Rohnert family, who had been in the area since the late 1800s. The family had purchased a large tract of land in the area and developed it into a thriving agricultural community. The city was named after the family’s patriarch, Edward Rohnert.
In the early 1960s, the city was developed as a planned community, with the intention of providing affordable housing for the growing population of the Bay Area. The city was designed to be a self-contained community, with its own shopping centers, schools, and recreational facilities.
Geography
Rohnert Park is located in the northern part of Sonoma County, approximately 50 miles north of San Francisco. The city is situated in the Sonoma Valley, between the Mayacamas Mountains to the east and the Coastal Range to the west. The city is bordered by the cities of Cotati, Petaluma, and Santa Rosa.
The city has a total area of 8.3 square miles, of which 8.2 square miles is land and 0.1 square miles is water. The city is located at an elevation of approximately 200 feet above sea level.
Economy
Rohnert Park is home to a diverse and vibrant economy. The city is home to a number of large employers, including Sonoma State University, the Sonoma County Fairgrounds, and the Graton Resort & Casino. The city is also home to a number of smaller businesses, including retail stores, restaurants, and professional services.
The city is also home to a number of technology companies, including Autodesk, Oracle, and Symantec. The city is also home to a number of wineries, including the Robert Mondavi Winery and the Sebastiani Winery.
Demographics
As of the 2010 census, the population of Rohnert Park was 40,971. The racial makeup of the city was 68.2% White, 11.3% Asian, 8.2% Hispanic or Latino, 6.2% African American, 0.7% Native American, and 5.4% from other races.
The median household income in Rohnert Park was $63,837, and the median family income was $76,837. The per capita income in the city was $30,945. The city’s poverty rate was 8.3%.
Rohnert Park is a diverse and vibrant city, with a strong commitment to sustainability. The city is home to a number of large employers, a thriving technology sector, and a number of wineries. The city is also home to a diverse population, with a wide range of racial and ethnic backgrounds.
Common Questions
What is Per Capita Income in Rohnert Park?
Per Capita income in Rohnert Park is $45,294.
What is the Median Family Income in Rohnert Park?
Median Family Income in Rohnert Park is $110,873.
What is the Median Household income in Rohnert Park?
Median Household Income in Rohnert Park is $93,322.
What is Income or Wage Gap in Rohnert Park?
Income or Wage Gap in Rohnert Park is 33.9%.
Women in Rohnert Park earn 66.1 cents for every dollar earned by a man.
What is Family Income Deficit in Rohnert Park?
Family Income Deficit in Rohnert Park is $11,710.
Families that are below poverty line in Rohnert Park earn $11,710 less on average than the poverty threshold level.
What is Inequality or Gini Index in Rohnert Park?
Inequality or Gini Index in Rohnert Park is 0.43.
What is the Total Population of Rohnert Park?
Total Population of Rohnert Park is 44,461.
What is the Total Male Population of Rohnert Park?
Total Male Population of Rohnert Park is 21,670.
What is the Total Female Population of Rohnert Park?
Total Female Population of Rohnert Park is 22,791.
What is the Ratio of Males per 100 Females in Rohnert Park?
There are 95.08 Males per 100 Females in Rohnert Park.
What is the Ratio of Females per 100 Males in Rohnert Park?
There are 105.17 Females per 100 Males in Rohnert Park.
What is the Median Population Age in Rohnert Park?
Median Population Age in Rohnert Park is 35.4 Years.
What is the Average Family Size in Rohnert Park
Average Family Size in Rohnert Park is 3.2 People.
What is the Average Household Size in Rohnert Park
Average Household Size in Rohnert Park is 2.6 People.
How Large is the Labor Force in Rohnert Park?
There are 25,801 People in the Labor Forcein in Rohnert Park.
What is the Percentage of People in the Labor Force in Rohnert Park?
71.0% of People are in the Labor Force in Rohnert Park.
What is the Unemployment Rate in Rohnert Park?
Unemployment Rate in Rohnert Park is 4.8%.