Monterey Park, CA Map & Demographics
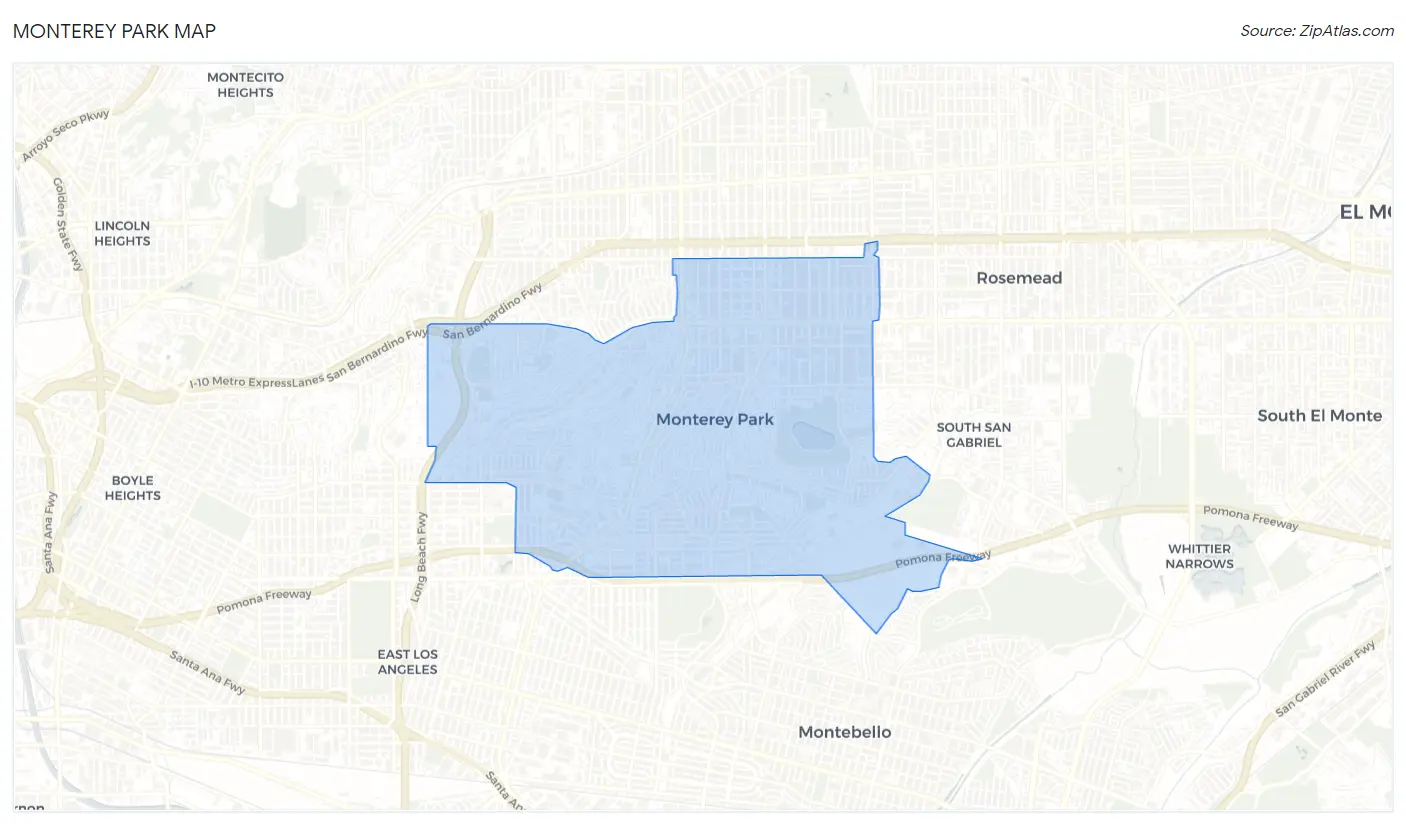
Monterey Park Map
Monterey Park Overview
$35,852
PER CAPITA INCOME
$82,555
AVG FAMILY INCOME
$76,892
AVG HOUSEHOLD INCOME
26.0%
WAGE / INCOME GAP [ % ]
74.0¢/ $1
WAGE / INCOME GAP [ $ ]
$11,700
FAMILY INCOME DEFICIT
0.47
INEQUALITY / GINI INDEX
60,386
TOTAL POPULATION
29,327
MALE POPULATION
31,059
FEMALE POPULATION
94.42
MALES / 100 FEMALES
105.91
FEMALES / 100 MALES
44.7
MEDIAN AGE
3.3
AVG FAMILY SIZE
2.9
AVG HOUSEHOLD SIZE
30,008
LABOR FORCE [ PEOPLE ]
58.5%
PERCENT IN LABOR FORCE
5.8%
UNEMPLOYMENT RATE
Income in Monterey Park
Income Overview in Monterey Park
Per Capita Income in Monterey Park is $35,852, while median incomes of families and households are $82,555 and $76,892 respectively.
| Characteristic | Number | Measure |
| Per Capita Income | 60,386 | $35,852 |
| Median Family Income | 15,334 | $82,555 |
| Mean Family Income | 15,334 | $110,614 |
| Median Household Income | 20,416 | $76,892 |
| Mean Household Income | 20,416 | $102,701 |
| Income Deficit | 15,334 | $11,700 |
| Wage / Income Gap (%) | 60,386 | 25.96% |
| Wage / Income Gap ($) | 60,386 | 74.04¢ per $1 |
| Gini / Inequality Index | 60,386 | 0.47 |
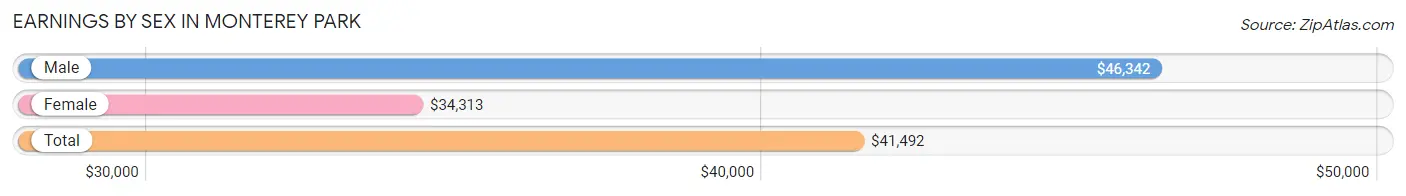
Earnings by Sex in Monterey Park
Average Earnings in Monterey Park are $41,492, $46,342 for men and $34,313 for women, a difference of 26.0%.
| Sex | Number | Average Earnings |
| Male | 15,594 (51.0%) | $46,342 |
| Female | 15,009 (49.0%) | $34,313 |
| Total | 30,603 (100.0%) | $41,492 |
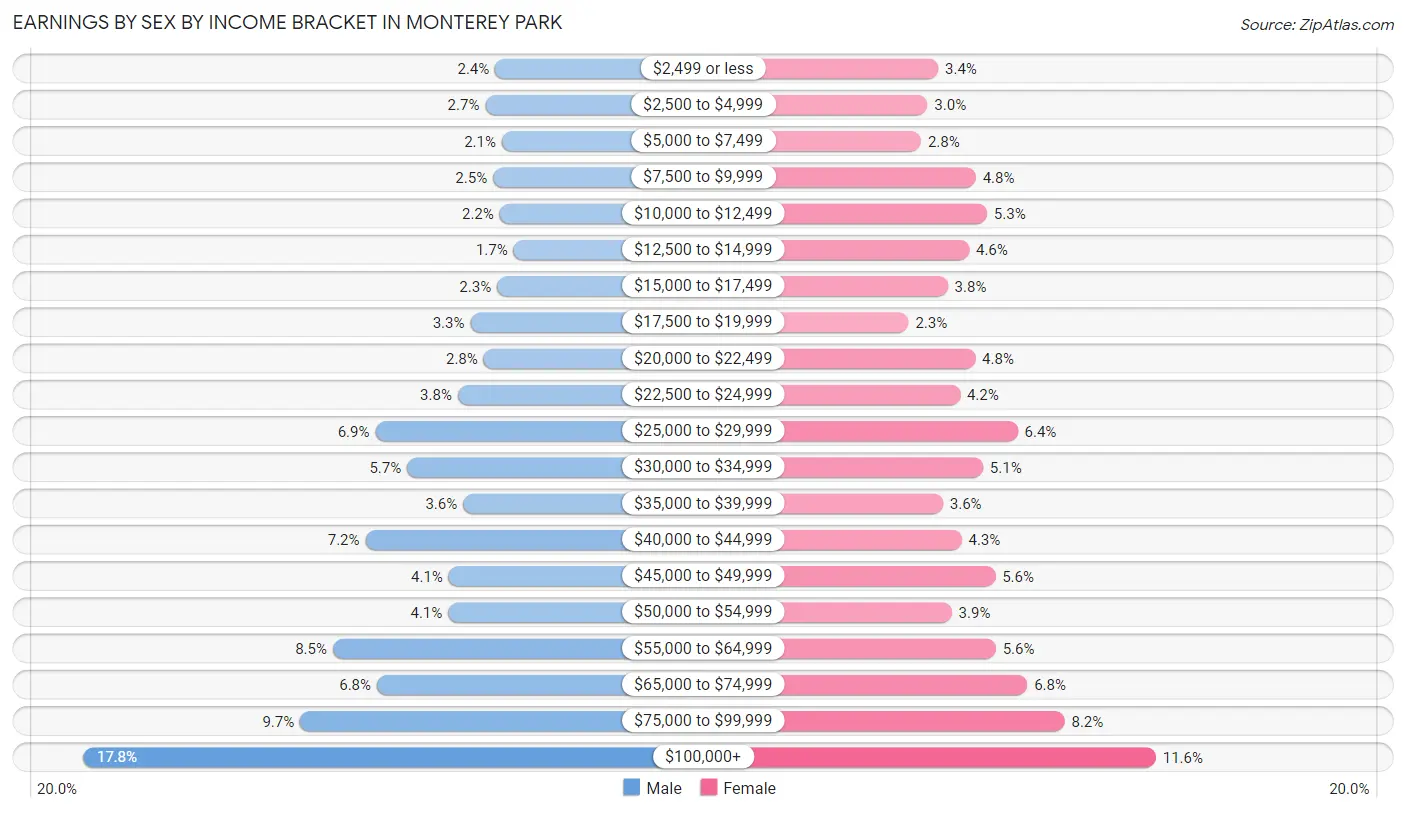
Earnings by Sex by Income Bracket in Monterey Park
The most common earnings brackets in Monterey Park are $100,000+ for men (2,772 | 17.8%) and $100,000+ for women (1,738 | 11.6%).
| Income | Male | Female |
| $2,499 or less | 369 (2.4%) | 513 (3.4%) |
| $2,500 to $4,999 | 427 (2.7%) | 454 (3.0%) |
| $5,000 to $7,499 | 330 (2.1%) | 418 (2.8%) |
| $7,500 to $9,999 | 382 (2.5%) | 725 (4.8%) |
| $10,000 to $12,499 | 343 (2.2%) | 788 (5.2%) |
| $12,500 to $14,999 | 262 (1.7%) | 688 (4.6%) |
| $15,000 to $17,499 | 359 (2.3%) | 567 (3.8%) |
| $17,500 to $19,999 | 515 (3.3%) | 346 (2.3%) |
| $20,000 to $22,499 | 437 (2.8%) | 722 (4.8%) |
| $22,500 to $24,999 | 588 (3.8%) | 637 (4.2%) |
| $25,000 to $29,999 | 1,070 (6.9%) | 961 (6.4%) |
| $30,000 to $34,999 | 884 (5.7%) | 766 (5.1%) |
| $35,000 to $39,999 | 557 (3.6%) | 540 (3.6%) |
| $40,000 to $44,999 | 1,128 (7.2%) | 646 (4.3%) |
| $45,000 to $49,999 | 641 (4.1%) | 835 (5.6%) |
| $50,000 to $54,999 | 644 (4.1%) | 590 (3.9%) |
| $55,000 to $64,999 | 1,317 (8.5%) | 837 (5.6%) |
| $65,000 to $74,999 | 1,060 (6.8%) | 1,014 (6.8%) |
| $75,000 to $99,999 | 1,509 (9.7%) | 1,224 (8.2%) |
| $100,000+ | 2,772 (17.8%) | 1,738 (11.6%) |
| Total | 15,594 (100.0%) | 15,009 (100.0%) |
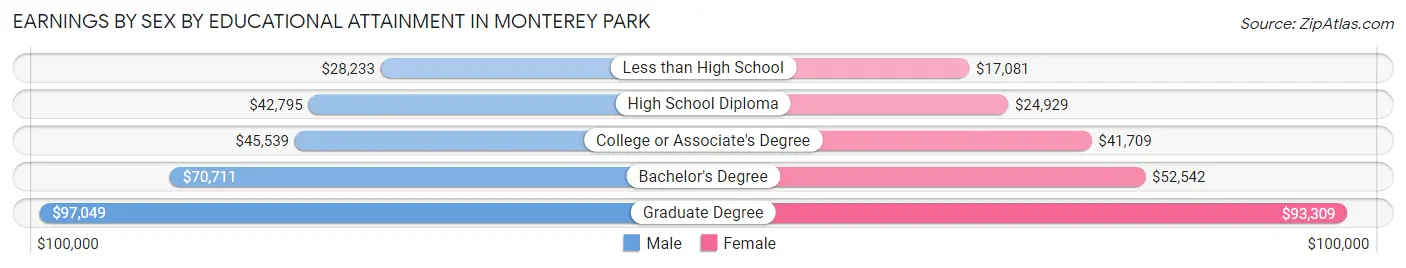
Earnings by Sex by Educational Attainment in Monterey Park
Average earnings in Monterey Park are $49,902 for men and $39,066 for women, a difference of 21.7%. Men with an educational attainment of graduate degree enjoy the highest average annual earnings of $97,049, while those with less than high school education earn the least with $28,233. Women with an educational attainment of graduate degree earn the most with the average annual earnings of $93,309, while those with less than high school education have the smallest earnings of $17,081.
| Educational Attainment | Male Income | Female Income |
| Less than High School | $28,233 | $17,081 |
| High School Diploma | $42,795 | $24,929 |
| College or Associate's Degree | $45,539 | $41,709 |
| Bachelor's Degree | $70,711 | $52,542 |
| Graduate Degree | $97,049 | $93,309 |
| Total | $49,902 | $39,066 |
Family Income in Monterey Park
Family Income Brackets in Monterey Park
According to the Monterey Park family income data, there are 2,791 families falling into the $100,000 to $149,999 income range, which is the most common income bracket and makes up 18.2% of all families. Conversely, the $10,000 to $14,999 income bracket is the least frequent group with only 230 families (1.5%) belonging to this category.
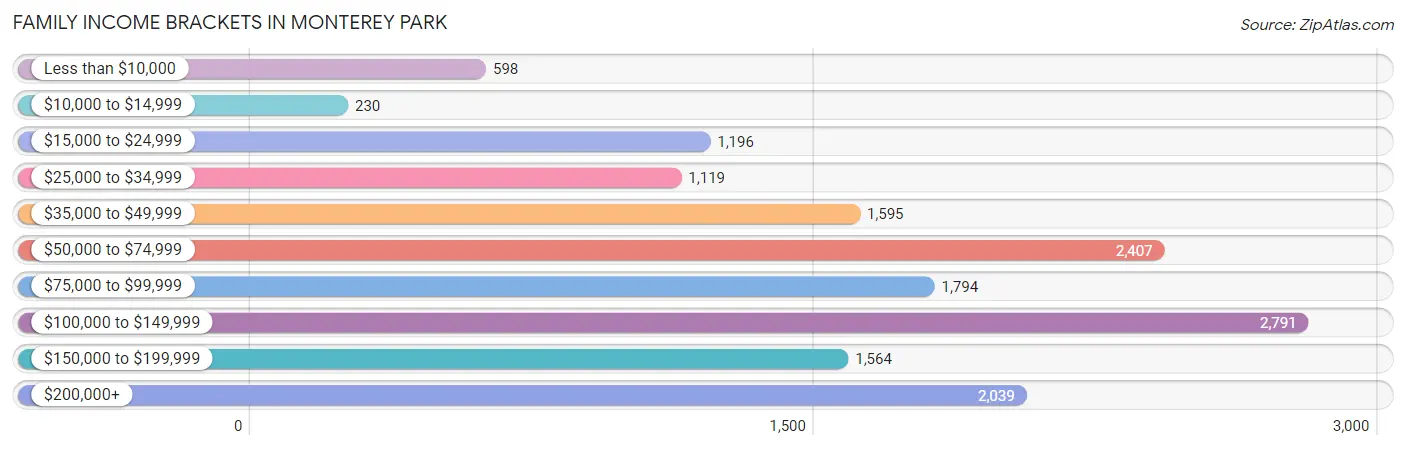
| Income Bracket | # Families | % Families |
| Less than $10,000 | 598 | 3.9% |
| $10,000 to $14,999 | 230 | 1.5% |
| $15,000 to $24,999 | 1,196 | 7.8% |
| $25,000 to $34,999 | 1,119 | 7.3% |
| $35,000 to $49,999 | 1,595 | 10.4% |
| $50,000 to $74,999 | 2,407 | 15.7% |
| $75,000 to $99,999 | 1,794 | 11.7% |
| $100,000 to $149,999 | 2,791 | 18.2% |
| $150,000 to $199,999 | 1,564 | 10.2% |
| $200,000+ | 2,039 | 13.3% |
Family Income by Famaliy Size in Monterey Park
6-person families (380 | 2.5%) account for the highest median family income in Monterey Park with $140,767 per family, while 2-person families (6,330 | 41.3%) have the highest median income of $35,296 per family member.
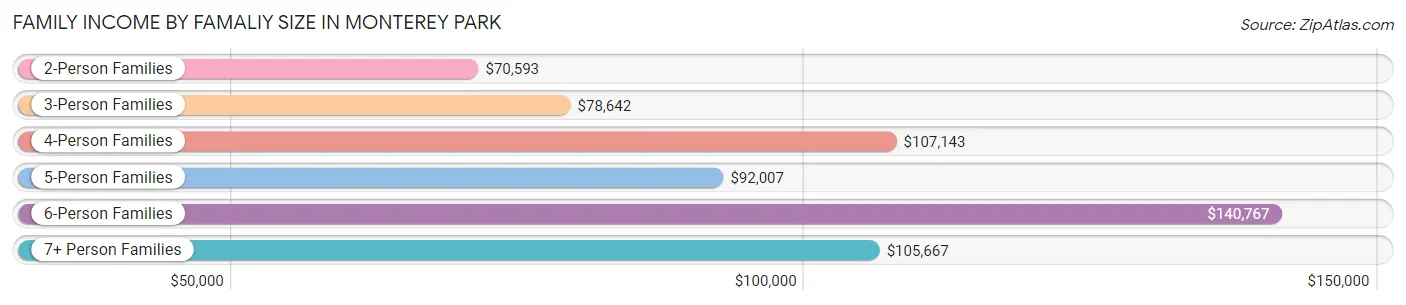
| Income Bracket | # Families | Median Income |
| 2-Person Families | 6,330 (41.3%) | $70,593 |
| 3-Person Families | 3,549 (23.1%) | $78,642 |
| 4-Person Families | 3,246 (21.2%) | $107,143 |
| 5-Person Families | 1,573 (10.3%) | $92,007 |
| 6-Person Families | 380 (2.5%) | $140,767 |
| 7+ Person Families | 256 (1.7%) | $105,667 |
| Total | 15,334 (100.0%) | $82,555 |
Family Income by Number of Earners in Monterey Park
The median family income in Monterey Park is $82,555, with families comprising 3+ earners (2,163) having the highest median family income of $140,196, while families with no earners (2,569) have the lowest median family income of $33,090, accounting for 14.1% and 16.8% of families, respectively.
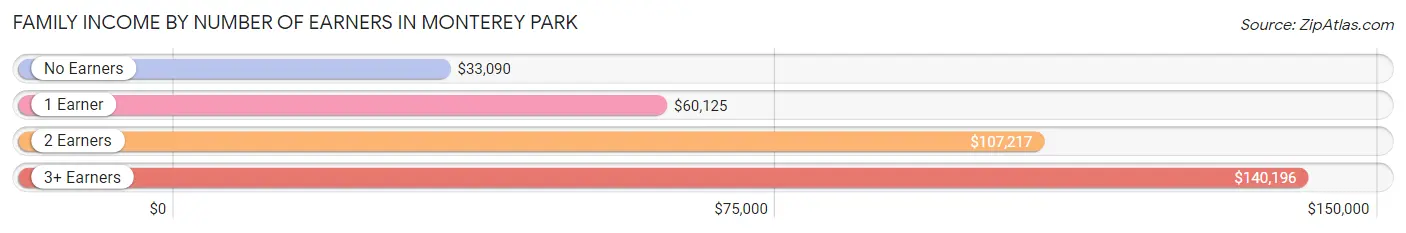
| Number of Earners | # Families | Median Income |
| No Earners | 2,569 (16.8%) | $33,090 |
| 1 Earner | 4,419 (28.8%) | $60,125 |
| 2 Earners | 6,183 (40.3%) | $107,217 |
| 3+ Earners | 2,163 (14.1%) | $140,196 |
| Total | 15,334 (100.0%) | $82,555 |
Household Income in Monterey Park
Household Income Brackets in Monterey Park
With 3,532 households falling in the category, the $100,000 to $149,999 income range is the most frequent in Monterey Park, accounting for 17.3% of all households. In contrast, only 735 households (3.6%) fall into the $10,000 to $14,999 income bracket, making it the least populous group.
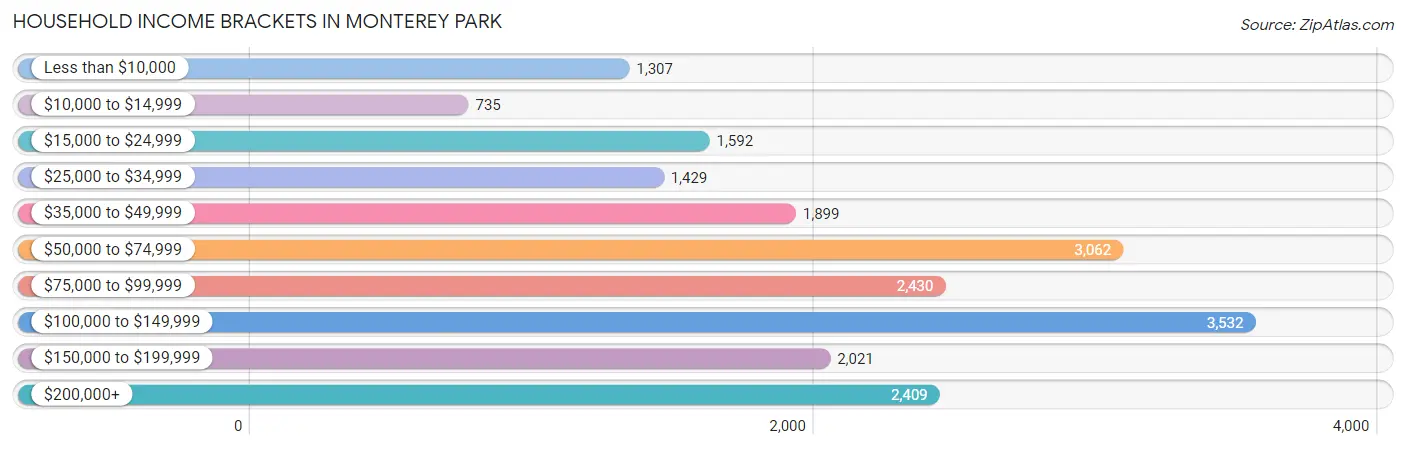
| Income Bracket | # Households | % Households |
| Less than $10,000 | 1,307 | 6.4% |
| $10,000 to $14,999 | 735 | 3.6% |
| $15,000 to $24,999 | 1,592 | 7.8% |
| $25,000 to $34,999 | 1,429 | 7.0% |
| $35,000 to $49,999 | 1,899 | 9.3% |
| $50,000 to $74,999 | 3,062 | 15.0% |
| $75,000 to $99,999 | 2,430 | 11.9% |
| $100,000 to $149,999 | 3,532 | 17.3% |
| $150,000 to $199,999 | 2,021 | 9.9% |
| $200,000+ | 2,409 | 11.8% |
Household Income by Householder Age in Monterey Park
The median household income in Monterey Park is $76,892, with the highest median household income of $100,978 found in the 25 to 44 years age bracket for the primary householder. A total of 5,190 households (25.4%) fall into this category. Meanwhile, the 65+ years age bracket for the primary householder has the lowest median household income of $47,704, with 6,831 households (33.5%) in this group.
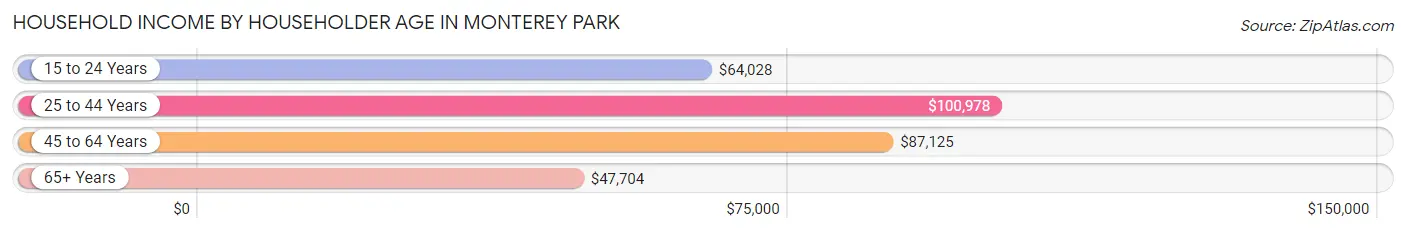
| Income Bracket | # Households | Median Income |
| 15 to 24 Years | 321 (1.6%) | $64,028 |
| 25 to 44 Years | 5,190 (25.4%) | $100,978 |
| 45 to 64 Years | 8,074 (39.6%) | $87,125 |
| 65+ Years | 6,831 (33.5%) | $47,704 |
| Total | 20,416 (100.0%) | $76,892 |
Poverty in Monterey Park
Income Below Poverty by Sex and Age in Monterey Park
With 11.2% poverty level for males and 12.7% for females among the residents of Monterey Park, 65 to 74 year old males and 15 year old females are the most vulnerable to poverty, with 475 males (16.6%) and 91 females (19.8%) in their respective age groups living below the poverty level.
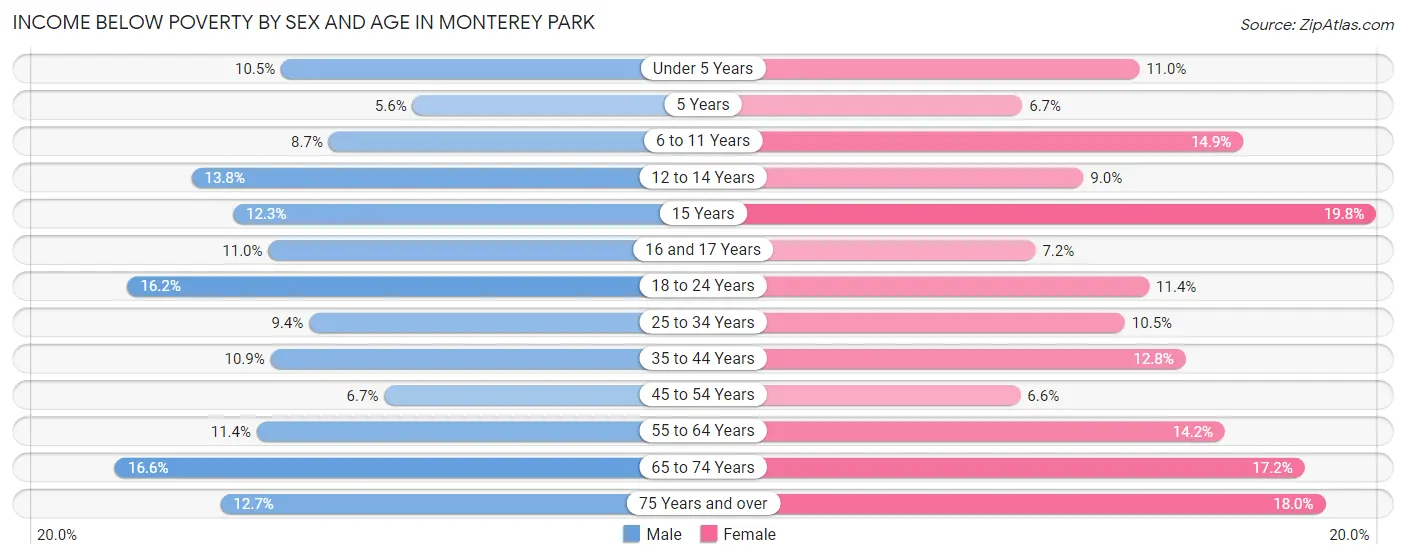
| Age Bracket | Male | Female |
| Under 5 Years | 111 (10.5%) | 131 (11.0%) |
| 5 Years | 26 (5.6%) | 24 (6.7%) |
| 6 to 11 Years | 146 (8.7%) | 264 (14.9%) |
| 12 to 14 Years | 121 (13.8%) | 70 (9.0%) |
| 15 Years | 45 (12.3%) | 91 (19.8%) |
| 16 and 17 Years | 74 (11.0%) | 44 (7.2%) |
| 18 to 24 Years | 387 (16.2%) | 236 (11.4%) |
| 25 to 34 Years | 399 (9.4%) | 436 (10.5%) |
| 35 to 44 Years | 371 (10.9%) | 487 (12.8%) |
| 45 to 54 Years | 281 (6.7%) | 282 (6.6%) |
| 55 to 64 Years | 464 (11.4%) | 612 (14.2%) |
| 65 to 74 Years | 475 (16.6%) | 522 (17.2%) |
| 75 Years and over | 362 (12.7%) | 738 (17.9%) |
| Total | 3,262 (11.2%) | 3,937 (12.7%) |
Income Above Poverty by Sex and Age in Monterey Park
According to the poverty statistics in Monterey Park, males aged 5 years and females aged 45 to 54 years are the age groups that are most secure financially, with 94.4% of males and 93.4% of females in these age groups living above the poverty line.
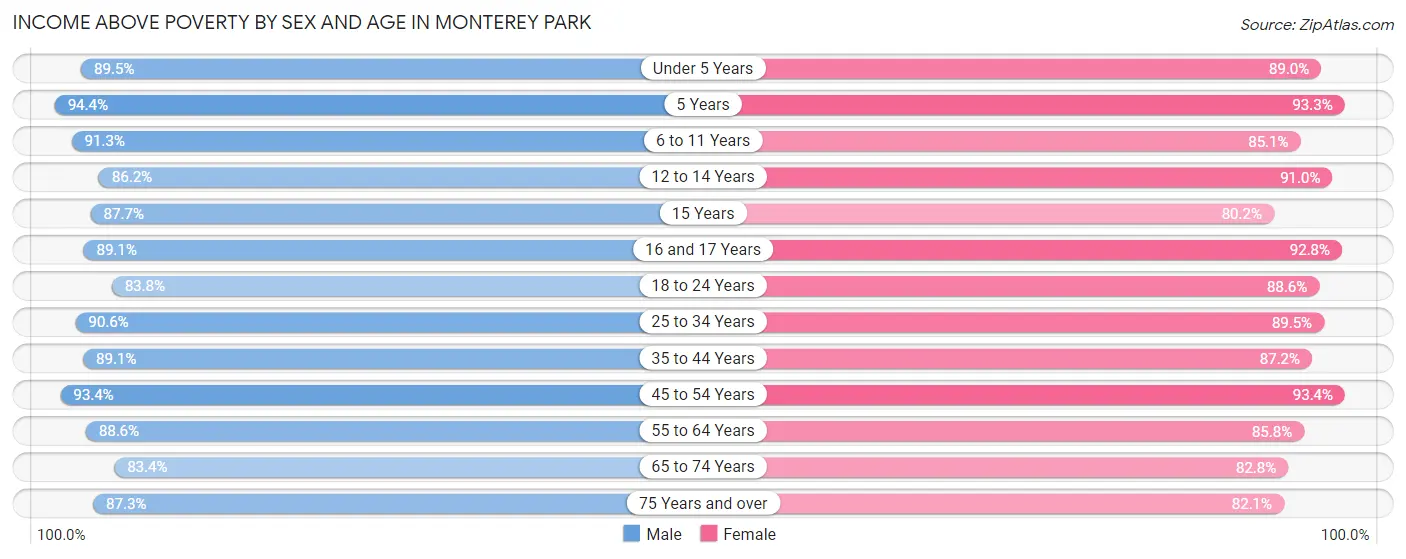
| Age Bracket | Male | Female |
| Under 5 Years | 948 (89.5%) | 1,056 (89.0%) |
| 5 Years | 438 (94.4%) | 334 (93.3%) |
| 6 to 11 Years | 1,530 (91.3%) | 1,508 (85.1%) |
| 12 to 14 Years | 756 (86.2%) | 710 (91.0%) |
| 15 Years | 322 (87.7%) | 368 (80.2%) |
| 16 and 17 Years | 602 (89.0%) | 568 (92.8%) |
| 18 to 24 Years | 2,005 (83.8%) | 1,832 (88.6%) |
| 25 to 34 Years | 3,828 (90.6%) | 3,714 (89.5%) |
| 35 to 44 Years | 3,042 (89.1%) | 3,330 (87.2%) |
| 45 to 54 Years | 3,942 (93.3%) | 3,972 (93.4%) |
| 55 to 64 Years | 3,615 (88.6%) | 3,691 (85.8%) |
| 65 to 74 Years | 2,380 (83.4%) | 2,516 (82.8%) |
| 75 Years and over | 2,481 (87.3%) | 3,374 (82.1%) |
| Total | 25,889 (88.8%) | 26,973 (87.3%) |
Income Below Poverty Among Married-Couple Families in Monterey Park
The poverty statistics for married-couple families in Monterey Park show that 8.5% or 880 of the total 10,373 families live below the poverty line. Families with 1 or 2 children have the highest poverty rate of 9.8%, comprising of 324 families. On the other hand, families with 5 or more children have the lowest poverty rate of 0.0%, which includes 0 families.
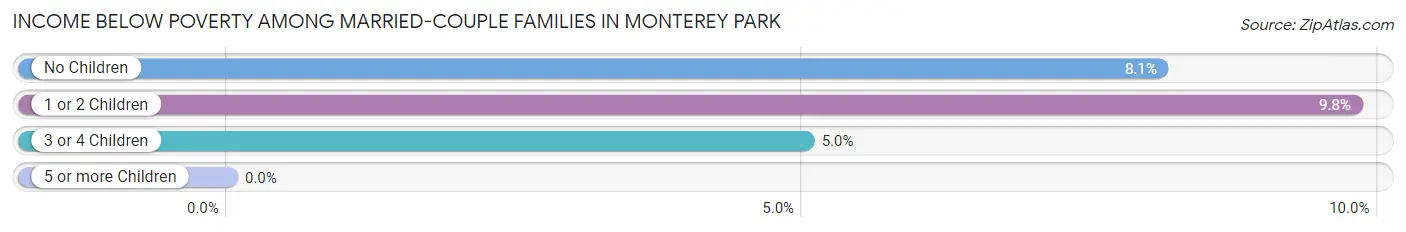
| Children | Above Poverty | Below Poverty |
| No Children | 6,025 (91.9%) | 531 (8.1%) |
| 1 or 2 Children | 2,986 (90.2%) | 324 (9.8%) |
| 3 or 4 Children | 473 (95.0%) | 25 (5.0%) |
| 5 or more Children | 9 (100.0%) | 0 (0.0%) |
| Total | 9,493 (91.5%) | 880 (8.5%) |
Income Below Poverty Among Single-Parent Households in Monterey Park
According to the poverty data in Monterey Park, 11.6% or 199 single-father households and 10.6% or 345 single-mother households are living below the poverty line. Among single-father households, those with no children have the highest poverty rate, with 146 households (11.8%) experiencing poverty. Likewise, among single-mother households, those with 5 or more children have the highest poverty rate, with 10 households (100.0%) falling below the poverty line.
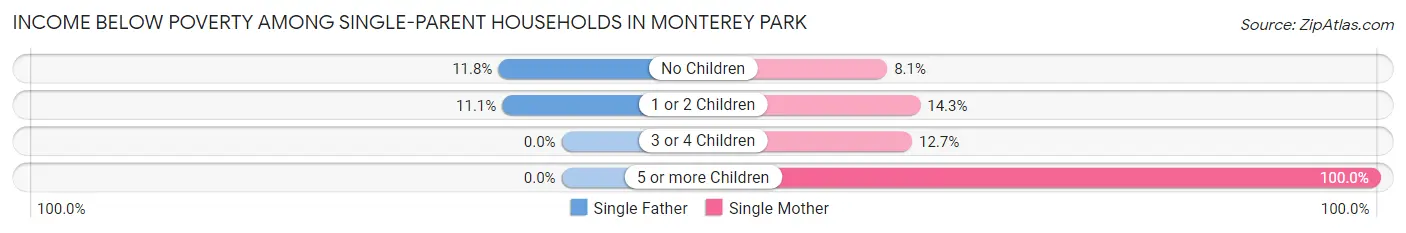
| Children | Single Father | Single Mother |
| No Children | 146 (11.8%) | 163 (8.1%) |
| 1 or 2 Children | 53 (11.1%) | 151 (14.3%) |
| 3 or 4 Children | 0 (0.0%) | 21 (12.7%) |
| 5 or more Children | 0 (0.0%) | 10 (100.0%) |
| Total | 199 (11.6%) | 345 (10.6%) |
Income Below Poverty Among Married-Couple vs Single-Parent Households in Monterey Park
The poverty data for Monterey Park shows that 880 of the married-couple family households (8.5%) and 544 of the single-parent households (11.0%) are living below the poverty level. Within the married-couple family households, those with 1 or 2 children have the highest poverty rate, with 324 households (9.8%) falling below the poverty line. Among the single-parent households, those with 5 or more children have the highest poverty rate, with 10 household (100.0%) living below poverty.
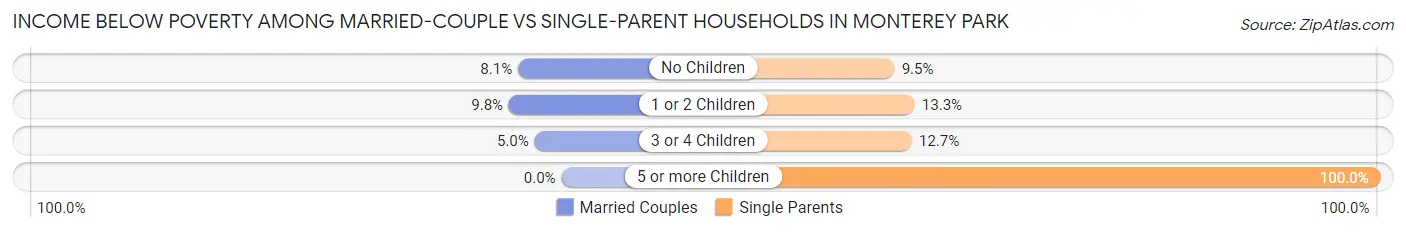
| Children | Married-Couple Families | Single-Parent Households |
| No Children | 531 (8.1%) | 309 (9.5%) |
| 1 or 2 Children | 324 (9.8%) | 204 (13.3%) |
| 3 or 4 Children | 25 (5.0%) | 21 (12.7%) |
| 5 or more Children | 0 (0.0%) | 10 (100.0%) |
| Total | 880 (8.5%) | 544 (11.0%) |
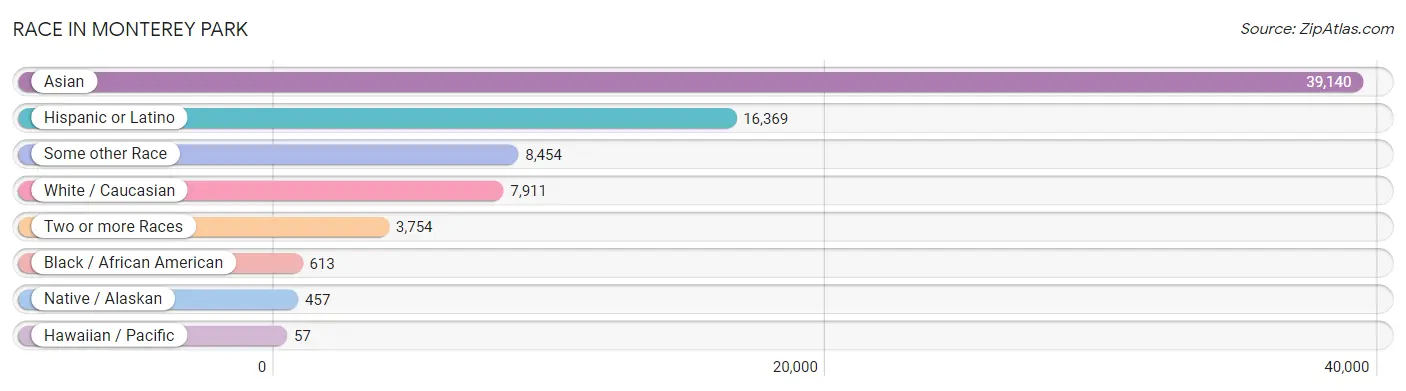
Race in Monterey Park
The most populous races in Monterey Park are Asian (39,140 | 64.8%), Hispanic or Latino (16,369 | 27.1%), and Some other Race (8,454 | 14.0%).
| Race | # Population | % Population |
| Asian | 39,140 | 64.8% |
| Black / African American | 613 | 1.0% |
| Hawaiian / Pacific | 57 | 0.1% |
| Hispanic or Latino | 16,369 | 27.1% |
| Native / Alaskan | 457 | 0.8% |
| White / Caucasian | 7,911 | 13.1% |
| Two or more Races | 3,754 | 6.2% |
| Some other Race | 8,454 | 14.0% |
| Total | 60,386 | 100.0% |
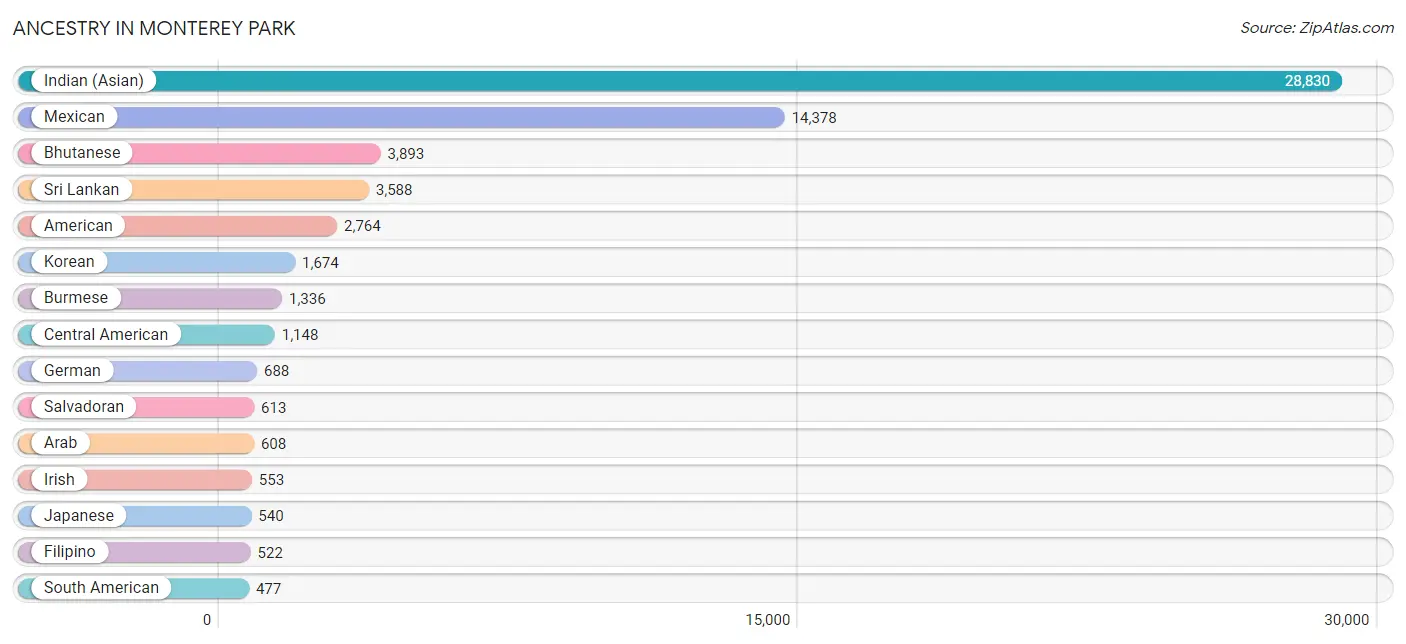
Ancestry in Monterey Park
The most populous ancestries reported in Monterey Park are Indian (Asian) (28,830 | 47.7%), Mexican (14,378 | 23.8%), Bhutanese (3,893 | 6.5%), Sri Lankan (3,588 | 5.9%), and American (2,764 | 4.6%), together accounting for 88.5% of all Monterey Park residents.
| Ancestry | # Population | % Population |
| African | 22 | 0.0% |
| American | 2,764 | 4.6% |
| Apache | 90 | 0.2% |
| Arab | 608 | 1.0% |
| Argentinean | 9 | 0.0% |
| Armenian | 37 | 0.1% |
| Austrian | 10 | 0.0% |
| Basque | 7 | 0.0% |
| Belgian | 6 | 0.0% |
| Belizean | 58 | 0.1% |
| Bhutanese | 3,893 | 6.5% |
| Bolivian | 185 | 0.3% |
| British | 31 | 0.1% |
| Burmese | 1,336 | 2.2% |
| Central American | 1,148 | 1.9% |
| Central American Indian | 32 | 0.1% |
| Cherokee | 33 | 0.1% |
| Choctaw | 6 | 0.0% |
| Colombian | 47 | 0.1% |
| Costa Rican | 54 | 0.1% |
| Cuban | 79 | 0.1% |
| Czech | 28 | 0.1% |
| Dutch | 58 | 0.1% |
| Eastern European | 6 | 0.0% |
| Ecuadorian | 130 | 0.2% |
| Egyptian | 38 | 0.1% |
| English | 424 | 0.7% |
| Ethiopian | 2 | 0.0% |
| European | 127 | 0.2% |
| Filipino | 522 | 0.9% |
| Finnish | 25 | 0.0% |
| French | 335 | 0.5% |
| French Canadian | 4 | 0.0% |
| German | 688 | 1.1% |
| Greek | 42 | 0.1% |
| Guamanian / Chamorro | 99 | 0.2% |
| Guatemalan | 160 | 0.3% |
| Honduran | 71 | 0.1% |
| Hungarian | 92 | 0.2% |
| Indian (Asian) | 28,830 | 47.7% |
| Indonesian | 431 | 0.7% |
| Iranian | 37 | 0.1% |
| Irish | 553 | 0.9% |
| Italian | 225 | 0.4% |
| Japanese | 540 | 0.9% |
| Jordanian | 305 | 0.5% |
| Korean | 1,674 | 2.8% |
| Laotian | 282 | 0.5% |
| Lebanese | 71 | 0.1% |
| Lithuanian | 8 | 0.0% |
| Malaysian | 94 | 0.2% |
| Mexican | 14,378 | 23.8% |
| Mexican American Indian | 107 | 0.2% |
| Mongolian | 7 | 0.0% |
| Native Hawaiian | 23 | 0.0% |
| Navajo | 7 | 0.0% |
| Nicaraguan | 183 | 0.3% |
| Nigerian | 20 | 0.0% |
| Northern European | 76 | 0.1% |
| Norwegian | 41 | 0.1% |
| Okinawan | 18 | 0.0% |
| Pakistani | 184 | 0.3% |
| Palestinian | 199 | 0.3% |
| Peruvian | 87 | 0.1% |
| Polish | 54 | 0.1% |
| Portuguese | 73 | 0.1% |
| Pueblo | 3 | 0.0% |
| Puerto Rican | 80 | 0.1% |
| Romanian | 13 | 0.0% |
| Russian | 161 | 0.3% |
| Salvadoran | 613 | 1.0% |
| Samoan | 44 | 0.1% |
| Scandinavian | 51 | 0.1% |
| Scotch-Irish | 17 | 0.0% |
| Scottish | 32 | 0.1% |
| Sioux | 52 | 0.1% |
| Slovak | 8 | 0.0% |
| Slovene | 18 | 0.0% |
| South American | 477 | 0.8% |
| South American Indian | 14 | 0.0% |
| Spaniard | 39 | 0.1% |
| Spanish | 29 | 0.1% |
| Sri Lankan | 3,588 | 5.9% |
| Subsaharan African | 44 | 0.1% |
| Swedish | 18 | 0.0% |
| Syrian | 10 | 0.0% |
| Thai | 321 | 0.5% |
| Venezuelan | 19 | 0.0% |
| Vietnamese | 9 | 0.0% |
| West Indian | 23 | 0.0% |
| Yugoslavian | 18 | 0.0% | View All 91 Rows |
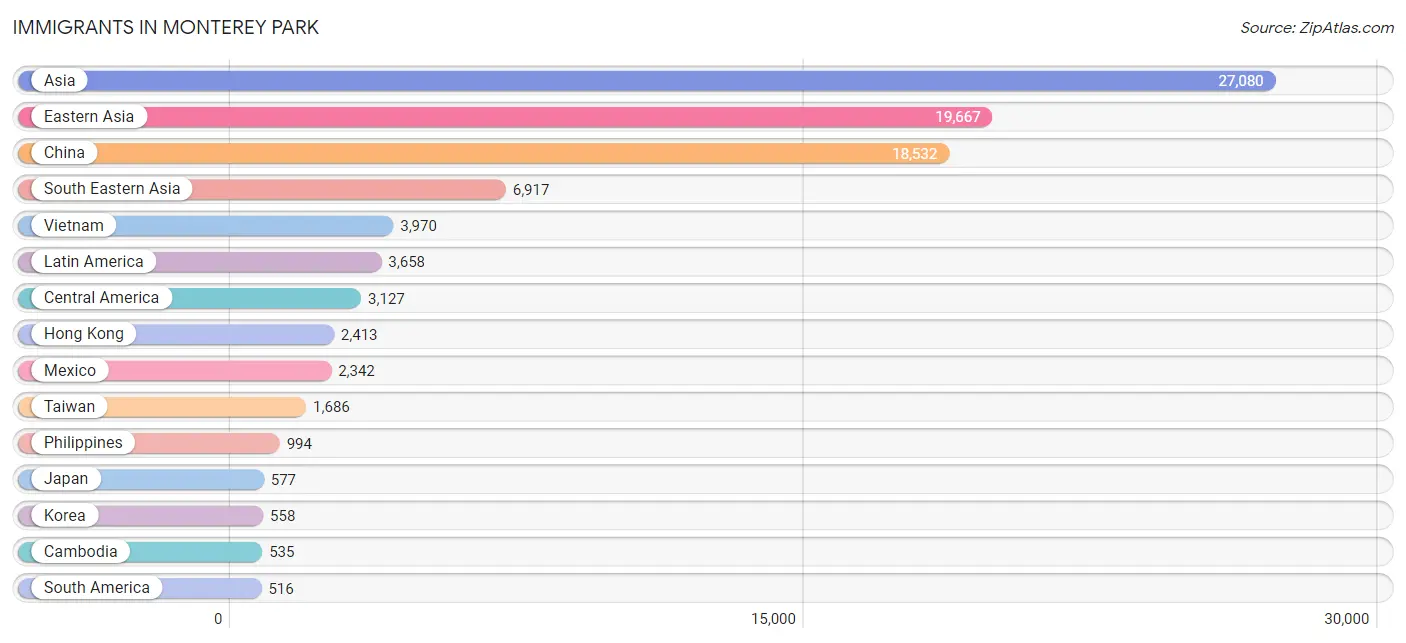
Immigrants in Monterey Park
The most numerous immigrant groups reported in Monterey Park came from Asia (27,080 | 44.8%), Eastern Asia (19,667 | 32.6%), China (18,532 | 30.7%), South Eastern Asia (6,917 | 11.5%), and Vietnam (3,970 | 6.6%), together accounting for 126.1% of all Monterey Park residents.
| Immigration Origin | # Population | % Population |
| Africa | 110 | 0.2% |
| Argentina | 9 | 0.0% |
| Asia | 27,080 | 44.8% |
| Australia | 21 | 0.0% |
| Bangladesh | 67 | 0.1% |
| Bolivia | 134 | 0.2% |
| Brazil | 19 | 0.0% |
| Cambodia | 535 | 0.9% |
| Cameroon | 1 | 0.0% |
| Canada | 30 | 0.1% |
| Caribbean | 15 | 0.0% |
| Central America | 3,127 | 5.2% |
| China | 18,532 | 30.7% |
| Colombia | 25 | 0.0% |
| Costa Rica | 18 | 0.0% |
| Cuba | 15 | 0.0% |
| Czechoslovakia | 8 | 0.0% |
| Eastern Asia | 19,667 | 32.6% |
| Eastern Europe | 25 | 0.0% |
| Ecuador | 66 | 0.1% |
| Egypt | 38 | 0.1% |
| El Salvador | 297 | 0.5% |
| Europe | 218 | 0.4% |
| France | 83 | 0.1% |
| Germany | 47 | 0.1% |
| Guatemala | 248 | 0.4% |
| Honduras | 39 | 0.1% |
| Hong Kong | 2,413 | 4.0% |
| India | 150 | 0.3% |
| Indonesia | 353 | 0.6% |
| Iran | 35 | 0.1% |
| Italy | 22 | 0.0% |
| Japan | 577 | 1.0% |
| Jordan | 133 | 0.2% |
| Korea | 558 | 0.9% |
| Kuwait | 11 | 0.0% |
| Laos | 163 | 0.3% |
| Latin America | 3,658 | 6.1% |
| Malaysia | 134 | 0.2% |
| Mexico | 2,342 | 3.9% |
| Middle Africa | 1 | 0.0% |
| Netherlands | 1 | 0.0% |
| Nicaragua | 151 | 0.3% |
| Nigeria | 20 | 0.0% |
| Northern Africa | 38 | 0.1% |
| Northern Europe | 9 | 0.0% |
| Norway | 8 | 0.0% |
| Oceania | 28 | 0.1% |
| Pakistan | 21 | 0.0% |
| Panama | 17 | 0.0% |
| Peru | 206 | 0.3% |
| Philippines | 994 | 1.7% |
| Poland | 17 | 0.0% |
| Portugal | 31 | 0.1% |
| Scotland | 1 | 0.0% |
| Singapore | 45 | 0.1% |
| South Africa | 51 | 0.1% |
| South America | 516 | 0.9% |
| South Central Asia | 319 | 0.5% |
| South Eastern Asia | 6,917 | 11.5% |
| Southern Europe | 53 | 0.1% |
| Sri Lanka | 46 | 0.1% |
| Taiwan | 1,686 | 2.8% |
| Thailand | 157 | 0.3% |
| Venezuela | 57 | 0.1% |
| Vietnam | 3,970 | 6.6% |
| Western Africa | 20 | 0.0% |
| Western Asia | 144 | 0.2% |
| Western Europe | 131 | 0.2% | View All 69 Rows |
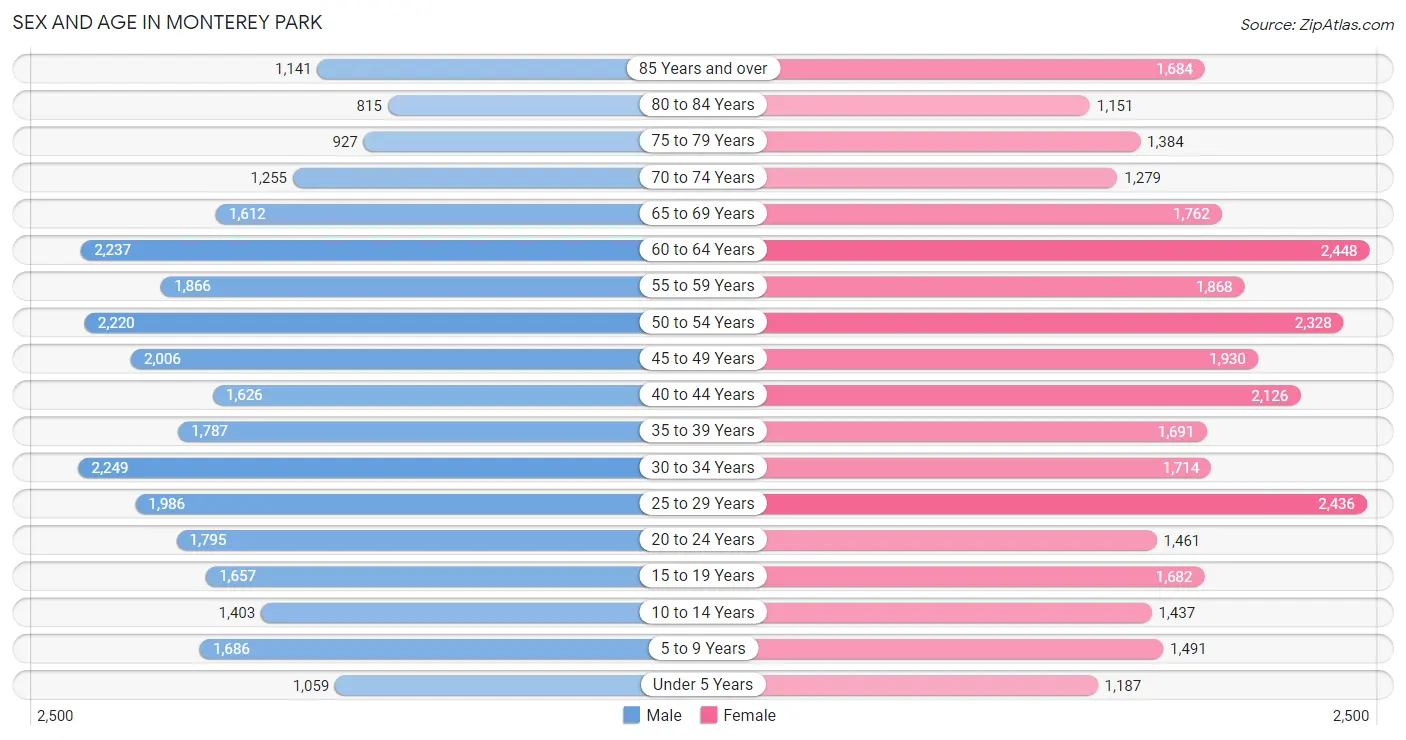
Sex and Age in Monterey Park
Sex and Age in Monterey Park
The most populous age groups in Monterey Park are 30 to 34 Years (2,249 | 7.7%) for men and 60 to 64 Years (2,448 | 7.9%) for women.
| Age Bracket | Male | Female |
| Under 5 Years | 1,059 (3.6%) | 1,187 (3.8%) |
| 5 to 9 Years | 1,686 (5.8%) | 1,491 (4.8%) |
| 10 to 14 Years | 1,403 (4.8%) | 1,437 (4.6%) |
| 15 to 19 Years | 1,657 (5.7%) | 1,682 (5.4%) |
| 20 to 24 Years | 1,795 (6.1%) | 1,461 (4.7%) |
| 25 to 29 Years | 1,986 (6.8%) | 2,436 (7.8%) |
| 30 to 34 Years | 2,249 (7.7%) | 1,714 (5.5%) |
| 35 to 39 Years | 1,787 (6.1%) | 1,691 (5.4%) |
| 40 to 44 Years | 1,626 (5.5%) | 2,126 (6.9%) |
| 45 to 49 Years | 2,006 (6.8%) | 1,930 (6.2%) |
| 50 to 54 Years | 2,220 (7.6%) | 2,328 (7.5%) |
| 55 to 59 Years | 1,866 (6.4%) | 1,868 (6.0%) |
| 60 to 64 Years | 2,237 (7.6%) | 2,448 (7.9%) |
| 65 to 69 Years | 1,612 (5.5%) | 1,762 (5.7%) |
| 70 to 74 Years | 1,255 (4.3%) | 1,279 (4.1%) |
| 75 to 79 Years | 927 (3.2%) | 1,384 (4.5%) |
| 80 to 84 Years | 815 (2.8%) | 1,151 (3.7%) |
| 85 Years and over | 1,141 (3.9%) | 1,684 (5.4%) |
| Total | 29,327 (100.0%) | 31,059 (100.0%) |
Families and Households in Monterey Park
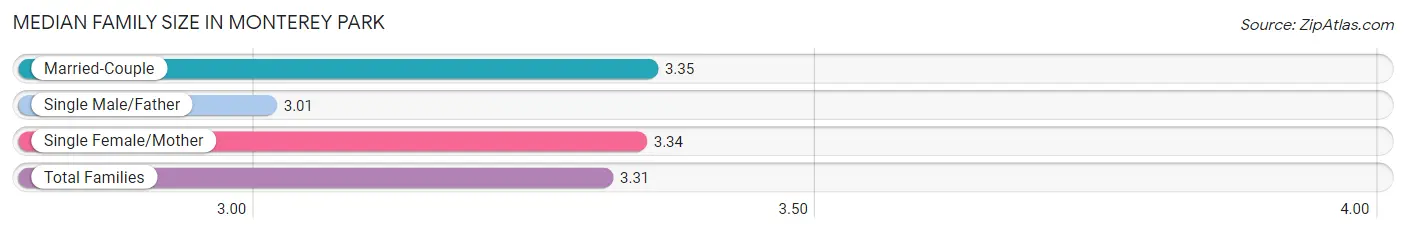
Median Family Size in Monterey Park
The median family size in Monterey Park is 3.31 persons per family, with married-couple families (10,373 | 67.6%) accounting for the largest median family size of 3.35 persons per family. On the other hand, single male/father families (1,717 | 11.2%) represent the smallest median family size with 3.01 persons per family.
| Family Type | # Families | Family Size |
| Married-Couple | 10,373 (67.6%) | 3.35 |
| Single Male/Father | 1,717 (11.2%) | 3.01 |
| Single Female/Mother | 3,244 (21.2%) | 3.34 |
| Total Families | 15,334 (100.0%) | 3.31 |
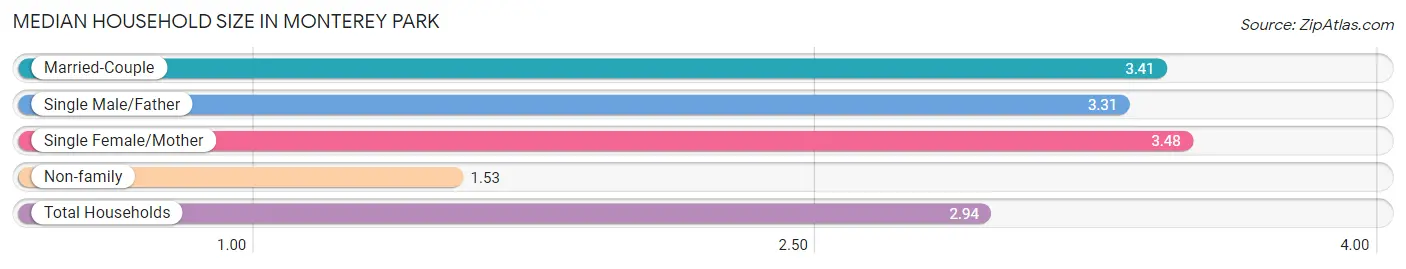
Median Household Size in Monterey Park
The median household size in Monterey Park is 2.94 persons per household, with single female/mother households (3,244 | 15.9%) accounting for the largest median household size of 3.48 persons per household. non-family households (5,082 | 24.9%) represent the smallest median household size with 1.53 persons per household.
| Household Type | # Households | Household Size |
| Married-Couple | 10,373 (50.8%) | 3.41 |
| Single Male/Father | 1,717 (8.4%) | 3.31 |
| Single Female/Mother | 3,244 (15.9%) | 3.48 |
| Non-family | 5,082 (24.9%) | 1.53 |
| Total Households | 20,416 (100.0%) | 2.94 |
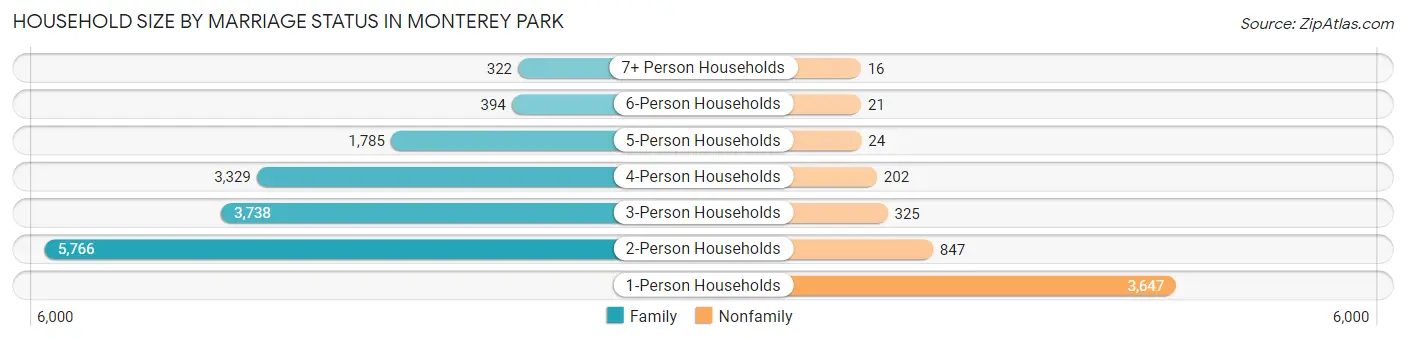
Household Size by Marriage Status in Monterey Park
Out of a total of 20,416 households in Monterey Park, 15,334 (75.1%) are family households, while 5,082 (24.9%) are nonfamily households. The most numerous type of family households are 2-person households, comprising 5,766, and the most common type of nonfamily households are 1-person households, comprising 3,647.
| Household Size | Family Households | Nonfamily Households |
| 1-Person Households | - | 3,647 (17.9%) |
| 2-Person Households | 5,766 (28.2%) | 847 (4.2%) |
| 3-Person Households | 3,738 (18.3%) | 325 (1.6%) |
| 4-Person Households | 3,329 (16.3%) | 202 (1.0%) |
| 5-Person Households | 1,785 (8.7%) | 24 (0.1%) |
| 6-Person Households | 394 (1.9%) | 21 (0.1%) |
| 7+ Person Households | 322 (1.6%) | 16 (0.1%) |
| Total | 15,334 (75.1%) | 5,082 (24.9%) |
Female Fertility in Monterey Park
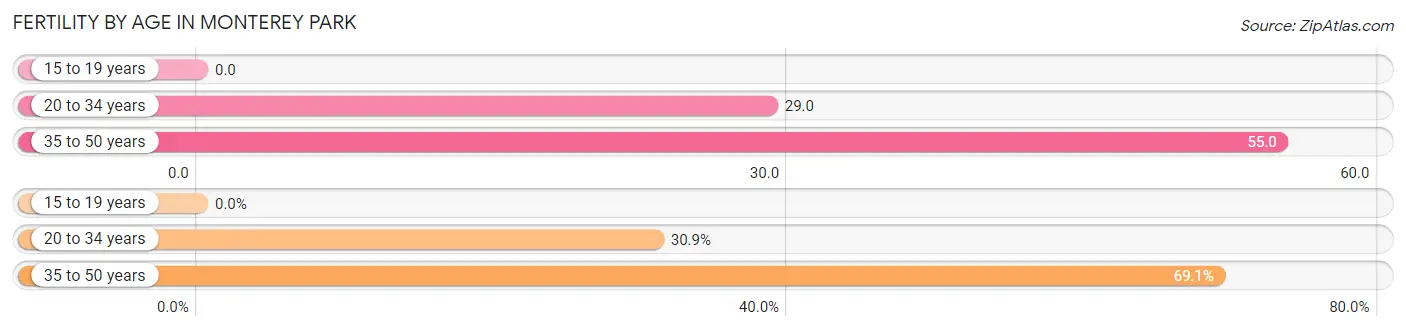
Fertility by Age in Monterey Park
Average fertility rate in Monterey Park is 38.0 births per 1,000 women. Women in the age bracket of 35 to 50 years have the highest fertility rate with 55.0 births per 1,000 women. Women in the age bracket of 35 to 50 years acount for 69.1% of all women with births.
| Age Bracket | Women with Births | Births / 1,000 Women |
| 15 to 19 years | 0 (0.0%) | 0.0 |
| 20 to 34 years | 163 (30.9%) | 29.0 |
| 35 to 50 years | 364 (69.1%) | 55.0 |
| Total | 527 (100.0%) | 38.0 |
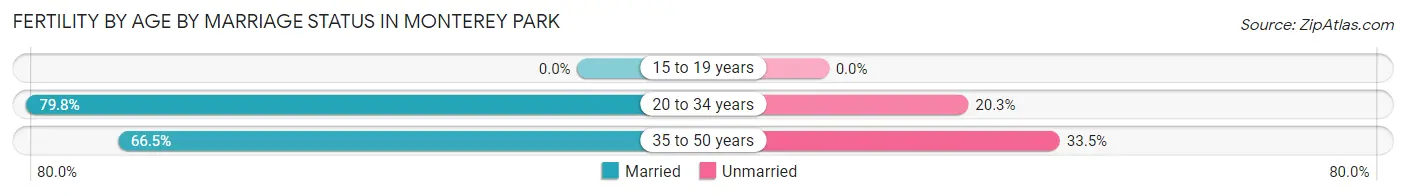
Fertility by Age by Marriage Status in Monterey Park
70.6% of women with births (527) in Monterey Park are married. The highest percentage of unmarried women with births falls into 35 to 50 years age bracket with 33.5% of them unmarried at the time of birth, while the lowest percentage of unmarried women with births belong to 20 to 34 years age bracket with 20.3% of them unmarried.
| Age Bracket | Married | Unmarried |
| 15 to 19 years | 0 (0.0%) | 0 (0.0%) |
| 20 to 34 years | 130 (79.7%) | 33 (20.3%) |
| 35 to 50 years | 242 (66.5%) | 122 (33.5%) |
| Total | 372 (70.6%) | 155 (29.4%) |
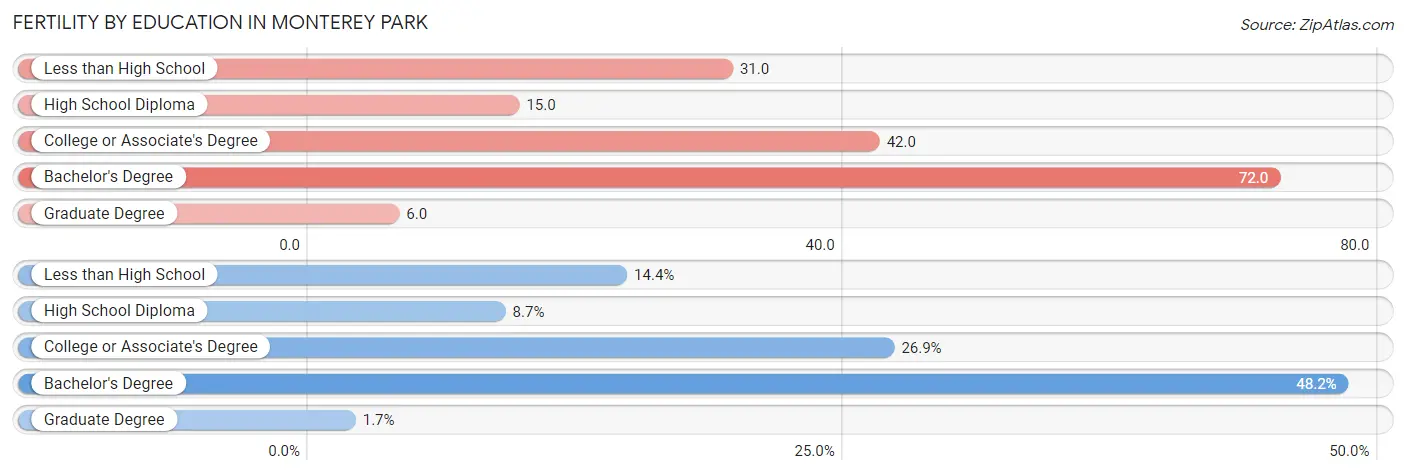
Fertility by Education in Monterey Park
Average fertility rate in Monterey Park is 38.0 births per 1,000 women. Women with the education attainment of bachelor's degree have the highest fertility rate of 72.0 births per 1,000 women, while women with the education attainment of graduate degree have the lowest fertility at 6.0 births per 1,000 women. Women with the education attainment of bachelor's degree represent 48.2% of all women with births.
| Educational Attainment | Women with Births | Births / 1,000 Women |
| Less than High School | 76 (14.4%) | 31.0 |
| High School Diploma | 46 (8.7%) | 15.0 |
| College or Associate's Degree | 142 (26.9%) | 42.0 |
| Bachelor's Degree | 254 (48.2%) | 72.0 |
| Graduate Degree | 9 (1.7%) | 6.0 |
| Total | 527 (100.0%) | 38.0 |
Fertility by Education by Marriage Status in Monterey Park
29.4% of women with births in Monterey Park are unmarried. Women with the educational attainment of less than high school are most likely to be married with 100.0% of them married at childbirth, while women with the educational attainment of bachelor's degree are least likely to be married with 45.3% of them unmarried at childbirth.
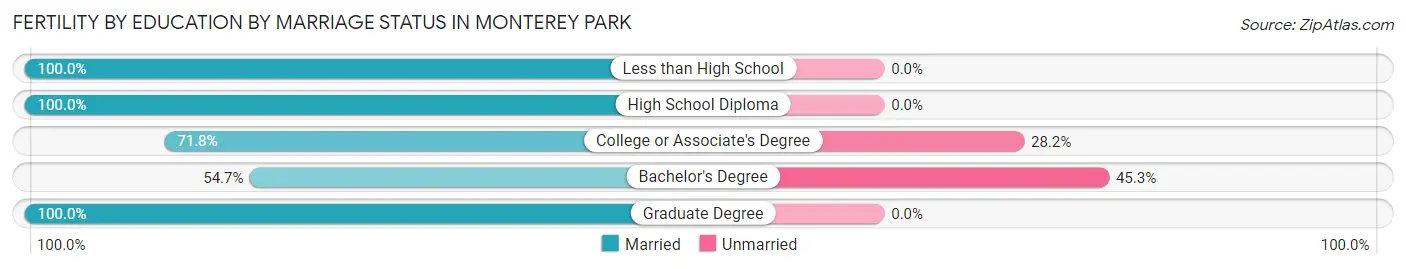
| Educational Attainment | Married | Unmarried |
| Less than High School | 76 (100.0%) | 0 (0.0%) |
| High School Diploma | 46 (100.0%) | 0 (0.0%) |
| College or Associate's Degree | 102 (71.8%) | 40 (28.2%) |
| Bachelor's Degree | 139 (54.7%) | 115 (45.3%) |
| Graduate Degree | 9 (100.0%) | 0 (0.0%) |
| Total | 372 (70.6%) | 155 (29.4%) |
Employment Characteristics in Monterey Park
Employment by Class of Employer in Monterey Park
Among the 27,645 employed individuals in Monterey Park, private company employees (18,739 | 67.8%), local government employees (2,862 | 10.3%), and not-for-profit organizations (1,885 | 6.8%) make up the most common classes of employment.
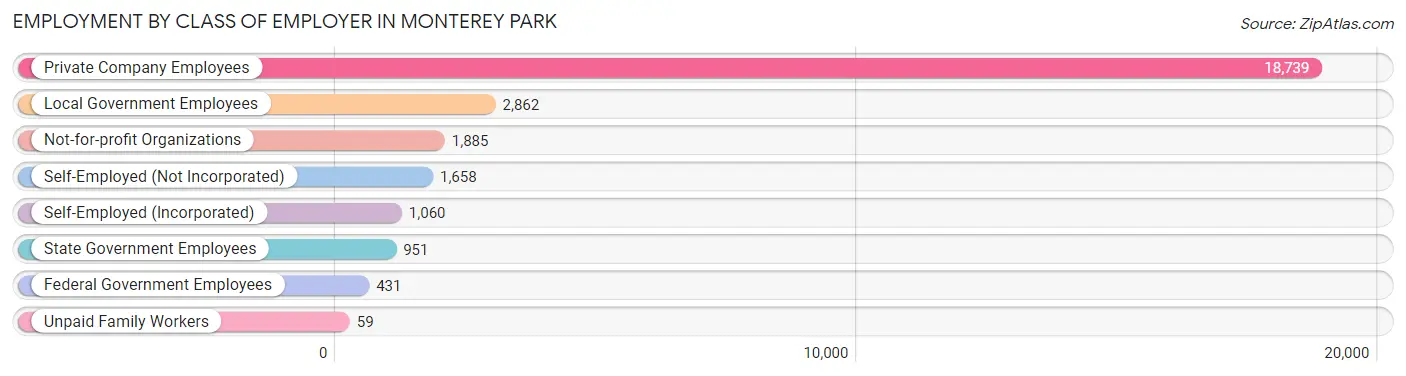
| Employer Class | # Employees | % Employees |
| Private Company Employees | 18,739 | 67.8% |
| Self-Employed (Incorporated) | 1,060 | 3.8% |
| Self-Employed (Not Incorporated) | 1,658 | 6.0% |
| Not-for-profit Organizations | 1,885 | 6.8% |
| Local Government Employees | 2,862 | 10.3% |
| State Government Employees | 951 | 3.4% |
| Federal Government Employees | 431 | 1.6% |
| Unpaid Family Workers | 59 | 0.2% |
| Total | 27,645 | 100.0% |
Employment Status by Age in Monterey Park
According to the labor force statistics for Monterey Park, out of the total population over 16 years of age (51,296), 58.5% or 30,008 individuals are in the labor force, with 5.8% or 1,740 of them unemployed. The age group with the highest labor force participation rate is 45 to 54 years, with 84.7% or 7,186 individuals in the labor force. Within the labor force, the 16 to 19 years age range has the highest percentage of unemployed individuals, with 21.6% or 77 of them being unemployed.
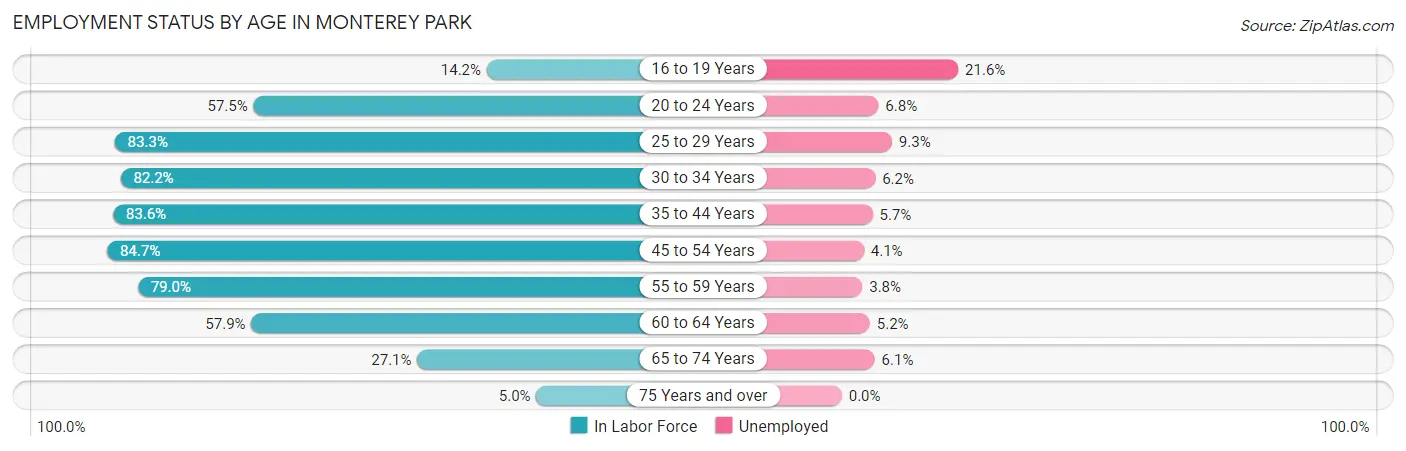
| Age Bracket | In Labor Force | Unemployed |
| 16 to 19 Years | 357 (14.2%) | 77 (21.6%) |
| 20 to 24 Years | 1,872 (57.5%) | 127 (6.8%) |
| 25 to 29 Years | 3,684 (83.3%) | 343 (9.3%) |
| 30 to 34 Years | 3,258 (82.2%) | 202 (6.2%) |
| 35 to 44 Years | 6,044 (83.6%) | 345 (5.7%) |
| 45 to 54 Years | 7,186 (84.7%) | 295 (4.1%) |
| 55 to 59 Years | 2,950 (79.0%) | 112 (3.8%) |
| 60 to 64 Years | 2,713 (57.9%) | 141 (5.2%) |
| 65 to 74 Years | 1,601 (27.1%) | 98 (6.1%) |
| 75 Years and over | 355 (5.0%) | 0 (0.0%) |
| Total | 30,008 (58.5%) | 1,740 (5.8%) |
Employment Status by Educational Attainment in Monterey Park
According to labor force statistics for Monterey Park, 79.4% of individuals (25,819) out of the total population between 25 and 64 years of age (32,518) are in the labor force, with 5.6% or 1,446 of them being unemployed. The group with the highest labor force participation rate are those with the educational attainment of bachelor's degree or higher, with 84.8% or 10,081 individuals in the labor force. Within the labor force, individuals with college / associate degree education have the highest percentage of unemployment, with 7.6% or 426 of them being unemployed.
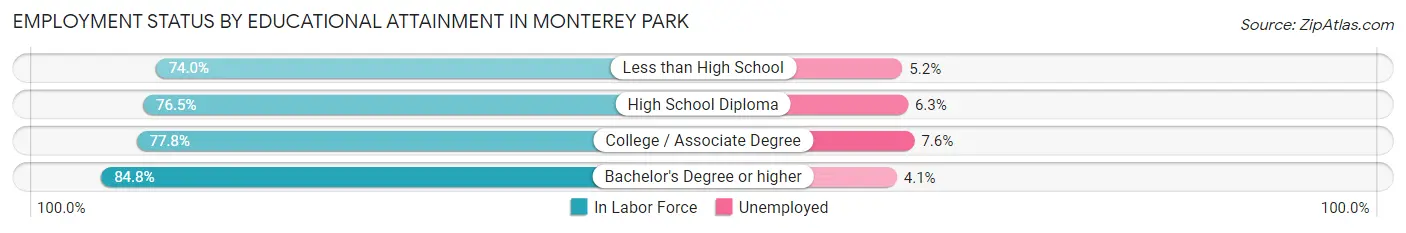
| Educational Attainment | In Labor Force | Unemployed |
| Less than High School | 3,739 (74.0%) | 263 (5.2%) |
| High School Diploma | 6,402 (76.5%) | 527 (6.3%) |
| College / Associate Degree | 5,609 (77.8%) | 548 (7.6%) |
| Bachelor's Degree or higher | 10,081 (84.8%) | 487 (4.1%) |
| Total | 25,819 (79.4%) | 1,821 (5.6%) |
Employment Occupations by Sex in Monterey Park
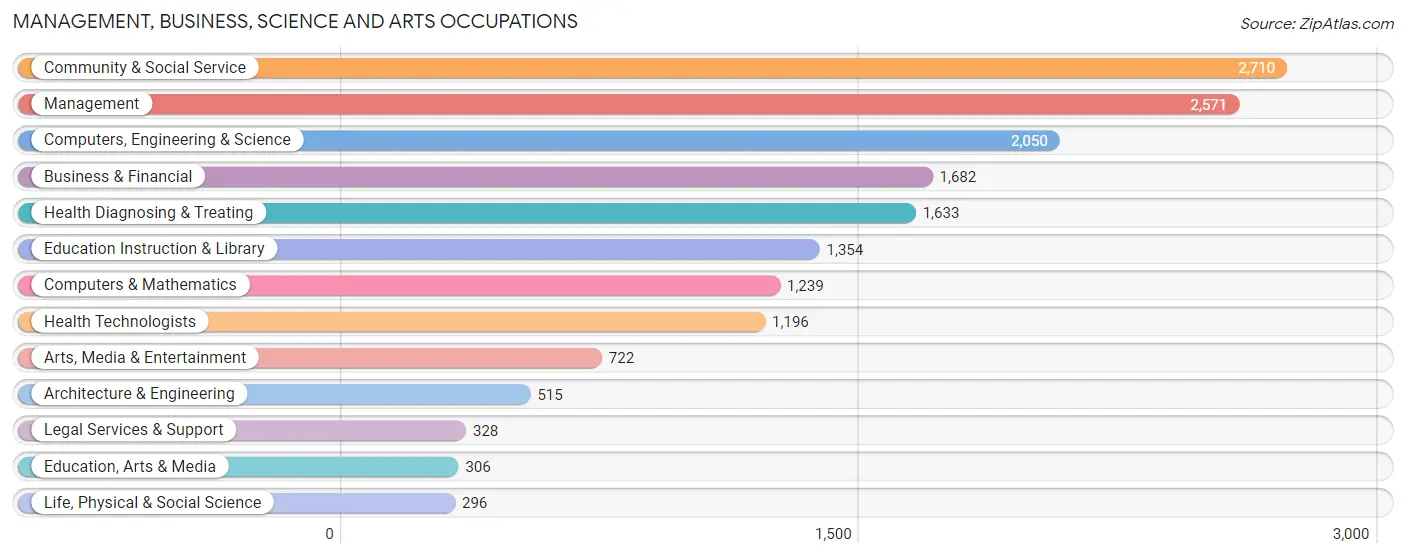
Management, Business, Science and Arts Occupations
The most common Management, Business, Science and Arts occupations in Monterey Park are Community & Social Service (2,710 | 9.6%), Management (2,571 | 9.1%), Computers, Engineering & Science (2,050 | 7.3%), Business & Financial (1,682 | 6.0%), and Health Diagnosing & Treating (1,633 | 5.8%).
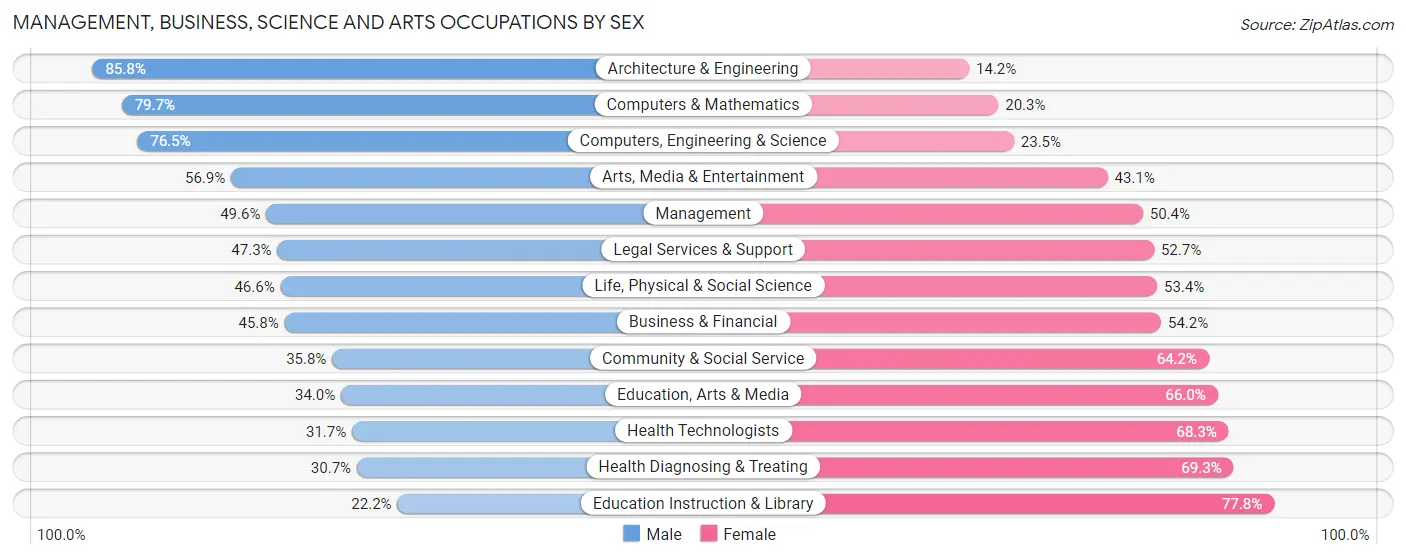
Management, Business, Science and Arts Occupations by Sex
Within the Management, Business, Science and Arts occupations in Monterey Park, the most male-oriented occupations are Architecture & Engineering (85.8%), Computers & Mathematics (79.7%), and Computers, Engineering & Science (76.5%), while the most female-oriented occupations are Education Instruction & Library (77.8%), Health Diagnosing & Treating (69.3%), and Health Technologists (68.3%).
| Occupation | Male | Female |
| Management | 1,275 (49.6%) | 1,296 (50.4%) |
| Business & Financial | 770 (45.8%) | 912 (54.2%) |
| Computers, Engineering & Science | 1,568 (76.5%) | 482 (23.5%) |
| Computers & Mathematics | 988 (79.7%) | 251 (20.3%) |
| Architecture & Engineering | 442 (85.8%) | 73 (14.2%) |
| Life, Physical & Social Science | 138 (46.6%) | 158 (53.4%) |
| Community & Social Service | 971 (35.8%) | 1,739 (64.2%) |
| Education, Arts & Media | 104 (34.0%) | 202 (66.0%) |
| Legal Services & Support | 155 (47.3%) | 173 (52.7%) |
| Education Instruction & Library | 301 (22.2%) | 1,053 (77.8%) |
| Arts, Media & Entertainment | 411 (56.9%) | 311 (43.1%) |
| Health Diagnosing & Treating | 501 (30.7%) | 1,132 (69.3%) |
| Health Technologists | 379 (31.7%) | 817 (68.3%) |
| Total (Category) | 5,085 (47.8%) | 5,561 (52.2%) |
| Total (Overall) | 14,481 (51.4%) | 13,709 (48.6%) |
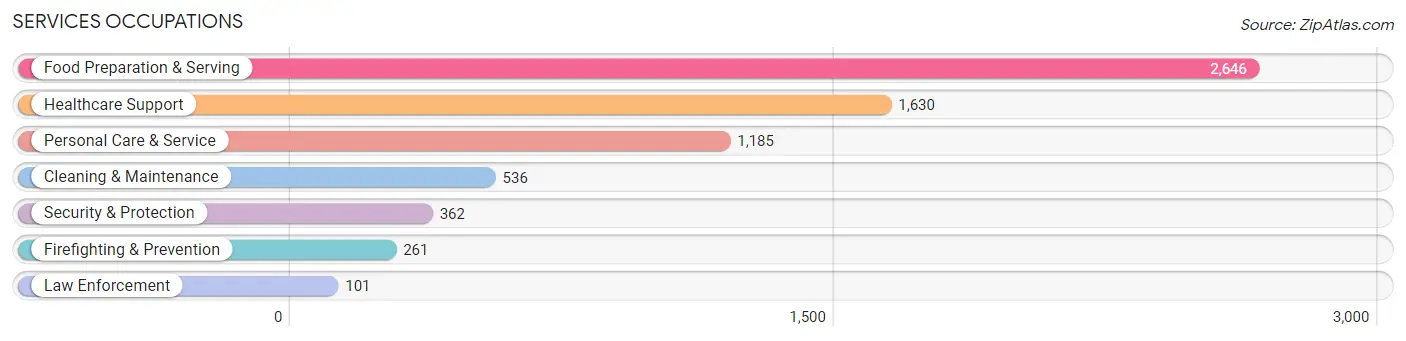
Services Occupations
The most common Services occupations in Monterey Park are Food Preparation & Serving (2,646 | 9.4%), Healthcare Support (1,630 | 5.8%), Personal Care & Service (1,185 | 4.2%), Cleaning & Maintenance (536 | 1.9%), and Security & Protection (362 | 1.3%).
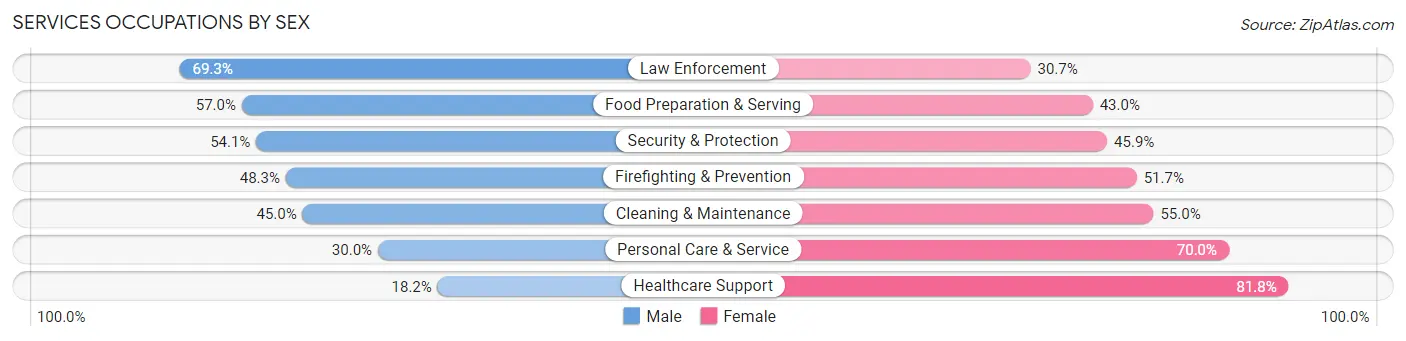
Services Occupations by Sex
Within the Services occupations in Monterey Park, the most male-oriented occupations are Law Enforcement (69.3%), Food Preparation & Serving (57.0%), and Security & Protection (54.1%), while the most female-oriented occupations are Healthcare Support (81.8%), Personal Care & Service (70.0%), and Cleaning & Maintenance (55.0%).
| Occupation | Male | Female |
| Healthcare Support | 297 (18.2%) | 1,333 (81.8%) |
| Security & Protection | 196 (54.1%) | 166 (45.9%) |
| Firefighting & Prevention | 126 (48.3%) | 135 (51.7%) |
| Law Enforcement | 70 (69.3%) | 31 (30.7%) |
| Food Preparation & Serving | 1,508 (57.0%) | 1,138 (43.0%) |
| Cleaning & Maintenance | 241 (45.0%) | 295 (55.0%) |
| Personal Care & Service | 356 (30.0%) | 829 (70.0%) |
| Total (Category) | 2,598 (40.9%) | 3,761 (59.1%) |
| Total (Overall) | 14,481 (51.4%) | 13,709 (48.6%) |
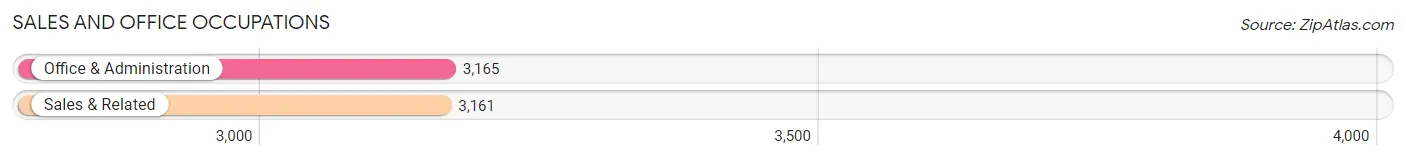
Sales and Office Occupations
The most common Sales and Office occupations in Monterey Park are Office & Administration (3,165 | 11.2%), and Sales & Related (3,161 | 11.2%).
Sales and Office Occupations by Sex
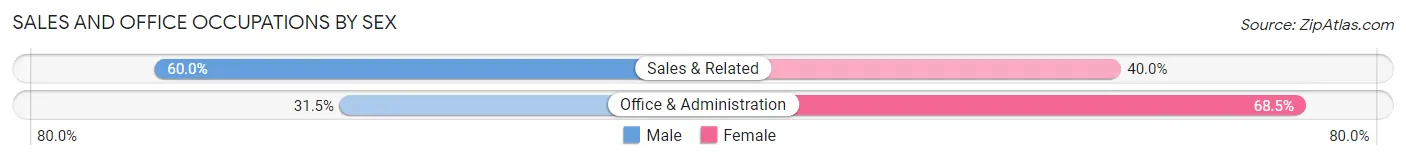
| Occupation | Male | Female |
| Sales & Related | 1,898 (60.0%) | 1,263 (40.0%) |
| Office & Administration | 997 (31.5%) | 2,168 (68.5%) |
| Total (Category) | 2,895 (45.8%) | 3,431 (54.2%) |
| Total (Overall) | 14,481 (51.4%) | 13,709 (48.6%) |
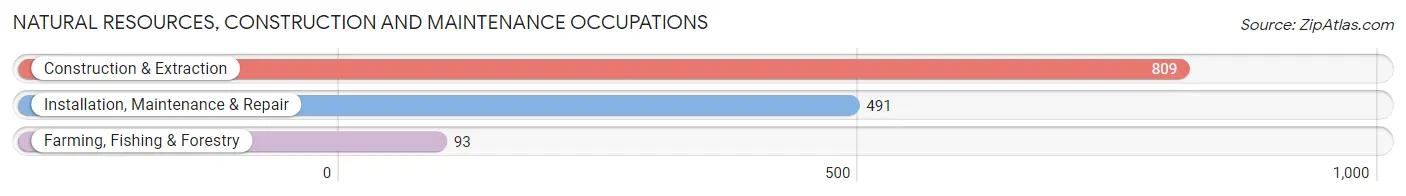
Natural Resources, Construction and Maintenance Occupations
The most common Natural Resources, Construction and Maintenance occupations in Monterey Park are Construction & Extraction (809 | 2.9%), Installation, Maintenance & Repair (491 | 1.7%), and Farming, Fishing & Forestry (93 | 0.3%).
Natural Resources, Construction and Maintenance Occupations by Sex
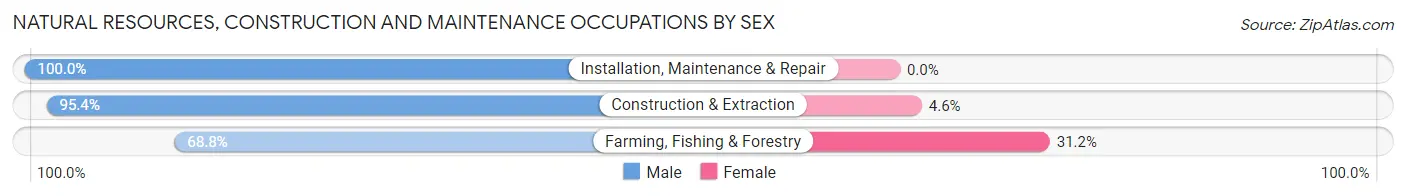
| Occupation | Male | Female |
| Farming, Fishing & Forestry | 64 (68.8%) | 29 (31.2%) |
| Construction & Extraction | 772 (95.4%) | 37 (4.6%) |
| Installation, Maintenance & Repair | 491 (100.0%) | 0 (0.0%) |
| Total (Category) | 1,327 (95.3%) | 66 (4.7%) |
| Total (Overall) | 14,481 (51.4%) | 13,709 (48.6%) |
Production, Transportation and Moving Occupations
The most common Production, Transportation and Moving occupations in Monterey Park are Transportation (1,491 | 5.3%), Production (1,221 | 4.3%), and Material Moving (754 | 2.7%).
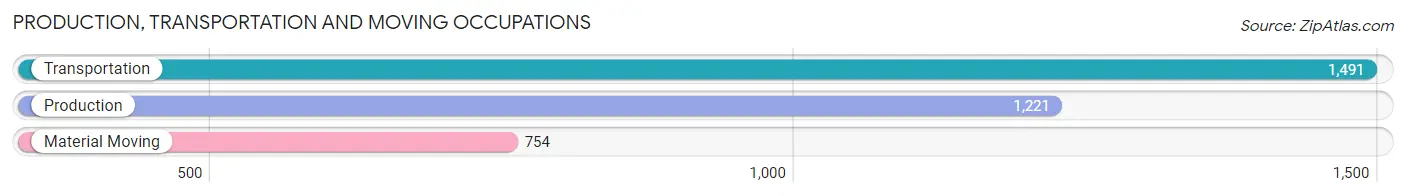
Production, Transportation and Moving Occupations by Sex
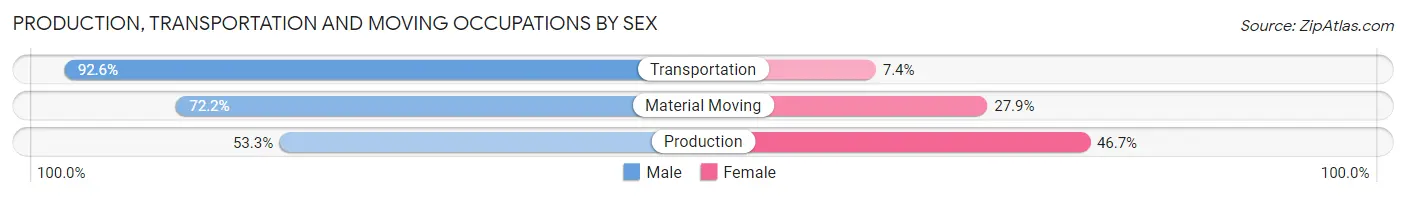
| Occupation | Male | Female |
| Production | 651 (53.3%) | 570 (46.7%) |
| Transportation | 1,381 (92.6%) | 110 (7.4%) |
| Material Moving | 544 (72.2%) | 210 (27.9%) |
| Total (Category) | 2,576 (74.3%) | 890 (25.7%) |
| Total (Overall) | 14,481 (51.4%) | 13,709 (48.6%) |
Employment Industries by Sex in Monterey Park
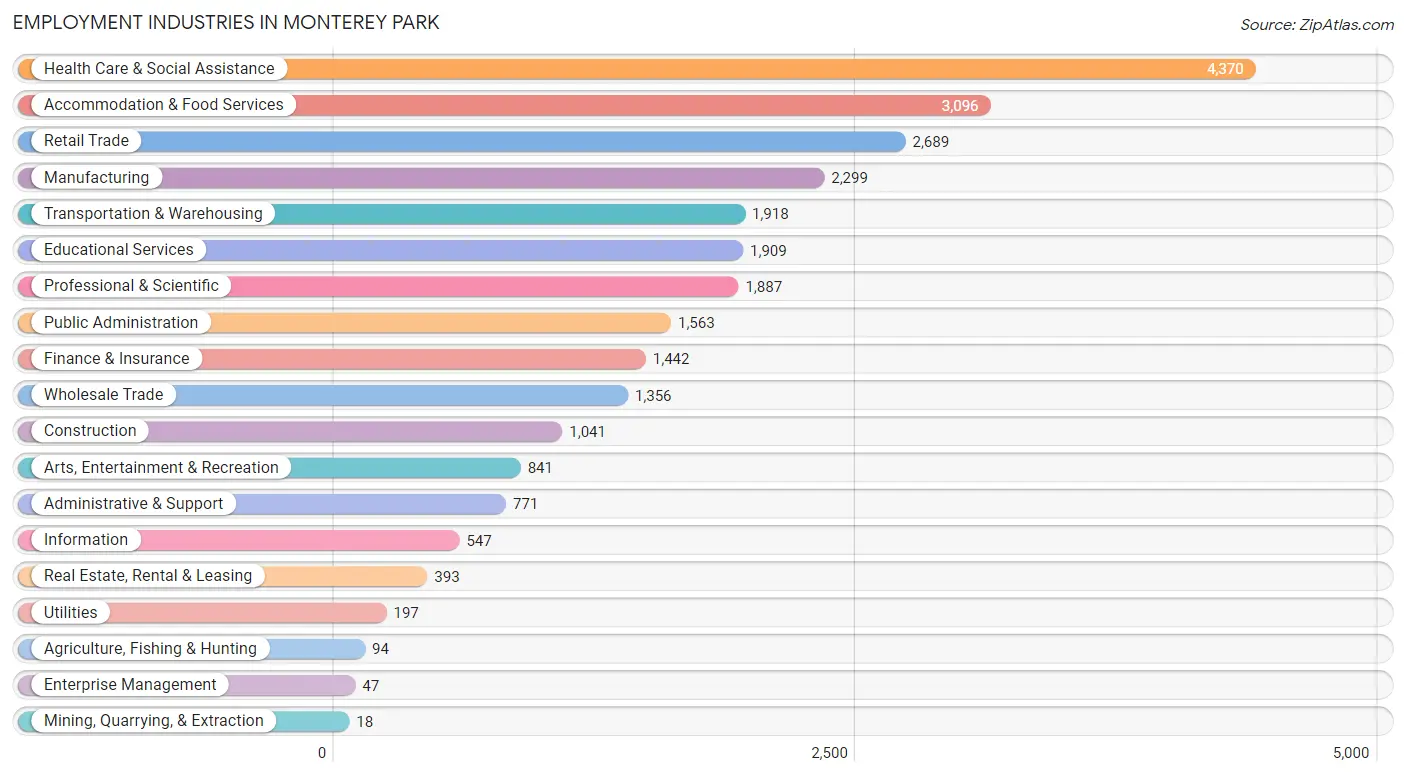
Employment Industries in Monterey Park
The major employment industries in Monterey Park include Health Care & Social Assistance (4,370 | 15.5%), Accommodation & Food Services (3,096 | 11.0%), Retail Trade (2,689 | 9.5%), Manufacturing (2,299 | 8.2%), and Transportation & Warehousing (1,918 | 6.8%).
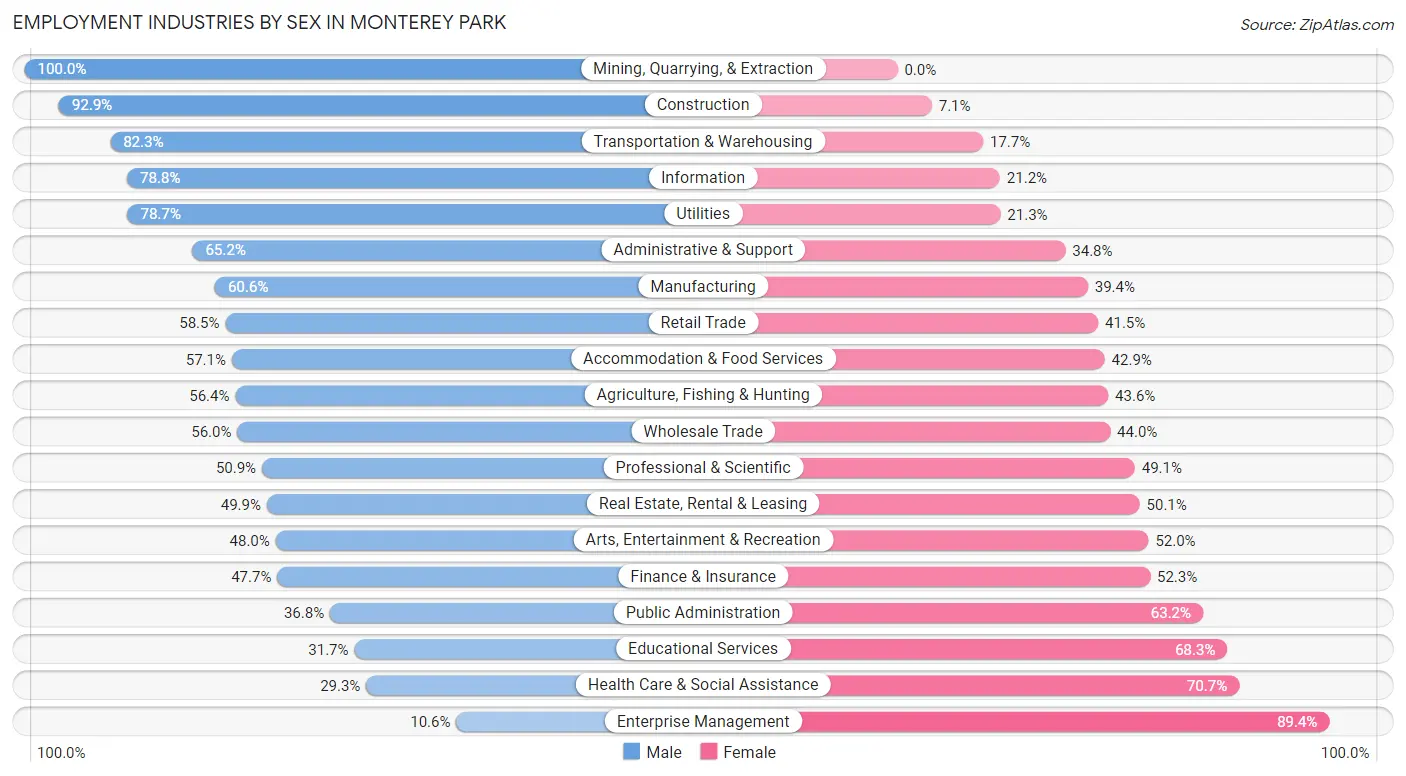
Employment Industries by Sex in Monterey Park
The Monterey Park industries that see more men than women are Mining, Quarrying, & Extraction (100.0%), Construction (92.9%), and Transportation & Warehousing (82.3%), whereas the industries that tend to have a higher number of women are Enterprise Management (89.4%), Health Care & Social Assistance (70.7%), and Educational Services (68.3%).
| Industry | Male | Female |
| Agriculture, Fishing & Hunting | 53 (56.4%) | 41 (43.6%) |
| Mining, Quarrying, & Extraction | 18 (100.0%) | 0 (0.0%) |
| Construction | 967 (92.9%) | 74 (7.1%) |
| Manufacturing | 1,393 (60.6%) | 906 (39.4%) |
| Wholesale Trade | 759 (56.0%) | 597 (44.0%) |
| Retail Trade | 1,572 (58.5%) | 1,117 (41.5%) |
| Transportation & Warehousing | 1,578 (82.3%) | 340 (17.7%) |
| Utilities | 155 (78.7%) | 42 (21.3%) |
| Information | 431 (78.8%) | 116 (21.2%) |
| Finance & Insurance | 688 (47.7%) | 754 (52.3%) |
| Real Estate, Rental & Leasing | 196 (49.9%) | 197 (50.1%) |
| Professional & Scientific | 960 (50.9%) | 927 (49.1%) |
| Enterprise Management | 5 (10.6%) | 42 (89.4%) |
| Administrative & Support | 503 (65.2%) | 268 (34.8%) |
| Educational Services | 606 (31.7%) | 1,303 (68.3%) |
| Health Care & Social Assistance | 1,280 (29.3%) | 3,090 (70.7%) |
| Arts, Entertainment & Recreation | 404 (48.0%) | 437 (52.0%) |
| Accommodation & Food Services | 1,768 (57.1%) | 1,328 (42.9%) |
| Public Administration | 575 (36.8%) | 988 (63.2%) |
| Total | 14,481 (51.4%) | 13,709 (48.6%) |
Education in Monterey Park
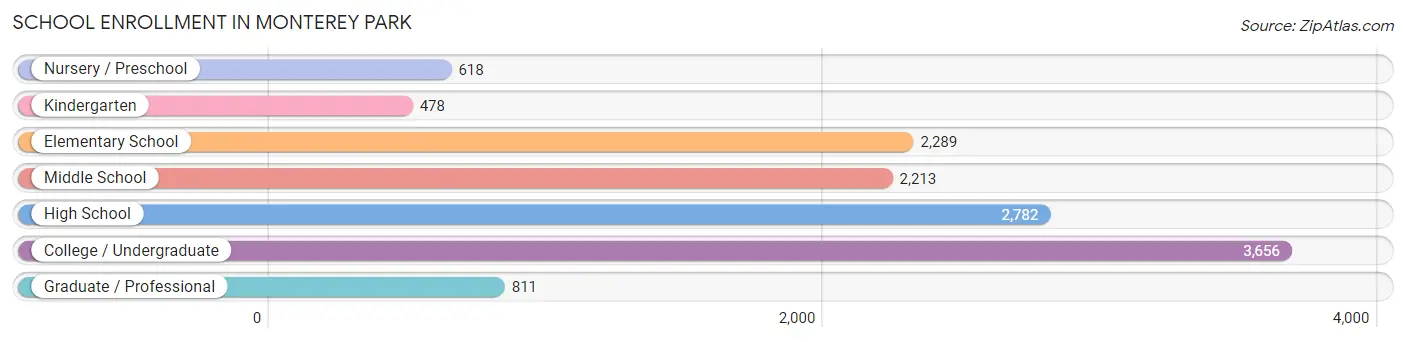
School Enrollment in Monterey Park
The most common levels of schooling among the 12,847 students in Monterey Park are college / undergraduate (3,656 | 28.5%), high school (2,782 | 21.6%), and elementary school (2,289 | 17.8%).
| School Level | # Students | % Students |
| Nursery / Preschool | 618 | 4.8% |
| Kindergarten | 478 | 3.7% |
| Elementary School | 2,289 | 17.8% |
| Middle School | 2,213 | 17.2% |
| High School | 2,782 | 21.6% |
| College / Undergraduate | 3,656 | 28.5% |
| Graduate / Professional | 811 | 6.3% |
| Total | 12,847 | 100.0% |
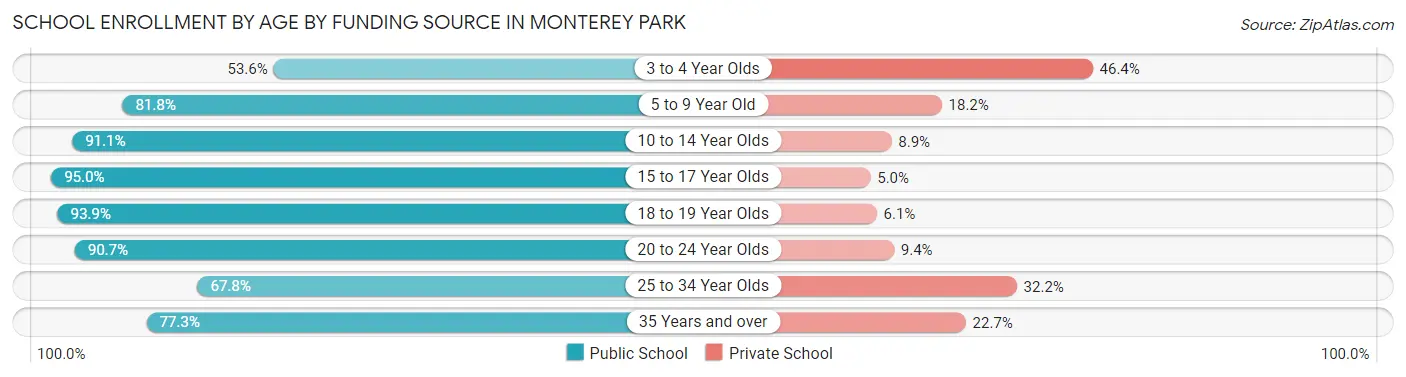
School Enrollment by Age by Funding Source in Monterey Park
Out of a total of 12,847 students who are enrolled in schools in Monterey Park, 1,850 (14.4%) attend a private institution, while the remaining 10,997 (85.6%) are enrolled in public schools. The age group of 3 to 4 year olds has the highest likelihood of being enrolled in private schools, with 211 (46.4% in the age bracket) enrolled. Conversely, the age group of 15 to 17 year olds has the lowest likelihood of being enrolled in a private school, with 1,974 (95.0% in the age bracket) attending a public institution.
| Age Bracket | Public School | Private School |
| 3 to 4 Year Olds | 244 (53.6%) | 211 (46.4%) |
| 5 to 9 Year Old | 2,299 (81.8%) | 513 (18.2%) |
| 10 to 14 Year Olds | 2,503 (91.1%) | 244 (8.9%) |
| 15 to 17 Year Olds | 1,974 (95.0%) | 103 (5.0%) |
| 18 to 19 Year Olds | 1,025 (93.9%) | 67 (6.1%) |
| 20 to 24 Year Olds | 1,629 (90.6%) | 168 (9.3%) |
| 25 to 34 Year Olds | 812 (67.8%) | 386 (32.2%) |
| 35 Years and over | 517 (77.3%) | 152 (22.7%) |
| Total | 10,997 (85.6%) | 1,850 (14.4%) |
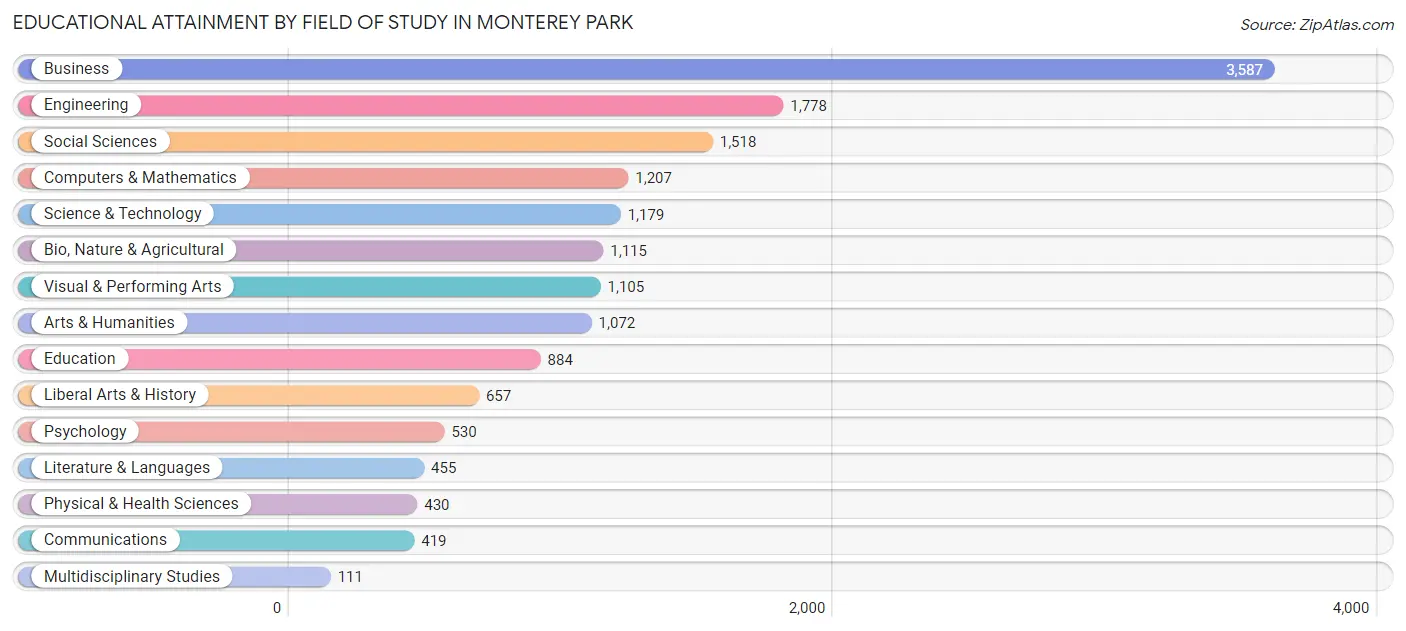
Educational Attainment by Field of Study in Monterey Park
Business (3,587 | 22.4%), engineering (1,778 | 11.1%), social sciences (1,518 | 9.5%), computers & mathematics (1,207 | 7.5%), and science & technology (1,179 | 7.3%) are the most common fields of study among 16,047 individuals in Monterey Park who have obtained a bachelor's degree or higher.
| Field of Study | # Graduates | % Graduates |
| Computers & Mathematics | 1,207 | 7.5% |
| Bio, Nature & Agricultural | 1,115 | 7.0% |
| Physical & Health Sciences | 430 | 2.7% |
| Psychology | 530 | 3.3% |
| Social Sciences | 1,518 | 9.5% |
| Engineering | 1,778 | 11.1% |
| Multidisciplinary Studies | 111 | 0.7% |
| Science & Technology | 1,179 | 7.3% |
| Business | 3,587 | 22.4% |
| Education | 884 | 5.5% |
| Literature & Languages | 455 | 2.8% |
| Liberal Arts & History | 657 | 4.1% |
| Visual & Performing Arts | 1,105 | 6.9% |
| Communications | 419 | 2.6% |
| Arts & Humanities | 1,072 | 6.7% |
| Total | 16,047 | 100.0% |
Transportation & Commute in Monterey Park
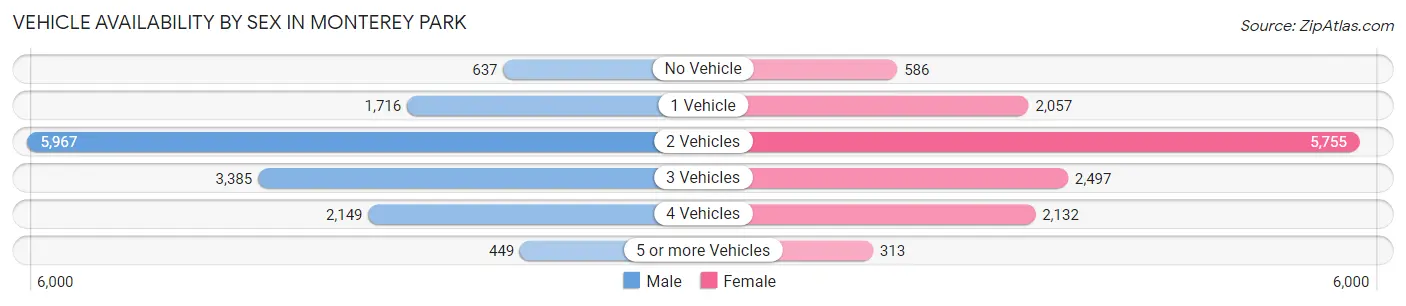
Vehicle Availability by Sex in Monterey Park
The most prevalent vehicle ownership categories in Monterey Park are males with 2 vehicles (5,967, accounting for 41.7%) and females with 2 vehicles (5,755, making up 44.7%).
| Vehicles Available | Male | Female |
| No Vehicle | 637 (4.4%) | 586 (4.4%) |
| 1 Vehicle | 1,716 (12.0%) | 2,057 (15.4%) |
| 2 Vehicles | 5,967 (41.7%) | 5,755 (43.1%) |
| 3 Vehicles | 3,385 (23.7%) | 2,497 (18.7%) |
| 4 Vehicles | 2,149 (15.0%) | 2,132 (16.0%) |
| 5 or more Vehicles | 449 (3.1%) | 313 (2.4%) |
| Total | 14,303 (100.0%) | 13,340 (100.0%) |
Commute Time in Monterey Park
The most frequently occuring commute durations in Monterey Park are 30 to 34 minutes (4,426 commuters, 18.5%), 15 to 19 minutes (3,892 commuters, 16.3%), and 20 to 24 minutes (3,279 commuters, 13.7%).
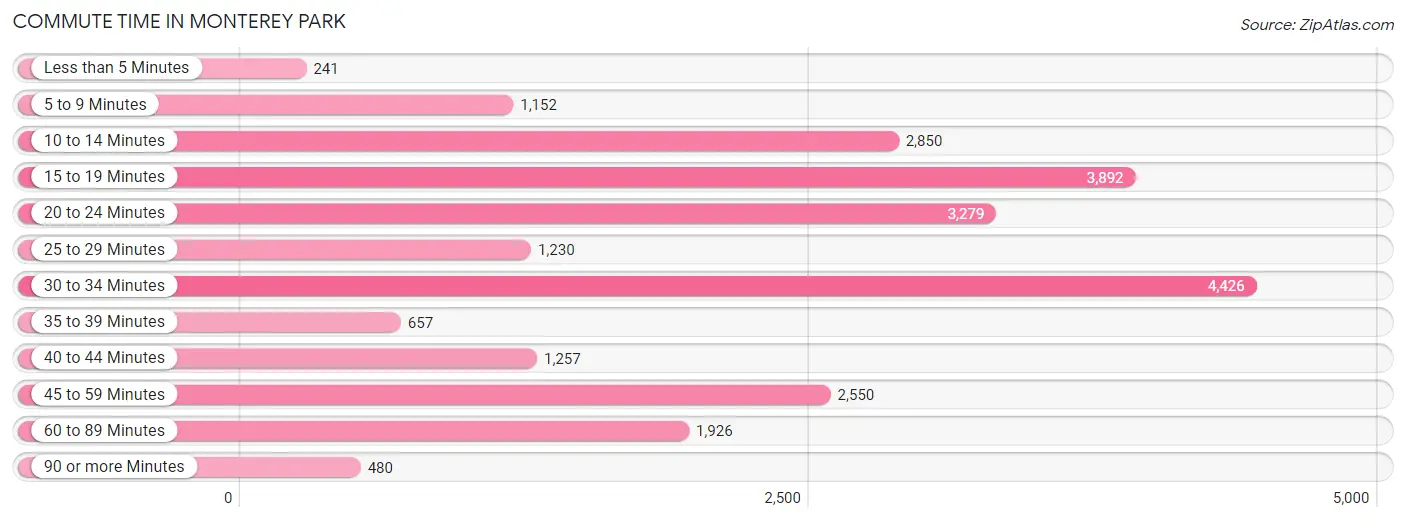
| Commute Time | # Commuters | % Commuters |
| Less than 5 Minutes | 241 | 1.0% |
| 5 to 9 Minutes | 1,152 | 4.8% |
| 10 to 14 Minutes | 2,850 | 11.9% |
| 15 to 19 Minutes | 3,892 | 16.3% |
| 20 to 24 Minutes | 3,279 | 13.7% |
| 25 to 29 Minutes | 1,230 | 5.1% |
| 30 to 34 Minutes | 4,426 | 18.5% |
| 35 to 39 Minutes | 657 | 2.7% |
| 40 to 44 Minutes | 1,257 | 5.2% |
| 45 to 59 Minutes | 2,550 | 10.6% |
| 60 to 89 Minutes | 1,926 | 8.1% |
| 90 or more Minutes | 480 | 2.0% |
Commute Time by Sex in Monterey Park
The most common commute times in Monterey Park are 30 to 34 minutes (2,521 commuters, 20.6%) for males and 15 to 19 minutes (2,193 commuters, 18.8%) for females.
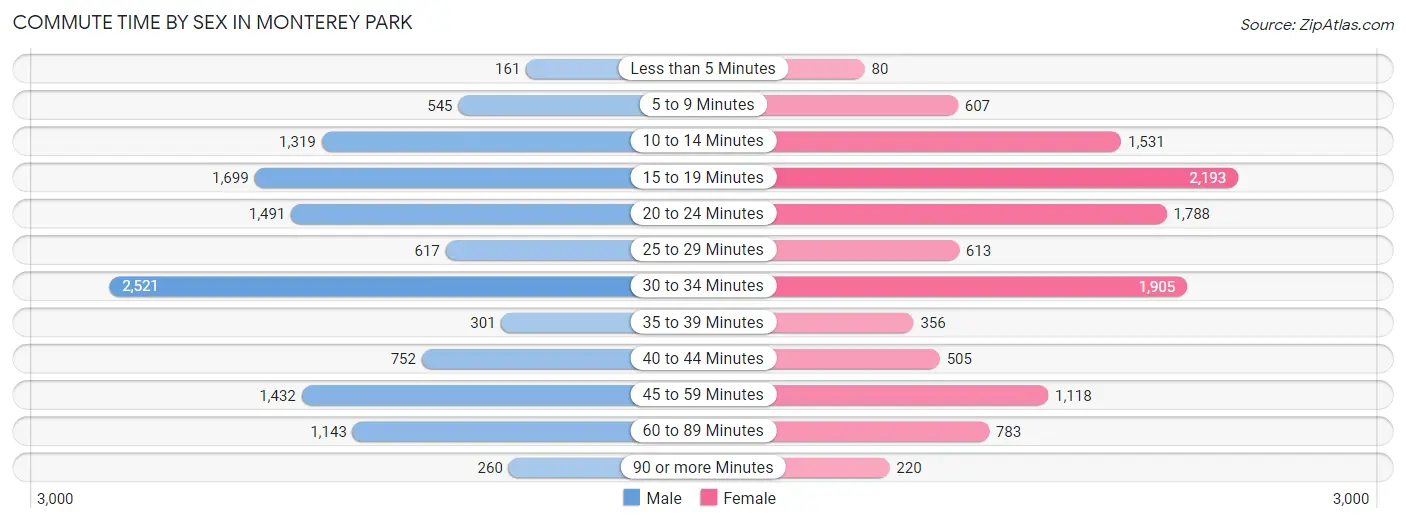
| Commute Time | Male | Female |
| Less than 5 Minutes | 161 (1.3%) | 80 (0.7%) |
| 5 to 9 Minutes | 545 (4.4%) | 607 (5.2%) |
| 10 to 14 Minutes | 1,319 (10.8%) | 1,531 (13.1%) |
| 15 to 19 Minutes | 1,699 (13.9%) | 2,193 (18.8%) |
| 20 to 24 Minutes | 1,491 (12.2%) | 1,788 (15.3%) |
| 25 to 29 Minutes | 617 (5.0%) | 613 (5.2%) |
| 30 to 34 Minutes | 2,521 (20.6%) | 1,905 (16.3%) |
| 35 to 39 Minutes | 301 (2.5%) | 356 (3.0%) |
| 40 to 44 Minutes | 752 (6.1%) | 505 (4.3%) |
| 45 to 59 Minutes | 1,432 (11.7%) | 1,118 (9.6%) |
| 60 to 89 Minutes | 1,143 (9.3%) | 783 (6.7%) |
| 90 or more Minutes | 260 (2.1%) | 220 (1.9%) |
Time of Departure to Work by Sex in Monterey Park
The most frequent times of departure to work in Monterey Park are 8:00 AM to 8:29 AM (1,872, 15.3%) for males and 9:00 AM to 9:59 AM (2,206, 18.9%) for females.
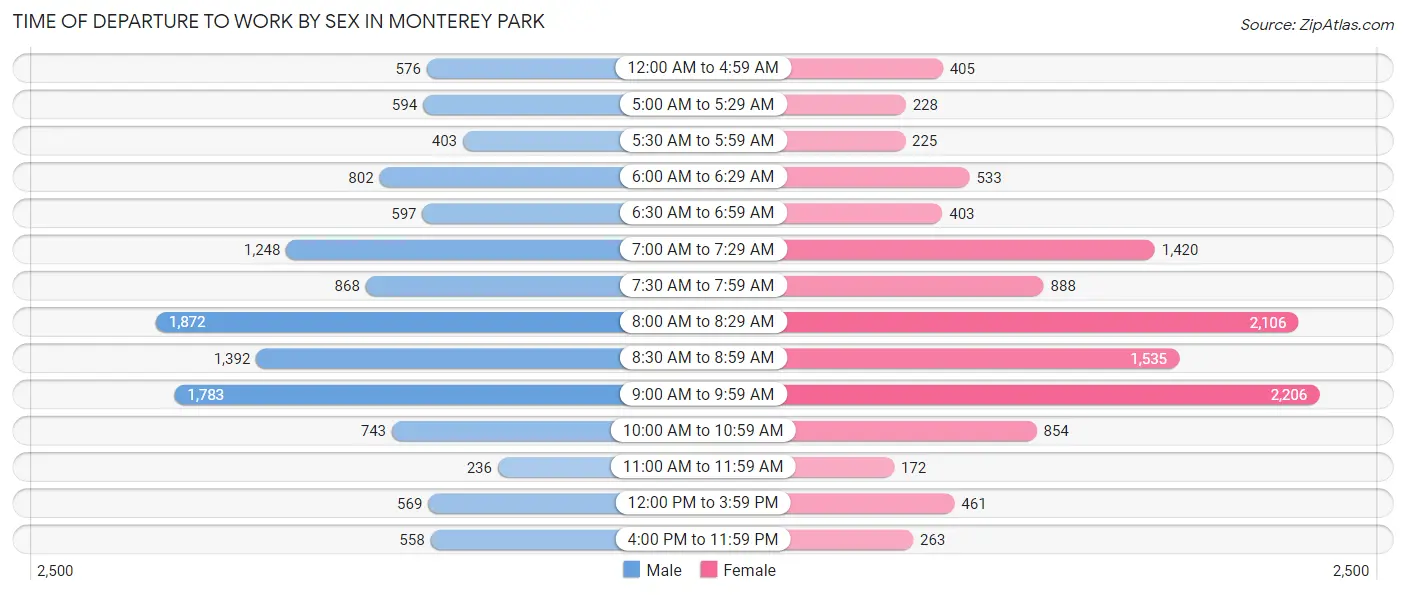
| Time of Departure | Male | Female |
| 12:00 AM to 4:59 AM | 576 (4.7%) | 405 (3.5%) |
| 5:00 AM to 5:29 AM | 594 (4.9%) | 228 (1.9%) |
| 5:30 AM to 5:59 AM | 403 (3.3%) | 225 (1.9%) |
| 6:00 AM to 6:29 AM | 802 (6.6%) | 533 (4.6%) |
| 6:30 AM to 6:59 AM | 597 (4.9%) | 403 (3.4%) |
| 7:00 AM to 7:29 AM | 1,248 (10.2%) | 1,420 (12.1%) |
| 7:30 AM to 7:59 AM | 868 (7.1%) | 888 (7.6%) |
| 8:00 AM to 8:29 AM | 1,872 (15.3%) | 2,106 (18.0%) |
| 8:30 AM to 8:59 AM | 1,392 (11.4%) | 1,535 (13.1%) |
| 9:00 AM to 9:59 AM | 1,783 (14.6%) | 2,206 (18.9%) |
| 10:00 AM to 10:59 AM | 743 (6.1%) | 854 (7.3%) |
| 11:00 AM to 11:59 AM | 236 (1.9%) | 172 (1.5%) |
| 12:00 PM to 3:59 PM | 569 (4.6%) | 461 (3.9%) |
| 4:00 PM to 11:59 PM | 558 (4.6%) | 263 (2.2%) |
| Total | 12,241 (100.0%) | 11,699 (100.0%) |
Housing Occupancy in Monterey Park
Occupancy by Ownership in Monterey Park
Of the total 20,416 dwellings in Monterey Park, owner-occupied units account for 10,300 (50.4%), while renter-occupied units make up 10,116 (49.5%).
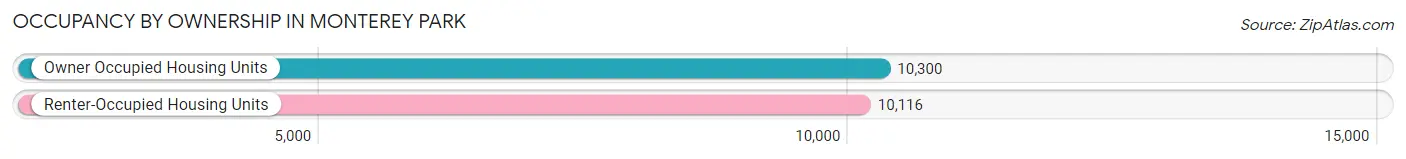
| Occupancy | # Housing Units | % Housing Units |
| Owner Occupied Housing Units | 10,300 | 50.4% |
| Renter-Occupied Housing Units | 10,116 | 49.5% |
| Total Occupied Housing Units | 20,416 | 100.0% |
Occupancy by Household Size in Monterey Park
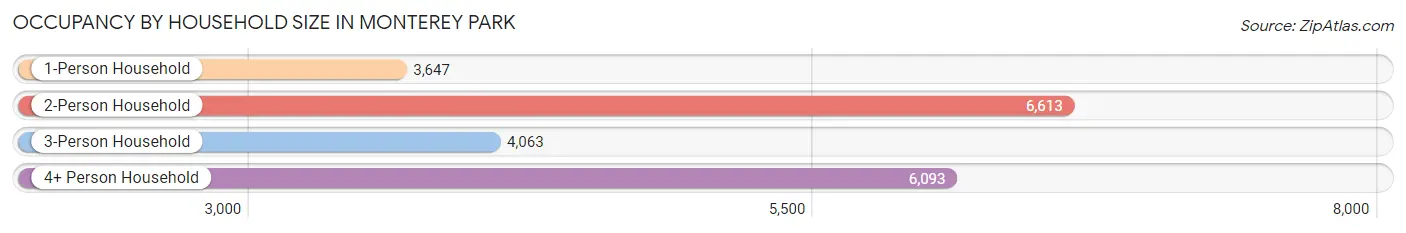
| Household Size | # Housing Units | % Housing Units |
| 1-Person Household | 3,647 | 17.9% |
| 2-Person Household | 6,613 | 32.4% |
| 3-Person Household | 4,063 | 19.9% |
| 4+ Person Household | 6,093 | 29.8% |
| Total Housing Units | 20,416 | 100.0% |
Occupancy by Ownership by Household Size in Monterey Park
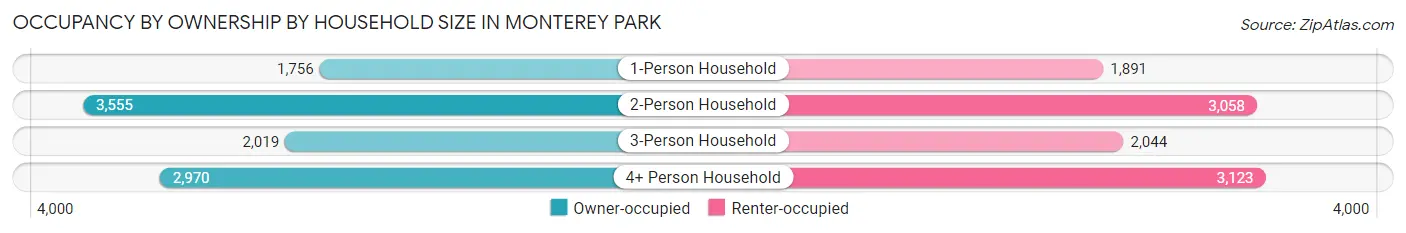
| Household Size | Owner-occupied | Renter-occupied |
| 1-Person Household | 1,756 (48.1%) | 1,891 (51.8%) |
| 2-Person Household | 3,555 (53.8%) | 3,058 (46.2%) |
| 3-Person Household | 2,019 (49.7%) | 2,044 (50.3%) |
| 4+ Person Household | 2,970 (48.7%) | 3,123 (51.3%) |
| Total Housing Units | 10,300 (50.4%) | 10,116 (49.5%) |
Occupancy by Educational Attainment in Monterey Park
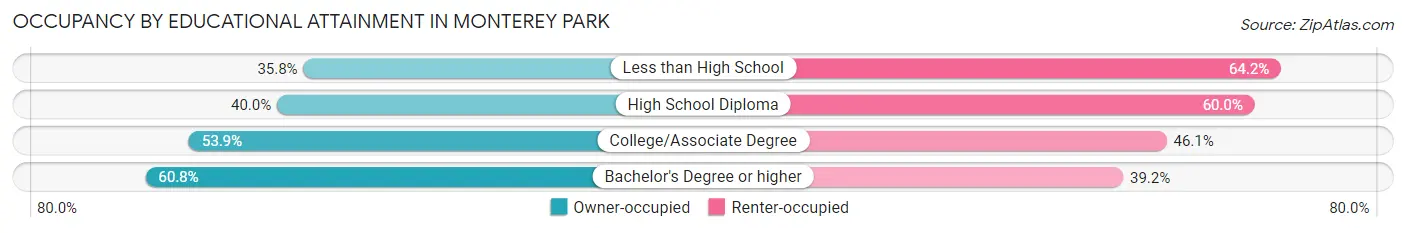
| Household Size | Owner-occupied | Renter-occupied |
| Less than High School | 1,228 (35.8%) | 2,205 (64.2%) |
| High School Diploma | 1,763 (40.0%) | 2,649 (60.0%) |
| College/Associate Degree | 2,651 (53.9%) | 2,264 (46.1%) |
| Bachelor's Degree or higher | 4,658 (60.8%) | 2,998 (39.2%) |
Occupancy by Age of Householder in Monterey Park
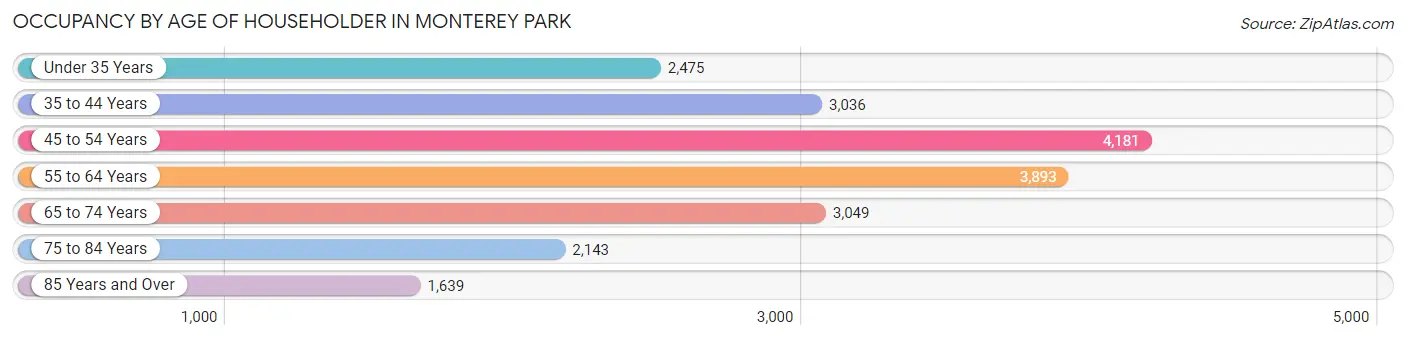
| Age Bracket | # Households | % Households |
| Under 35 Years | 2,475 | 12.1% |
| 35 to 44 Years | 3,036 | 14.9% |
| 45 to 54 Years | 4,181 | 20.5% |
| 55 to 64 Years | 3,893 | 19.1% |
| 65 to 74 Years | 3,049 | 14.9% |
| 75 to 84 Years | 2,143 | 10.5% |
| 85 Years and Over | 1,639 | 8.0% |
| Total | 20,416 | 100.0% |
Housing Finances in Monterey Park
Median Income by Occupancy in Monterey Park
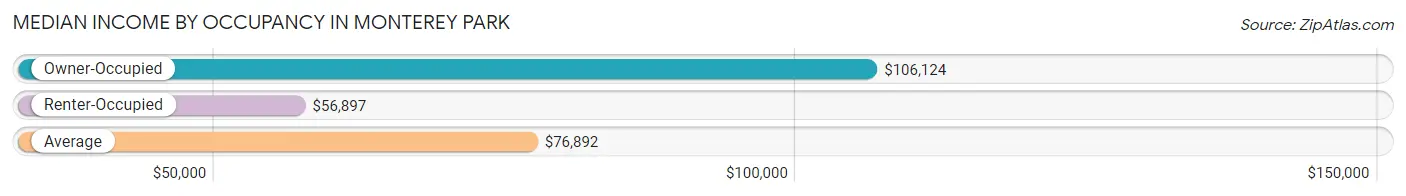
| Occupancy Type | # Households | Median Income |
| Owner-Occupied | 10,300 (50.4%) | $106,124 |
| Renter-Occupied | 10,116 (49.5%) | $56,897 |
| Average | 20,416 (100.0%) | $76,892 |
Occupancy by Householder Income Bracket in Monterey Park
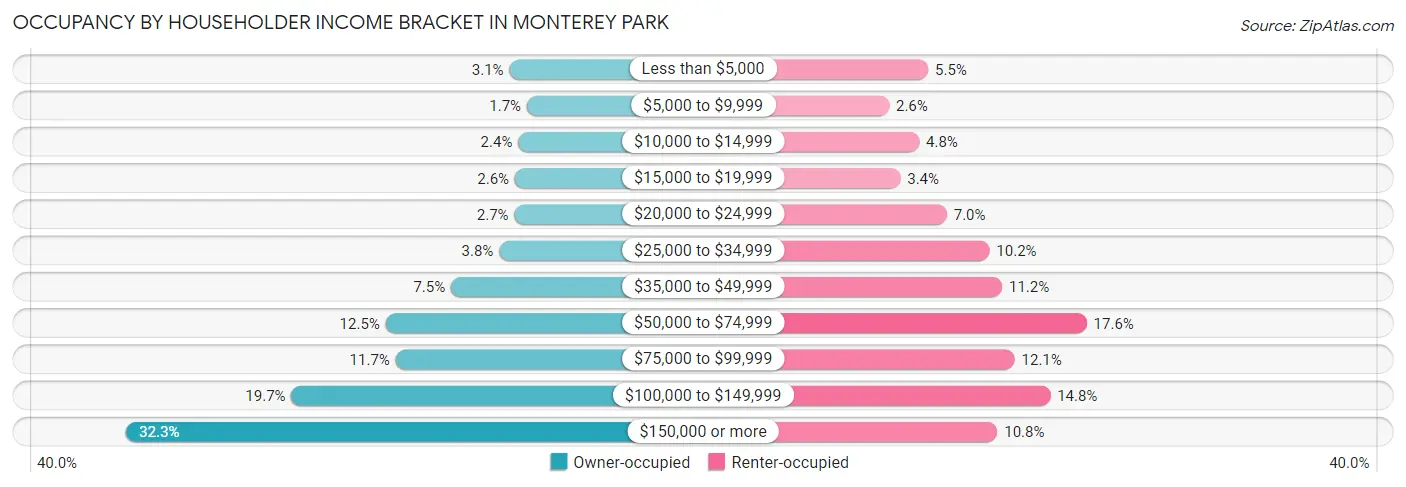
| Income Bracket | Owner-occupied | Renter-occupied |
| Less than $5,000 | 315 (3.1%) | 559 (5.5%) |
| $5,000 to $9,999 | 178 (1.7%) | 258 (2.5%) |
| $10,000 to $14,999 | 246 (2.4%) | 490 (4.8%) |
| $15,000 to $19,999 | 272 (2.6%) | 345 (3.4%) |
| $20,000 to $24,999 | 276 (2.7%) | 703 (7.0%) |
| $25,000 to $34,999 | 396 (3.8%) | 1,032 (10.2%) |
| $35,000 to $49,999 | 774 (7.5%) | 1,129 (11.2%) |
| $50,000 to $74,999 | 1,286 (12.5%) | 1,781 (17.6%) |
| $75,000 to $99,999 | 1,208 (11.7%) | 1,226 (12.1%) |
| $100,000 to $149,999 | 2,026 (19.7%) | 1,500 (14.8%) |
| $150,000 or more | 3,323 (32.3%) | 1,093 (10.8%) |
| Total | 10,300 (100.0%) | 10,116 (100.0%) |
Monthly Housing Cost Tiers in Monterey Park
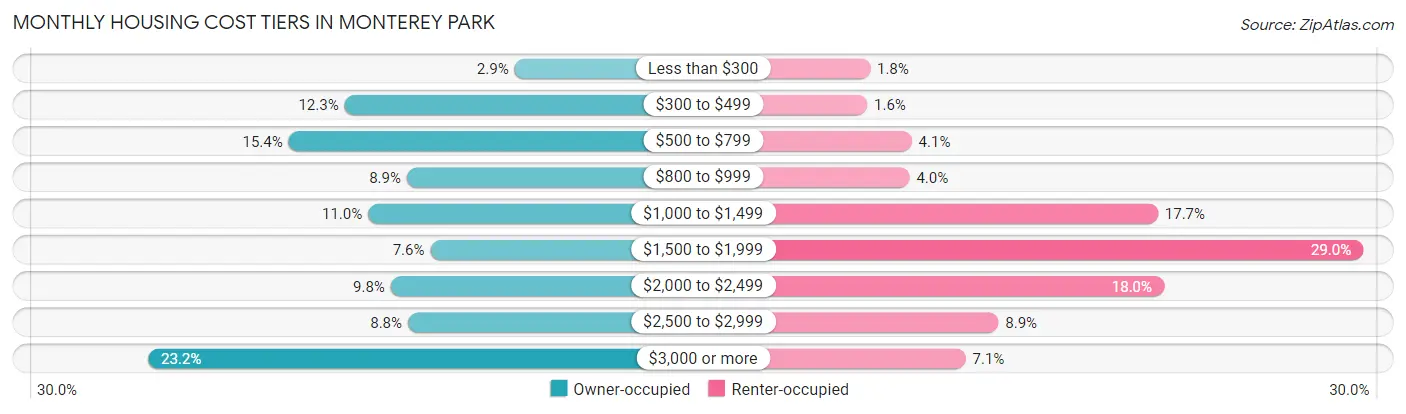
| Monthly Cost | Owner-occupied | Renter-occupied |
| Less than $300 | 303 (2.9%) | 182 (1.8%) |
| $300 to $499 | 1,270 (12.3%) | 166 (1.6%) |
| $500 to $799 | 1,588 (15.4%) | 415 (4.1%) |
| $800 to $999 | 916 (8.9%) | 403 (4.0%) |
| $1,000 to $1,499 | 1,136 (11.0%) | 1,791 (17.7%) |
| $1,500 to $1,999 | 782 (7.6%) | 2,937 (29.0%) |
| $2,000 to $2,499 | 1,007 (9.8%) | 1,824 (18.0%) |
| $2,500 to $2,999 | 910 (8.8%) | 899 (8.9%) |
| $3,000 or more | 2,388 (23.2%) | 716 (7.1%) |
| Total | 10,300 (100.0%) | 10,116 (100.0%) |
Physical Housing Characteristics in Monterey Park
Housing Structures in Monterey Park
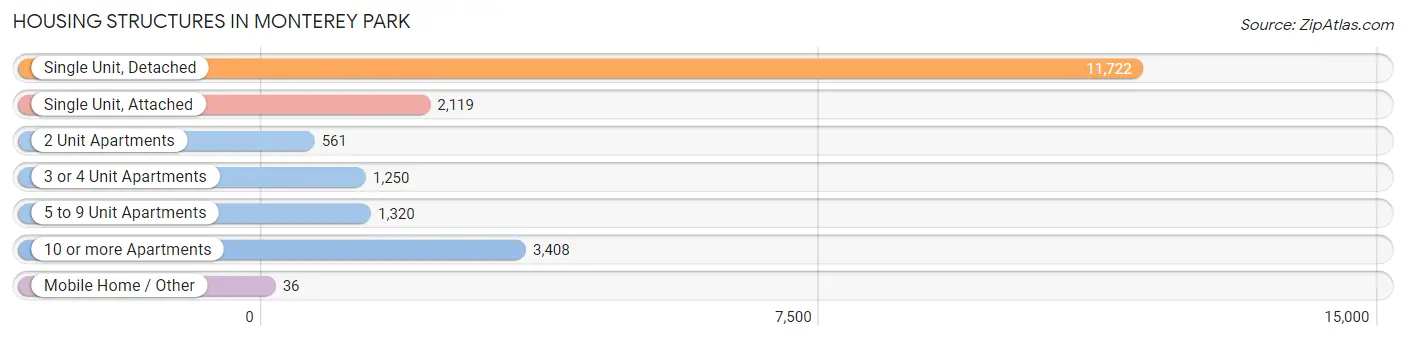
| Structure Type | # Housing Units | % Housing Units |
| Single Unit, Detached | 11,722 | 57.4% |
| Single Unit, Attached | 2,119 | 10.4% |
| 2 Unit Apartments | 561 | 2.8% |
| 3 or 4 Unit Apartments | 1,250 | 6.1% |
| 5 to 9 Unit Apartments | 1,320 | 6.5% |
| 10 or more Apartments | 3,408 | 16.7% |
| Mobile Home / Other | 36 | 0.2% |
| Total | 20,416 | 100.0% |
Housing Structures by Occupancy in Monterey Park
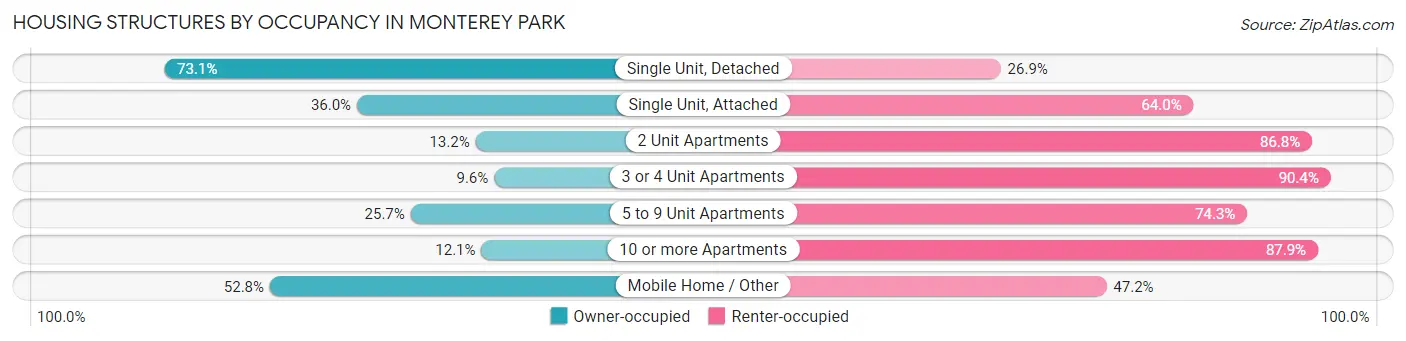
| Structure Type | Owner-occupied | Renter-occupied |
| Single Unit, Detached | 8,574 (73.1%) | 3,148 (26.9%) |
| Single Unit, Attached | 763 (36.0%) | 1,356 (64.0%) |
| 2 Unit Apartments | 74 (13.2%) | 487 (86.8%) |
| 3 or 4 Unit Apartments | 120 (9.6%) | 1,130 (90.4%) |
| 5 to 9 Unit Apartments | 339 (25.7%) | 981 (74.3%) |
| 10 or more Apartments | 411 (12.1%) | 2,997 (87.9%) |
| Mobile Home / Other | 19 (52.8%) | 17 (47.2%) |
| Total | 10,300 (50.4%) | 10,116 (49.5%) |
Housing Structures by Number of Rooms in Monterey Park
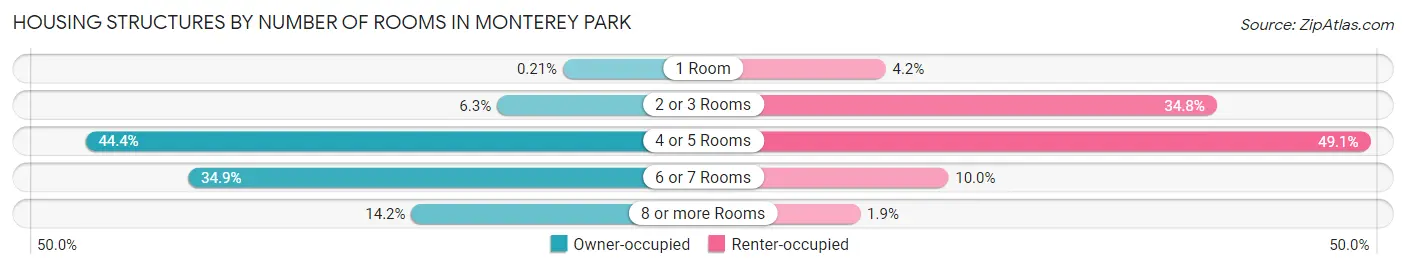
| Number of Rooms | Owner-occupied | Renter-occupied |
| 1 Room | 22 (0.2%) | 427 (4.2%) |
| 2 or 3 Rooms | 650 (6.3%) | 3,524 (34.8%) |
| 4 or 5 Rooms | 4,570 (44.4%) | 4,962 (49.0%) |
| 6 or 7 Rooms | 3,592 (34.9%) | 1,014 (10.0%) |
| 8 or more Rooms | 1,466 (14.2%) | 189 (1.9%) |
| Total | 10,300 (100.0%) | 10,116 (100.0%) |
Housing Structure by Heating Type in Monterey Park
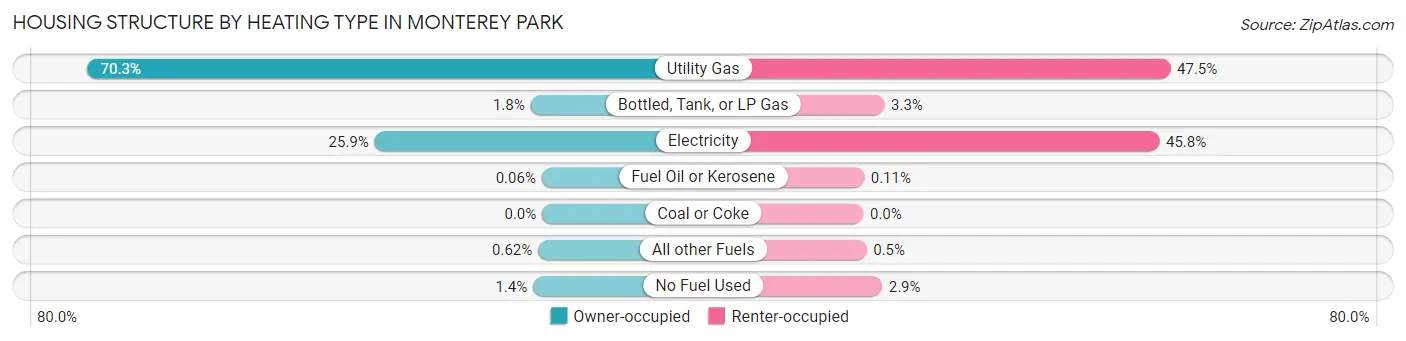
| Heating Type | Owner-occupied | Renter-occupied |
| Utility Gas | 7,236 (70.3%) | 4,802 (47.5%) |
| Bottled, Tank, or LP Gas | 183 (1.8%) | 330 (3.3%) |
| Electricity | 2,667 (25.9%) | 4,629 (45.8%) |
| Fuel Oil or Kerosene | 6 (0.1%) | 11 (0.1%) |
| Coal or Coke | 0 (0.0%) | 0 (0.0%) |
| All other Fuels | 64 (0.6%) | 51 (0.5%) |
| No Fuel Used | 144 (1.4%) | 293 (2.9%) |
| Total | 10,300 (100.0%) | 10,116 (100.0%) |
Household Vehicle Usage in Monterey Park
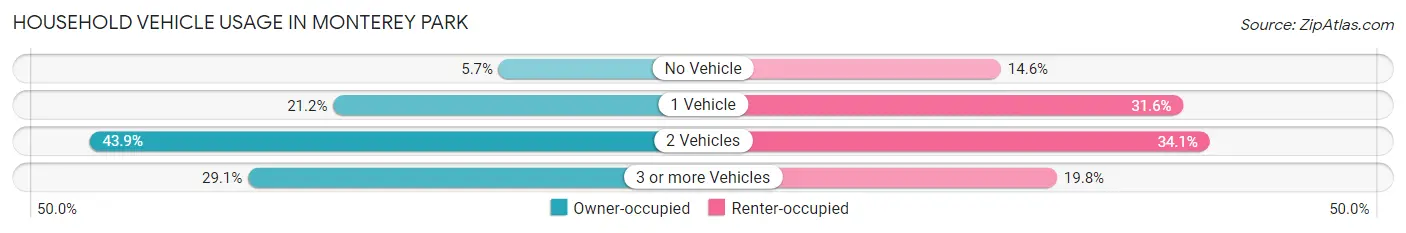
| Vehicles per Household | Owner-occupied | Renter-occupied |
| No Vehicle | 590 (5.7%) | 1,473 (14.6%) |
| 1 Vehicle | 2,183 (21.2%) | 3,197 (31.6%) |
| 2 Vehicles | 4,526 (43.9%) | 3,444 (34.1%) |
| 3 or more Vehicles | 3,001 (29.1%) | 2,002 (19.8%) |
| Total | 10,300 (100.0%) | 10,116 (100.0%) |
Real Estate & Mortgages in Monterey Park
Real Estate and Mortgage Overview in Monterey Park
| Characteristic | Without Mortgage | With Mortgage |
| Housing Units | 5,003 | 5,297 |
| Median Property Value | $741,000 | $796,200 |
| Median Household Income | $80,976 | $2,276 |
| Monthly Housing Costs | $681 | $2,375 |
| Real Estate Taxes | $3,959 | $87 |
Property Value by Mortgage Status in Monterey Park
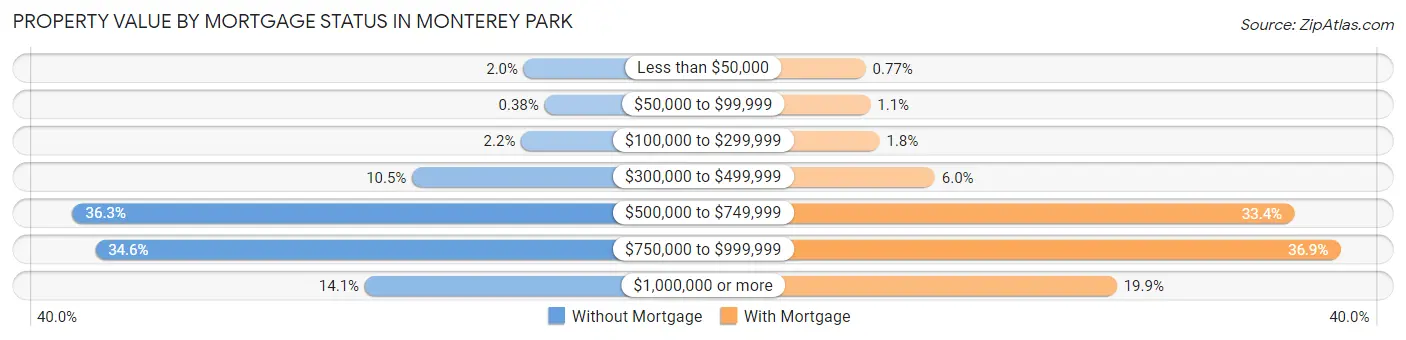
| Property Value | Without Mortgage | With Mortgage |
| Less than $50,000 | 98 (2.0%) | 41 (0.8%) |
| $50,000 to $99,999 | 19 (0.4%) | 60 (1.1%) |
| $100,000 to $299,999 | 108 (2.2%) | 97 (1.8%) |
| $300,000 to $499,999 | 524 (10.5%) | 320 (6.0%) |
| $500,000 to $749,999 | 1,818 (36.3%) | 1,769 (33.4%) |
| $750,000 to $999,999 | 1,732 (34.6%) | 1,956 (36.9%) |
| $1,000,000 or more | 704 (14.1%) | 1,054 (19.9%) |
| Total | 5,003 (100.0%) | 5,297 (100.0%) |
Household Income by Mortgage Status in Monterey Park
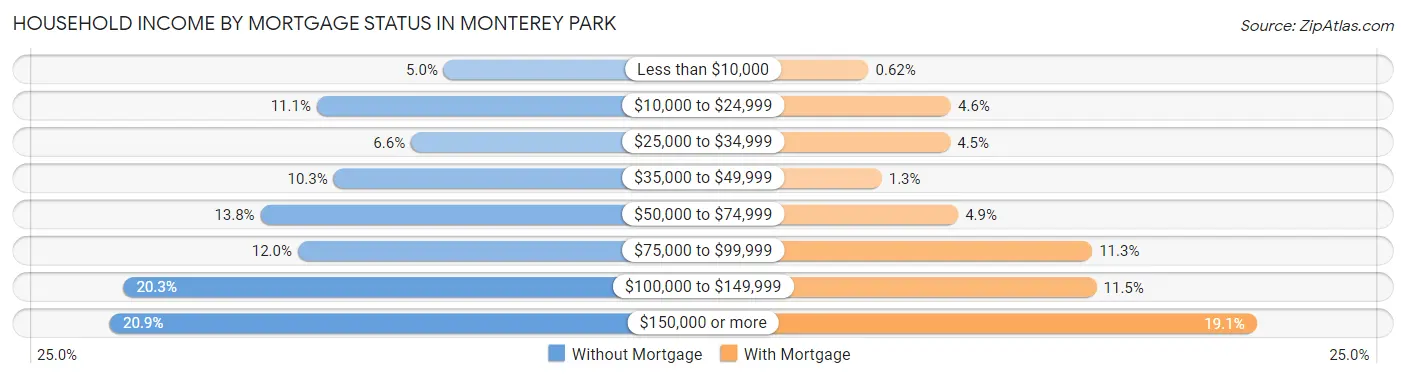
| Household Income | Without Mortgage | With Mortgage |
| Less than $10,000 | 252 (5.0%) | 33 (0.6%) |
| $10,000 to $24,999 | 555 (11.1%) | 241 (4.5%) |
| $25,000 to $34,999 | 330 (6.6%) | 239 (4.5%) |
| $35,000 to $49,999 | 515 (10.3%) | 66 (1.3%) |
| $50,000 to $74,999 | 689 (13.8%) | 259 (4.9%) |
| $75,000 to $99,999 | 600 (12.0%) | 597 (11.3%) |
| $100,000 to $149,999 | 1,015 (20.3%) | 608 (11.5%) |
| $150,000 or more | 1,047 (20.9%) | 1,011 (19.1%) |
| Total | 5,003 (100.0%) | 5,297 (100.0%) |
Property Value to Household Income Ratio in Monterey Park
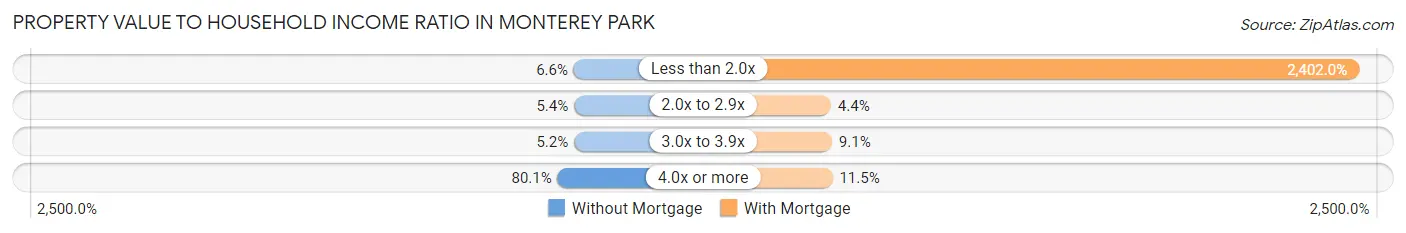
| Value-to-Income Ratio | Without Mortgage | With Mortgage |
| Less than 2.0x | 330 (6.6%) | 127,233 (2,402.0%) |
| 2.0x to 2.9x | 270 (5.4%) | 233 (4.4%) |
| 3.0x to 3.9x | 262 (5.2%) | 483 (9.1%) |
| 4.0x or more | 4,008 (80.1%) | 611 (11.5%) |
| Total | 5,003 (100.0%) | 5,297 (100.0%) |
Real Estate Taxes by Mortgage Status in Monterey Park
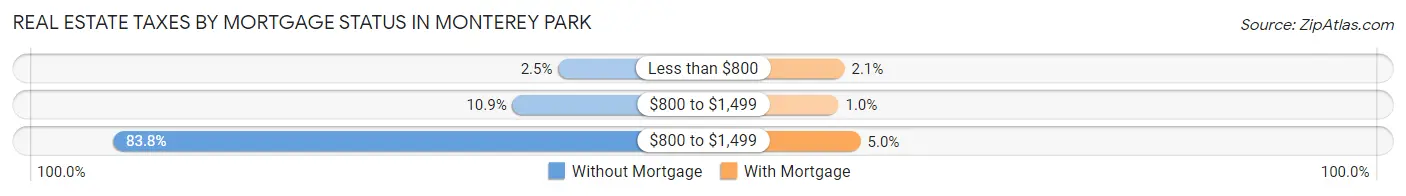
| Property Taxes | Without Mortgage | With Mortgage |
| Less than $800 | 126 (2.5%) | 111 (2.1%) |
| $800 to $1,499 | 545 (10.9%) | 53 (1.0%) |
| $800 to $1,499 | 4,194 (83.8%) | 267 (5.0%) |
| Total | 5,003 (100.0%) | 5,297 (100.0%) |
Health & Disability in Monterey Park
Health Insurance Coverage by Age in Monterey Park
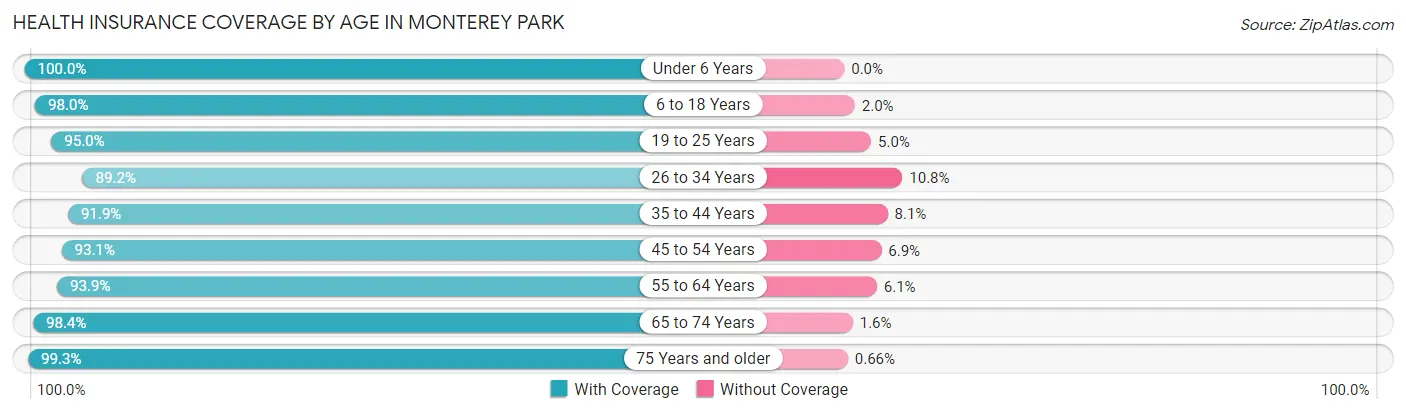
| Age Bracket | With Coverage | Without Coverage |
| Under 6 Years | 3,068 (100.0%) | 0 (0.0%) |
| 6 to 18 Years | 7,869 (98.0%) | 158 (2.0%) |
| 19 to 25 Years | 4,367 (95.0%) | 230 (5.0%) |
| 26 to 34 Years | 6,643 (89.2%) | 807 (10.8%) |
| 35 to 44 Years | 6,632 (91.9%) | 583 (8.1%) |
| 45 to 54 Years | 7,891 (93.1%) | 586 (6.9%) |
| 55 to 64 Years | 7,873 (93.9%) | 509 (6.1%) |
| 65 to 74 Years | 5,800 (98.4%) | 93 (1.6%) |
| 75 Years and older | 6,909 (99.3%) | 46 (0.7%) |
| Total | 57,052 (95.0%) | 3,012 (5.0%) |
Health Insurance Coverage by Citizenship Status in Monterey Park
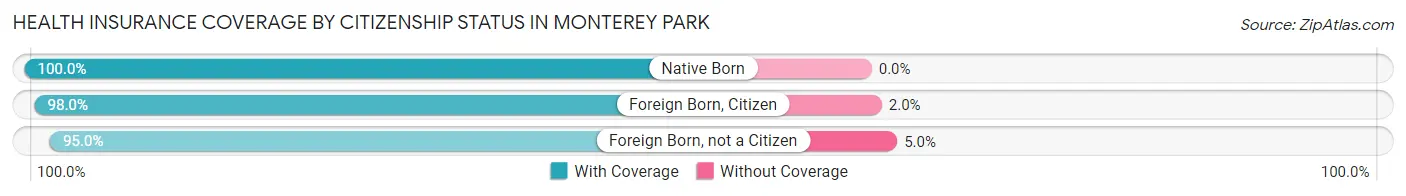
| Citizenship Status | With Coverage | Without Coverage |
| Native Born | 3,068 (100.0%) | 0 (0.0%) |
| Foreign Born, Citizen | 7,869 (98.0%) | 158 (2.0%) |
| Foreign Born, not a Citizen | 4,367 (95.0%) | 230 (5.0%) |
Health Insurance Coverage by Household Income in Monterey Park
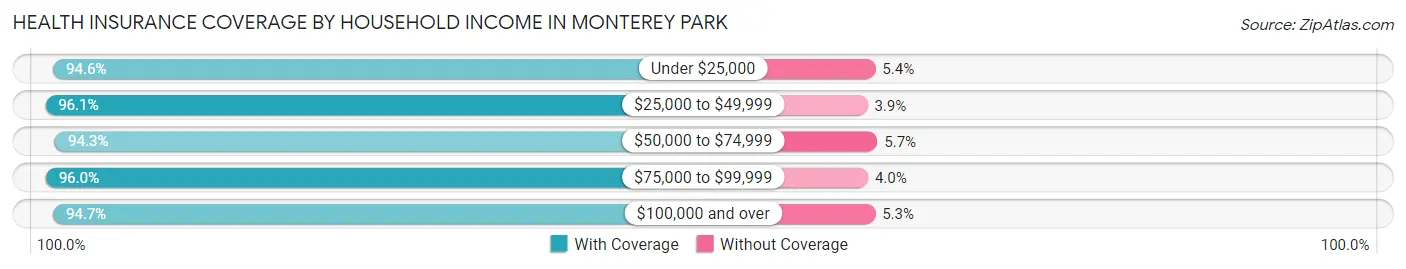
| Household Income | With Coverage | Without Coverage |
| Under $25,000 | 6,692 (94.6%) | 379 (5.4%) |
| $25,000 to $49,999 | 8,542 (96.1%) | 344 (3.9%) |
| $50,000 to $74,999 | 9,049 (94.3%) | 549 (5.7%) |
| $75,000 to $99,999 | 6,897 (96.0%) | 285 (4.0%) |
| $100,000 and over | 25,811 (94.7%) | 1,451 (5.3%) |
Public vs Private Health Insurance Coverage by Age in Monterey Park
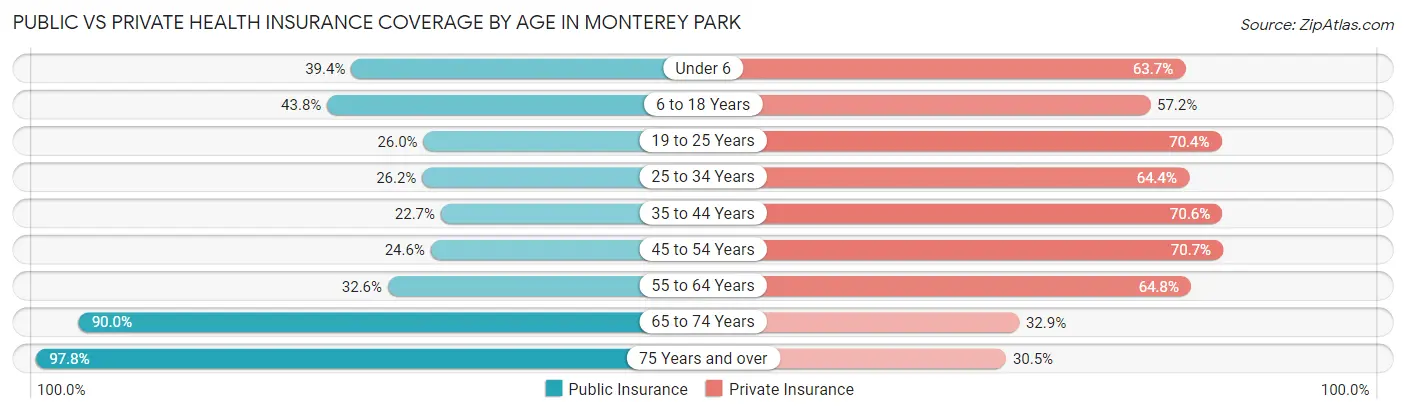
| Age Bracket | Public Insurance | Private Insurance |
| Under 6 | 1,208 (39.4%) | 1,954 (63.7%) |
| 6 to 18 Years | 3,519 (43.8%) | 4,592 (57.2%) |
| 19 to 25 Years | 1,194 (26.0%) | 3,238 (70.4%) |
| 25 to 34 Years | 1,952 (26.2%) | 4,798 (64.4%) |
| 35 to 44 Years | 1,641 (22.7%) | 5,093 (70.6%) |
| 45 to 54 Years | 2,087 (24.6%) | 5,996 (70.7%) |
| 55 to 64 Years | 2,730 (32.6%) | 5,430 (64.8%) |
| 65 to 74 Years | 5,301 (89.9%) | 1,938 (32.9%) |
| 75 Years and over | 6,804 (97.8%) | 2,119 (30.5%) |
| Total | 26,436 (44.0%) | 35,158 (58.5%) |
Disability Status by Sex by Age in Monterey Park
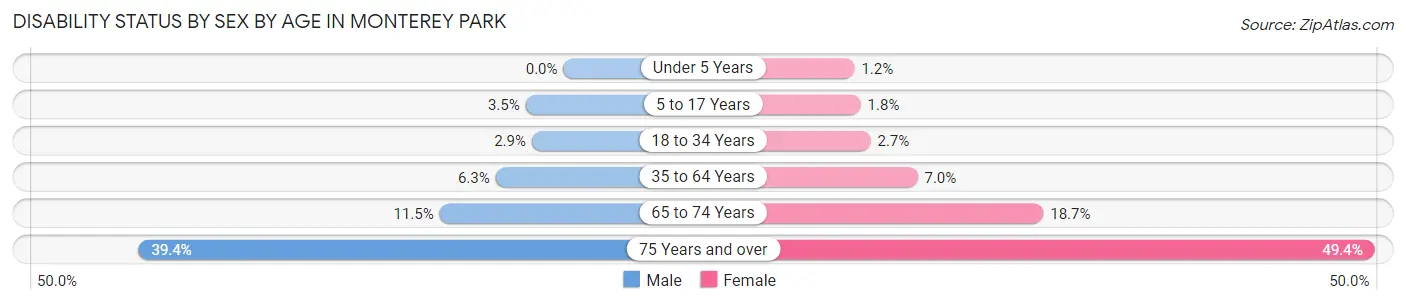
| Age Bracket | Male | Female |
| Under 5 Years | 0 (0.0%) | 14 (1.2%) |
| 5 to 17 Years | 145 (3.5%) | 70 (1.8%) |
| 18 to 34 Years | 192 (2.9%) | 166 (2.7%) |
| 35 to 64 Years | 736 (6.3%) | 870 (7.0%) |
| 65 to 74 Years | 328 (11.5%) | 568 (18.7%) |
| 75 Years and over | 1,121 (39.4%) | 2,033 (49.4%) |
Disability Class by Sex by Age in Monterey Park
Disability Class: Hearing Difficulty
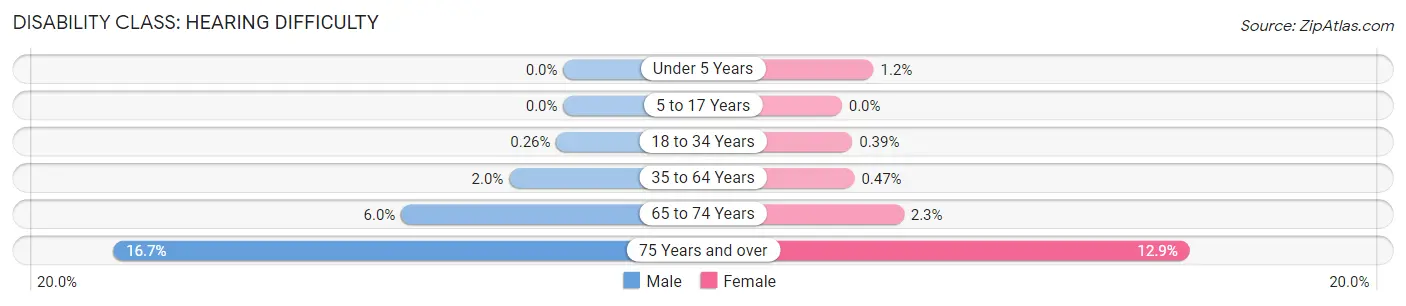
| Age Bracket | Male | Female |
| Under 5 Years | 0 (0.0%) | 14 (1.2%) |
| 5 to 17 Years | 0 (0.0%) | 0 (0.0%) |
| 18 to 34 Years | 17 (0.3%) | 24 (0.4%) |
| 35 to 64 Years | 235 (2.0%) | 58 (0.5%) |
| 65 to 74 Years | 172 (6.0%) | 70 (2.3%) |
| 75 Years and over | 475 (16.7%) | 531 (12.9%) |
Disability Class: Vision Difficulty
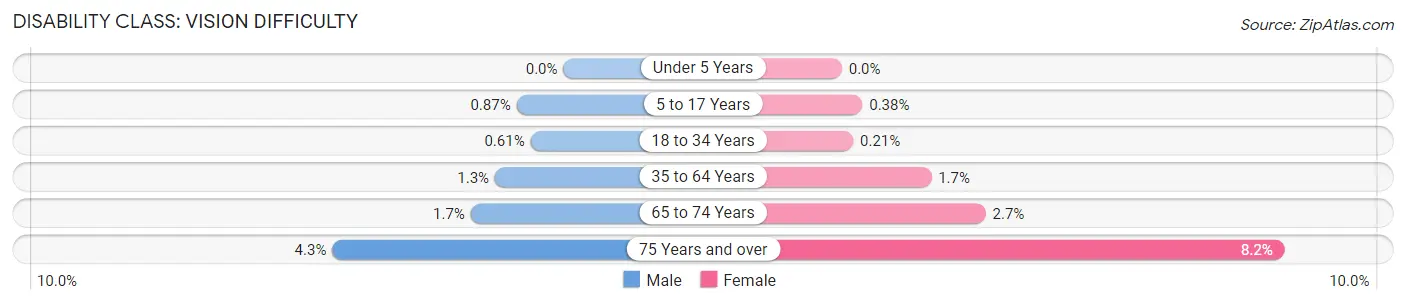
| Age Bracket | Male | Female |
| Under 5 Years | 0 (0.0%) | 0 (0.0%) |
| 5 to 17 Years | 36 (0.9%) | 15 (0.4%) |
| 18 to 34 Years | 40 (0.6%) | 13 (0.2%) |
| 35 to 64 Years | 149 (1.3%) | 205 (1.7%) |
| 65 to 74 Years | 49 (1.7%) | 81 (2.7%) |
| 75 Years and over | 122 (4.3%) | 338 (8.2%) |
Disability Class: Cognitive Difficulty
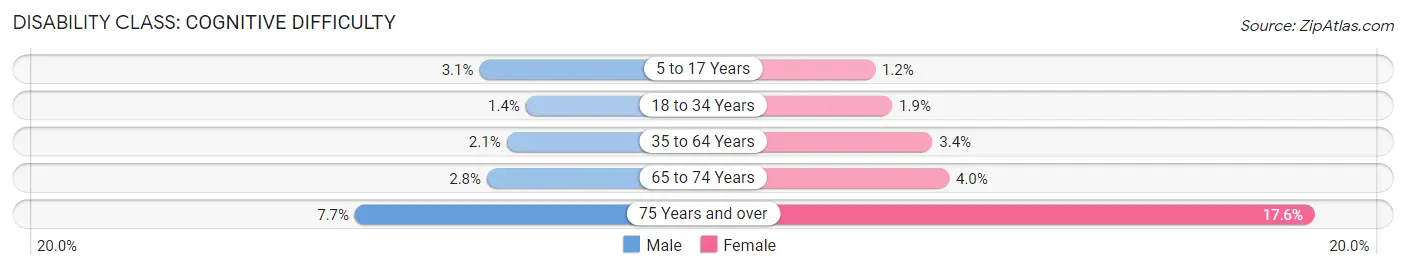
| Age Bracket | Male | Female |
| 5 to 17 Years | 129 (3.1%) | 49 (1.2%) |
| 18 to 34 Years | 92 (1.4%) | 116 (1.9%) |
| 35 to 64 Years | 247 (2.1%) | 416 (3.4%) |
| 65 to 74 Years | 81 (2.8%) | 121 (4.0%) |
| 75 Years and over | 220 (7.7%) | 722 (17.6%) |
Disability Class: Ambulatory Difficulty
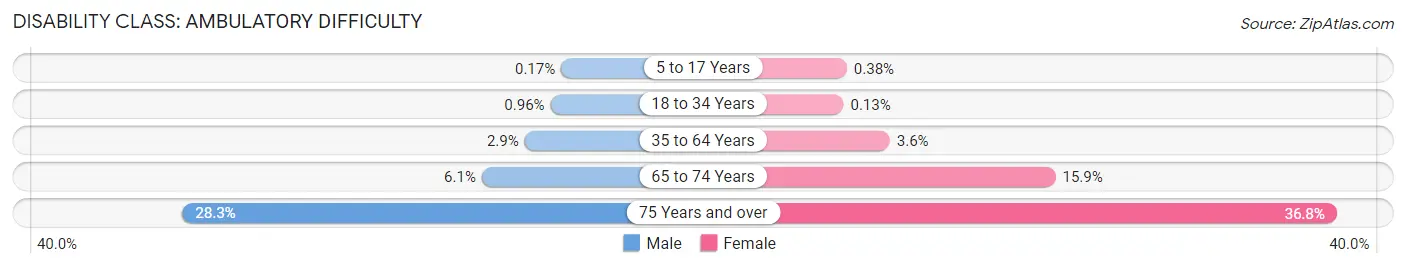
| Age Bracket | Male | Female |
| 5 to 17 Years | 7 (0.2%) | 15 (0.4%) |
| 18 to 34 Years | 63 (1.0%) | 8 (0.1%) |
| 35 to 64 Years | 337 (2.9%) | 442 (3.6%) |
| 65 to 74 Years | 173 (6.1%) | 482 (15.9%) |
| 75 Years and over | 804 (28.3%) | 1,511 (36.7%) |
Disability Class: Self-Care Difficulty
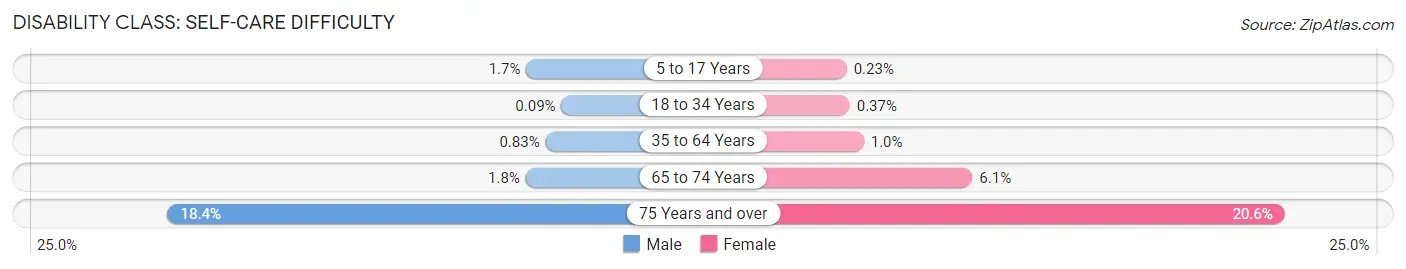
| Age Bracket | Male | Female |
| 5 to 17 Years | 71 (1.7%) | 9 (0.2%) |
| 18 to 34 Years | 6 (0.1%) | 23 (0.4%) |
| 35 to 64 Years | 97 (0.8%) | 126 (1.0%) |
| 65 to 74 Years | 50 (1.8%) | 184 (6.1%) |
| 75 Years and over | 522 (18.4%) | 845 (20.5%) |
Technology Access in Monterey Park
Computing Device Access in Monterey Park
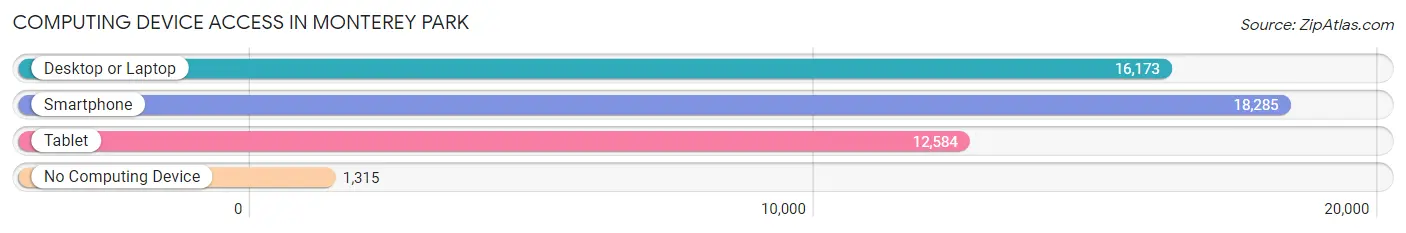
| Device Type | # Households | % Households |
| Desktop or Laptop | 16,173 | 79.2% |
| Smartphone | 18,285 | 89.6% |
| Tablet | 12,584 | 61.6% |
| No Computing Device | 1,315 | 6.4% |
| Total | 20,416 | 100.0% |
Internet Access in Monterey Park
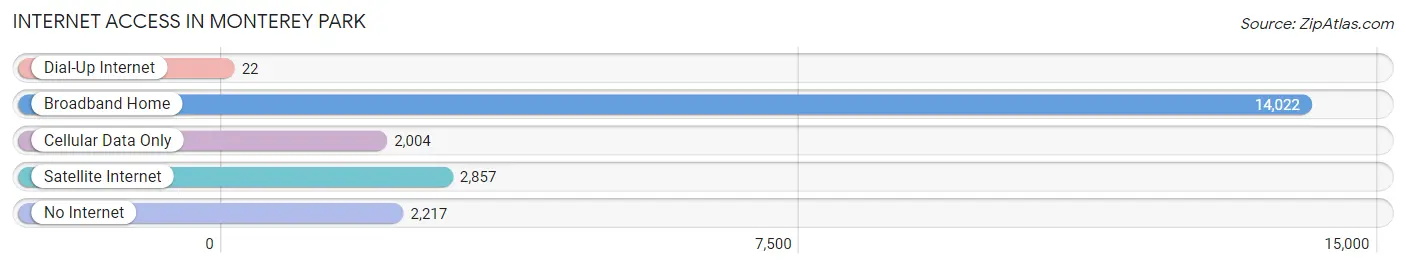
| Internet Type | # Households | % Households |
| Dial-Up Internet | 22 | 0.1% |
| Broadband Home | 14,022 | 68.7% |
| Cellular Data Only | 2,004 | 9.8% |
| Satellite Internet | 2,857 | 14.0% |
| No Internet | 2,217 | 10.9% |
| Total | 20,416 | 100.0% |
Monterey Park Summary
Monterey Park, California is a city located in the western part of Los Angeles County, California. It is bordered by the cities of Alhambra, San Gabriel, Rosemead, and Montebello. The city has a population of approximately 60,269 people as of the 2010 census.
History
Monterey Park was originally part of the Rancho San Antonio, a Mexican land grant given to Antonio Maria Lugo in 1842. The area was later developed as a residential suburb of Los Angeles in the early 20th century. The city was incorporated in 1916 and was named after the city of Monterey, California.
The city experienced rapid growth in the 1950s and 1960s, becoming the first city in the United States with an Asian-American majority. The city has since become a popular destination for immigrants from Asia, particularly from China, Taiwan, and Vietnam.
Geography
Monterey Park is located in the western part of Los Angeles County, California. It is bordered by the cities of Alhambra, San Gabriel, Rosemead, and Montebello. The city has a total area of 6.7 square miles, of which 6.6 square miles is land and 0.1 square miles is water.
The city is located in the San Gabriel Valley, which is part of the larger Los Angeles metropolitan area. The city is situated at the base of the San Gabriel Mountains and is surrounded by several parks and recreational areas.
Economy
Monterey Park is home to a diverse economy, with a variety of industries represented. The city is home to a number of corporate headquarters, including East West Bank, Panda Restaurant Group, and 99 Ranch Market. The city is also home to a number of retail and service businesses, including restaurants, banks, and medical offices.
The city is also home to a number of educational institutions, including East Los Angeles College, California State University, Los Angeles, and the University of Southern California.
Demographics
As of the 2010 census, the population of Monterey Park was 60,269. The racial makeup of the city was 44.3% Asian, 33.2% White, 10.2% Hispanic or Latino, 8.2% African American, and 4.1% other.
The median household income in the city was $50,945, and the median family income was $58,945. The per capita income in the city was $25,945.
Conclusion
Monterey Park, California is a city located in the western part of Los Angeles County, California. It is bordered by the cities of Alhambra, San Gabriel, Rosemead, and Montebello. The city has a population of approximately 60,269 people as of the 2010 census. The city was originally part of the Rancho San Antonio, a Mexican land grant given to Antonio Maria Lugo in 1842. The city experienced rapid growth in the 1950s and 1960s, becoming the first city in the United States with an Asian-American majority. The city has since become a popular destination for immigrants from Asia, particularly from China, Taiwan, and Vietnam. Monterey Park is home to a diverse economy, with a variety of industries represented. The racial makeup of the city was 44.3% Asian, 33.2% White, 10.2% Hispanic or Latino, 8.2% African American, and 4.1% other. The median household income in the city was $50,945, and the median family income was $58,945. The per capita income in the city was $25,945.
Common Questions
What is Per Capita Income in Monterey Park?
Per Capita income in Monterey Park is $35,852.
What is the Median Family Income in Monterey Park?
Median Family Income in Monterey Park is $82,555.
What is the Median Household income in Monterey Park?
Median Household Income in Monterey Park is $76,892.
What is Income or Wage Gap in Monterey Park?
Income or Wage Gap in Monterey Park is 26.0%.
Women in Monterey Park earn 74.0 cents for every dollar earned by a man.
What is Family Income Deficit in Monterey Park?
Family Income Deficit in Monterey Park is $11,700.
Families that are below poverty line in Monterey Park earn $11,700 less on average than the poverty threshold level.
What is Inequality or Gini Index in Monterey Park?
Inequality or Gini Index in Monterey Park is 0.47.
What is the Total Population of Monterey Park?
Total Population of Monterey Park is 60,386.
What is the Total Male Population of Monterey Park?
Total Male Population of Monterey Park is 29,327.
What is the Total Female Population of Monterey Park?
Total Female Population of Monterey Park is 31,059.
What is the Ratio of Males per 100 Females in Monterey Park?
There are 94.42 Males per 100 Females in Monterey Park.
What is the Ratio of Females per 100 Males in Monterey Park?
There are 105.91 Females per 100 Males in Monterey Park.
What is the Median Population Age in Monterey Park?
Median Population Age in Monterey Park is 44.7 Years.
What is the Average Family Size in Monterey Park
Average Family Size in Monterey Park is 3.3 People.
What is the Average Household Size in Monterey Park
Average Household Size in Monterey Park is 2.9 People.
How Large is the Labor Force in Monterey Park?
There are 30,008 People in the Labor Forcein in Monterey Park.
What is the Percentage of People in the Labor Force in Monterey Park?
58.5% of People are in the Labor Force in Monterey Park.
What is the Unemployment Rate in Monterey Park?
Unemployment Rate in Monterey Park is 5.8%.