Vincent, CA Map & Demographics
Vincent Map
Vincent Overview
$30,951
PER CAPITA INCOME
$100,323
AVG FAMILY INCOME
$97,417
AVG HOUSEHOLD INCOME
11.7%
WAGE / INCOME GAP [ % ]
88.3¢/ $1
WAGE / INCOME GAP [ $ ]
0.35
INEQUALITY / GINI INDEX
15,266
TOTAL POPULATION
7,627
MALE POPULATION
7,639
FEMALE POPULATION
99.84
MALES / 100 FEMALES
100.16
FEMALES / 100 MALES
37.3
MEDIAN AGE
4.2
AVG FAMILY SIZE
3.9
AVG HOUSEHOLD SIZE
8,411
LABOR FORCE [ PEOPLE ]
68.5%
PERCENT IN LABOR FORCE
5.3%
UNEMPLOYMENT RATE
Income in Vincent
Income Overview in Vincent
Per Capita Income in Vincent is $30,951, while median incomes of families and households are $100,323 and $97,417 respectively.
| Characteristic | Number | Measure |
| Per Capita Income | 15,266 | $30,951 |
| Median Family Income | 3,382 | $100,323 |
| Mean Family Income | 3,382 | $117,022 |
| Median Household Income | 3,945 | $97,417 |
| Mean Household Income | 3,945 | $113,113 |
| Income Deficit | 3,382 | $0 |
| Wage / Income Gap (%) | 15,266 | 11.69% |
| Wage / Income Gap ($) | 15,266 | 88.31¢ per $1 |
| Gini / Inequality Index | 15,266 | 0.35 |
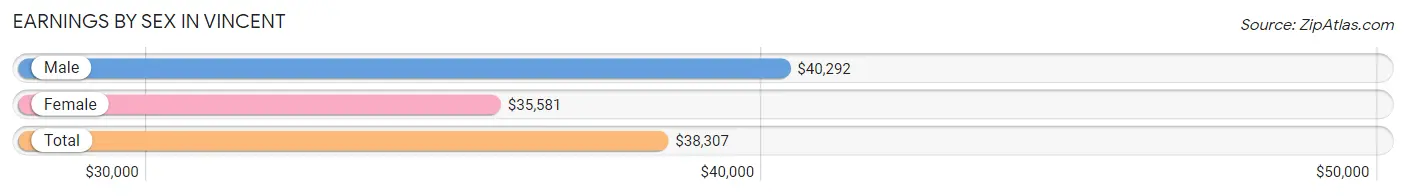
Earnings by Sex in Vincent
Average Earnings in Vincent are $38,307, $40,292 for men and $35,581 for women, a difference of 11.7%.
| Sex | Number | Average Earnings |
| Male | 4,381 (51.7%) | $40,292 |
| Female | 4,086 (48.3%) | $35,581 |
| Total | 8,467 (100.0%) | $38,307 |
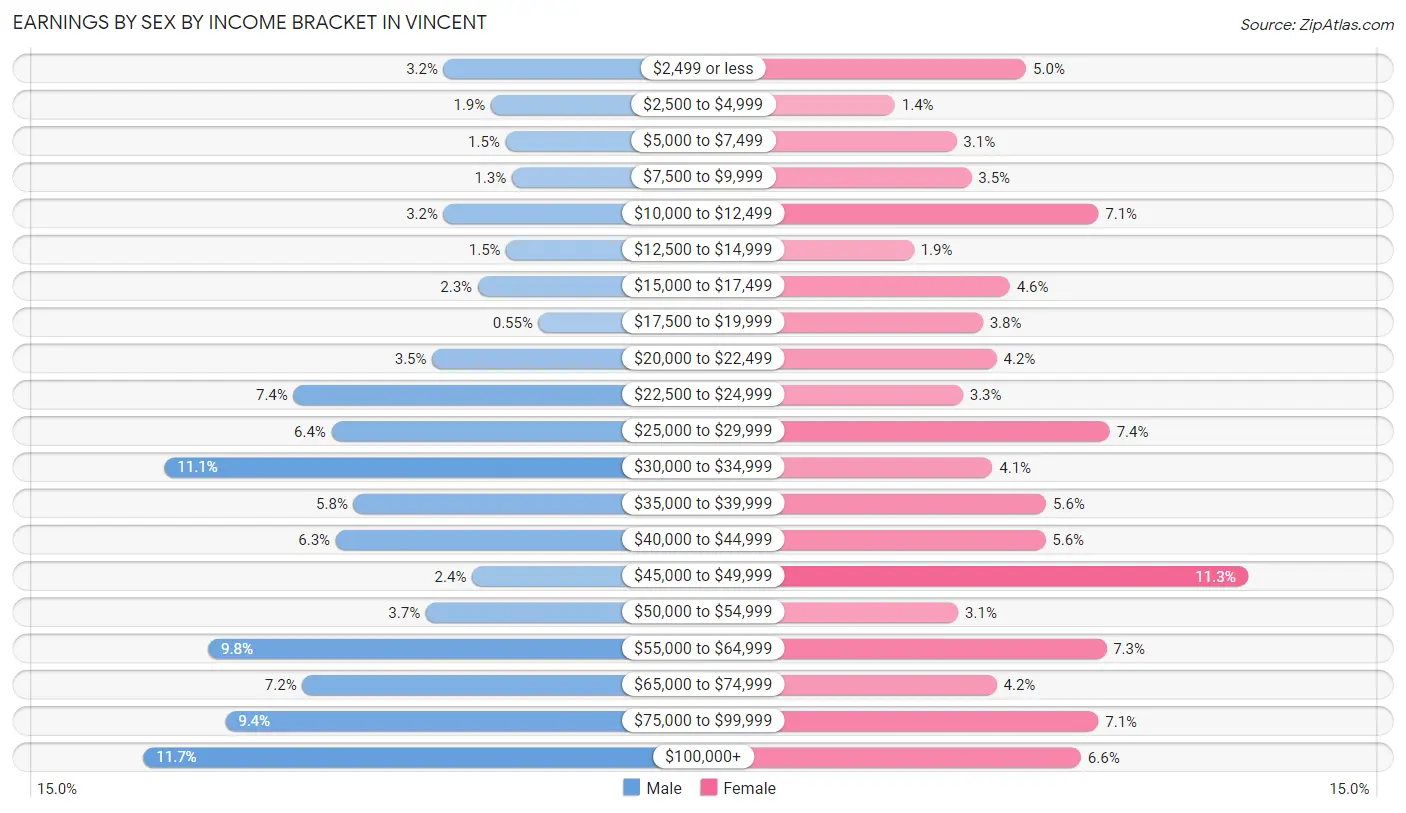
Earnings by Sex by Income Bracket in Vincent
The most common earnings brackets in Vincent are $100,000+ for men (511 | 11.7%) and $45,000 to $49,999 for women (460 | 11.3%).
| Income | Male | Female |
| $2,499 or less | 141 (3.2%) | 206 (5.0%) |
| $2,500 to $4,999 | 83 (1.9%) | 55 (1.3%) |
| $5,000 to $7,499 | 65 (1.5%) | 126 (3.1%) |
| $7,500 to $9,999 | 57 (1.3%) | 143 (3.5%) |
| $10,000 to $12,499 | 141 (3.2%) | 289 (7.1%) |
| $12,500 to $14,999 | 64 (1.5%) | 77 (1.9%) |
| $15,000 to $17,499 | 99 (2.3%) | 187 (4.6%) |
| $17,500 to $19,999 | 24 (0.5%) | 156 (3.8%) |
| $20,000 to $22,499 | 155 (3.5%) | 172 (4.2%) |
| $22,500 to $24,999 | 326 (7.4%) | 133 (3.3%) |
| $25,000 to $29,999 | 279 (6.4%) | 302 (7.4%) |
| $30,000 to $34,999 | 485 (11.1%) | 167 (4.1%) |
| $35,000 to $39,999 | 252 (5.8%) | 229 (5.6%) |
| $40,000 to $44,999 | 274 (6.2%) | 228 (5.6%) |
| $45,000 to $49,999 | 106 (2.4%) | 460 (11.3%) |
| $50,000 to $54,999 | 163 (3.7%) | 128 (3.1%) |
| $55,000 to $64,999 | 431 (9.8%) | 298 (7.3%) |
| $65,000 to $74,999 | 315 (7.2%) | 172 (4.2%) |
| $75,000 to $99,999 | 410 (9.4%) | 289 (7.1%) |
| $100,000+ | 511 (11.7%) | 269 (6.6%) |
| Total | 4,381 (100.0%) | 4,086 (100.0%) |
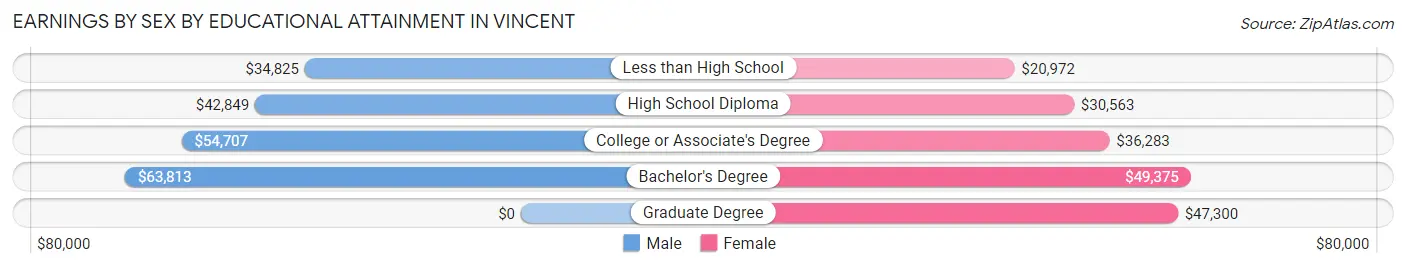
Earnings by Sex by Educational Attainment in Vincent
Average earnings in Vincent are $48,012 for men and $40,309 for women, a difference of 16.0%. Men with an educational attainment of bachelor's degree enjoy the highest average annual earnings of $63,813, while those with less than high school education earn the least with $34,825. Women with an educational attainment of bachelor's degree earn the most with the average annual earnings of $49,375, while those with less than high school education have the smallest earnings of $20,972.
| Educational Attainment | Male Income | Female Income |
| Less than High School | $34,825 | $20,972 |
| High School Diploma | $42,849 | $30,563 |
| College or Associate's Degree | $54,707 | $36,283 |
| Bachelor's Degree | $63,813 | $49,375 |
| Graduate Degree | - | - |
| Total | $48,012 | $40,309 |
Family Income in Vincent
Family Income Brackets in Vincent
According to the Vincent family income data, there are 954 families falling into the $100,000 to $149,999 income range, which is the most common income bracket and makes up 28.2% of all families. Conversely, the $10,000 to $14,999 income bracket is the least frequent group with only 17 families (0.5%) belonging to this category.
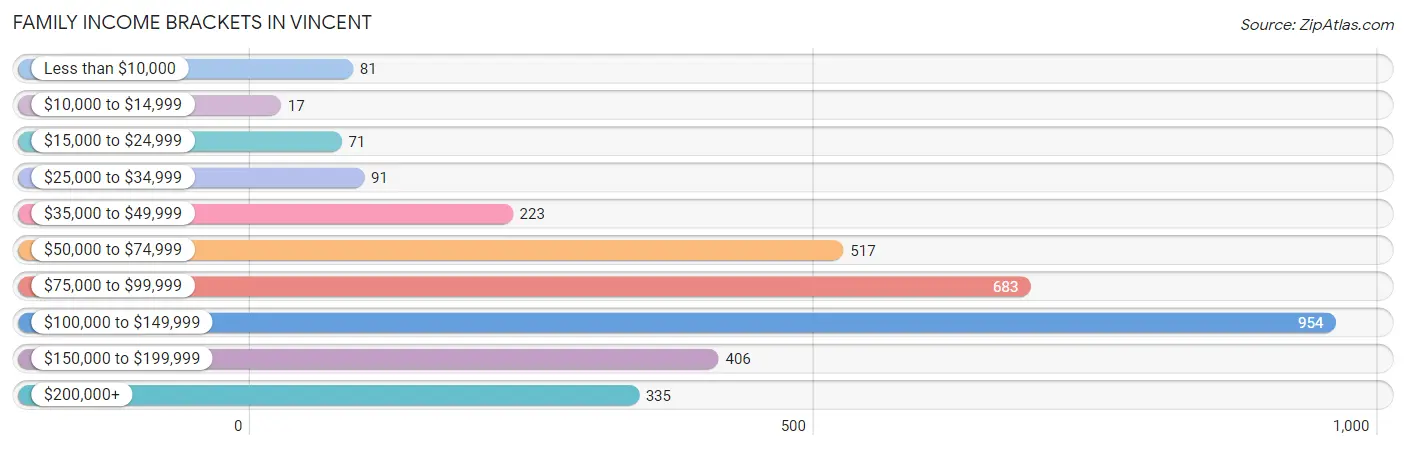
| Income Bracket | # Families | % Families |
| Less than $10,000 | 81 | 2.4% |
| $10,000 to $14,999 | 17 | 0.5% |
| $15,000 to $24,999 | 71 | 2.1% |
| $25,000 to $34,999 | 91 | 2.7% |
| $35,000 to $49,999 | 223 | 6.6% |
| $50,000 to $74,999 | 517 | 15.3% |
| $75,000 to $99,999 | 683 | 20.2% |
| $100,000 to $149,999 | 954 | 28.2% |
| $150,000 to $199,999 | 406 | 12.0% |
| $200,000+ | 335 | 9.9% |
Family Income by Famaliy Size in Vincent
7+ person families (173 | 5.1%) account for the highest median family income in Vincent with $175,764 per family, while 2-person families (733 | 21.7%) have the highest median income of $36,244 per family member.
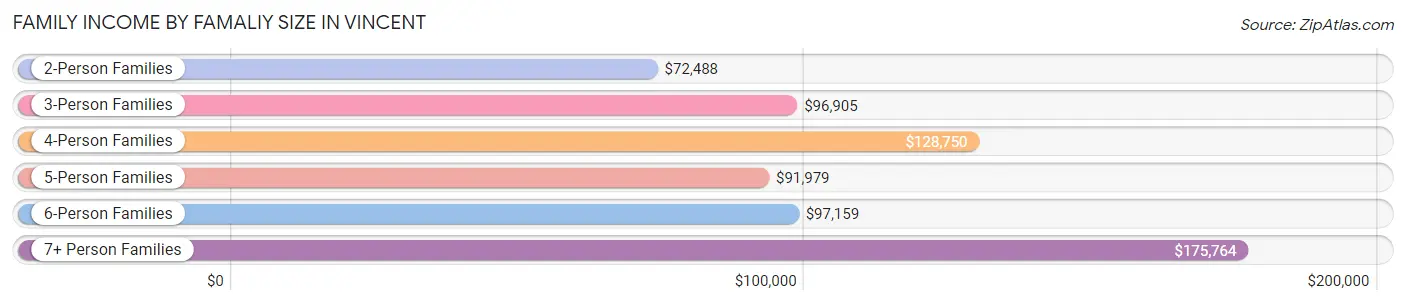
| Income Bracket | # Families | Median Income |
| 2-Person Families | 733 (21.7%) | $72,488 |
| 3-Person Families | 861 (25.5%) | $96,905 |
| 4-Person Families | 719 (21.3%) | $128,750 |
| 5-Person Families | 587 (17.4%) | $91,979 |
| 6-Person Families | 309 (9.1%) | $97,159 |
| 7+ Person Families | 173 (5.1%) | $175,764 |
| Total | 3,382 (100.0%) | $100,323 |
Family Income by Number of Earners in Vincent
The median family income in Vincent is $100,323, with families comprising 3+ earners (1,207) having the highest median family income of $144,740, while families with no earners (298) have the lowest median family income of $27,396, accounting for 35.7% and 8.8% of families, respectively.
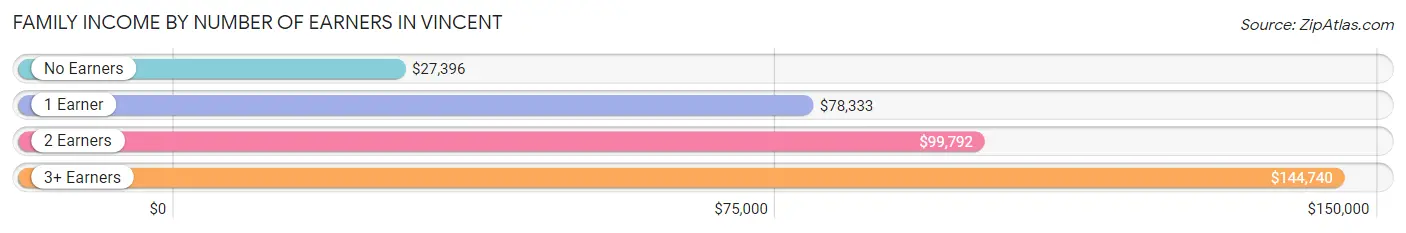
| Number of Earners | # Families | Median Income |
| No Earners | 298 (8.8%) | $27,396 |
| 1 Earner | 680 (20.1%) | $78,333 |
| 2 Earners | 1,197 (35.4%) | $99,792 |
| 3+ Earners | 1,207 (35.7%) | $144,740 |
| Total | 3,382 (100.0%) | $100,323 |
Household Income in Vincent
Household Income Brackets in Vincent
With 1,022 households falling in the category, the $100,000 to $149,999 income range is the most frequent in Vincent, accounting for 25.9% of all households. In contrast, only 83 households (2.1%) fall into the $10,000 to $14,999 income bracket, making it the least populous group.
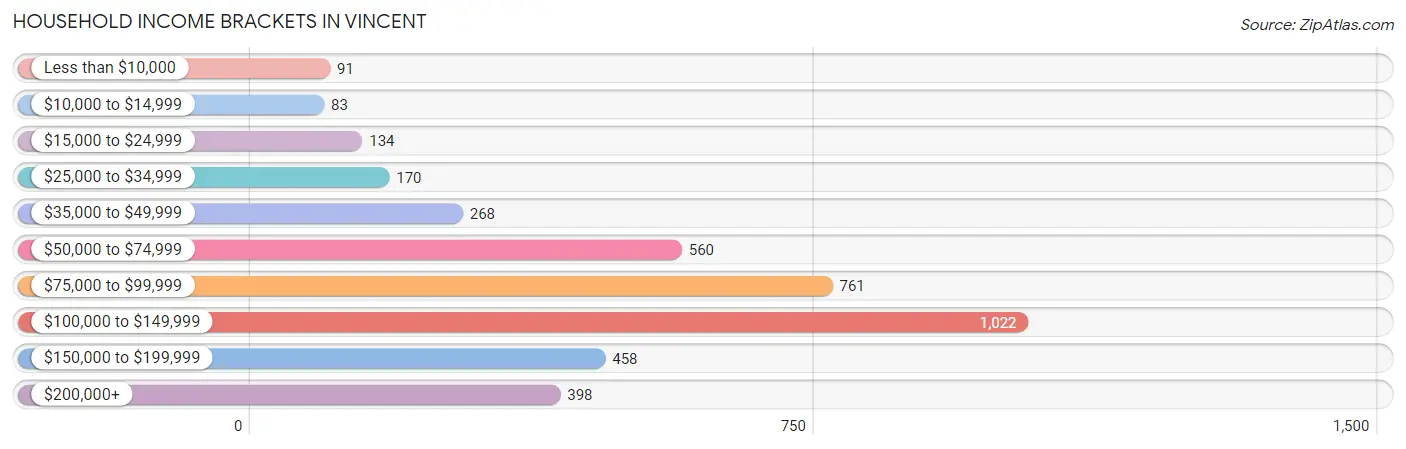
| Income Bracket | # Households | % Households |
| Less than $10,000 | 91 | 2.3% |
| $10,000 to $14,999 | 83 | 2.1% |
| $15,000 to $24,999 | 134 | 3.4% |
| $25,000 to $34,999 | 170 | 4.3% |
| $35,000 to $49,999 | 268 | 6.8% |
| $50,000 to $74,999 | 560 | 14.2% |
| $75,000 to $99,999 | 761 | 19.3% |
| $100,000 to $149,999 | 1,022 | 25.9% |
| $150,000 to $199,999 | 458 | 11.6% |
| $200,000+ | 398 | 10.1% |
Household Income by Householder Age in Vincent
The median household income in Vincent is $97,417, with the highest median household income of $115,289 found in the 45 to 64 years age bracket for the primary householder. A total of 1,922 households (48.7%) fall into this category. Meanwhile, the 15 to 24 years age bracket for the primary householder has the lowest median household income of $0, with 54 households (1.4%) in this group.
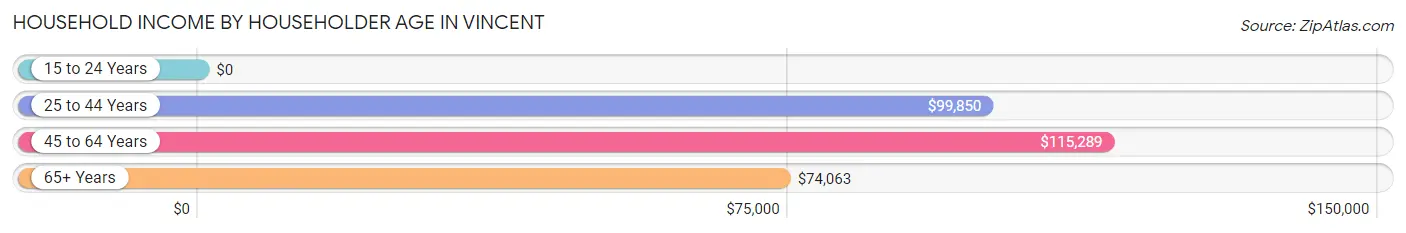
| Income Bracket | # Households | Median Income |
| 15 to 24 Years | 54 (1.4%) | $0 |
| 25 to 44 Years | 1,103 (28.0%) | $99,850 |
| 45 to 64 Years | 1,922 (48.7%) | $115,289 |
| 65+ Years | 866 (22.0%) | $74,063 |
| Total | 3,945 (100.0%) | $97,417 |
Poverty in Vincent
Income Below Poverty by Sex and Age in Vincent
With 6.5% poverty level for males and 5.8% for females among the residents of Vincent, 15 year old males and 5 year old females are the most vulnerable to poverty, with 26 males (17.8%) and 11 females (12.4%) in their respective age groups living below the poverty level.
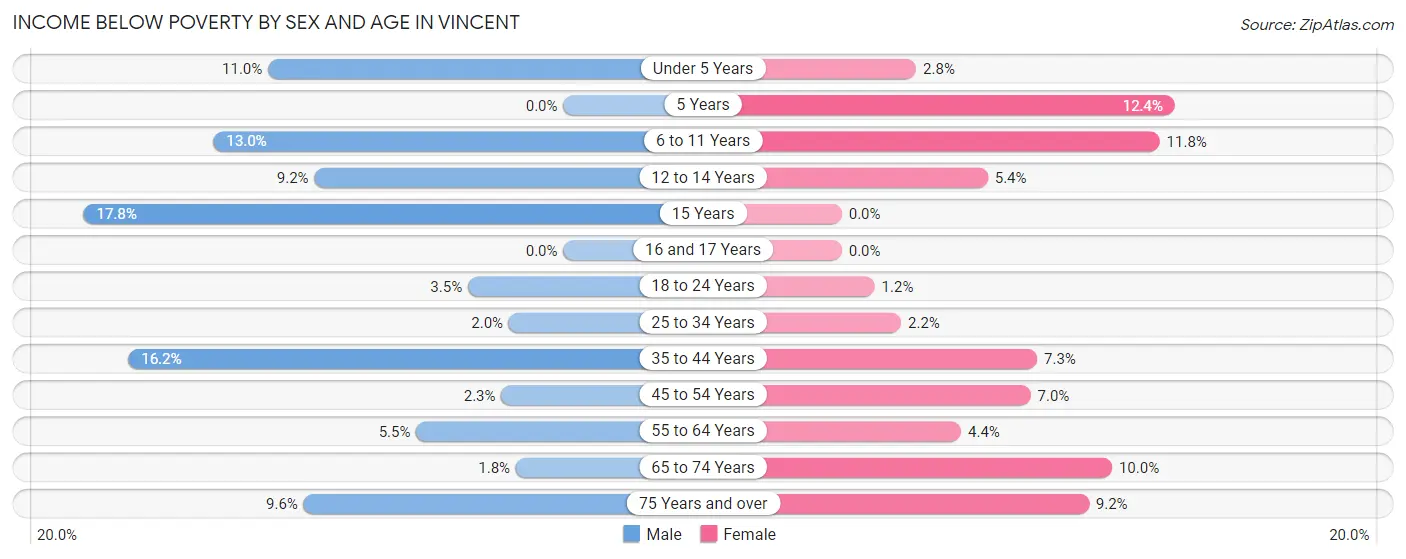
| Age Bracket | Male | Female |
| Under 5 Years | 41 (11.0%) | 14 (2.8%) |
| 5 Years | 0 (0.0%) | 11 (12.4%) |
| 6 to 11 Years | 76 (13.0%) | 61 (11.8%) |
| 12 to 14 Years | 29 (9.2%) | 18 (5.4%) |
| 15 Years | 26 (17.8%) | 0 (0.0%) |
| 16 and 17 Years | 0 (0.0%) | 0 (0.0%) |
| 18 to 24 Years | 33 (3.5%) | 7 (1.2%) |
| 25 to 34 Years | 25 (2.0%) | 24 (2.2%) |
| 35 to 44 Years | 141 (16.2%) | 77 (7.2%) |
| 45 to 54 Years | 23 (2.3%) | 88 (7.0%) |
| 55 to 64 Years | 55 (5.5%) | 42 (4.4%) |
| 65 to 74 Years | 10 (1.8%) | 71 (10.0%) |
| 75 Years and over | 32 (9.6%) | 32 (9.2%) |
| Total | 491 (6.5%) | 445 (5.8%) |
Income Above Poverty by Sex and Age in Vincent
According to the poverty statistics in Vincent, males aged 5 years and females aged 15 years are the age groups that are most secure financially, with 100.0% of males and 100.0% of females in these age groups living above the poverty line.
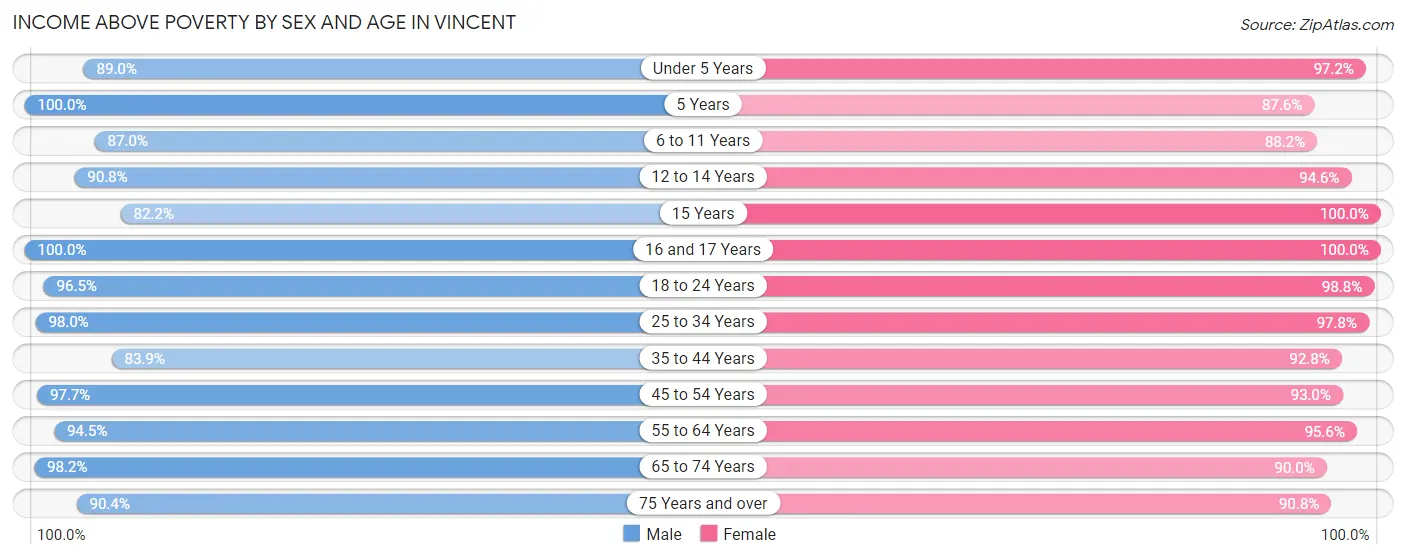
| Age Bracket | Male | Female |
| Under 5 Years | 333 (89.0%) | 493 (97.2%) |
| 5 Years | 70 (100.0%) | 78 (87.6%) |
| 6 to 11 Years | 509 (87.0%) | 456 (88.2%) |
| 12 to 14 Years | 285 (90.8%) | 314 (94.6%) |
| 15 Years | 120 (82.2%) | 51 (100.0%) |
| 16 and 17 Years | 174 (100.0%) | 152 (100.0%) |
| 18 to 24 Years | 900 (96.5%) | 568 (98.8%) |
| 25 to 34 Years | 1,215 (98.0%) | 1,068 (97.8%) |
| 35 to 44 Years | 732 (83.9%) | 985 (92.7%) |
| 45 to 54 Years | 978 (97.7%) | 1,168 (93.0%) |
| 55 to 64 Years | 953 (94.5%) | 907 (95.6%) |
| 65 to 74 Years | 557 (98.2%) | 637 (90.0%) |
| 75 Years and over | 300 (90.4%) | 317 (90.8%) |
| Total | 7,126 (93.5%) | 7,194 (94.2%) |
Income Below Poverty Among Married-Couple Families in Vincent
The poverty statistics for married-couple families in Vincent show that 5.0% or 117 of the total 2,365 families live below the poverty line. Families with 3 or 4 children have the highest poverty rate of 17.3%, comprising of 34 families. On the other hand, families with 5 or more children have the lowest poverty rate of 0.0%, which includes 0 families.
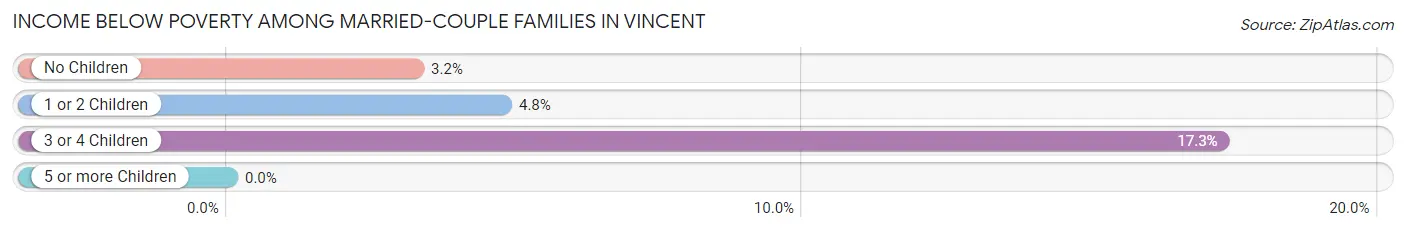
| Children | Above Poverty | Below Poverty |
| No Children | 1,255 (96.8%) | 42 (3.2%) |
| 1 or 2 Children | 819 (95.2%) | 41 (4.8%) |
| 3 or 4 Children | 163 (82.7%) | 34 (17.3%) |
| 5 or more Children | 11 (100.0%) | 0 (0.0%) |
| Total | 2,248 (95.1%) | 117 (5.0%) |
Income Below Poverty Among Single-Parent Households in Vincent
According to the poverty data in Vincent, 1.2% or 4 single-father households and 1.7% or 12 single-mother households are living below the poverty line. Among single-father households, those with 1 or 2 children have the highest poverty rate, with 4 households (2.9%) experiencing poverty. Likewise, among single-mother households, those with 3 or 4 children have the highest poverty rate, with 12 households (17.1%) falling below the poverty line.
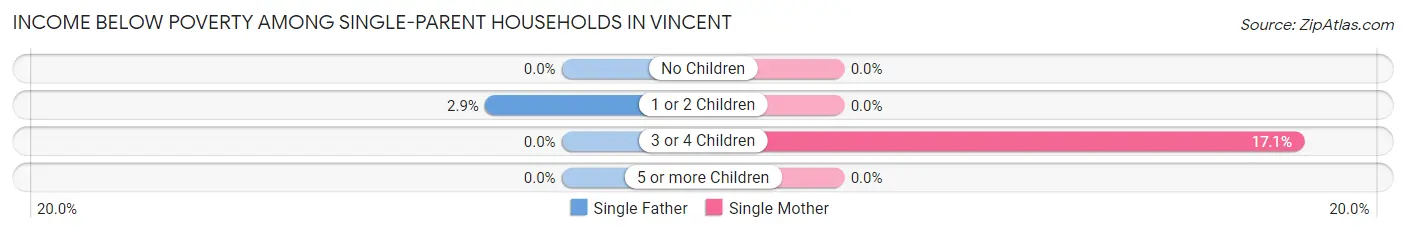
| Children | Single Father | Single Mother |
| No Children | 0 (0.0%) | 0 (0.0%) |
| 1 or 2 Children | 4 (2.9%) | 0 (0.0%) |
| 3 or 4 Children | 0 (0.0%) | 12 (17.1%) |
| 5 or more Children | 0 (0.0%) | 0 (0.0%) |
| Total | 4 (1.2%) | 12 (1.7%) |
Income Below Poverty Among Married-Couple vs Single-Parent Households in Vincent
The poverty data for Vincent shows that 117 of the married-couple family households (5.0%) and 16 of the single-parent households (1.6%) are living below the poverty level. Within the married-couple family households, those with 3 or 4 children have the highest poverty rate, with 34 households (17.3%) falling below the poverty line. Among the single-parent households, those with 3 or 4 children have the highest poverty rate, with 12 household (14.6%) living below poverty.
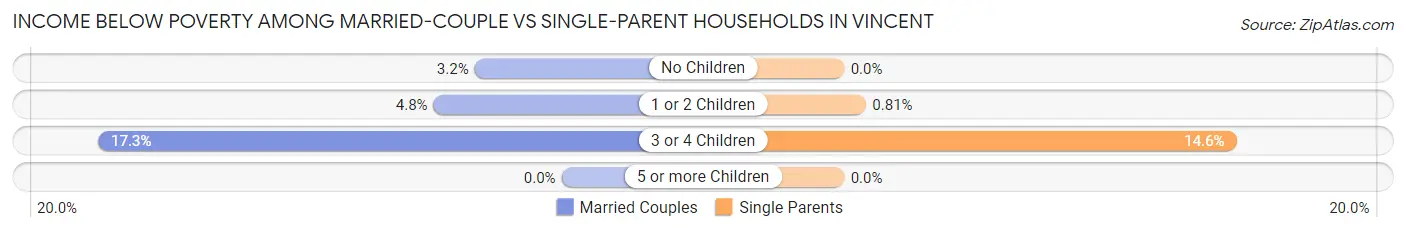
| Children | Married-Couple Families | Single-Parent Households |
| No Children | 42 (3.2%) | 0 (0.0%) |
| 1 or 2 Children | 41 (4.8%) | 4 (0.8%) |
| 3 or 4 Children | 34 (17.3%) | 12 (14.6%) |
| 5 or more Children | 0 (0.0%) | 0 (0.0%) |
| Total | 117 (5.0%) | 16 (1.6%) |
Race in Vincent
The most populous races in Vincent are Hispanic or Latino (10,242 | 67.1%), White / Caucasian (5,380 | 35.2%), and Some other Race (3,497 | 22.9%).
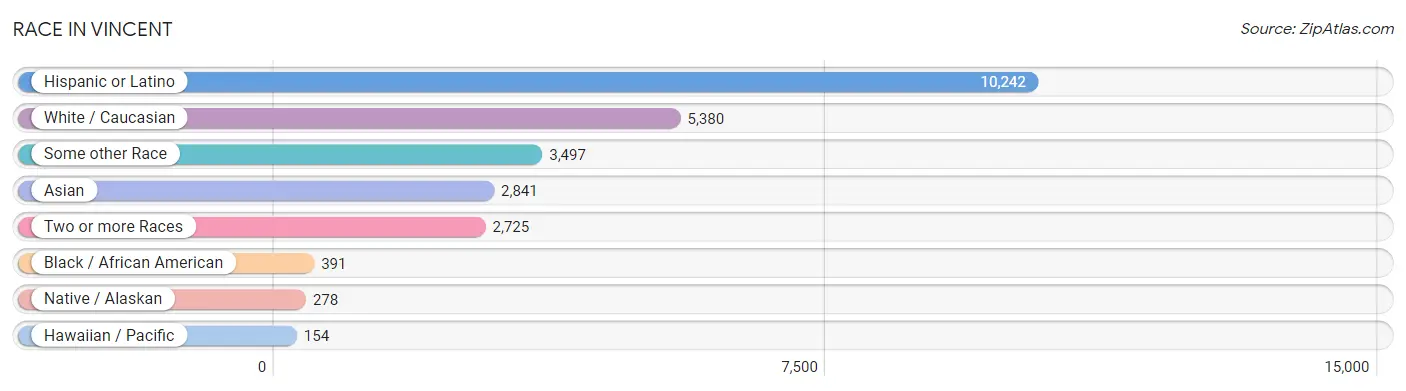
| Race | # Population | % Population |
| Asian | 2,841 | 18.6% |
| Black / African American | 391 | 2.6% |
| Hawaiian / Pacific | 154 | 1.0% |
| Hispanic or Latino | 10,242 | 67.1% |
| Native / Alaskan | 278 | 1.8% |
| White / Caucasian | 5,380 | 35.2% |
| Two or more Races | 2,725 | 17.8% |
| Some other Race | 3,497 | 22.9% |
| Total | 15,266 | 100.0% |
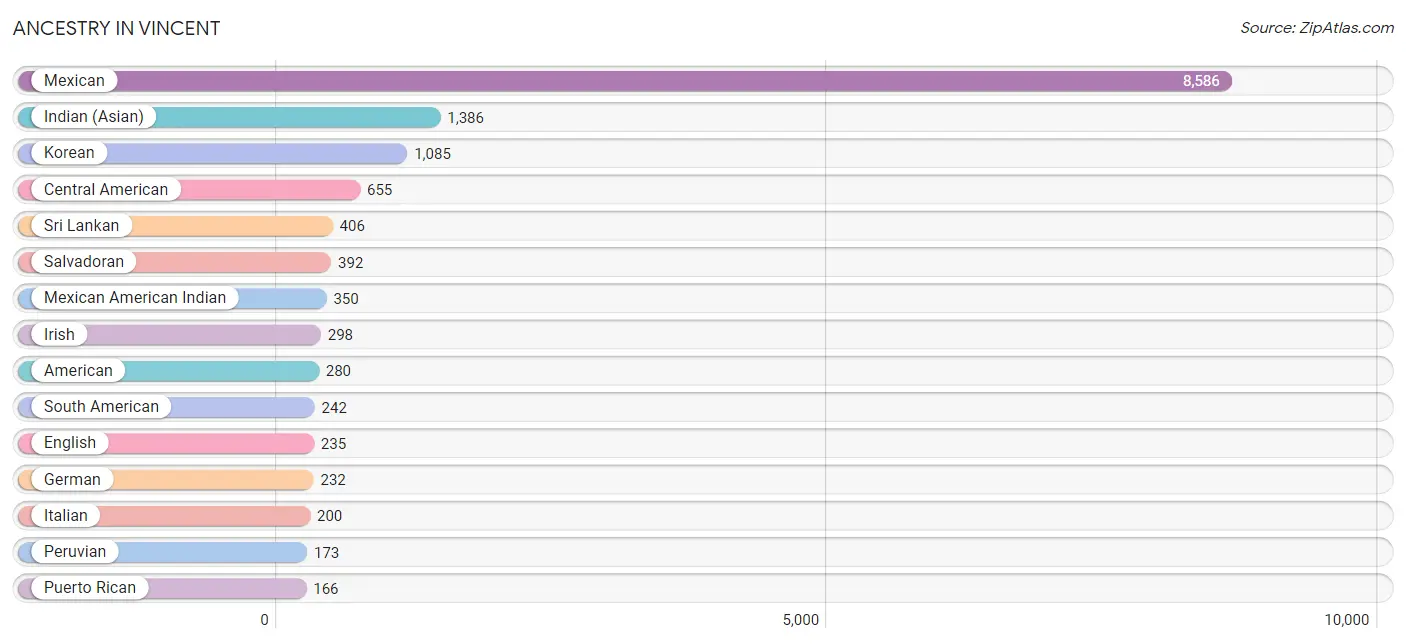
Ancestry in Vincent
The most populous ancestries reported in Vincent are Mexican (8,586 | 56.2%), Indian (Asian) (1,386 | 9.1%), Korean (1,085 | 7.1%), Central American (655 | 4.3%), and Sri Lankan (406 | 2.7%), together accounting for 79.4% of all Vincent residents.
| Ancestry | # Population | % Population |
| African | 59 | 0.4% |
| American | 280 | 1.8% |
| Arab | 20 | 0.1% |
| Armenian | 8 | 0.1% |
| Bhutanese | 150 | 1.0% |
| British | 6 | 0.0% |
| Burmese | 10 | 0.1% |
| Central American | 655 | 4.3% |
| Cherokee | 12 | 0.1% |
| Colombian | 24 | 0.2% |
| Croatian | 8 | 0.1% |
| Cuban | 146 | 1.0% |
| Dominican | 34 | 0.2% |
| Dutch | 102 | 0.7% |
| Ecuadorian | 45 | 0.3% |
| English | 235 | 1.5% |
| European | 54 | 0.4% |
| French | 68 | 0.4% |
| German | 232 | 1.5% |
| Guatemalan | 137 | 0.9% |
| Honduran | 69 | 0.4% |
| Hungarian | 8 | 0.1% |
| Indian (Asian) | 1,386 | 9.1% |
| Indonesian | 30 | 0.2% |
| Irish | 298 | 1.9% |
| Italian | 200 | 1.3% |
| Jamaican | 3 | 0.0% |
| Kenyan | 22 | 0.1% |
| Korean | 1,085 | 7.1% |
| Laotian | 67 | 0.4% |
| Mexican | 8,586 | 56.2% |
| Mexican American Indian | 350 | 2.3% |
| Nicaraguan | 57 | 0.4% |
| Norwegian | 15 | 0.1% |
| Pakistani | 18 | 0.1% |
| Pennsylvania German | 8 | 0.1% |
| Peruvian | 173 | 1.1% |
| Polish | 38 | 0.3% |
| Portuguese | 7 | 0.1% |
| Puerto Rican | 166 | 1.1% |
| Salvadoran | 392 | 2.6% |
| Samoan | 99 | 0.6% |
| Scandinavian | 73 | 0.5% |
| Scotch-Irish | 31 | 0.2% |
| Scottish | 43 | 0.3% |
| Shoshone | 11 | 0.1% |
| South American | 242 | 1.6% |
| Spanish | 11 | 0.1% |
| Spanish American | 25 | 0.2% |
| Spanish American Indian | 125 | 0.8% |
| Sri Lankan | 406 | 2.7% |
| Subsaharan African | 81 | 0.5% |
| Thai | 24 | 0.2% |
| Tongan | 40 | 0.3% |
| Ukrainian | 16 | 0.1% |
| Welsh | 9 | 0.1% | View All 56 Rows |
Immigrants in Vincent
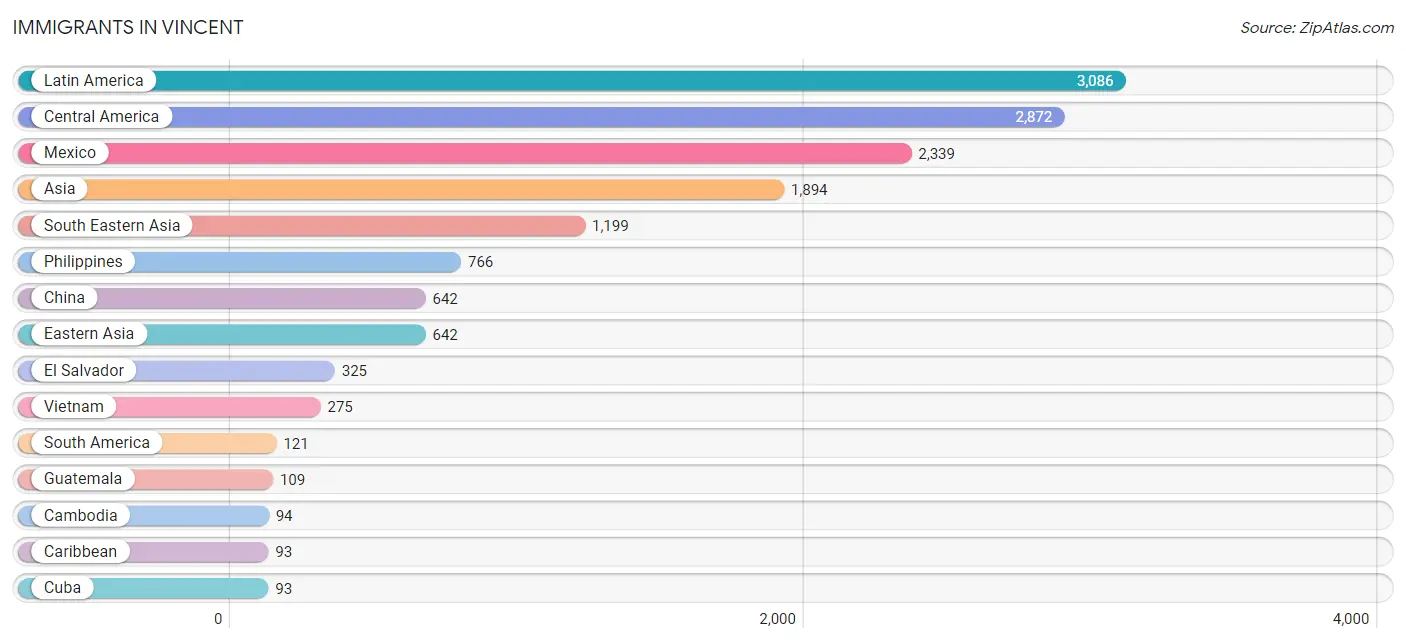
The most numerous immigrant groups reported in Vincent came from Latin America (3,086 | 20.2%), Central America (2,872 | 18.8%), Mexico (2,339 | 15.3%), Asia (1,894 | 12.4%), and South Eastern Asia (1,199 | 7.9%), together accounting for 74.6% of all Vincent residents.
| Immigration Origin | # Population | % Population |
| Africa | 22 | 0.1% |
| Asia | 1,894 | 12.4% |
| Cambodia | 94 | 0.6% |
| Canada | 9 | 0.1% |
| Caribbean | 93 | 0.6% |
| Central America | 2,872 | 18.8% |
| China | 642 | 4.2% |
| Colombia | 7 | 0.1% |
| Cuba | 93 | 0.6% |
| Eastern Africa | 22 | 0.1% |
| Eastern Asia | 642 | 4.2% |
| Ecuador | 21 | 0.1% |
| El Salvador | 325 | 2.1% |
| Guatemala | 109 | 0.7% |
| Honduras | 41 | 0.3% |
| Hong Kong | 23 | 0.2% |
| India | 9 | 0.1% |
| Indonesia | 22 | 0.1% |
| Iran | 8 | 0.1% |
| Kenya | 22 | 0.1% |
| Latin America | 3,086 | 20.2% |
| Mexico | 2,339 | 15.3% |
| Micronesia | 45 | 0.3% |
| Nicaragua | 44 | 0.3% |
| Oceania | 64 | 0.4% |
| Panama | 14 | 0.1% |
| Peru | 93 | 0.6% |
| Philippines | 766 | 5.0% |
| South America | 121 | 0.8% |
| South Central Asia | 17 | 0.1% |
| South Eastern Asia | 1,199 | 7.9% |
| Taiwan | 12 | 0.1% |
| Thailand | 12 | 0.1% |
| Vietnam | 275 | 1.8% | View All 34 Rows |
Sex and Age in Vincent
Sex and Age in Vincent
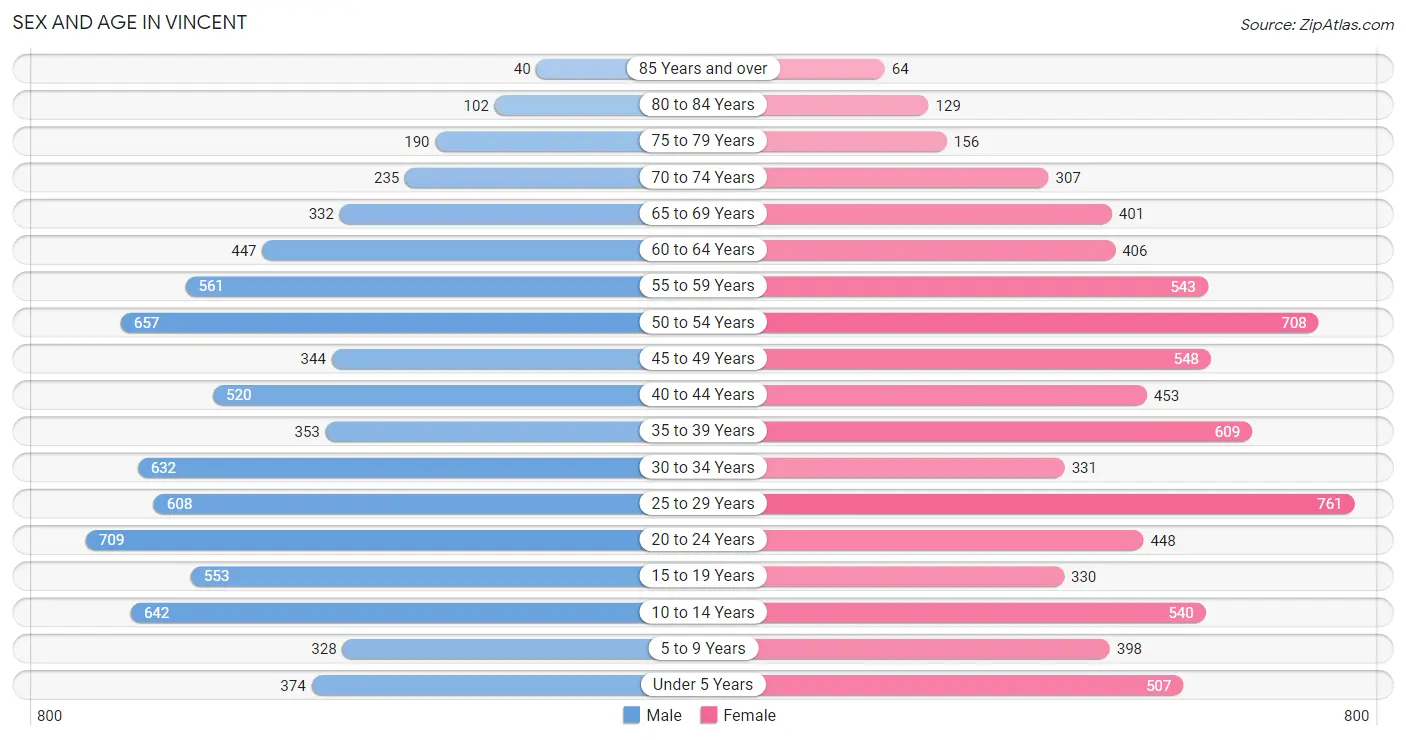
The most populous age groups in Vincent are 20 to 24 Years (709 | 9.3%) for men and 25 to 29 Years (761 | 10.0%) for women.
| Age Bracket | Male | Female |
| Under 5 Years | 374 (4.9%) | 507 (6.6%) |
| 5 to 9 Years | 328 (4.3%) | 398 (5.2%) |
| 10 to 14 Years | 642 (8.4%) | 540 (7.1%) |
| 15 to 19 Years | 553 (7.2%) | 330 (4.3%) |
| 20 to 24 Years | 709 (9.3%) | 448 (5.9%) |
| 25 to 29 Years | 608 (8.0%) | 761 (10.0%) |
| 30 to 34 Years | 632 (8.3%) | 331 (4.3%) |
| 35 to 39 Years | 353 (4.6%) | 609 (8.0%) |
| 40 to 44 Years | 520 (6.8%) | 453 (5.9%) |
| 45 to 49 Years | 344 (4.5%) | 548 (7.2%) |
| 50 to 54 Years | 657 (8.6%) | 708 (9.3%) |
| 55 to 59 Years | 561 (7.4%) | 543 (7.1%) |
| 60 to 64 Years | 447 (5.9%) | 406 (5.3%) |
| 65 to 69 Years | 332 (4.3%) | 401 (5.2%) |
| 70 to 74 Years | 235 (3.1%) | 307 (4.0%) |
| 75 to 79 Years | 190 (2.5%) | 156 (2.0%) |
| 80 to 84 Years | 102 (1.3%) | 129 (1.7%) |
| 85 Years and over | 40 (0.5%) | 64 (0.8%) |
| Total | 7,627 (100.0%) | 7,639 (100.0%) |
Families and Households in Vincent
Median Family Size in Vincent
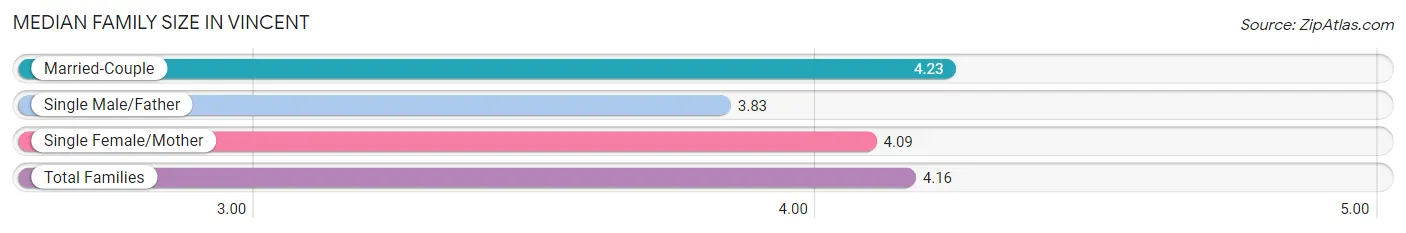
The median family size in Vincent is 4.16 persons per family, with married-couple families (2,365 | 69.9%) accounting for the largest median family size of 4.23 persons per family. On the other hand, single male/father families (322 | 9.5%) represent the smallest median family size with 3.83 persons per family.
| Family Type | # Families | Family Size |
| Married-Couple | 2,365 (69.9%) | 4.23 |
| Single Male/Father | 322 (9.5%) | 3.83 |
| Single Female/Mother | 695 (20.5%) | 4.09 |
| Total Families | 3,382 (100.0%) | 4.16 |
Median Household Size in Vincent
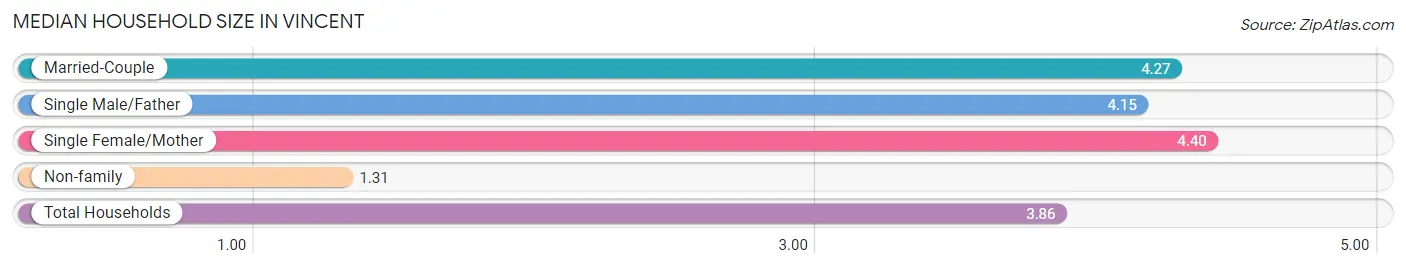
The median household size in Vincent is 3.86 persons per household, with single female/mother households (695 | 17.6%) accounting for the largest median household size of 4.4 persons per household. non-family households (563 | 14.3%) represent the smallest median household size with 1.31 persons per household.
| Household Type | # Households | Household Size |
| Married-Couple | 2,365 (60.0%) | 4.27 |
| Single Male/Father | 322 (8.2%) | 4.15 |
| Single Female/Mother | 695 (17.6%) | 4.40 |
| Non-family | 563 (14.3%) | 1.31 |
| Total Households | 3,945 (100.0%) | 3.86 |
Household Size by Marriage Status in Vincent
Out of a total of 3,945 households in Vincent, 3,382 (85.7%) are family households, while 563 (14.3%) are nonfamily households. The most numerous type of family households are 3-person households, comprising 783, and the most common type of nonfamily households are 1-person households, comprising 472.
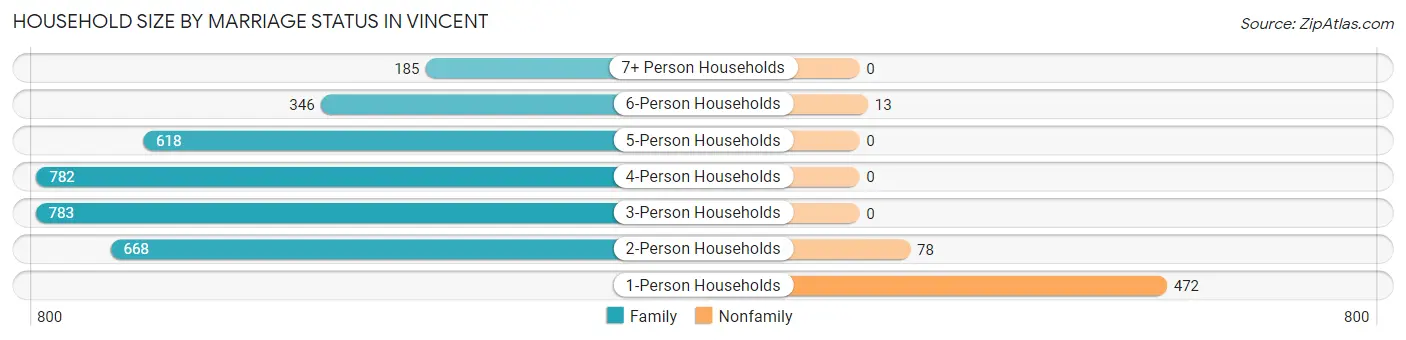
| Household Size | Family Households | Nonfamily Households |
| 1-Person Households | - | 472 (12.0%) |
| 2-Person Households | 668 (16.9%) | 78 (2.0%) |
| 3-Person Households | 783 (19.9%) | 0 (0.0%) |
| 4-Person Households | 782 (19.8%) | 0 (0.0%) |
| 5-Person Households | 618 (15.7%) | 0 (0.0%) |
| 6-Person Households | 346 (8.8%) | 13 (0.3%) |
| 7+ Person Households | 185 (4.7%) | 0 (0.0%) |
| Total | 3,382 (85.7%) | 563 (14.3%) |
Female Fertility in Vincent
Fertility by Age in Vincent
Average fertility rate in Vincent is 24.0 births per 1,000 women. Women in the age bracket of 20 to 34 years have the highest fertility rate with 29.0 births per 1,000 women. Women in the age bracket of 20 to 34 years acount for 51.2% of all women with births.
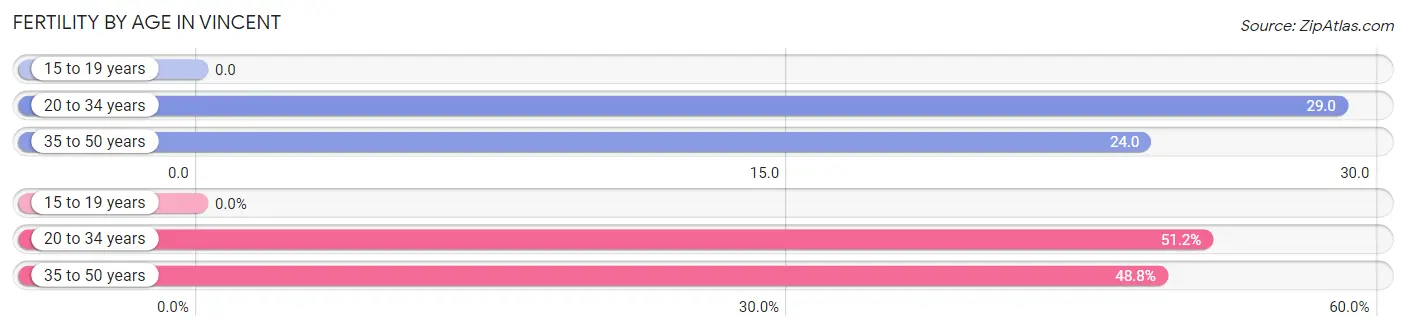
| Age Bracket | Women with Births | Births / 1,000 Women |
| 15 to 19 years | 0 (0.0%) | 0.0 |
| 20 to 34 years | 44 (51.2%) | 29.0 |
| 35 to 50 years | 42 (48.8%) | 24.0 |
| Total | 86 (100.0%) | 24.0 |
Fertility by Age by Marriage Status in Vincent
70.9% of women with births (86) in Vincent are married. The highest percentage of unmarried women with births falls into 35 to 50 years age bracket with 47.6% of them unmarried at the time of birth, while the lowest percentage of unmarried women with births belong to 20 to 34 years age bracket with 11.4% of them unmarried.
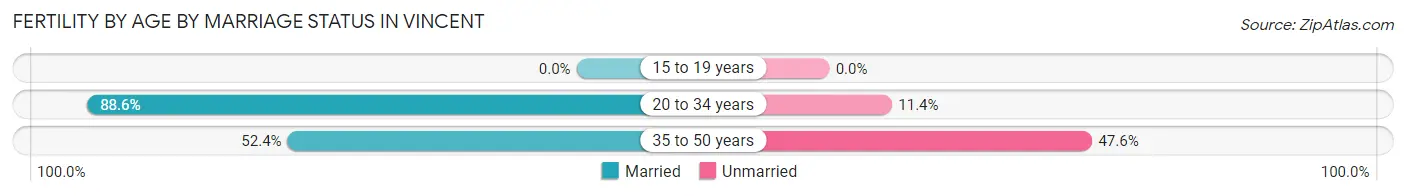
| Age Bracket | Married | Unmarried |
| 15 to 19 years | 0 (0.0%) | 0 (0.0%) |
| 20 to 34 years | 39 (88.6%) | 5 (11.4%) |
| 35 to 50 years | 22 (52.4%) | 20 (47.6%) |
| Total | 61 (70.9%) | 25 (29.1%) |
Fertility by Education in Vincent
Average fertility rate in Vincent is 24.0 births per 1,000 women. Women with the education attainment of less than high school have the highest fertility rate of 55.0 births per 1,000 women, while women with the education attainment of high school diploma have the lowest fertility at 12.0 births per 1,000 women. Women with the education attainment of less than high school represent 29.1% of all women with births.
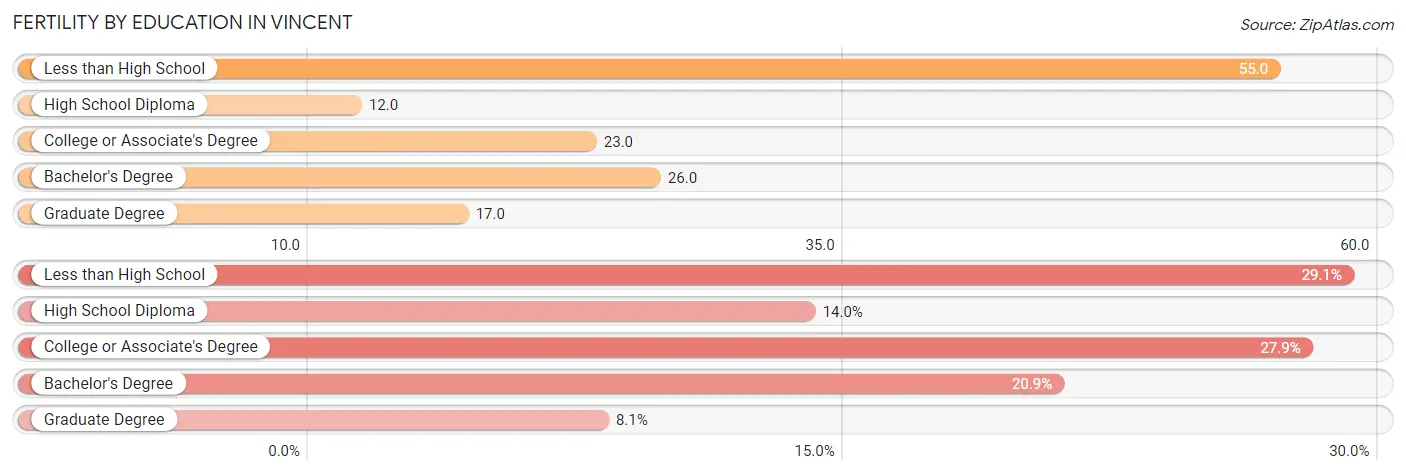
| Educational Attainment | Women with Births | Births / 1,000 Women |
| Less than High School | 25 (29.1%) | 55.0 |
| High School Diploma | 12 (14.0%) | 12.0 |
| College or Associate's Degree | 24 (27.9%) | 23.0 |
| Bachelor's Degree | 18 (20.9%) | 26.0 |
| Graduate Degree | 7 (8.1%) | 17.0 |
| Total | 86 (100.0%) | 24.0 |
Fertility by Education by Marriage Status in Vincent
29.1% of women with births in Vincent are unmarried. Women with the educational attainment of graduate degree are most likely to be married with 100.0% of them married at childbirth, while women with the educational attainment of bachelor's degree are least likely to be married with 55.6% of them unmarried at childbirth.
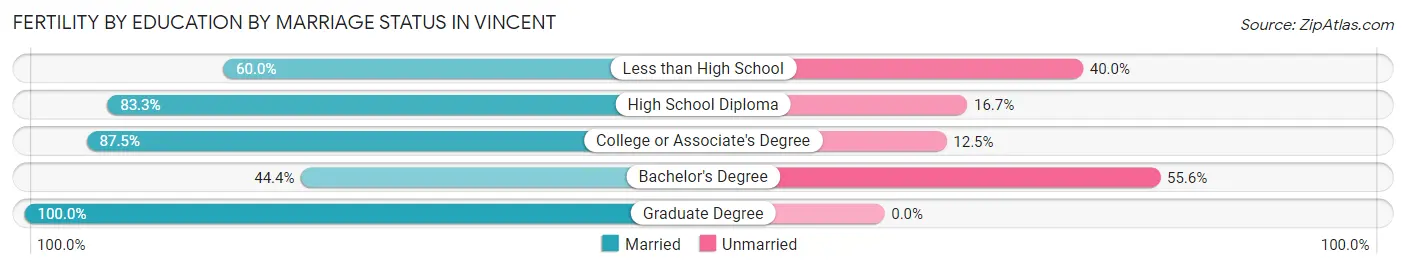
| Educational Attainment | Married | Unmarried |
| Less than High School | 15 (60.0%) | 10 (40.0%) |
| High School Diploma | 10 (83.3%) | 2 (16.7%) |
| College or Associate's Degree | 21 (87.5%) | 3 (12.5%) |
| Bachelor's Degree | 8 (44.4%) | 10 (55.6%) |
| Graduate Degree | 7 (100.0%) | 0 (0.0%) |
| Total | 61 (70.9%) | 25 (29.1%) |
Employment Characteristics in Vincent
Employment by Class of Employer in Vincent
Among the 7,716 employed individuals in Vincent, private company employees (5,517 | 71.5%), local government employees (943 | 12.2%), and not-for-profit organizations (669 | 8.7%) make up the most common classes of employment.
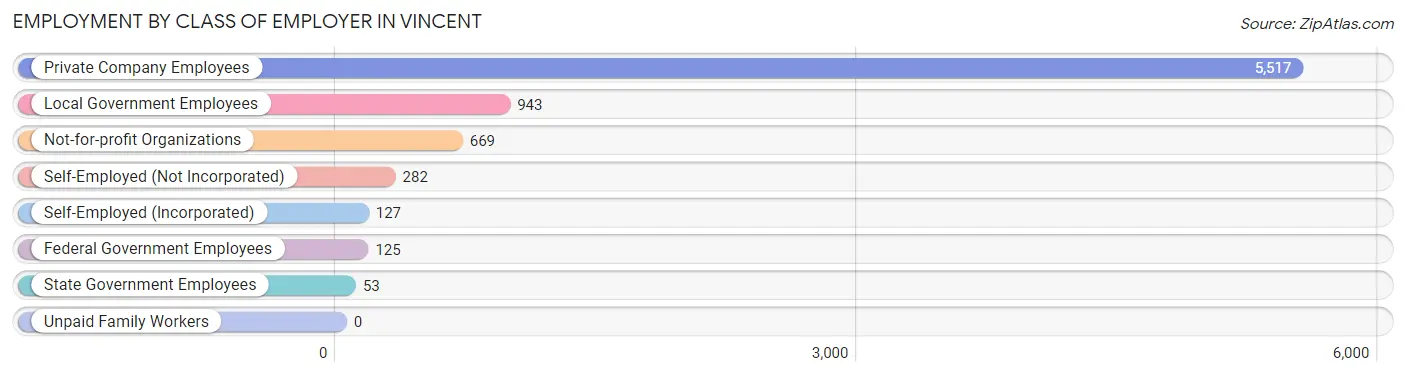
| Employer Class | # Employees | % Employees |
| Private Company Employees | 5,517 | 71.5% |
| Self-Employed (Incorporated) | 127 | 1.7% |
| Self-Employed (Not Incorporated) | 282 | 3.6% |
| Not-for-profit Organizations | 669 | 8.7% |
| Local Government Employees | 943 | 12.2% |
| State Government Employees | 53 | 0.7% |
| Federal Government Employees | 125 | 1.6% |
| Unpaid Family Workers | 0 | 0.0% |
| Total | 7,716 | 100.0% |
Employment Status by Age in Vincent
According to the labor force statistics for Vincent, out of the total population over 16 years of age (12,279), 68.5% or 8,411 individuals are in the labor force, with 5.3% or 446 of them unemployed. The age group with the highest labor force participation rate is 45 to 54 years, with 88.7% or 2,002 individuals in the labor force. Within the labor force, the 16 to 19 years age range has the highest percentage of unemployed individuals, with 26.6% or 68 of them being unemployed.
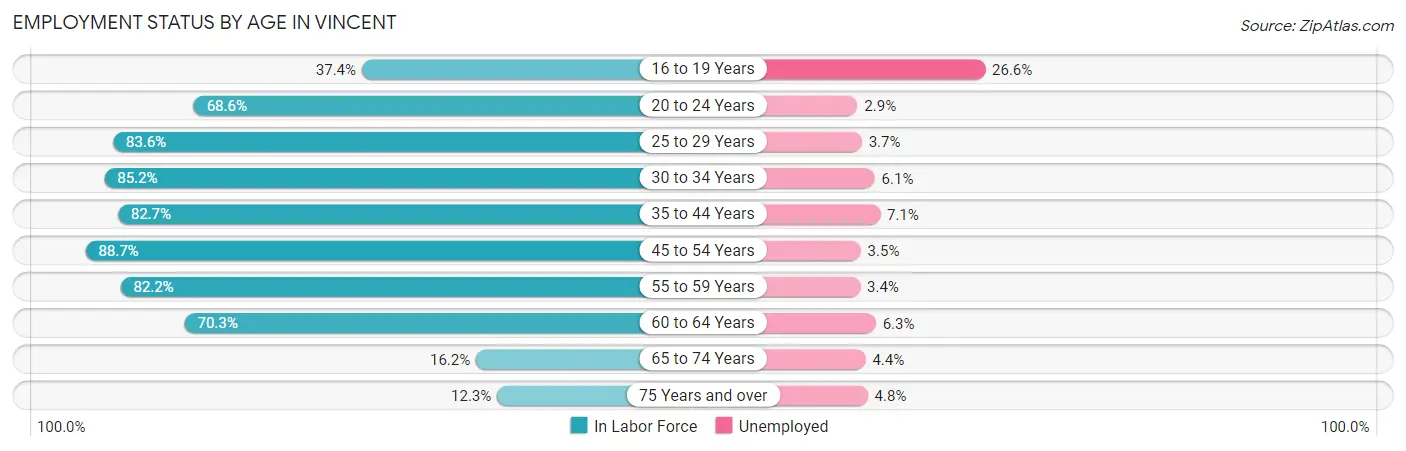
| Age Bracket | In Labor Force | Unemployed |
| 16 to 19 Years | 256 (37.4%) | 68 (26.6%) |
| 20 to 24 Years | 794 (68.6%) | 23 (2.9%) |
| 25 to 29 Years | 1,144 (83.6%) | 42 (3.7%) |
| 30 to 34 Years | 820 (85.2%) | 50 (6.1%) |
| 35 to 44 Years | 1,600 (82.7%) | 114 (7.1%) |
| 45 to 54 Years | 2,002 (88.7%) | 70 (3.5%) |
| 55 to 59 Years | 907 (82.2%) | 31 (3.4%) |
| 60 to 64 Years | 600 (70.3%) | 38 (6.3%) |
| 65 to 74 Years | 207 (16.2%) | 9 (4.4%) |
| 75 Years and over | 84 (12.3%) | 4 (4.8%) |
| Total | 8,411 (68.5%) | 446 (5.3%) |
Employment Status by Educational Attainment in Vincent
According to labor force statistics for Vincent, 83.4% of individuals (7,073) out of the total population between 25 and 64 years of age (8,481) are in the labor force, with 4.9% or 347 of them being unemployed. The group with the highest labor force participation rate are those with the educational attainment of bachelor's degree or higher, with 90.7% or 1,946 individuals in the labor force. Within the labor force, individuals with less than high school education have the highest percentage of unemployment, with 6.8% or 73 of them being unemployed.
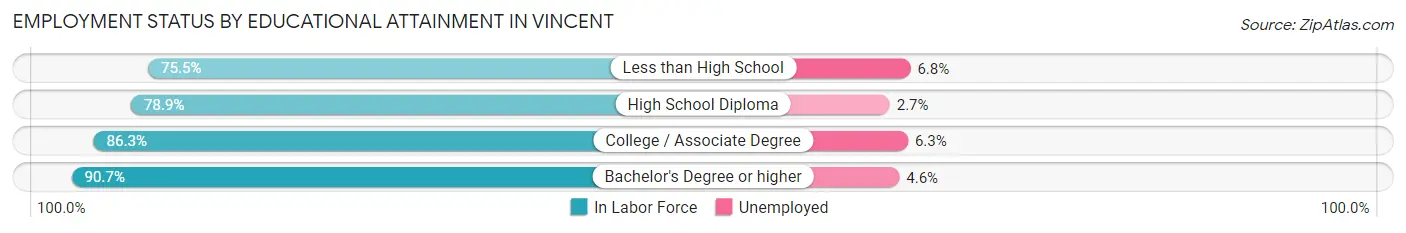
| Educational Attainment | In Labor Force | Unemployed |
| Less than High School | 1,073 (75.5%) | 97 (6.8%) |
| High School Diploma | 1,995 (78.9%) | 68 (2.7%) |
| College / Associate Degree | 2,059 (86.3%) | 150 (6.3%) |
| Bachelor's Degree or higher | 1,946 (90.7%) | 99 (4.6%) |
| Total | 7,073 (83.4%) | 416 (4.9%) |
Employment Occupations by Sex in Vincent
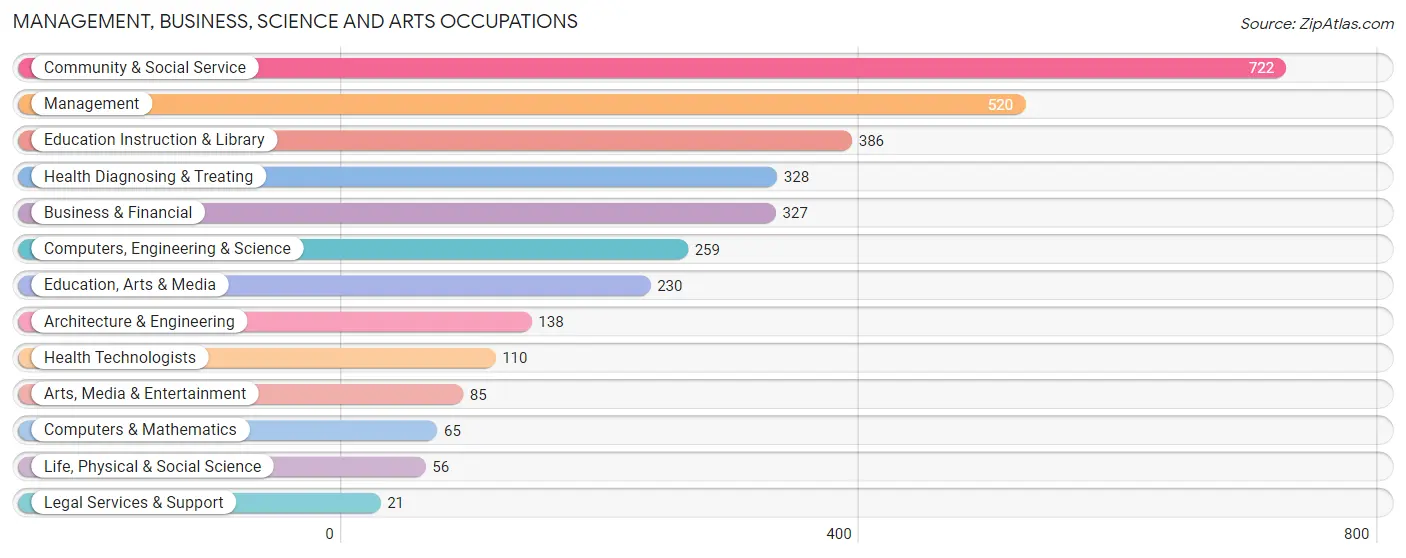
Management, Business, Science and Arts Occupations
The most common Management, Business, Science and Arts occupations in Vincent are Community & Social Service (722 | 9.1%), Management (520 | 6.5%), Education Instruction & Library (386 | 4.9%), Health Diagnosing & Treating (328 | 4.1%), and Business & Financial (327 | 4.1%).
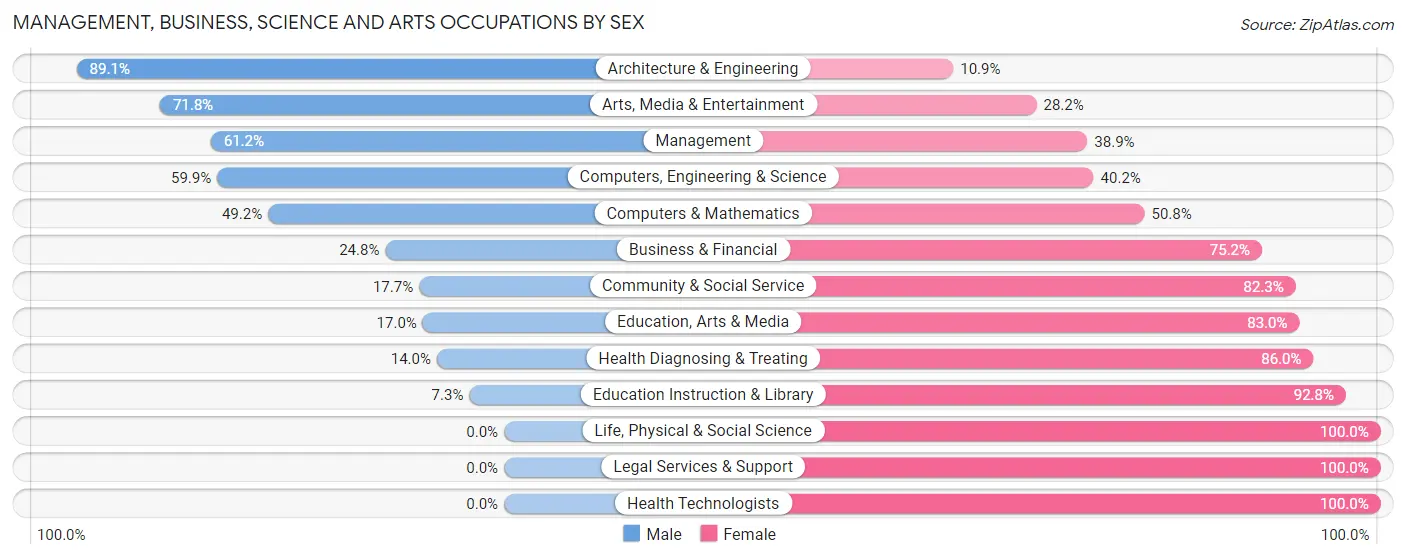
Management, Business, Science and Arts Occupations by Sex
Within the Management, Business, Science and Arts occupations in Vincent, the most male-oriented occupations are Architecture & Engineering (89.1%), Arts, Media & Entertainment (71.8%), and Management (61.2%), while the most female-oriented occupations are Life, Physical & Social Science (100.0%), Legal Services & Support (100.0%), and Health Technologists (100.0%).
| Occupation | Male | Female |
| Management | 318 (61.2%) | 202 (38.9%) |
| Business & Financial | 81 (24.8%) | 246 (75.2%) |
| Computers, Engineering & Science | 155 (59.9%) | 104 (40.2%) |
| Computers & Mathematics | 32 (49.2%) | 33 (50.8%) |
| Architecture & Engineering | 123 (89.1%) | 15 (10.9%) |
| Life, Physical & Social Science | 0 (0.0%) | 56 (100.0%) |
| Community & Social Service | 128 (17.7%) | 594 (82.3%) |
| Education, Arts & Media | 39 (17.0%) | 191 (83.0%) |
| Legal Services & Support | 0 (0.0%) | 21 (100.0%) |
| Education Instruction & Library | 28 (7.2%) | 358 (92.7%) |
| Arts, Media & Entertainment | 61 (71.8%) | 24 (28.2%) |
| Health Diagnosing & Treating | 46 (14.0%) | 282 (86.0%) |
| Health Technologists | 0 (0.0%) | 110 (100.0%) |
| Total (Category) | 728 (33.8%) | 1,428 (66.2%) |
| Total (Overall) | 4,078 (51.2%) | 3,886 (48.8%) |
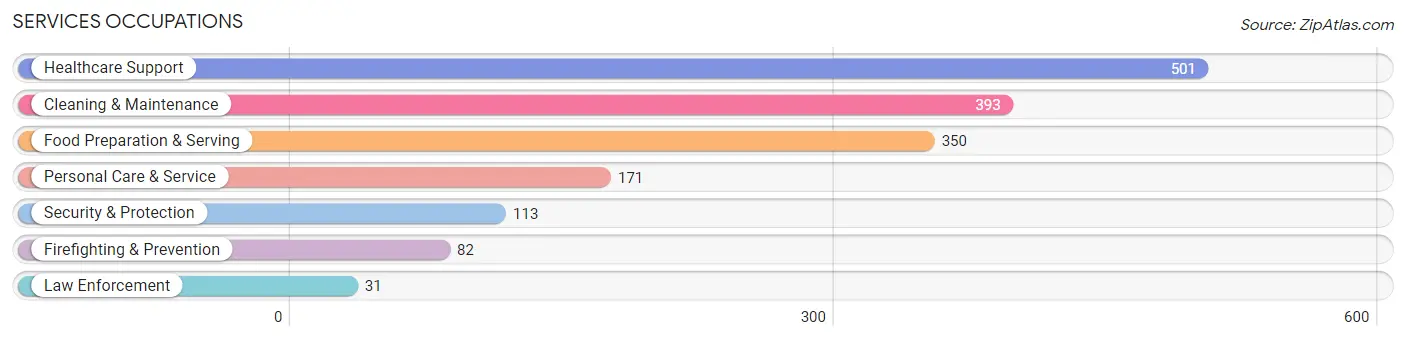
Services Occupations
The most common Services occupations in Vincent are Healthcare Support (501 | 6.3%), Cleaning & Maintenance (393 | 4.9%), Food Preparation & Serving (350 | 4.4%), Personal Care & Service (171 | 2.1%), and Security & Protection (113 | 1.4%).
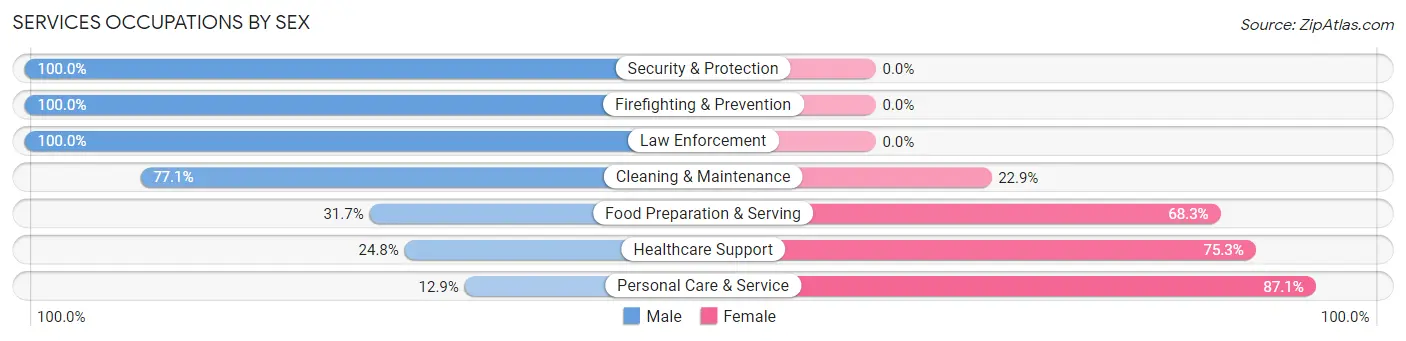
Services Occupations by Sex
Within the Services occupations in Vincent, the most male-oriented occupations are Security & Protection (100.0%), Firefighting & Prevention (100.0%), and Law Enforcement (100.0%), while the most female-oriented occupations are Personal Care & Service (87.1%), Healthcare Support (75.2%), and Food Preparation & Serving (68.3%).
| Occupation | Male | Female |
| Healthcare Support | 124 (24.7%) | 377 (75.2%) |
| Security & Protection | 113 (100.0%) | 0 (0.0%) |
| Firefighting & Prevention | 82 (100.0%) | 0 (0.0%) |
| Law Enforcement | 31 (100.0%) | 0 (0.0%) |
| Food Preparation & Serving | 111 (31.7%) | 239 (68.3%) |
| Cleaning & Maintenance | 303 (77.1%) | 90 (22.9%) |
| Personal Care & Service | 22 (12.9%) | 149 (87.1%) |
| Total (Category) | 673 (44.0%) | 855 (56.0%) |
| Total (Overall) | 4,078 (51.2%) | 3,886 (48.8%) |
Sales and Office Occupations
The most common Sales and Office occupations in Vincent are Office & Administration (1,141 | 14.3%), and Sales & Related (716 | 9.0%).

Sales and Office Occupations by Sex
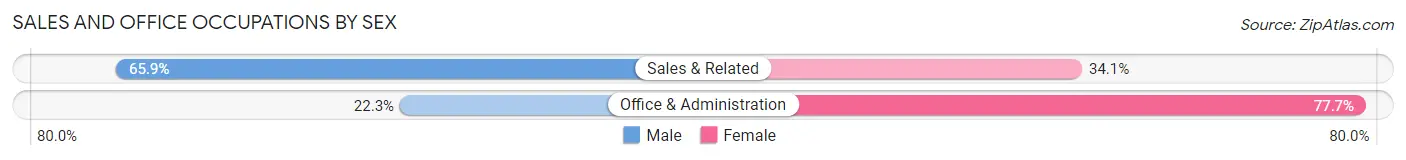
| Occupation | Male | Female |
| Sales & Related | 472 (65.9%) | 244 (34.1%) |
| Office & Administration | 254 (22.3%) | 887 (77.7%) |
| Total (Category) | 726 (39.1%) | 1,131 (60.9%) |
| Total (Overall) | 4,078 (51.2%) | 3,886 (48.8%) |
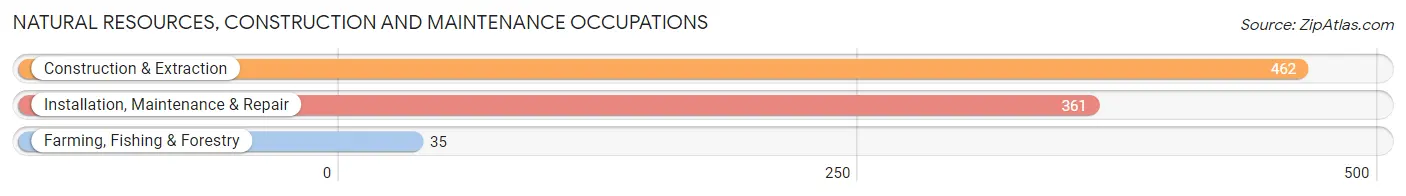
Natural Resources, Construction and Maintenance Occupations
The most common Natural Resources, Construction and Maintenance occupations in Vincent are Construction & Extraction (462 | 5.8%), Installation, Maintenance & Repair (361 | 4.5%), and Farming, Fishing & Forestry (35 | 0.4%).
Natural Resources, Construction and Maintenance Occupations by Sex
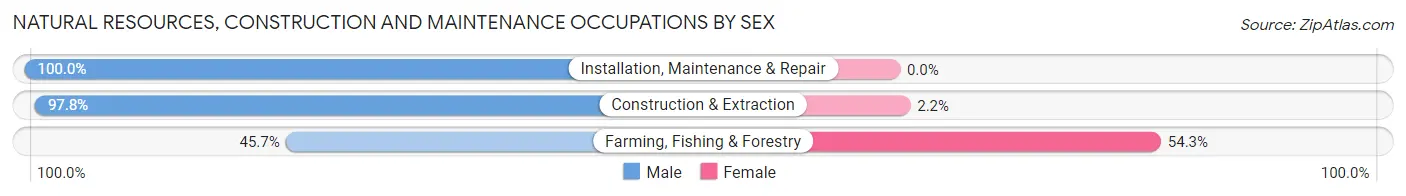
| Occupation | Male | Female |
| Farming, Fishing & Forestry | 16 (45.7%) | 19 (54.3%) |
| Construction & Extraction | 452 (97.8%) | 10 (2.2%) |
| Installation, Maintenance & Repair | 361 (100.0%) | 0 (0.0%) |
| Total (Category) | 829 (96.6%) | 29 (3.4%) |
| Total (Overall) | 4,078 (51.2%) | 3,886 (48.8%) |
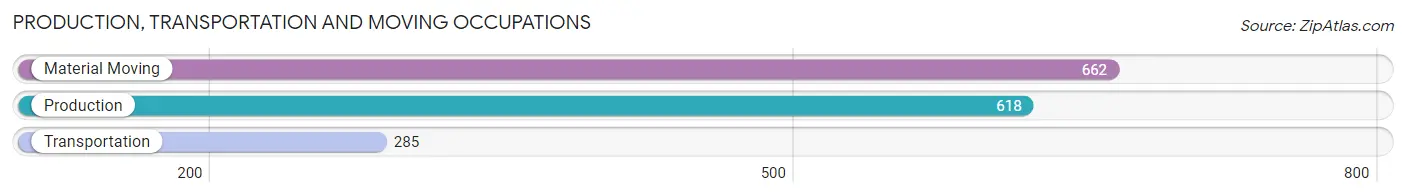
Production, Transportation and Moving Occupations
The most common Production, Transportation and Moving occupations in Vincent are Material Moving (662 | 8.3%), Production (618 | 7.8%), and Transportation (285 | 3.6%).
Production, Transportation and Moving Occupations by Sex
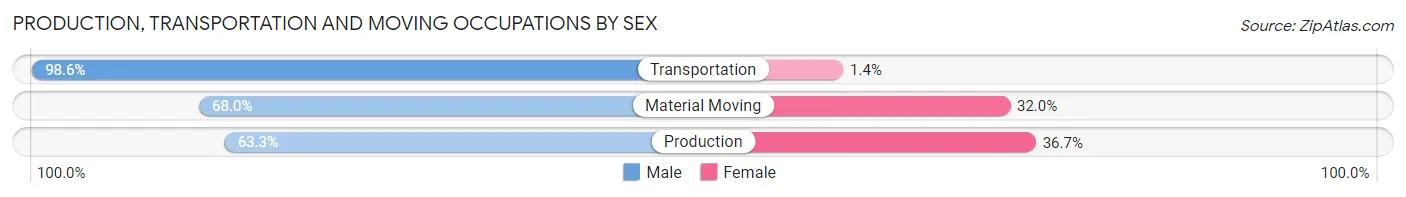
| Occupation | Male | Female |
| Production | 391 (63.3%) | 227 (36.7%) |
| Transportation | 281 (98.6%) | 4 (1.4%) |
| Material Moving | 450 (68.0%) | 212 (32.0%) |
| Total (Category) | 1,122 (71.7%) | 443 (28.3%) |
| Total (Overall) | 4,078 (51.2%) | 3,886 (48.8%) |
Employment Industries by Sex in Vincent
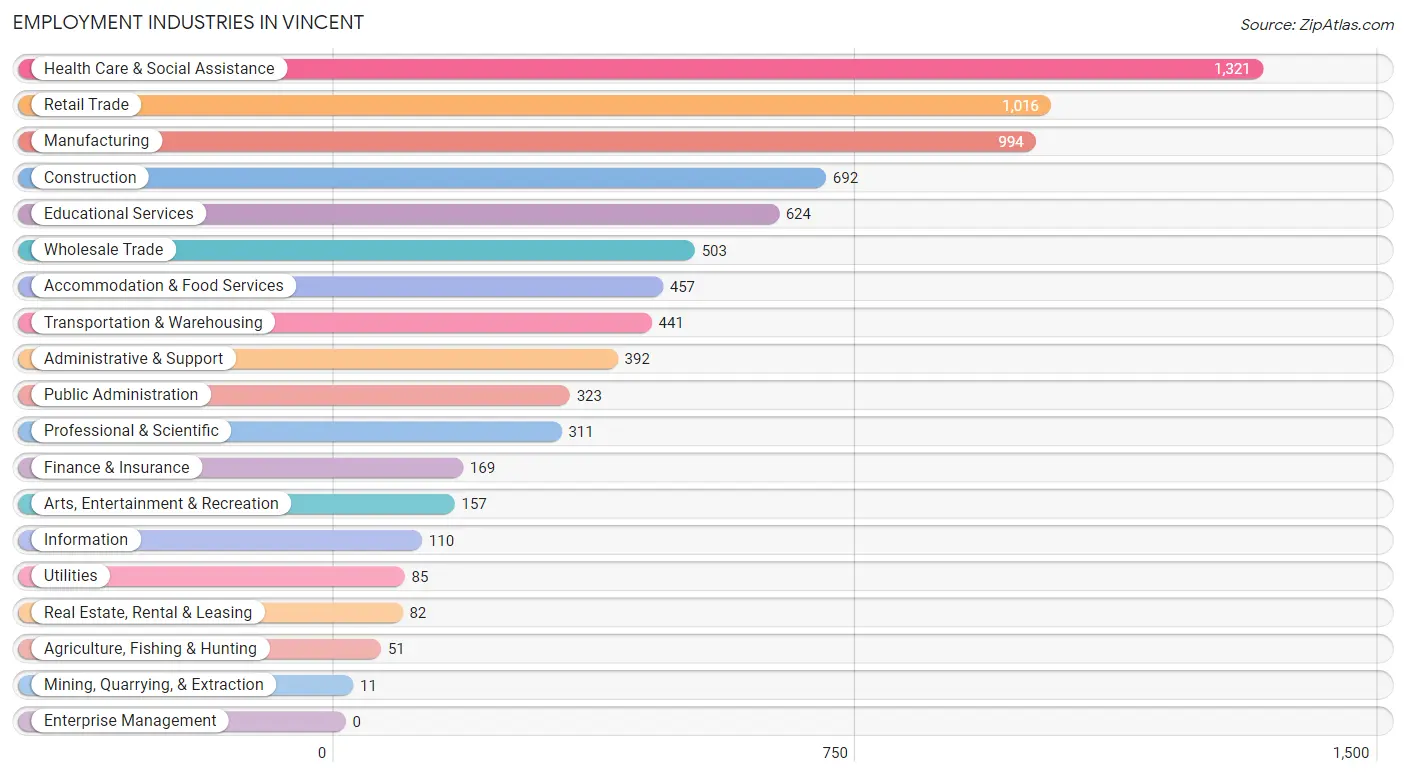
Employment Industries in Vincent
The major employment industries in Vincent include Health Care & Social Assistance (1,321 | 16.6%), Retail Trade (1,016 | 12.8%), Manufacturing (994 | 12.5%), Construction (692 | 8.7%), and Educational Services (624 | 7.8%).
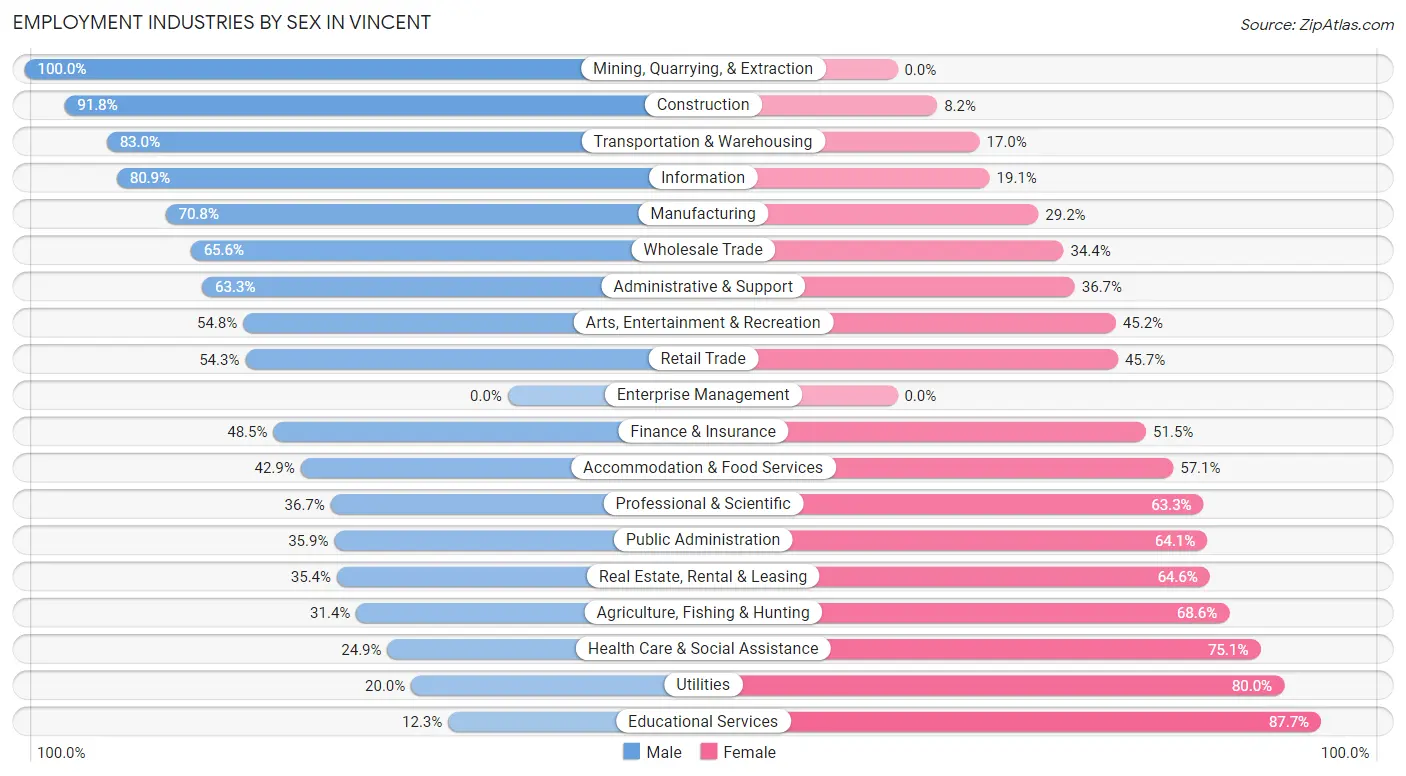
Employment Industries by Sex in Vincent
The Vincent industries that see more men than women are Mining, Quarrying, & Extraction (100.0%), Construction (91.8%), and Transportation & Warehousing (83.0%), whereas the industries that tend to have a higher number of women are Educational Services (87.7%), Utilities (80.0%), and Health Care & Social Assistance (75.1%).
| Industry | Male | Female |
| Agriculture, Fishing & Hunting | 16 (31.4%) | 35 (68.6%) |
| Mining, Quarrying, & Extraction | 11 (100.0%) | 0 (0.0%) |
| Construction | 635 (91.8%) | 57 (8.2%) |
| Manufacturing | 704 (70.8%) | 290 (29.2%) |
| Wholesale Trade | 330 (65.6%) | 173 (34.4%) |
| Retail Trade | 552 (54.3%) | 464 (45.7%) |
| Transportation & Warehousing | 366 (83.0%) | 75 (17.0%) |
| Utilities | 17 (20.0%) | 68 (80.0%) |
| Information | 89 (80.9%) | 21 (19.1%) |
| Finance & Insurance | 82 (48.5%) | 87 (51.5%) |
| Real Estate, Rental & Leasing | 29 (35.4%) | 53 (64.6%) |
| Professional & Scientific | 114 (36.7%) | 197 (63.3%) |
| Enterprise Management | 0 (0.0%) | 0 (0.0%) |
| Administrative & Support | 248 (63.3%) | 144 (36.7%) |
| Educational Services | 77 (12.3%) | 547 (87.7%) |
| Health Care & Social Assistance | 329 (24.9%) | 992 (75.1%) |
| Arts, Entertainment & Recreation | 86 (54.8%) | 71 (45.2%) |
| Accommodation & Food Services | 196 (42.9%) | 261 (57.1%) |
| Public Administration | 116 (35.9%) | 207 (64.1%) |
| Total | 4,078 (51.2%) | 3,886 (48.8%) |
Education in Vincent
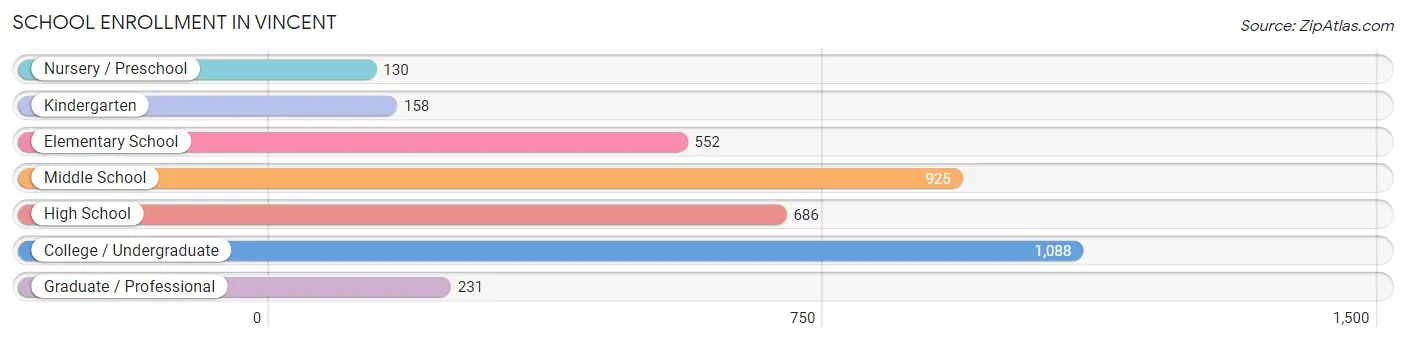
School Enrollment in Vincent
The most common levels of schooling among the 3,770 students in Vincent are college / undergraduate (1,088 | 28.9%), middle school (925 | 24.5%), and high school (686 | 18.2%).
| School Level | # Students | % Students |
| Nursery / Preschool | 130 | 3.5% |
| Kindergarten | 158 | 4.2% |
| Elementary School | 552 | 14.6% |
| Middle School | 925 | 24.5% |
| High School | 686 | 18.2% |
| College / Undergraduate | 1,088 | 28.9% |
| Graduate / Professional | 231 | 6.1% |
| Total | 3,770 | 100.0% |
School Enrollment by Age by Funding Source in Vincent
Out of a total of 3,770 students who are enrolled in schools in Vincent, 418 (11.1%) attend a private institution, while the remaining 3,352 (88.9%) are enrolled in public schools. The age group of 18 to 19 year olds has the highest likelihood of being enrolled in private schools, with 58 (33.3% in the age bracket) enrolled. Conversely, the age group of 3 to 4 year olds has the lowest likelihood of being enrolled in a private school, with 97 (100.0% in the age bracket) attending a public institution.
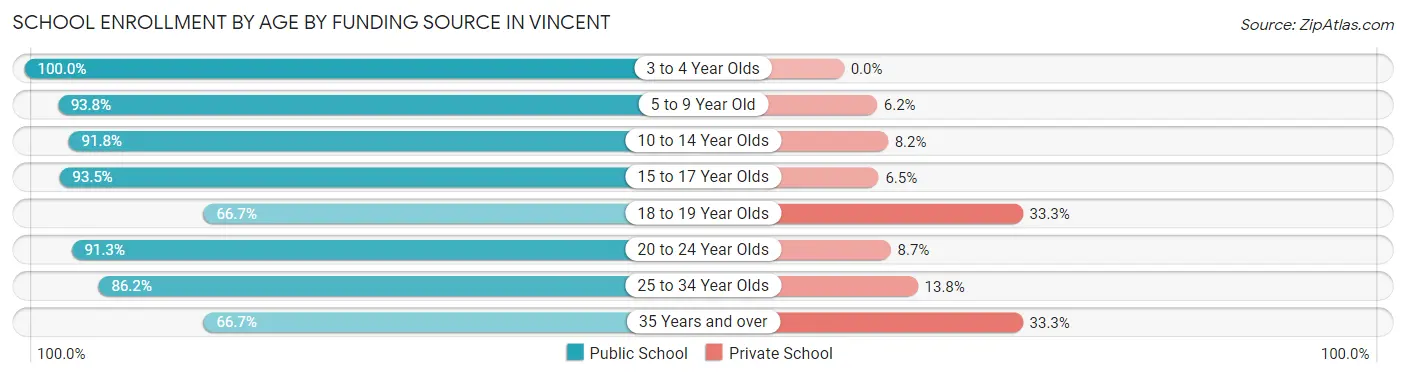
| Age Bracket | Public School | Private School |
| 3 to 4 Year Olds | 97 (100.0%) | 0 (0.0%) |
| 5 to 9 Year Old | 638 (93.8%) | 42 (6.2%) |
| 10 to 14 Year Olds | 1,073 (91.8%) | 96 (8.2%) |
| 15 to 17 Year Olds | 461 (93.5%) | 32 (6.5%) |
| 18 to 19 Year Olds | 116 (66.7%) | 58 (33.3%) |
| 20 to 24 Year Olds | 376 (91.3%) | 36 (8.7%) |
| 25 to 34 Year Olds | 407 (86.2%) | 65 (13.8%) |
| 35 Years and over | 182 (66.7%) | 91 (33.3%) |
| Total | 3,352 (88.9%) | 418 (11.1%) |
Educational Attainment by Field of Study in Vincent
Business (655 | 26.1%), science & technology (320 | 12.8%), liberal arts & history (294 | 11.7%), social sciences (278 | 11.1%), and engineering (222 | 8.9%) are the most common fields of study among 2,507 individuals in Vincent who have obtained a bachelor's degree or higher.
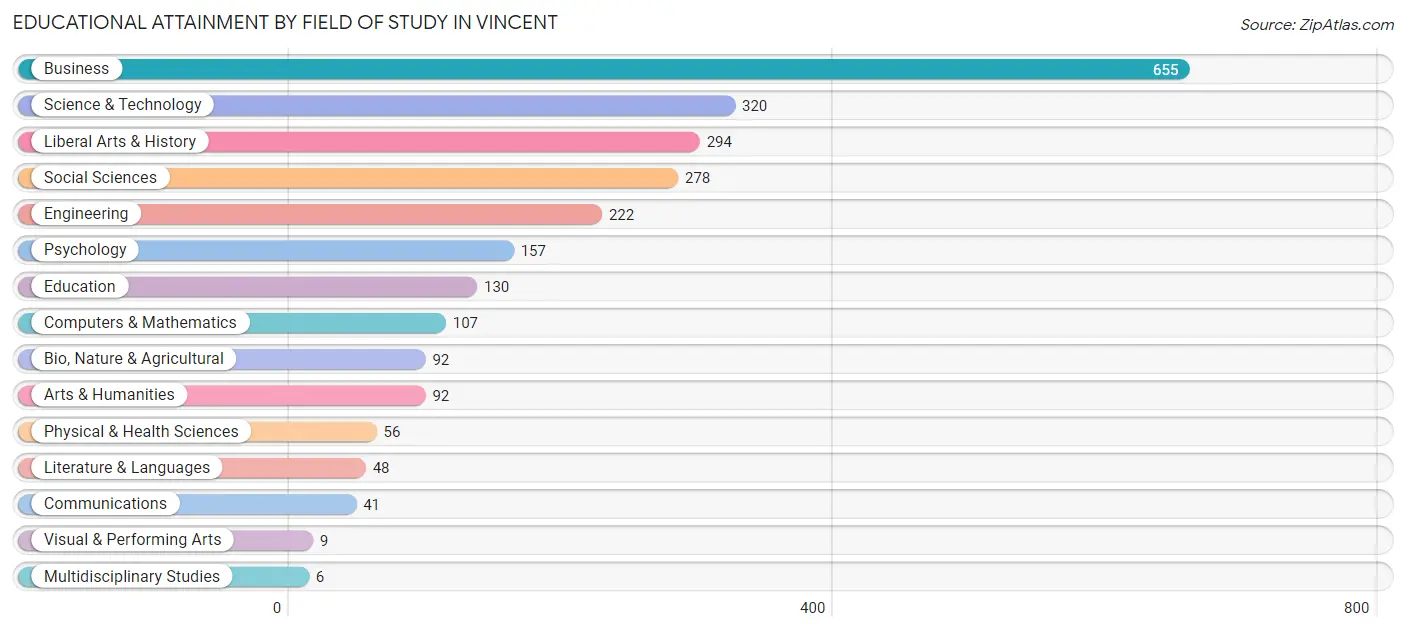
| Field of Study | # Graduates | % Graduates |
| Computers & Mathematics | 107 | 4.3% |
| Bio, Nature & Agricultural | 92 | 3.7% |
| Physical & Health Sciences | 56 | 2.2% |
| Psychology | 157 | 6.3% |
| Social Sciences | 278 | 11.1% |
| Engineering | 222 | 8.9% |
| Multidisciplinary Studies | 6 | 0.2% |
| Science & Technology | 320 | 12.8% |
| Business | 655 | 26.1% |
| Education | 130 | 5.2% |
| Literature & Languages | 48 | 1.9% |
| Liberal Arts & History | 294 | 11.7% |
| Visual & Performing Arts | 9 | 0.4% |
| Communications | 41 | 1.6% |
| Arts & Humanities | 92 | 3.7% |
| Total | 2,507 | 100.0% |
Transportation & Commute in Vincent
Vehicle Availability by Sex in Vincent
The most prevalent vehicle ownership categories in Vincent are males with 3 vehicles (1,170, accounting for 29.5%) and females with 3 vehicles (1,149, making up 31.2%).
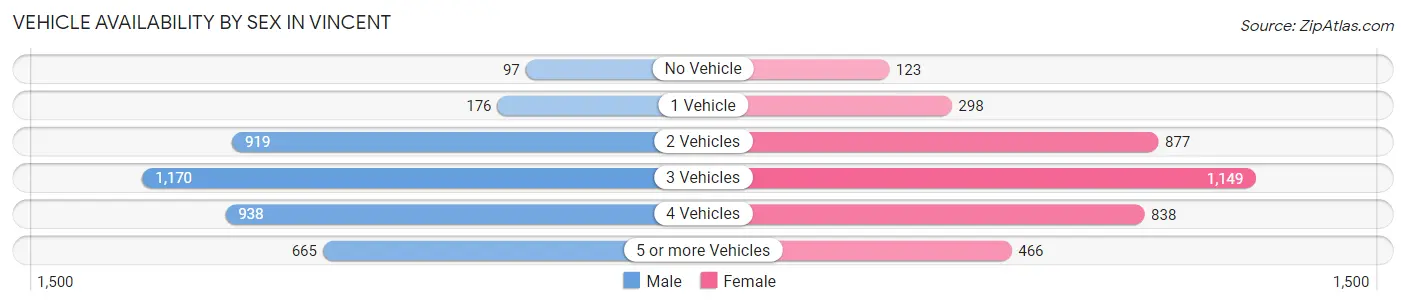
| Vehicles Available | Male | Female |
| No Vehicle | 97 (2.5%) | 123 (3.3%) |
| 1 Vehicle | 176 (4.4%) | 298 (7.9%) |
| 2 Vehicles | 919 (23.2%) | 877 (23.4%) |
| 3 Vehicles | 1,170 (29.5%) | 1,149 (30.6%) |
| 4 Vehicles | 938 (23.7%) | 838 (22.3%) |
| 5 or more Vehicles | 665 (16.8%) | 466 (12.4%) |
| Total | 3,965 (100.0%) | 3,751 (100.0%) |
Commute Time in Vincent
The most frequently occuring commute durations in Vincent are 30 to 34 minutes (1,391 commuters, 20.1%), 45 to 59 minutes (874 commuters, 12.6%), and 20 to 24 minutes (864 commuters, 12.5%).
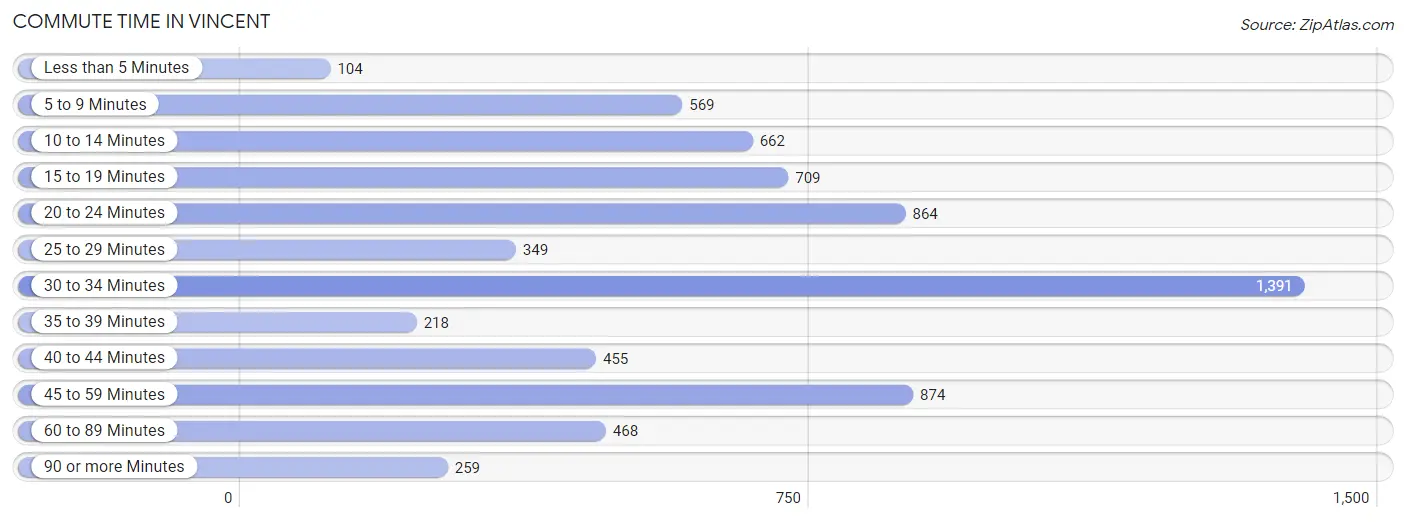
| Commute Time | # Commuters | % Commuters |
| Less than 5 Minutes | 104 | 1.5% |
| 5 to 9 Minutes | 569 | 8.2% |
| 10 to 14 Minutes | 662 | 9.6% |
| 15 to 19 Minutes | 709 | 10.2% |
| 20 to 24 Minutes | 864 | 12.5% |
| 25 to 29 Minutes | 349 | 5.0% |
| 30 to 34 Minutes | 1,391 | 20.1% |
| 35 to 39 Minutes | 218 | 3.2% |
| 40 to 44 Minutes | 455 | 6.6% |
| 45 to 59 Minutes | 874 | 12.6% |
| 60 to 89 Minutes | 468 | 6.8% |
| 90 or more Minutes | 259 | 3.7% |
Commute Time by Sex in Vincent
The most common commute times in Vincent are 30 to 34 minutes (839 commuters, 23.1%) for males and 30 to 34 minutes (552 commuters, 16.8%) for females.
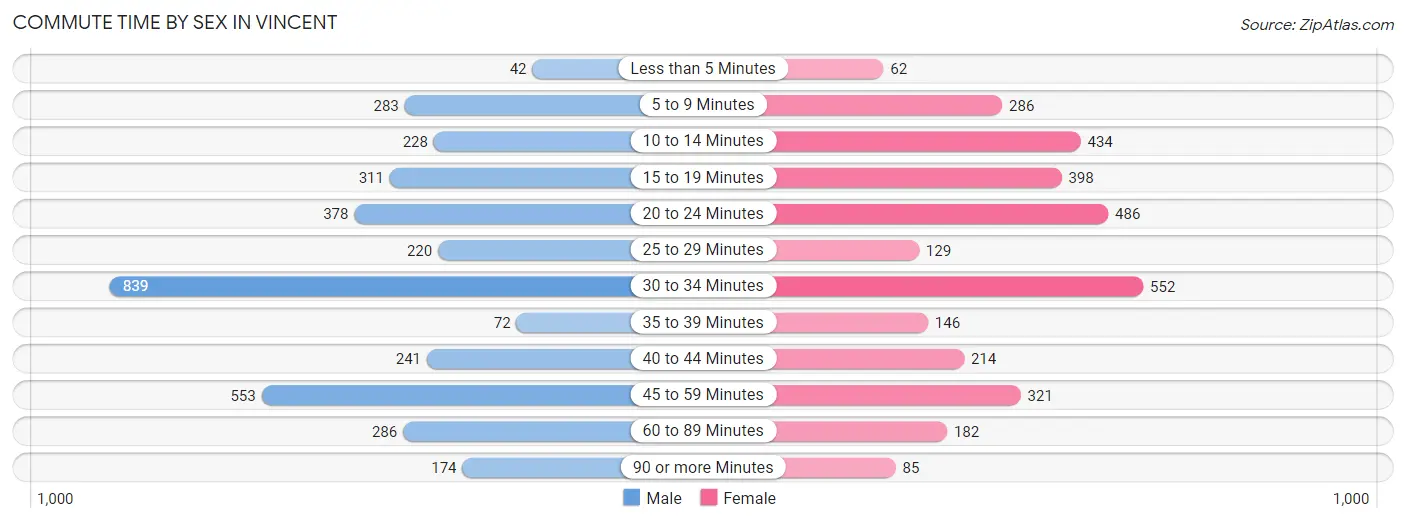
| Commute Time | Male | Female |
| Less than 5 Minutes | 42 (1.2%) | 62 (1.9%) |
| 5 to 9 Minutes | 283 (7.8%) | 286 (8.7%) |
| 10 to 14 Minutes | 228 (6.3%) | 434 (13.2%) |
| 15 to 19 Minutes | 311 (8.6%) | 398 (12.1%) |
| 20 to 24 Minutes | 378 (10.4%) | 486 (14.7%) |
| 25 to 29 Minutes | 220 (6.1%) | 129 (3.9%) |
| 30 to 34 Minutes | 839 (23.1%) | 552 (16.8%) |
| 35 to 39 Minutes | 72 (2.0%) | 146 (4.4%) |
| 40 to 44 Minutes | 241 (6.6%) | 214 (6.5%) |
| 45 to 59 Minutes | 553 (15.2%) | 321 (9.7%) |
| 60 to 89 Minutes | 286 (7.9%) | 182 (5.5%) |
| 90 or more Minutes | 174 (4.8%) | 85 (2.6%) |
Time of Departure to Work by Sex in Vincent
The most frequent times of departure to work in Vincent are 7:00 AM to 7:29 AM (509, 14.0%) for males and 8:00 AM to 8:29 AM (491, 14.9%) for females.
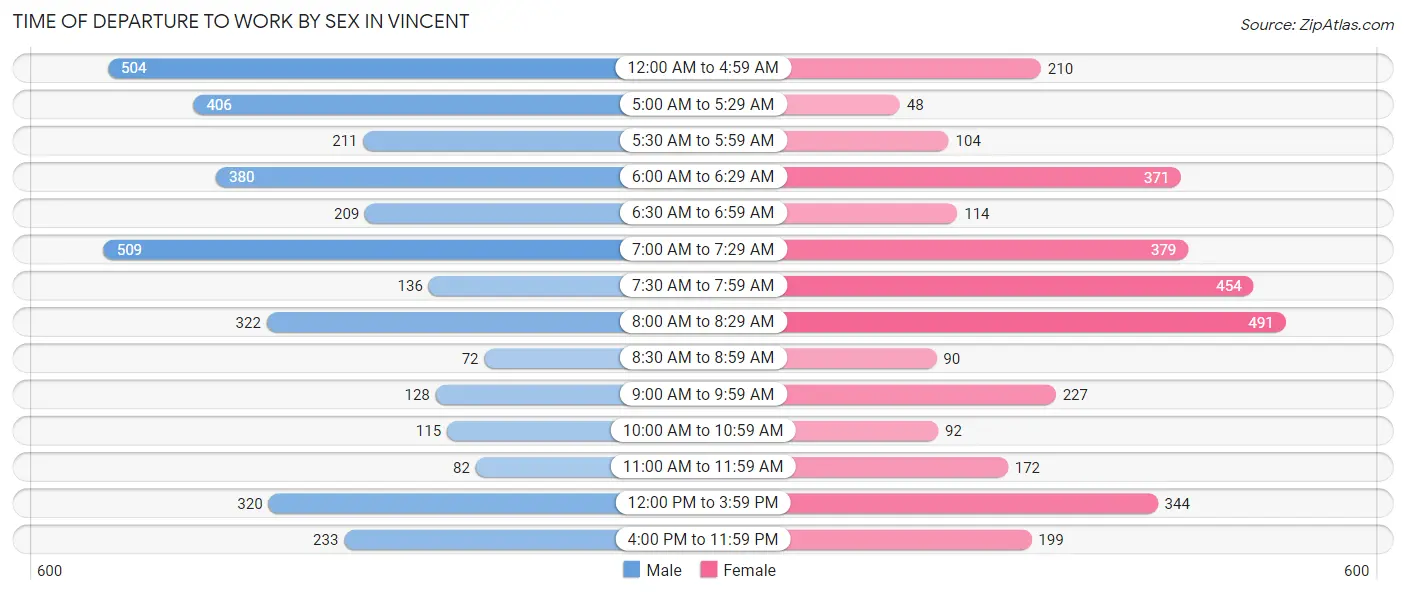
| Time of Departure | Male | Female |
| 12:00 AM to 4:59 AM | 504 (13.9%) | 210 (6.4%) |
| 5:00 AM to 5:29 AM | 406 (11.2%) | 48 (1.5%) |
| 5:30 AM to 5:59 AM | 211 (5.8%) | 104 (3.2%) |
| 6:00 AM to 6:29 AM | 380 (10.5%) | 371 (11.3%) |
| 6:30 AM to 6:59 AM | 209 (5.8%) | 114 (3.5%) |
| 7:00 AM to 7:29 AM | 509 (14.0%) | 379 (11.5%) |
| 7:30 AM to 7:59 AM | 136 (3.7%) | 454 (13.8%) |
| 8:00 AM to 8:29 AM | 322 (8.9%) | 491 (14.9%) |
| 8:30 AM to 8:59 AM | 72 (2.0%) | 90 (2.7%) |
| 9:00 AM to 9:59 AM | 128 (3.5%) | 227 (6.9%) |
| 10:00 AM to 10:59 AM | 115 (3.2%) | 92 (2.8%) |
| 11:00 AM to 11:59 AM | 82 (2.3%) | 172 (5.2%) |
| 12:00 PM to 3:59 PM | 320 (8.8%) | 344 (10.4%) |
| 4:00 PM to 11:59 PM | 233 (6.4%) | 199 (6.0%) |
| Total | 3,627 (100.0%) | 3,295 (100.0%) |
Housing Occupancy in Vincent
Occupancy by Ownership in Vincent
Of the total 3,945 dwellings in Vincent, owner-occupied units account for 3,124 (79.2%), while renter-occupied units make up 821 (20.8%).
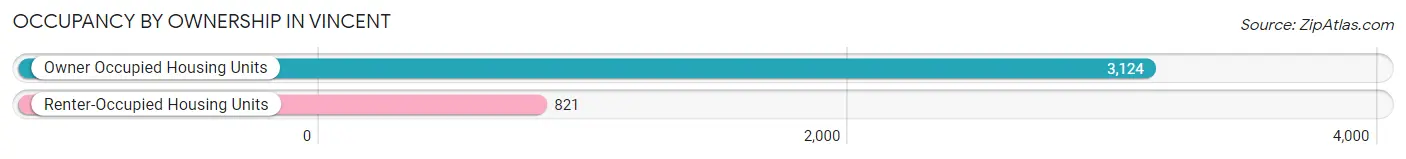
| Occupancy | # Housing Units | % Housing Units |
| Owner Occupied Housing Units | 3,124 | 79.2% |
| Renter-Occupied Housing Units | 821 | 20.8% |
| Total Occupied Housing Units | 3,945 | 100.0% |
Occupancy by Household Size in Vincent
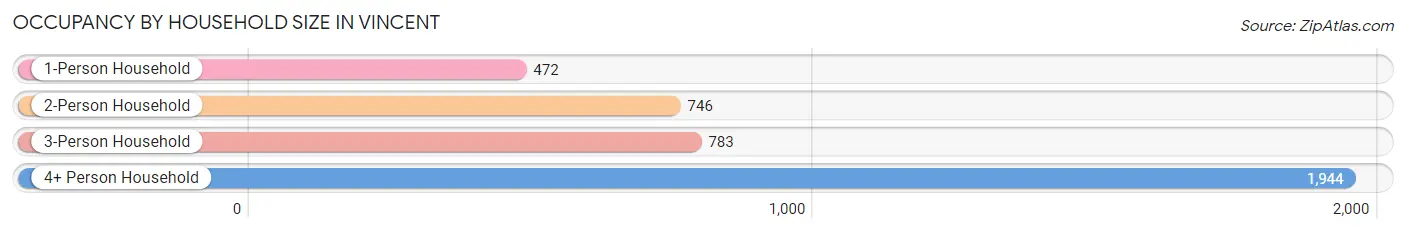
| Household Size | # Housing Units | % Housing Units |
| 1-Person Household | 472 | 12.0% |
| 2-Person Household | 746 | 18.9% |
| 3-Person Household | 783 | 19.9% |
| 4+ Person Household | 1,944 | 49.3% |
| Total Housing Units | 3,945 | 100.0% |
Occupancy by Ownership by Household Size in Vincent
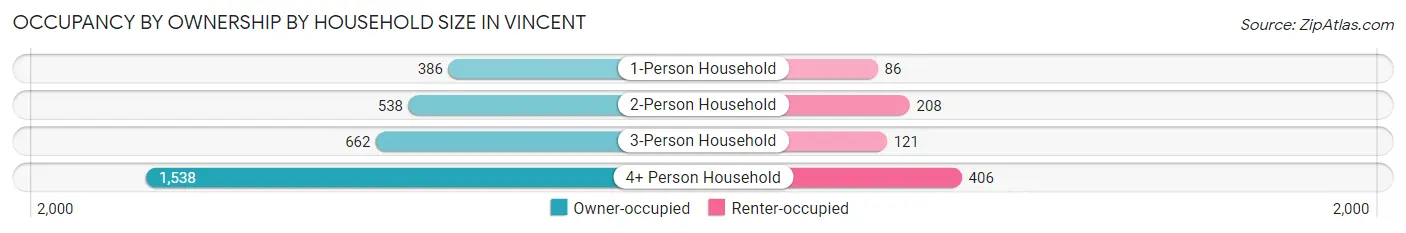
| Household Size | Owner-occupied | Renter-occupied |
| 1-Person Household | 386 (81.8%) | 86 (18.2%) |
| 2-Person Household | 538 (72.1%) | 208 (27.9%) |
| 3-Person Household | 662 (84.6%) | 121 (15.4%) |
| 4+ Person Household | 1,538 (79.1%) | 406 (20.9%) |
| Total Housing Units | 3,124 (79.2%) | 821 (20.8%) |
Occupancy by Educational Attainment in Vincent
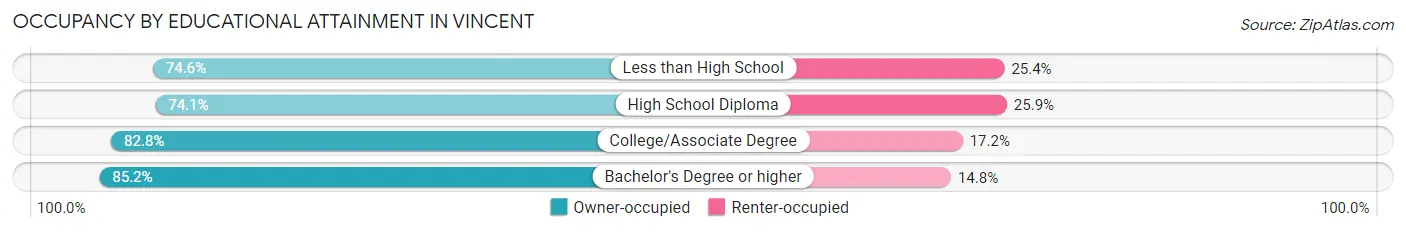
| Household Size | Owner-occupied | Renter-occupied |
| Less than High School | 601 (74.6%) | 205 (25.4%) |
| High School Diploma | 863 (74.1%) | 302 (25.9%) |
| College/Associate Degree | 758 (82.8%) | 157 (17.2%) |
| Bachelor's Degree or higher | 902 (85.2%) | 157 (14.8%) |
Occupancy by Age of Householder in Vincent
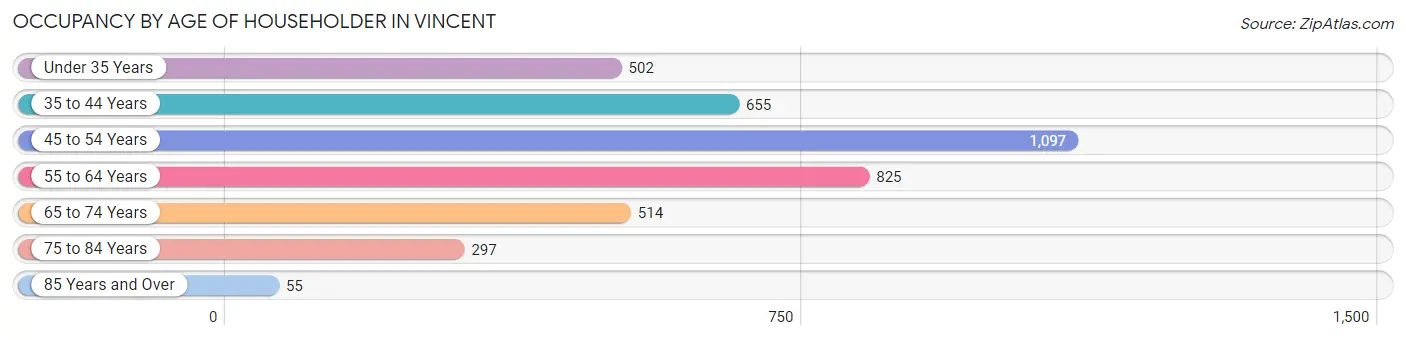
| Age Bracket | # Households | % Households |
| Under 35 Years | 502 | 12.7% |
| 35 to 44 Years | 655 | 16.6% |
| 45 to 54 Years | 1,097 | 27.8% |
| 55 to 64 Years | 825 | 20.9% |
| 65 to 74 Years | 514 | 13.0% |
| 75 to 84 Years | 297 | 7.5% |
| 85 Years and Over | 55 | 1.4% |
| Total | 3,945 | 100.0% |
Housing Finances in Vincent
Median Income by Occupancy in Vincent
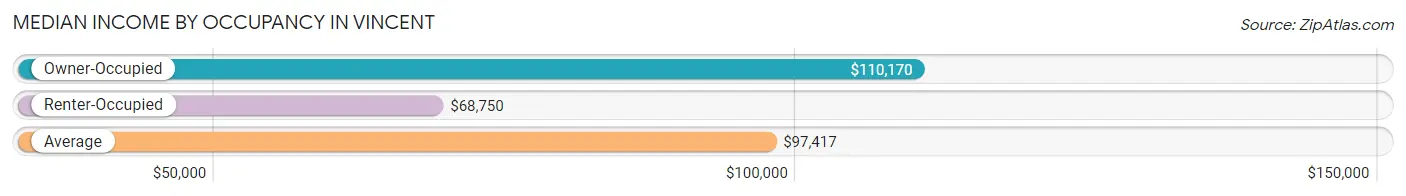
| Occupancy Type | # Households | Median Income |
| Owner-Occupied | 3,124 (79.2%) | $110,170 |
| Renter-Occupied | 821 (20.8%) | $68,750 |
| Average | 3,945 (100.0%) | $97,417 |
Occupancy by Householder Income Bracket in Vincent
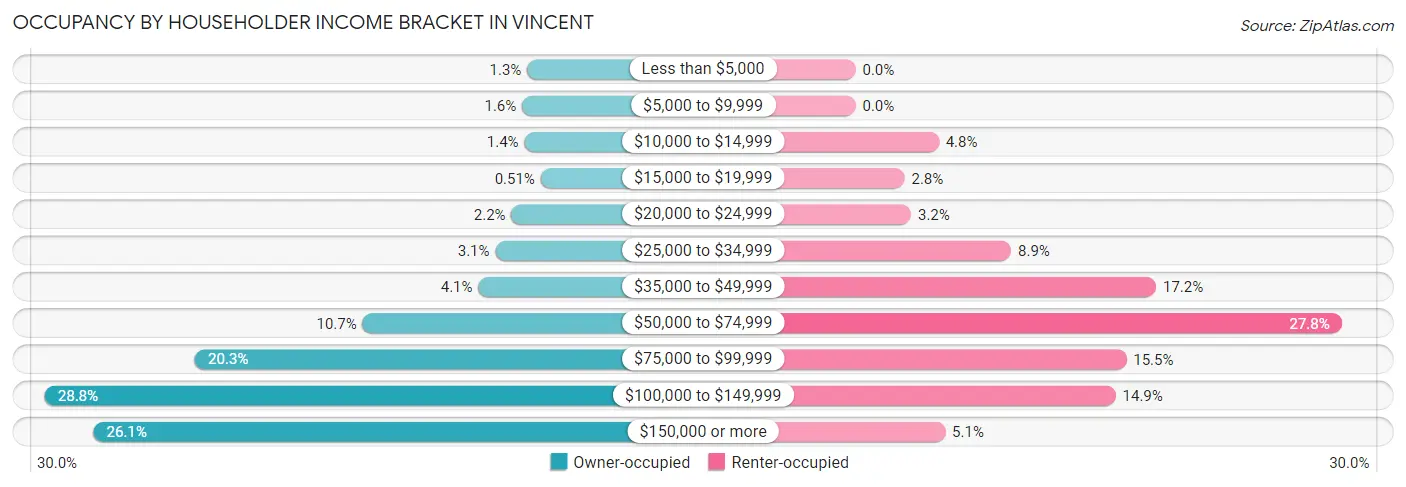
| Income Bracket | Owner-occupied | Renter-occupied |
| Less than $5,000 | 40 (1.3%) | 0 (0.0%) |
| $5,000 to $9,999 | 49 (1.6%) | 0 (0.0%) |
| $10,000 to $14,999 | 45 (1.4%) | 39 (4.8%) |
| $15,000 to $19,999 | 16 (0.5%) | 23 (2.8%) |
| $20,000 to $24,999 | 68 (2.2%) | 26 (3.2%) |
| $25,000 to $34,999 | 97 (3.1%) | 73 (8.9%) |
| $35,000 to $49,999 | 127 (4.1%) | 141 (17.2%) |
| $50,000 to $74,999 | 334 (10.7%) | 228 (27.8%) |
| $75,000 to $99,999 | 633 (20.3%) | 127 (15.5%) |
| $100,000 to $149,999 | 901 (28.8%) | 122 (14.9%) |
| $150,000 or more | 814 (26.1%) | 42 (5.1%) |
| Total | 3,124 (100.0%) | 821 (100.0%) |
Monthly Housing Cost Tiers in Vincent
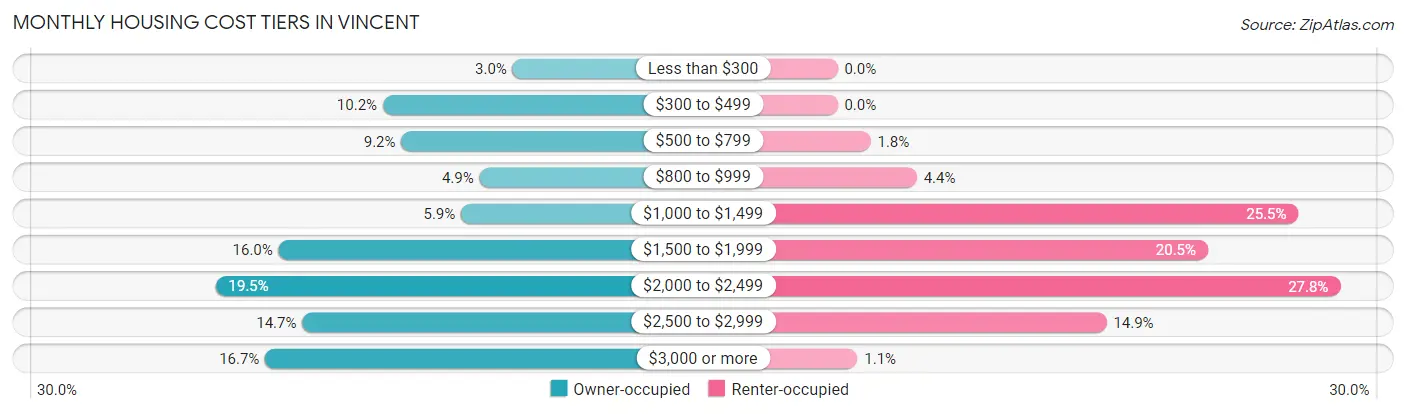
| Monthly Cost | Owner-occupied | Renter-occupied |
| Less than $300 | 95 (3.0%) | 0 (0.0%) |
| $300 to $499 | 319 (10.2%) | 0 (0.0%) |
| $500 to $799 | 287 (9.2%) | 15 (1.8%) |
| $800 to $999 | 152 (4.9%) | 36 (4.4%) |
| $1,000 to $1,499 | 184 (5.9%) | 209 (25.5%) |
| $1,500 to $1,999 | 499 (16.0%) | 168 (20.5%) |
| $2,000 to $2,499 | 608 (19.5%) | 228 (27.8%) |
| $2,500 to $2,999 | 458 (14.7%) | 122 (14.9%) |
| $3,000 or more | 522 (16.7%) | 9 (1.1%) |
| Total | 3,124 (100.0%) | 821 (100.0%) |
Physical Housing Characteristics in Vincent
Housing Structures in Vincent
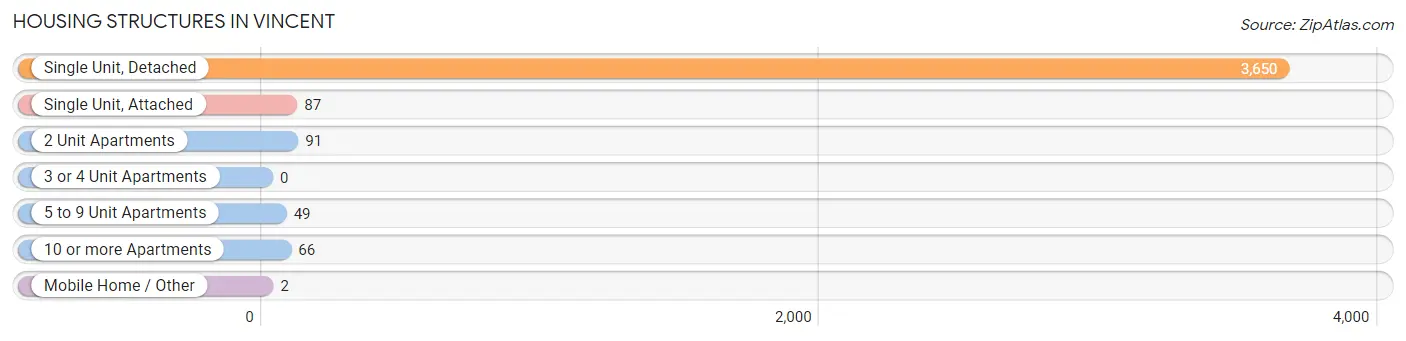
| Structure Type | # Housing Units | % Housing Units |
| Single Unit, Detached | 3,650 | 92.5% |
| Single Unit, Attached | 87 | 2.2% |
| 2 Unit Apartments | 91 | 2.3% |
| 3 or 4 Unit Apartments | 0 | 0.0% |
| 5 to 9 Unit Apartments | 49 | 1.2% |
| 10 or more Apartments | 66 | 1.7% |
| Mobile Home / Other | 2 | 0.1% |
| Total | 3,945 | 100.0% |
Housing Structures by Occupancy in Vincent
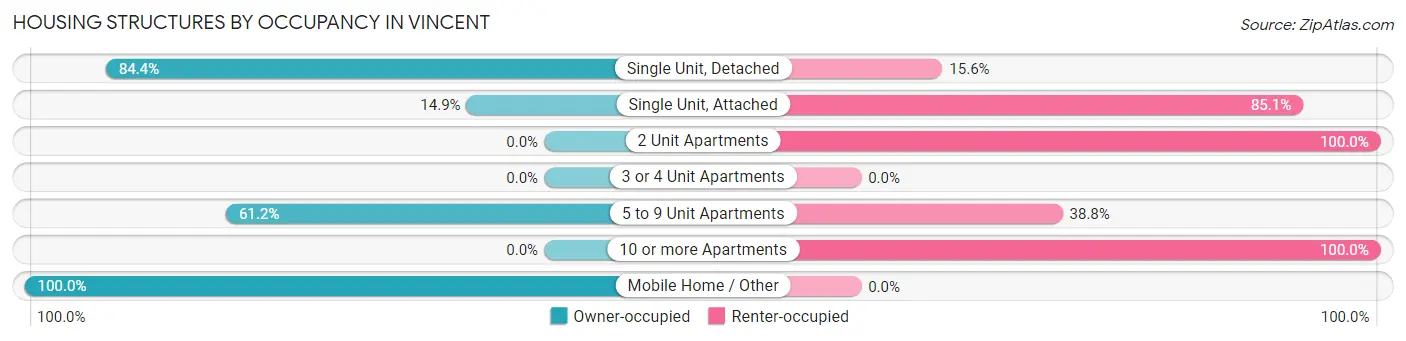
| Structure Type | Owner-occupied | Renter-occupied |
| Single Unit, Detached | 3,079 (84.4%) | 571 (15.6%) |
| Single Unit, Attached | 13 (14.9%) | 74 (85.1%) |
| 2 Unit Apartments | 0 (0.0%) | 91 (100.0%) |
| 3 or 4 Unit Apartments | 0 (0.0%) | 0 (0.0%) |
| 5 to 9 Unit Apartments | 30 (61.2%) | 19 (38.8%) |
| 10 or more Apartments | 0 (0.0%) | 66 (100.0%) |
| Mobile Home / Other | 2 (100.0%) | 0 (0.0%) |
| Total | 3,124 (79.2%) | 821 (20.8%) |
Housing Structures by Number of Rooms in Vincent
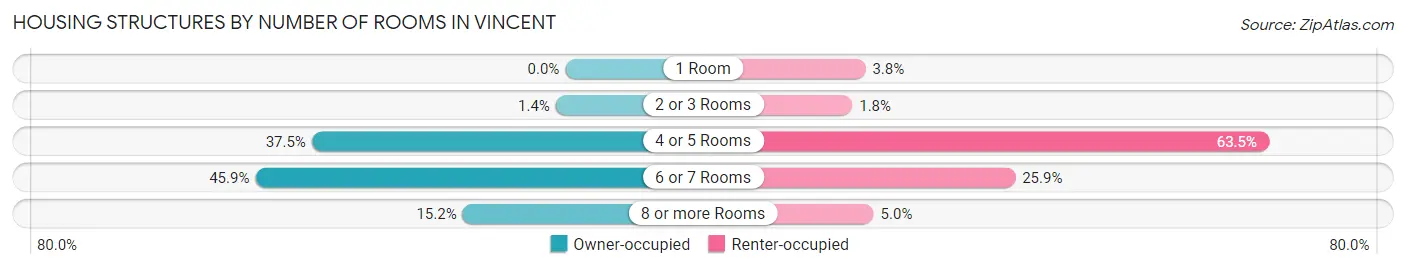
| Number of Rooms | Owner-occupied | Renter-occupied |
| 1 Room | 0 (0.0%) | 31 (3.8%) |
| 2 or 3 Rooms | 44 (1.4%) | 15 (1.8%) |
| 4 or 5 Rooms | 1,172 (37.5%) | 521 (63.5%) |
| 6 or 7 Rooms | 1,433 (45.9%) | 213 (25.9%) |
| 8 or more Rooms | 475 (15.2%) | 41 (5.0%) |
| Total | 3,124 (100.0%) | 821 (100.0%) |
Housing Structure by Heating Type in Vincent
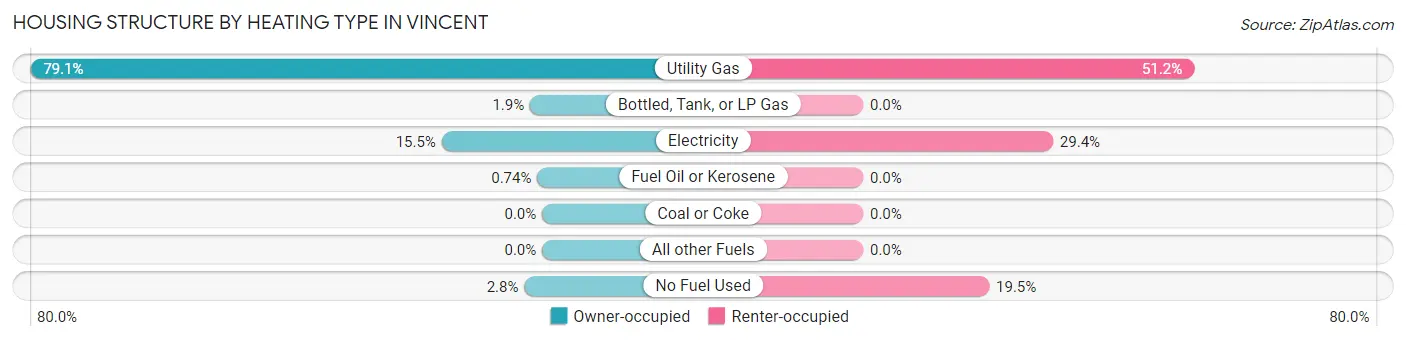
| Heating Type | Owner-occupied | Renter-occupied |
| Utility Gas | 2,472 (79.1%) | 420 (51.2%) |
| Bottled, Tank, or LP Gas | 58 (1.9%) | 0 (0.0%) |
| Electricity | 485 (15.5%) | 241 (29.3%) |
| Fuel Oil or Kerosene | 23 (0.7%) | 0 (0.0%) |
| Coal or Coke | 0 (0.0%) | 0 (0.0%) |
| All other Fuels | 0 (0.0%) | 0 (0.0%) |
| No Fuel Used | 86 (2.8%) | 160 (19.5%) |
| Total | 3,124 (100.0%) | 821 (100.0%) |
Household Vehicle Usage in Vincent
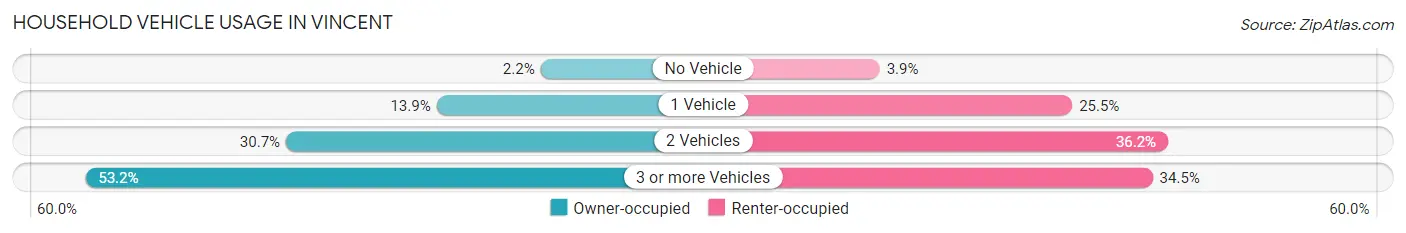
| Vehicles per Household | Owner-occupied | Renter-occupied |
| No Vehicle | 69 (2.2%) | 32 (3.9%) |
| 1 Vehicle | 433 (13.9%) | 209 (25.5%) |
| 2 Vehicles | 960 (30.7%) | 297 (36.2%) |
| 3 or more Vehicles | 1,662 (53.2%) | 283 (34.5%) |
| Total | 3,124 (100.0%) | 821 (100.0%) |
Real Estate & Mortgages in Vincent
Real Estate and Mortgage Overview in Vincent
| Characteristic | Without Mortgage | With Mortgage |
| Housing Units | 817 | 2,307 |
| Median Property Value | $537,500 | $580,300 |
| Median Household Income | $85,250 | $730 |
| Monthly Housing Costs | $522 | $514 |
| Real Estate Taxes | $3,004 | $36 |
Property Value by Mortgage Status in Vincent
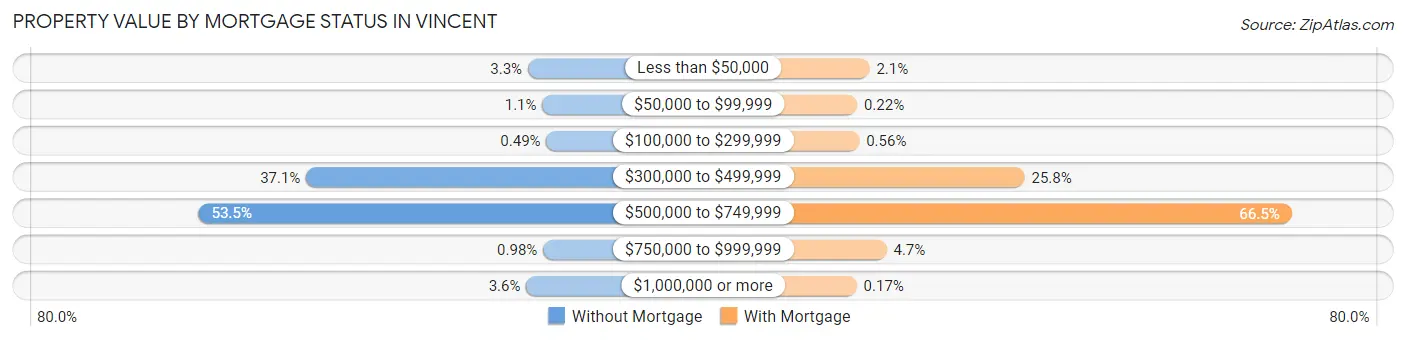
| Property Value | Without Mortgage | With Mortgage |
| Less than $50,000 | 27 (3.3%) | 49 (2.1%) |
| $50,000 to $99,999 | 9 (1.1%) | 5 (0.2%) |
| $100,000 to $299,999 | 4 (0.5%) | 13 (0.6%) |
| $300,000 to $499,999 | 303 (37.1%) | 594 (25.8%) |
| $500,000 to $749,999 | 437 (53.5%) | 1,533 (66.4%) |
| $750,000 to $999,999 | 8 (1.0%) | 109 (4.7%) |
| $1,000,000 or more | 29 (3.5%) | 4 (0.2%) |
| Total | 817 (100.0%) | 2,307 (100.0%) |
Household Income by Mortgage Status in Vincent
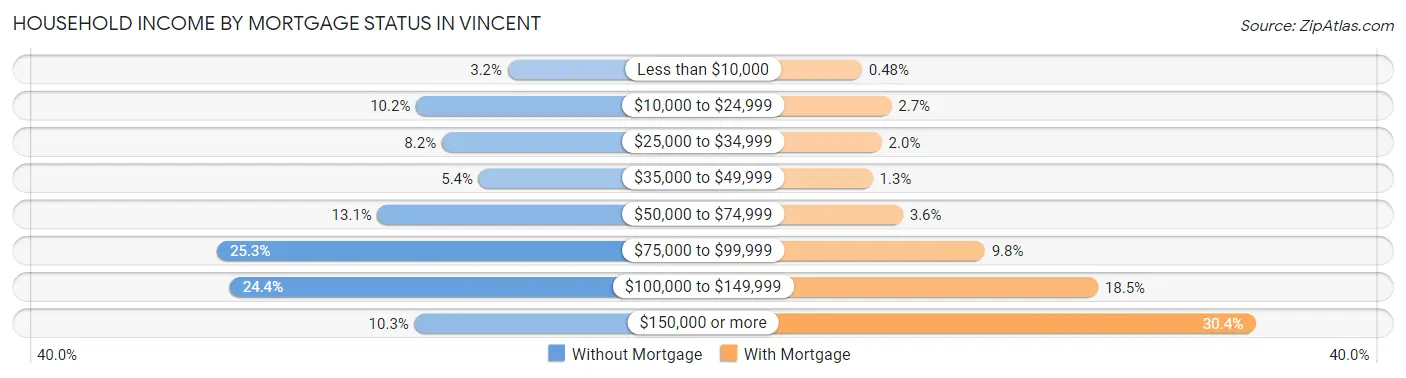
| Household Income | Without Mortgage | With Mortgage |
| Less than $10,000 | 26 (3.2%) | 11 (0.5%) |
| $10,000 to $24,999 | 83 (10.2%) | 63 (2.7%) |
| $25,000 to $34,999 | 67 (8.2%) | 46 (2.0%) |
| $35,000 to $49,999 | 44 (5.4%) | 30 (1.3%) |
| $50,000 to $74,999 | 107 (13.1%) | 83 (3.6%) |
| $75,000 to $99,999 | 207 (25.3%) | 227 (9.8%) |
| $100,000 to $149,999 | 199 (24.4%) | 426 (18.5%) |
| $150,000 or more | 84 (10.3%) | 702 (30.4%) |
| Total | 817 (100.0%) | 2,307 (100.0%) |
Property Value to Household Income Ratio in Vincent
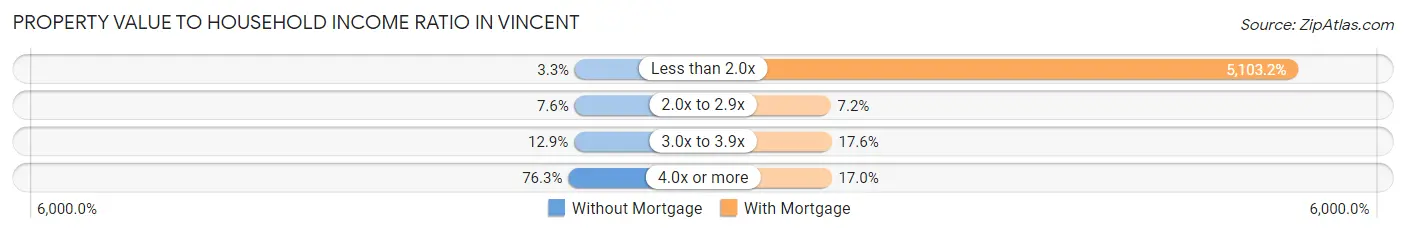
| Value-to-Income Ratio | Without Mortgage | With Mortgage |
| Less than 2.0x | 27 (3.3%) | 117,731 (5,103.2%) |
| 2.0x to 2.9x | 62 (7.6%) | 167 (7.2%) |
| 3.0x to 3.9x | 105 (12.9%) | 405 (17.6%) |
| 4.0x or more | 623 (76.2%) | 392 (17.0%) |
| Total | 817 (100.0%) | 2,307 (100.0%) |
Real Estate Taxes by Mortgage Status in Vincent
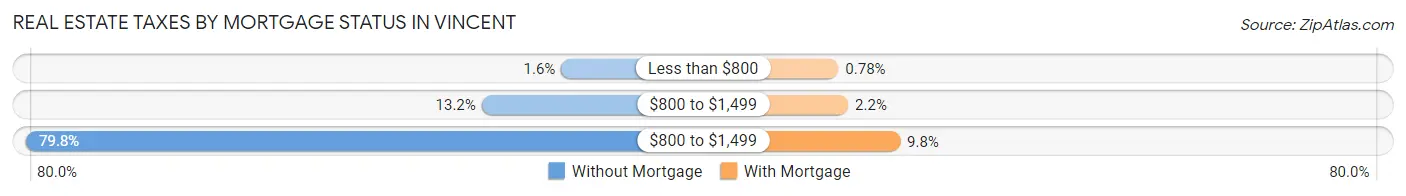
| Property Taxes | Without Mortgage | With Mortgage |
| Less than $800 | 13 (1.6%) | 18 (0.8%) |
| $800 to $1,499 | 108 (13.2%) | 51 (2.2%) |
| $800 to $1,499 | 652 (79.8%) | 226 (9.8%) |
| Total | 817 (100.0%) | 2,307 (100.0%) |
Health & Disability in Vincent
Health Insurance Coverage by Age in Vincent
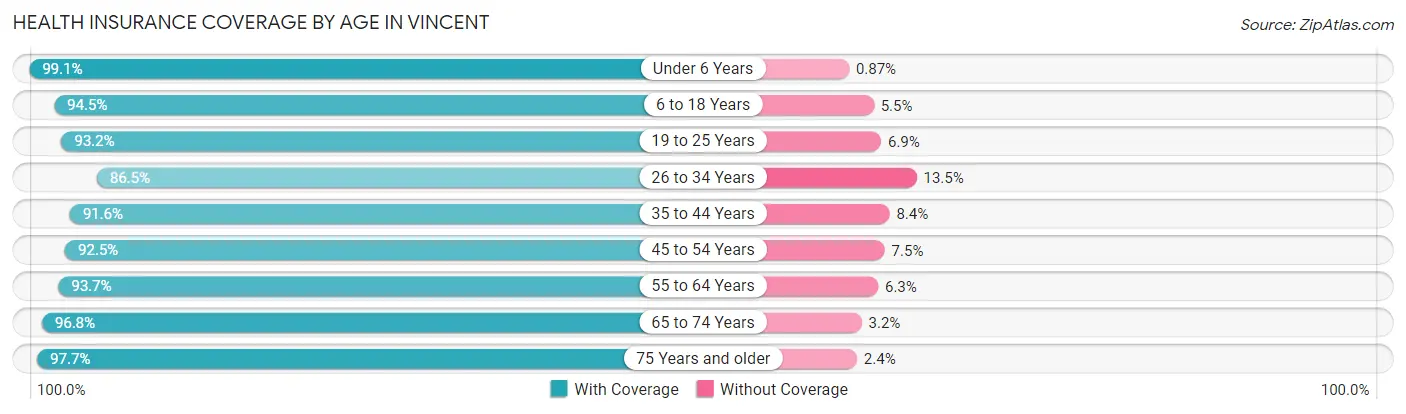
| Age Bracket | With Coverage | Without Coverage |
| Under 6 Years | 1,031 (99.1%) | 9 (0.9%) |
| 6 to 18 Years | 2,305 (94.5%) | 134 (5.5%) |
| 19 to 25 Years | 1,387 (93.1%) | 102 (6.9%) |
| 26 to 34 Years | 1,889 (86.5%) | 294 (13.5%) |
| 35 to 44 Years | 1,772 (91.6%) | 163 (8.4%) |
| 45 to 54 Years | 2,087 (92.5%) | 170 (7.5%) |
| 55 to 64 Years | 1,834 (93.7%) | 123 (6.3%) |
| 65 to 74 Years | 1,234 (96.8%) | 41 (3.2%) |
| 75 Years and older | 665 (97.7%) | 16 (2.4%) |
| Total | 14,204 (93.1%) | 1,052 (6.9%) |
Health Insurance Coverage by Citizenship Status in Vincent
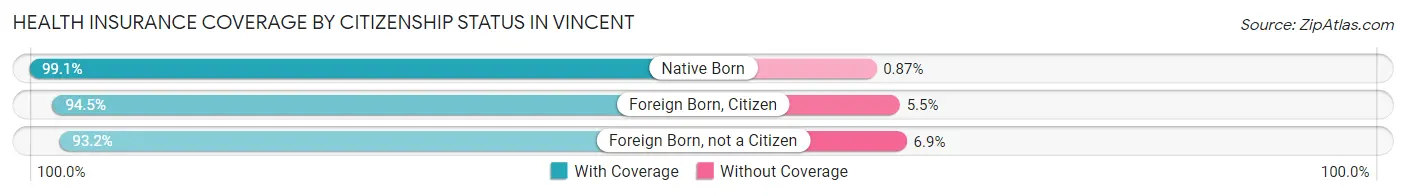
| Citizenship Status | With Coverage | Without Coverage |
| Native Born | 1,031 (99.1%) | 9 (0.9%) |
| Foreign Born, Citizen | 2,305 (94.5%) | 134 (5.5%) |
| Foreign Born, not a Citizen | 1,387 (93.1%) | 102 (6.9%) |
Health Insurance Coverage by Household Income in Vincent
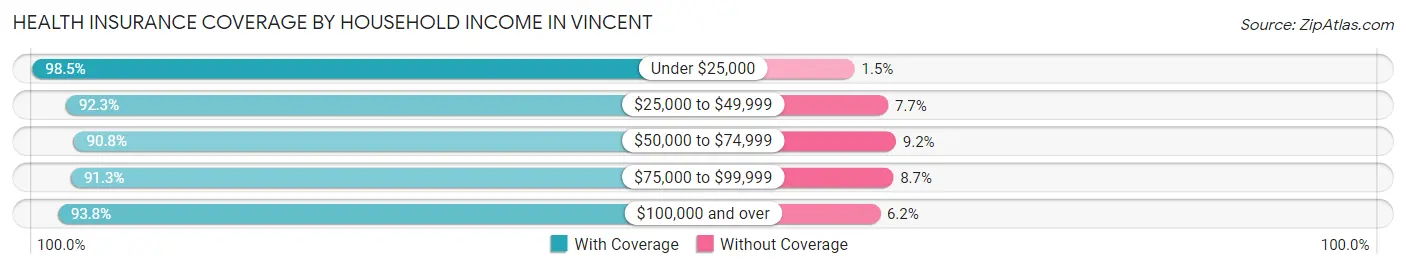
| Household Income | With Coverage | Without Coverage |
| Under $25,000 | 811 (98.5%) | 12 (1.5%) |
| $25,000 to $49,999 | 1,086 (92.3%) | 91 (7.7%) |
| $50,000 to $74,999 | 1,640 (90.8%) | 166 (9.2%) |
| $75,000 to $99,999 | 2,655 (91.3%) | 253 (8.7%) |
| $100,000 and over | 7,987 (93.8%) | 530 (6.2%) |
Public vs Private Health Insurance Coverage by Age in Vincent
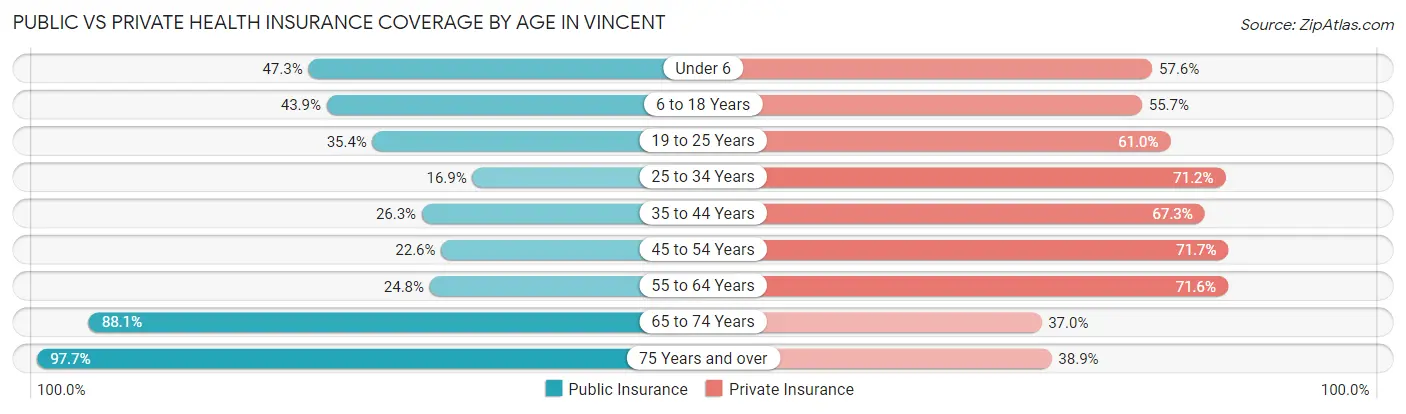
| Age Bracket | Public Insurance | Private Insurance |
| Under 6 | 492 (47.3%) | 599 (57.6%) |
| 6 to 18 Years | 1,071 (43.9%) | 1,358 (55.7%) |
| 19 to 25 Years | 527 (35.4%) | 908 (61.0%) |
| 25 to 34 Years | 368 (16.9%) | 1,554 (71.2%) |
| 35 to 44 Years | 508 (26.3%) | 1,303 (67.3%) |
| 45 to 54 Years | 511 (22.6%) | 1,619 (71.7%) |
| 55 to 64 Years | 485 (24.8%) | 1,402 (71.6%) |
| 65 to 74 Years | 1,123 (88.1%) | 472 (37.0%) |
| 75 Years and over | 665 (97.7%) | 265 (38.9%) |
| Total | 5,750 (37.7%) | 9,480 (62.1%) |
Disability Status by Sex by Age in Vincent
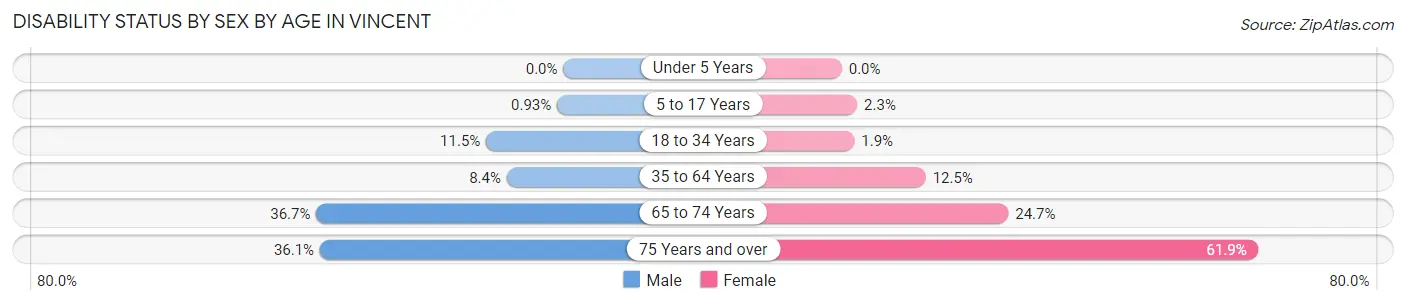
| Age Bracket | Male | Female |
| Under 5 Years | 0 (0.0%) | 0 (0.0%) |
| 5 to 17 Years | 12 (0.9%) | 26 (2.3%) |
| 18 to 34 Years | 249 (11.5%) | 31 (1.9%) |
| 35 to 64 Years | 242 (8.4%) | 407 (12.5%) |
| 65 to 74 Years | 208 (36.7%) | 175 (24.7%) |
| 75 Years and over | 120 (36.1%) | 216 (61.9%) |
Disability Class by Sex by Age in Vincent
Disability Class: Hearing Difficulty
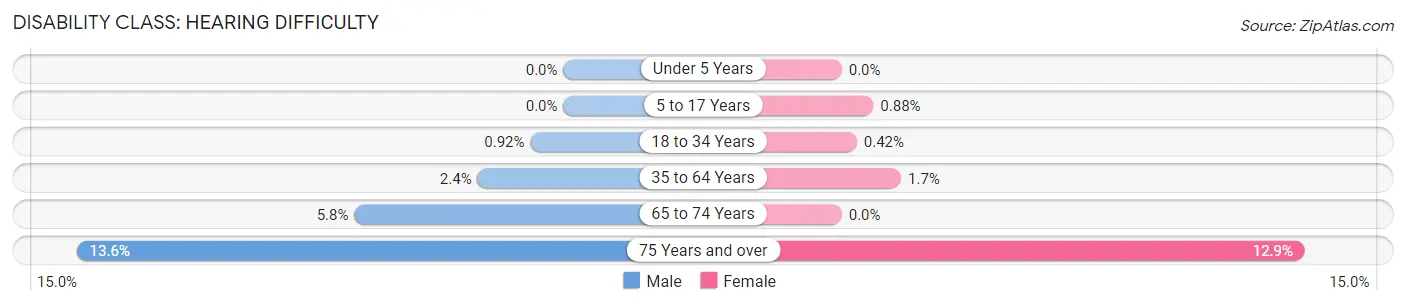
| Age Bracket | Male | Female |
| Under 5 Years | 0 (0.0%) | 0 (0.0%) |
| 5 to 17 Years | 0 (0.0%) | 10 (0.9%) |
| 18 to 34 Years | 20 (0.9%) | 7 (0.4%) |
| 35 to 64 Years | 69 (2.4%) | 54 (1.7%) |
| 65 to 74 Years | 33 (5.8%) | 0 (0.0%) |
| 75 Years and over | 45 (13.6%) | 45 (12.9%) |
Disability Class: Vision Difficulty
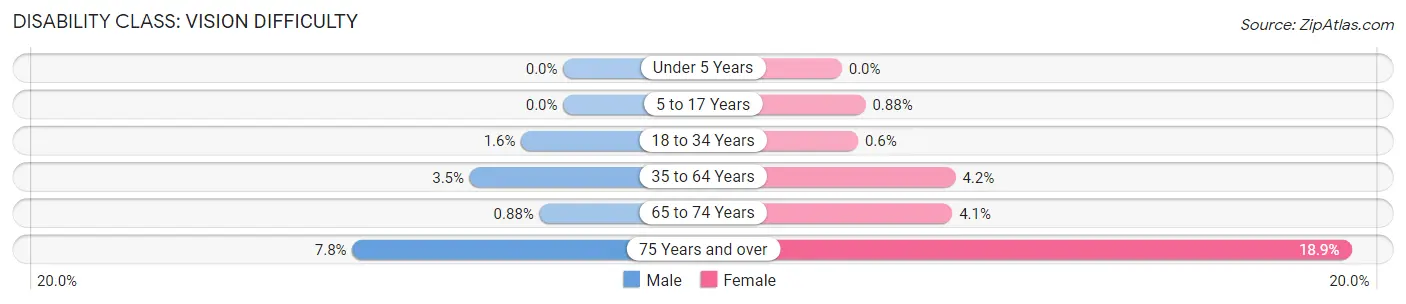
| Age Bracket | Male | Female |
| Under 5 Years | 0 (0.0%) | 0 (0.0%) |
| 5 to 17 Years | 0 (0.0%) | 10 (0.9%) |
| 18 to 34 Years | 34 (1.6%) | 10 (0.6%) |
| 35 to 64 Years | 100 (3.5%) | 138 (4.2%) |
| 65 to 74 Years | 5 (0.9%) | 29 (4.1%) |
| 75 Years and over | 26 (7.8%) | 66 (18.9%) |
Disability Class: Cognitive Difficulty
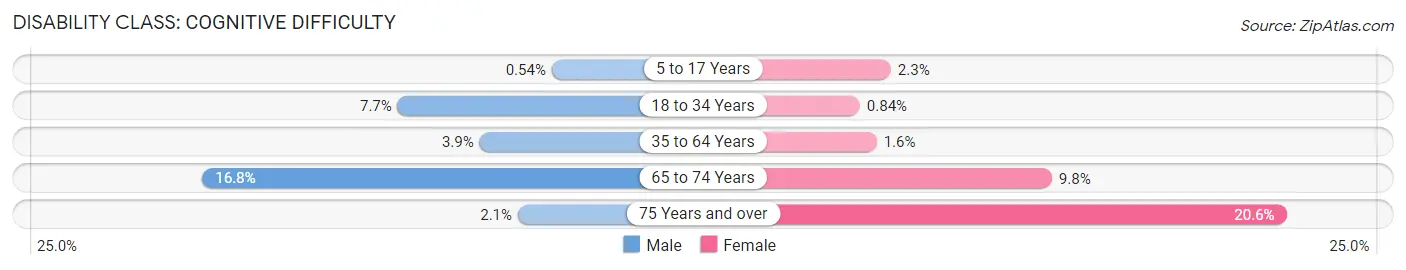
| Age Bracket | Male | Female |
| 5 to 17 Years | 7 (0.5%) | 26 (2.3%) |
| 18 to 34 Years | 167 (7.7%) | 14 (0.8%) |
| 35 to 64 Years | 112 (3.9%) | 53 (1.6%) |
| 65 to 74 Years | 95 (16.8%) | 69 (9.8%) |
| 75 Years and over | 7 (2.1%) | 72 (20.6%) |
Disability Class: Ambulatory Difficulty
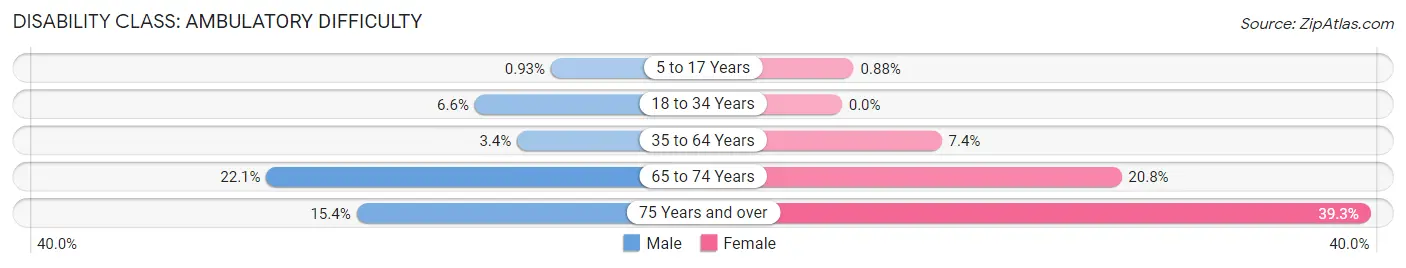
| Age Bracket | Male | Female |
| 5 to 17 Years | 12 (0.9%) | 10 (0.9%) |
| 18 to 34 Years | 143 (6.6%) | 0 (0.0%) |
| 35 to 64 Years | 99 (3.4%) | 242 (7.4%) |
| 65 to 74 Years | 125 (22.1%) | 147 (20.8%) |
| 75 Years and over | 51 (15.4%) | 137 (39.3%) |
Disability Class: Self-Care Difficulty
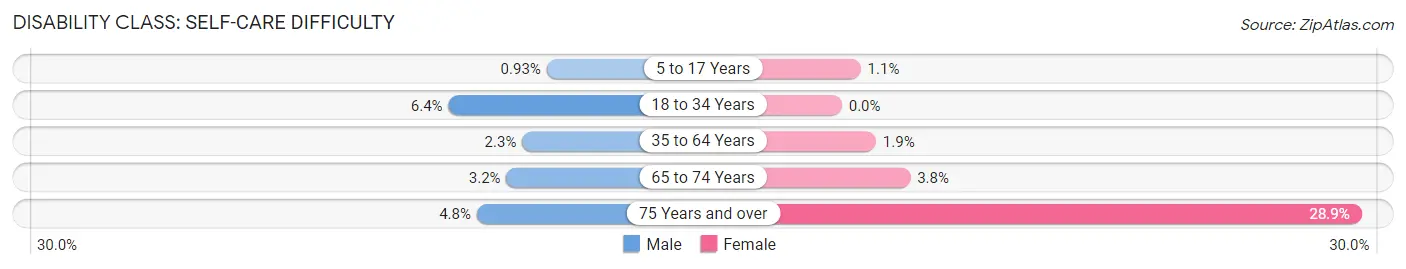
| Age Bracket | Male | Female |
| 5 to 17 Years | 12 (0.9%) | 12 (1.1%) |
| 18 to 34 Years | 139 (6.4%) | 0 (0.0%) |
| 35 to 64 Years | 66 (2.3%) | 62 (1.9%) |
| 65 to 74 Years | 18 (3.2%) | 27 (3.8%) |
| 75 Years and over | 16 (4.8%) | 101 (28.9%) |
Technology Access in Vincent
Computing Device Access in Vincent
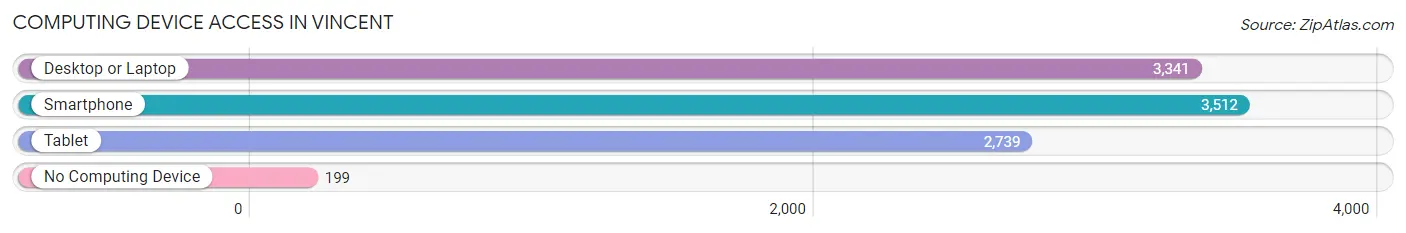
| Device Type | # Households | % Households |
| Desktop or Laptop | 3,341 | 84.7% |
| Smartphone | 3,512 | 89.0% |
| Tablet | 2,739 | 69.4% |
| No Computing Device | 199 | 5.0% |
| Total | 3,945 | 100.0% |
Internet Access in Vincent
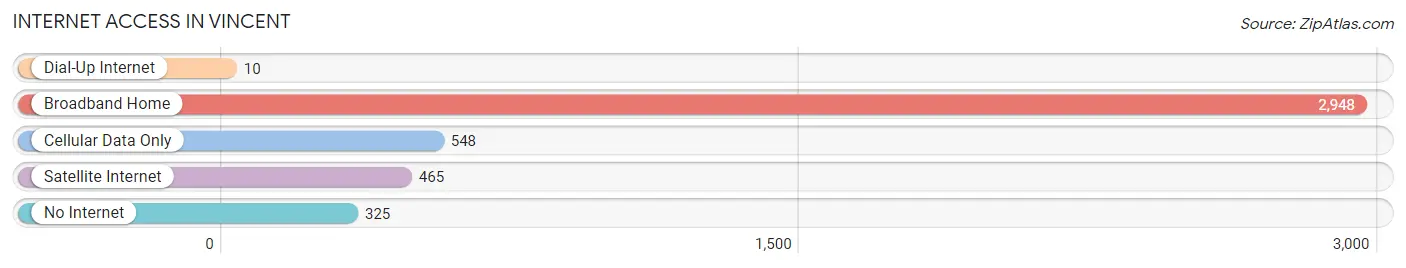
| Internet Type | # Households | % Households |
| Dial-Up Internet | 10 | 0.3% |
| Broadband Home | 2,948 | 74.7% |
| Cellular Data Only | 548 | 13.9% |
| Satellite Internet | 465 | 11.8% |
| No Internet | 325 | 8.2% |
| Total | 3,945 | 100.0% |
Vincent Summary
Vincent is a small unincorporated community located in the San Gabriel Valley of Los Angeles County, California. It is situated in the foothills of the San Gabriel Mountains, approximately 20 miles east of downtown Los Angeles. The community is bordered by the cities of Azusa, Covina, and West Covina.
History
The area now known as Vincent was originally inhabited by the Tongva people, who were the original inhabitants of the Los Angeles Basin. The area was later settled by Spanish missionaries in the late 1700s. The area was part of the Rancho La Puente land grant, which was granted to Antonio Maria Lugo in 1842. The area was later subdivided and sold off in the late 1800s.
The community of Vincent was established in the early 1900s. The community was named after Vincent Lugo, the son of Antonio Maria Lugo. The community was primarily an agricultural area, with citrus and walnut groves being the main crops. The area also had a few small businesses, including a general store and a post office.
Geography
Vincent is located in the San Gabriel Valley of Los Angeles County, California. It is situated in the foothills of the San Gabriel Mountains, approximately 20 miles east of downtown Los Angeles. The community is bordered by the cities of Azusa, Covina, and West Covina.
The area has a Mediterranean climate, with hot, dry summers and mild, wet winters. The average annual temperature is around 70 degrees Fahrenheit. The average annual precipitation is around 15 inches.
Economy
The economy of Vincent is primarily based on agriculture. The area is home to several citrus and walnut groves, as well as other crops. The area also has a few small businesses, including a general store and a post office.
Demographics
As of the 2010 census, the population of Vincent was 1,845. The racial makeup of the community was 57.3% White, 0.7% African American, 0.3% Native American, 0.9% Asian, 0.1% Pacific Islander, and 37.7% from other races. The median household income was $50,945. The per capita income was $20,945.
Conclusion
Vincent is a small unincorporated community located in the San Gabriel Valley of Los Angeles County, California. It is situated in the foothills of the San Gabriel Mountains, approximately 20 miles east of downtown Los Angeles. The community is bordered by the cities of Azusa, Covina, and West Covina. The economy of Vincent is primarily based on agriculture, with citrus and walnut groves being the main crops. As of the 2010 census, the population of Vincent was 1,845. The racial makeup of the community was 57.3% White, 0.7% African American, 0.3% Native American, 0.9% Asian, 0.1% Pacific Islander, and 37.7% from other races. The median household income was $50,945. The per capita income was $20,945.
Common Questions
What is Per Capita Income in Vincent?
Per Capita income in Vincent is $30,951.
What is the Median Family Income in Vincent?
Median Family Income in Vincent is $100,323.
What is the Median Household income in Vincent?
Median Household Income in Vincent is $97,417.
What is Income or Wage Gap in Vincent?
Income or Wage Gap in Vincent is 11.7%.
Women in Vincent earn 88.3 cents for every dollar earned by a man.
What is Inequality or Gini Index in Vincent?
Inequality or Gini Index in Vincent is 0.35.
What is the Total Population of Vincent?
Total Population of Vincent is 15,266.
What is the Total Male Population of Vincent?
Total Male Population of Vincent is 7,627.
What is the Total Female Population of Vincent?
Total Female Population of Vincent is 7,639.
What is the Ratio of Males per 100 Females in Vincent?
There are 99.84 Males per 100 Females in Vincent.
What is the Ratio of Females per 100 Males in Vincent?
There are 100.16 Females per 100 Males in Vincent.
What is the Median Population Age in Vincent?
Median Population Age in Vincent is 37.3 Years.
What is the Average Family Size in Vincent
Average Family Size in Vincent is 4.2 People.
What is the Average Household Size in Vincent
Average Household Size in Vincent is 3.9 People.
How Large is the Labor Force in Vincent?
There are 8,411 People in the Labor Forcein in Vincent.
What is the Percentage of People in the Labor Force in Vincent?
68.5% of People are in the Labor Force in Vincent.
What is the Unemployment Rate in Vincent?
Unemployment Rate in Vincent is 5.3%.