Cities with the Highest Percentage of Population Taking Public Transit to Work in Kentucky
RELATED REPORTS & OPTIONS
Public Transit
Kentucky
Compare Cities
Map of Cities with the Highest Percentage of Population Taking Public Transit to Work in Kentucky
0.0%
60.0%
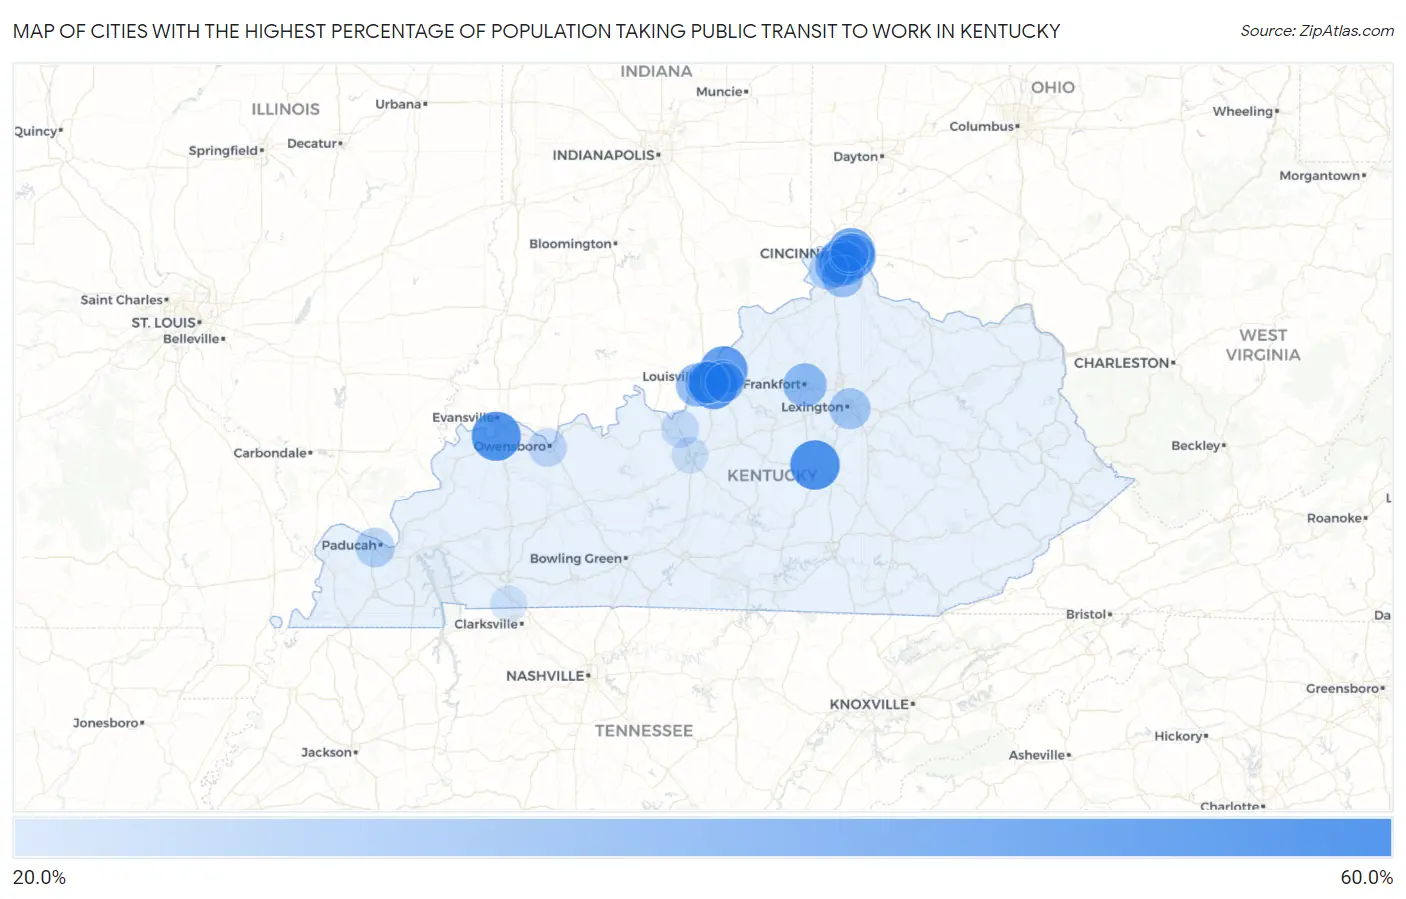
Cities with the Highest Percentage of Population Taking Public Transit to Work in Kentucky
| City | % Public Transit | vs State | vs National | |
| 1. | Danville | 59.1% | 37.6%(+21.5)#1 | 38.5%(+20.6)#197 |
| 2. | Henderson | 57.9% | 37.6%(+20.3)#2 | 38.5%(+19.4)#262 |
| 3. | West Buechel | 55.2% | 37.6%(+17.6)#3 | 38.5%(+16.7)#437 |
| 4. | Broeck Pointe | 53.5% | 37.6%(+15.9)#4 | 38.5%(+15.0)#562 |
| 5. | Dayton | 49.4% | 37.6%(+11.8)#5 | 38.5%(+10.9)#981 |
| 6. | Fort Thomas | 48.3% | 37.6%(+10.7)#6 | 38.5%(+9.80)#1,136 |
| 7. | Erlanger | 43.5% | 37.6%(+5.90)#7 | 38.5%(+5.00)#1,909 |
| 8. | Fort Mitchell | 41.0% | 37.6%(+3.40)#8 | 38.5%(+2.50)#2,347 |
| 9. | Frankfort | 40.0% | 37.6%(+2.40)#9 | 38.5%(+1.50)#2,537 |
| 10. | Covington | 39.9% | 37.6%(+2.30)#10 | 38.5%(+1.40)#2,552 |
| 11. | Shively | 39.6% | 37.6%(+2.00)#11 | 38.5%(+1.10)#2,613 |
| 12. | Parkway Village | 38.5% | 37.6%(+0.900)#12 | 38.5%(=0.000)#2,813 |
| 13. | Hurstbourne Acres | 37.4% | 37.6%(-0.200)#13 | 38.5%(-1.10)#2,961 |
| 14. | Independence | 35.9% | 37.6%(-1.70)#14 | 38.5%(-2.60)#3,169 |
| 15. | Louisville | 35.3% | 37.6%(-2.30)#15 | 38.5%(-3.20)#3,258 |
| 16. | Lexington | 33.7% | 37.6%(-3.90)#16 | 38.5%(-4.80)#3,487 |
| 17. | Florence | 29.8% | 37.6%(-7.80)#17 | 38.5%(-8.70)#3,892 |
| 18. | Paducah | 29.0% | 37.6%(-8.60)#18 | 38.5%(-9.50)#3,960 |
| 19. | Newport | 28.7% | 37.6%(-8.90)#19 | 38.5%(-9.80)#4,002 |
| 20. | Jeffersontown | 26.9% | 37.6%(-10.7)#20 | 38.5%(-11.6)#4,129 |
| 21. | Bellevue | 26.7% | 37.6%(-10.9)#21 | 38.5%(-11.8)#4,154 |
| 22. | Owensboro | 25.8% | 37.6%(-11.8)#22 | 38.5%(-12.7)#4,197 |
| 23. | Fort Knox | 23.9% | 37.6%(-13.7)#23 | 38.5%(-14.6)#4,307 |
| 24. | Elizabethtown | 21.9% | 37.6%(-15.7)#24 | 38.5%(-16.6)#4,421 |
| 25. | Fort Campbell North | 20.9% | 37.6%(-16.7)#25 | 38.5%(-17.6)#4,461 |
Common Questions
What are the Top 10 Cities with the Highest Percentage of Population Taking Public Transit to Work in Kentucky?
Top 10 Cities with the Highest Percentage of Population Taking Public Transit to Work in Kentucky are:
#1
59.1%
#2
57.9%
#3
55.2%
#4
53.5%
#5
49.4%
#6
48.3%
#7
43.5%
#8
41.0%
#9
40.0%
#10
39.9%
What city has the Highest Percentage of Population Taking Public Transit to Work in Kentucky?
Danville has the Highest Percentage of Population Taking Public Transit to Work in Kentucky with 59.1%.
What is the Percentage of Population Taking Public Transit to Work in the State of Kentucky?
Percentage of Population Taking Public Transit to Work in Kentucky is 37.6%.
What is the Percentage of Population Taking Public Transit to Work in the United States?
Percentage of Population Taking Public Transit to Work in the United States is 38.5%.