Camarillo, CA Map & Demographics
Camarillo Map
Camarillo Overview
$52,817
PER CAPITA INCOME
$126,566
AVG FAMILY INCOME
$105,141
AVG HOUSEHOLD INCOME
36.9%
WAGE / INCOME GAP [ % ]
63.1¢/ $1
WAGE / INCOME GAP [ $ ]
$7,526
FAMILY INCOME DEFICIT
0.45
INEQUALITY / GINI INDEX
70,622
TOTAL POPULATION
34,271
MALE POPULATION
36,351
FEMALE POPULATION
94.28
MALES / 100 FEMALES
106.07
FEMALES / 100 MALES
40.3
MEDIAN AGE
3.2
AVG FAMILY SIZE
2.7
AVG HOUSEHOLD SIZE
35,652
LABOR FORCE [ PEOPLE ]
61.6%
PERCENT IN LABOR FORCE
4.8%
UNEMPLOYMENT RATE
Camarillo Area Codes
Income in Camarillo
Income Overview in Camarillo
Per Capita Income in Camarillo is $52,817, while median incomes of families and households are $126,566 and $105,141 respectively.
| Characteristic | Number | Measure |
| Per Capita Income | 70,622 | $52,817 |
| Median Family Income | 17,806 | $126,566 |
| Mean Family Income | 17,806 | $160,860 |
| Median Household Income | 25,939 | $105,141 |
| Mean Household Income | 25,939 | $140,317 |
| Income Deficit | 17,806 | $7,526 |
| Wage / Income Gap (%) | 70,622 | 36.93% |
| Wage / Income Gap ($) | 70,622 | 63.07¢ per $1 |
| Gini / Inequality Index | 70,622 | 0.45 |
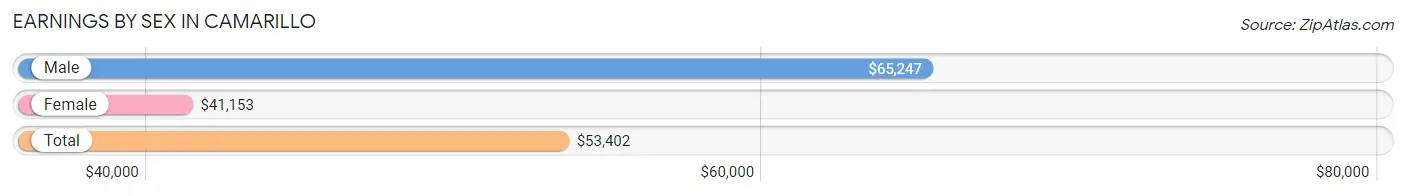
Earnings by Sex in Camarillo
Average Earnings in Camarillo are $53,402, $65,247 for men and $41,153 for women, a difference of 36.9%.
| Sex | Number | Average Earnings |
| Male | 19,304 (52.1%) | $65,247 |
| Female | 17,712 (47.8%) | $41,153 |
| Total | 37,016 (100.0%) | $53,402 |
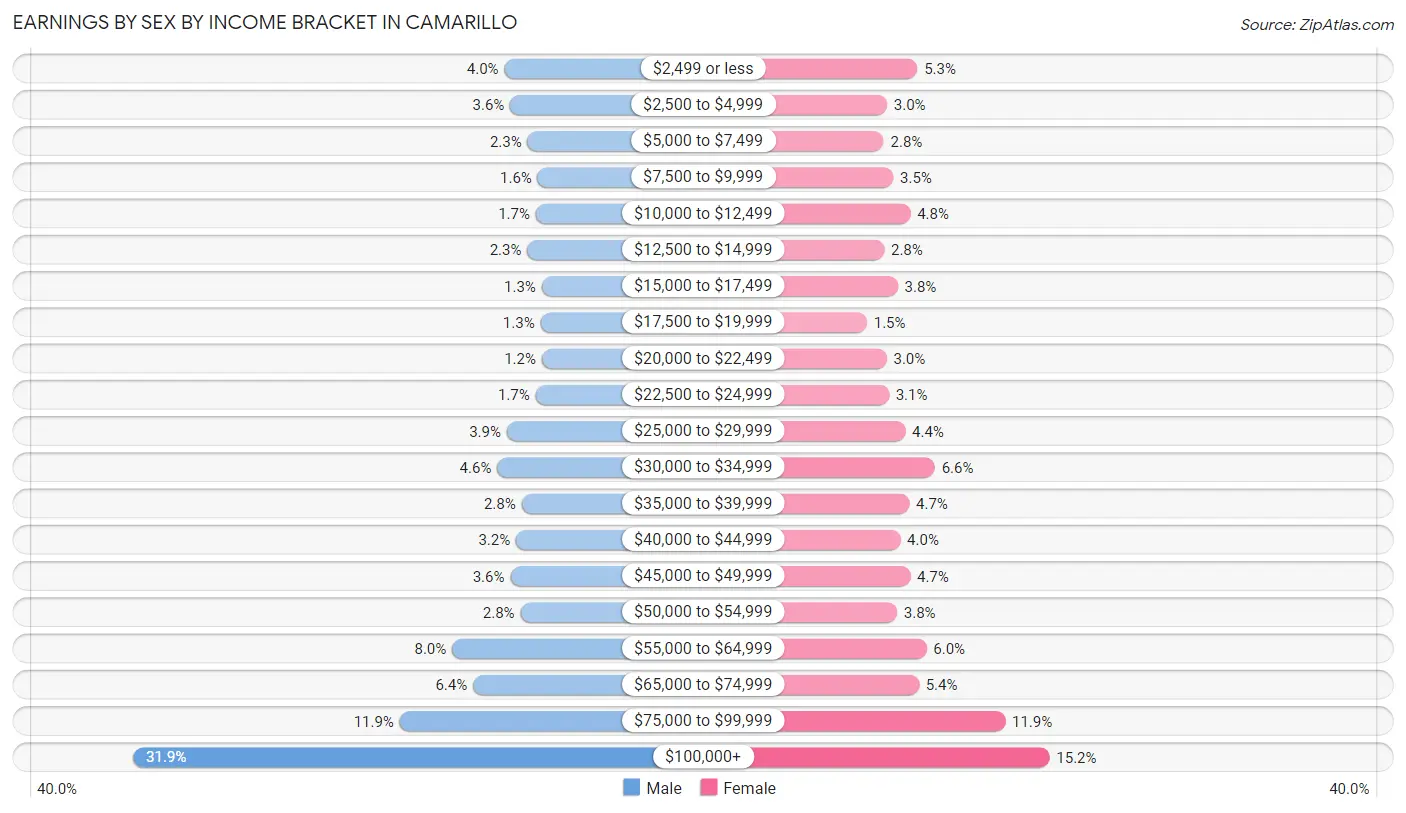
Earnings by Sex by Income Bracket in Camarillo
The most common earnings brackets in Camarillo are $100,000+ for men (6,153 | 31.9%) and $100,000+ for women (2,689 | 15.2%).
| Income | Male | Female |
| $2,499 or less | 779 (4.0%) | 936 (5.3%) |
| $2,500 to $4,999 | 696 (3.6%) | 532 (3.0%) |
| $5,000 to $7,499 | 446 (2.3%) | 488 (2.8%) |
| $7,500 to $9,999 | 300 (1.5%) | 615 (3.5%) |
| $10,000 to $12,499 | 327 (1.7%) | 842 (4.8%) |
| $12,500 to $14,999 | 450 (2.3%) | 495 (2.8%) |
| $15,000 to $17,499 | 242 (1.3%) | 674 (3.8%) |
| $17,500 to $19,999 | 258 (1.3%) | 266 (1.5%) |
| $20,000 to $22,499 | 239 (1.2%) | 528 (3.0%) |
| $22,500 to $24,999 | 330 (1.7%) | 557 (3.1%) |
| $25,000 to $29,999 | 745 (3.9%) | 774 (4.4%) |
| $30,000 to $34,999 | 884 (4.6%) | 1,167 (6.6%) |
| $35,000 to $39,999 | 533 (2.8%) | 827 (4.7%) |
| $40,000 to $44,999 | 612 (3.2%) | 708 (4.0%) |
| $45,000 to $49,999 | 694 (3.6%) | 840 (4.7%) |
| $50,000 to $54,999 | 549 (2.8%) | 664 (3.7%) |
| $55,000 to $64,999 | 1,537 (8.0%) | 1,055 (6.0%) |
| $65,000 to $74,999 | 1,234 (6.4%) | 955 (5.4%) |
| $75,000 to $99,999 | 2,296 (11.9%) | 2,100 (11.9%) |
| $100,000+ | 6,153 (31.9%) | 2,689 (15.2%) |
| Total | 19,304 (100.0%) | 17,712 (100.0%) |
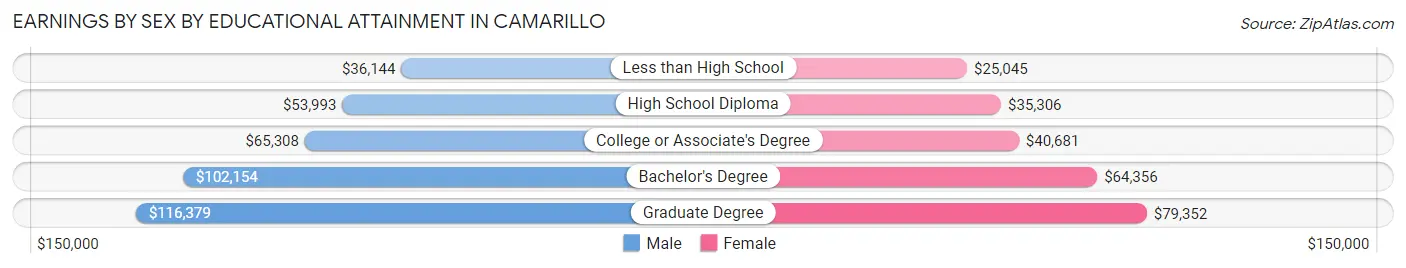
Earnings by Sex by Educational Attainment in Camarillo
Average earnings in Camarillo are $74,519 for men and $47,391 for women, a difference of 36.4%. Men with an educational attainment of graduate degree enjoy the highest average annual earnings of $116,379, while those with less than high school education earn the least with $36,144. Women with an educational attainment of graduate degree earn the most with the average annual earnings of $79,352, while those with less than high school education have the smallest earnings of $25,045.
| Educational Attainment | Male Income | Female Income |
| Less than High School | $36,144 | $25,045 |
| High School Diploma | $53,993 | $35,306 |
| College or Associate's Degree | $65,308 | $40,681 |
| Bachelor's Degree | $102,154 | $64,356 |
| Graduate Degree | $116,379 | $79,352 |
| Total | $74,519 | $47,391 |
Family Income in Camarillo
Family Income Brackets in Camarillo
According to the Camarillo family income data, there are 4,149 families falling into the $200,000+ income range, which is the most common income bracket and makes up 23.3% of all families. Conversely, the $10,000 to $14,999 income bracket is the least frequent group with only 160 families (0.9%) belonging to this category.
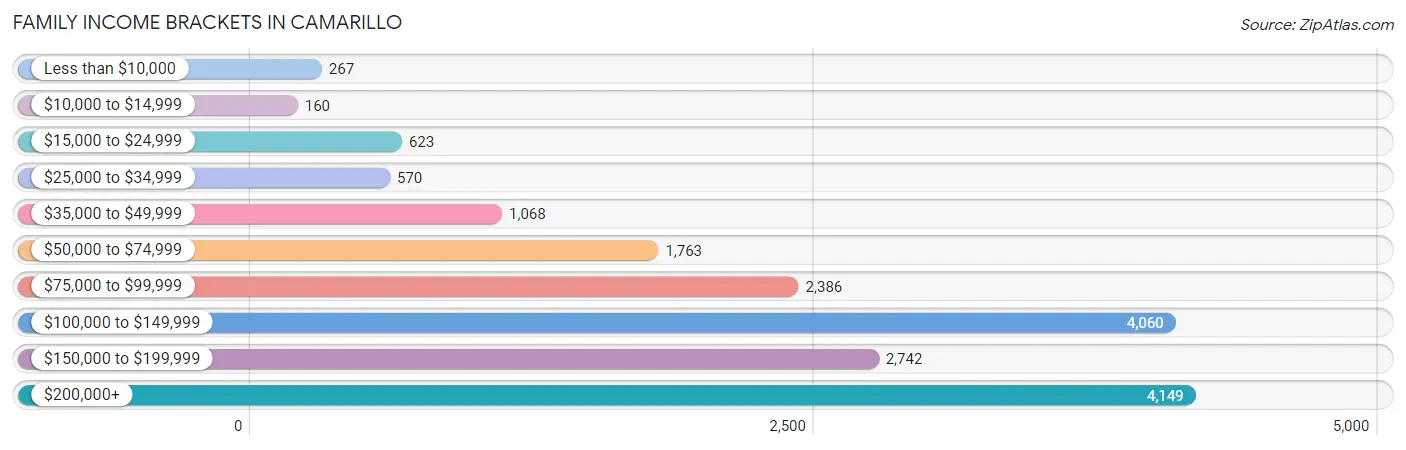
| Income Bracket | # Families | % Families |
| Less than $10,000 | 267 | 1.5% |
| $10,000 to $14,999 | 160 | 0.9% |
| $15,000 to $24,999 | 623 | 3.5% |
| $25,000 to $34,999 | 570 | 3.2% |
| $35,000 to $49,999 | 1,068 | 6.0% |
| $50,000 to $74,999 | 1,763 | 9.9% |
| $75,000 to $99,999 | 2,386 | 13.4% |
| $100,000 to $149,999 | 4,060 | 22.8% |
| $150,000 to $199,999 | 2,742 | 15.4% |
| $200,000+ | 4,149 | 23.3% |
Family Income by Famaliy Size in Camarillo
7+ person families (310 | 1.7%) account for the highest median family income in Camarillo with $198,229 per family, while 2-person families (8,598 | 48.3%) have the highest median income of $53,194 per family member.
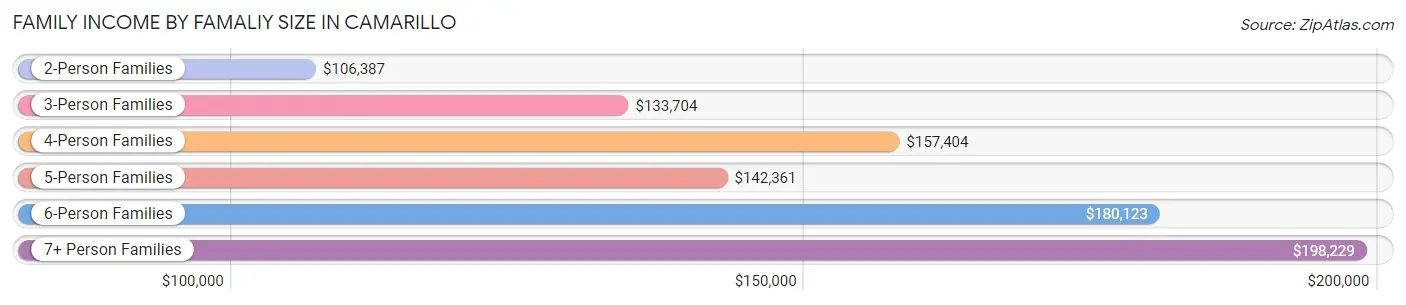
| Income Bracket | # Families | Median Income |
| 2-Person Families | 8,598 (48.3%) | $106,387 |
| 3-Person Families | 3,679 (20.7%) | $133,704 |
| 4-Person Families | 3,107 (17.4%) | $157,404 |
| 5-Person Families | 1,556 (8.7%) | $142,361 |
| 6-Person Families | 556 (3.1%) | $180,123 |
| 7+ Person Families | 310 (1.7%) | $198,229 |
| Total | 17,806 (100.0%) | $126,566 |
Family Income by Number of Earners in Camarillo
The median family income in Camarillo is $126,566, with families comprising 3+ earners (2,573) having the highest median family income of $184,153, while families with no earners (3,144) have the lowest median family income of $86,591, accounting for 14.4% and 17.7% of families, respectively.
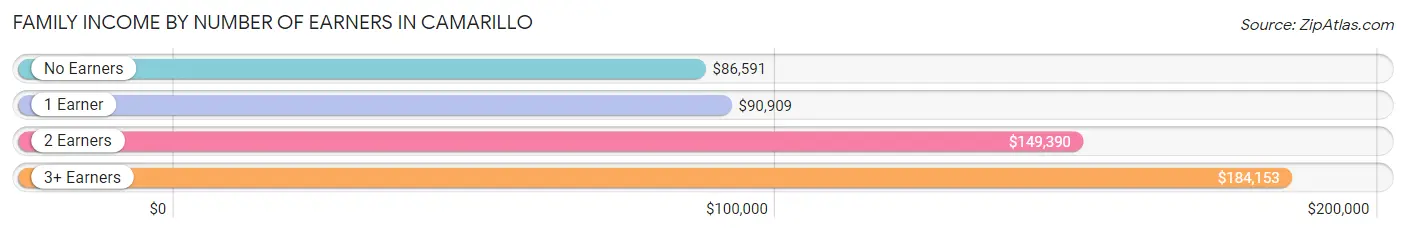
| Number of Earners | # Families | Median Income |
| No Earners | 3,144 (17.7%) | $86,591 |
| 1 Earner | 5,249 (29.5%) | $90,909 |
| 2 Earners | 6,840 (38.4%) | $149,390 |
| 3+ Earners | 2,573 (14.4%) | $184,153 |
| Total | 17,806 (100.0%) | $126,566 |
Household Income in Camarillo
Household Income Brackets in Camarillo
With 5,162 households falling in the category, the $100,000 to $149,999 income range is the most frequent in Camarillo, accounting for 19.9% of all households. In contrast, only 648 households (2.5%) fall into the $10,000 to $14,999 income bracket, making it the least populous group.
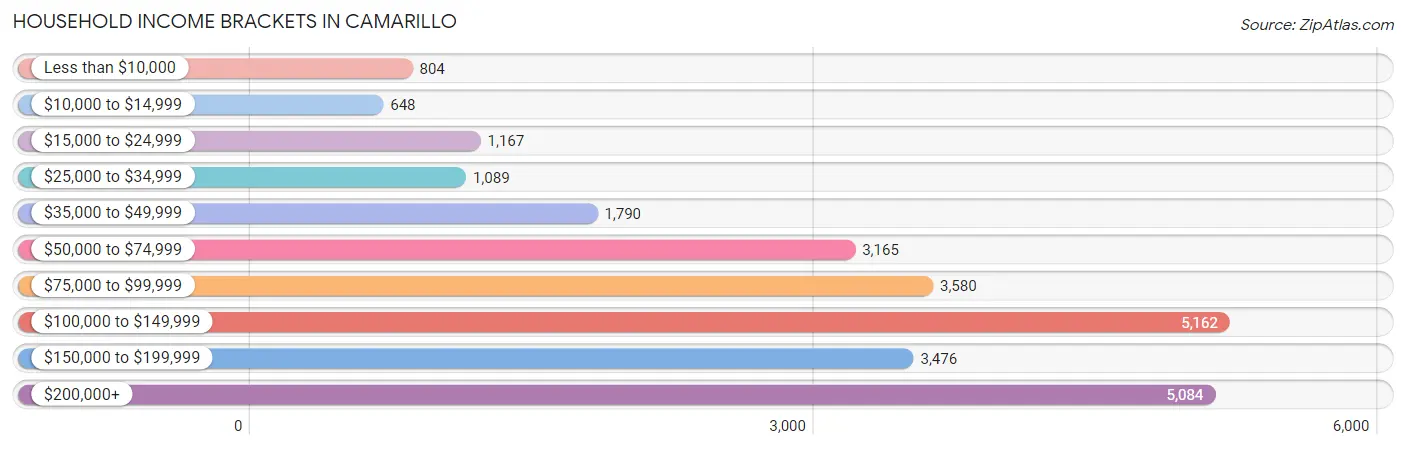
| Income Bracket | # Households | % Households |
| Less than $10,000 | 804 | 3.1% |
| $10,000 to $14,999 | 648 | 2.5% |
| $15,000 to $24,999 | 1,167 | 4.5% |
| $25,000 to $34,999 | 1,089 | 4.2% |
| $35,000 to $49,999 | 1,790 | 6.9% |
| $50,000 to $74,999 | 3,165 | 12.2% |
| $75,000 to $99,999 | 3,580 | 13.8% |
| $100,000 to $149,999 | 5,162 | 19.9% |
| $150,000 to $199,999 | 3,476 | 13.4% |
| $200,000+ | 5,084 | 19.6% |
Household Income by Householder Age in Camarillo
The median household income in Camarillo is $105,141, with the highest median household income of $141,295 found in the 45 to 64 years age bracket for the primary householder. A total of 8,903 households (34.3%) fall into this category. Meanwhile, the 15 to 24 years age bracket for the primary householder has the lowest median household income of $43,229, with 557 households (2.1%) in this group.
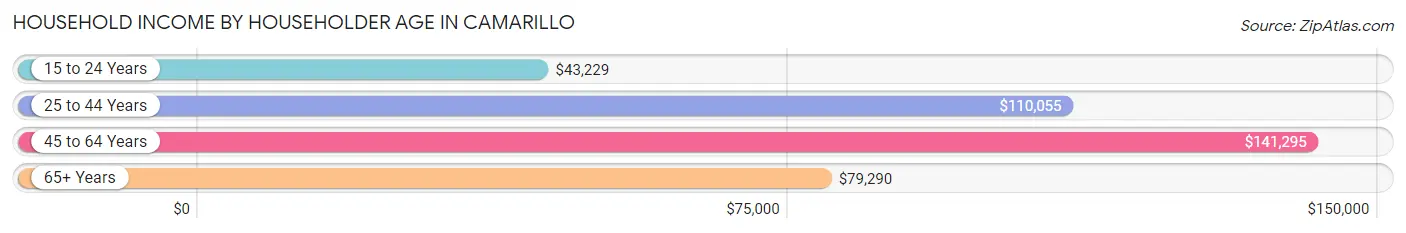
| Income Bracket | # Households | Median Income |
| 15 to 24 Years | 557 (2.1%) | $43,229 |
| 25 to 44 Years | 7,366 (28.4%) | $110,055 |
| 45 to 64 Years | 8,903 (34.3%) | $141,295 |
| 65+ Years | 9,113 (35.1%) | $79,290 |
| Total | 25,939 (100.0%) | $105,141 |
Poverty in Camarillo
Income Below Poverty by Sex and Age in Camarillo
With 7.1% poverty level for males and 7.8% for females among the residents of Camarillo, 18 to 24 year old males and 15 year old females are the most vulnerable to poverty, with 313 males (11.8%) and 73 females (19.9%) in their respective age groups living below the poverty level.
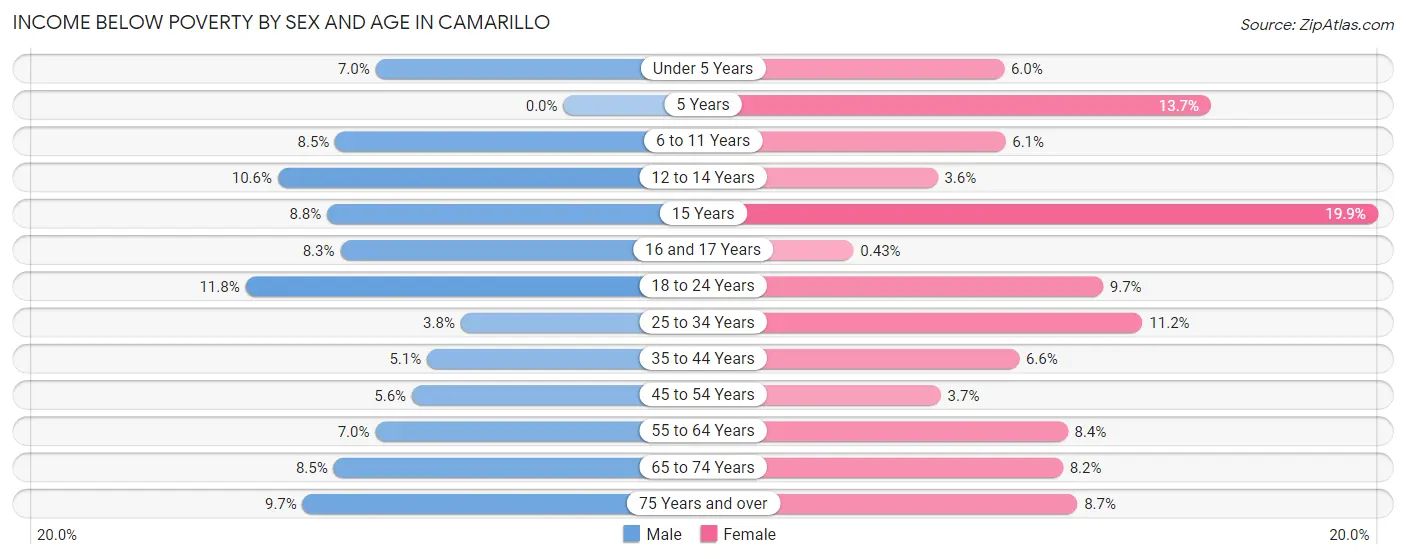
| Age Bracket | Male | Female |
| Under 5 Years | 164 (7.0%) | 118 (6.0%) |
| 5 Years | 0 (0.0%) | 37 (13.7%) |
| 6 to 11 Years | 210 (8.5%) | 120 (6.1%) |
| 12 to 14 Years | 128 (10.6%) | 36 (3.5%) |
| 15 Years | 45 (8.8%) | 73 (19.9%) |
| 16 and 17 Years | 70 (8.3%) | 4 (0.4%) |
| 18 to 24 Years | 313 (11.8%) | 307 (9.7%) |
| 25 to 34 Years | 185 (3.8%) | 577 (11.2%) |
| 35 to 44 Years | 214 (5.1%) | 260 (6.6%) |
| 45 to 54 Years | 212 (5.6%) | 147 (3.7%) |
| 55 to 64 Years | 282 (7.0%) | 402 (8.4%) |
| 65 to 74 Years | 321 (8.5%) | 362 (8.2%) |
| 75 Years and over | 239 (9.7%) | 358 (8.7%) |
| Total | 2,383 (7.1%) | 2,801 (7.8%) |
Income Above Poverty by Sex and Age in Camarillo
According to the poverty statistics in Camarillo, males aged 5 years and females aged 16 and 17 years are the age groups that are most secure financially, with 100.0% of males and 99.6% of females in these age groups living above the poverty line.
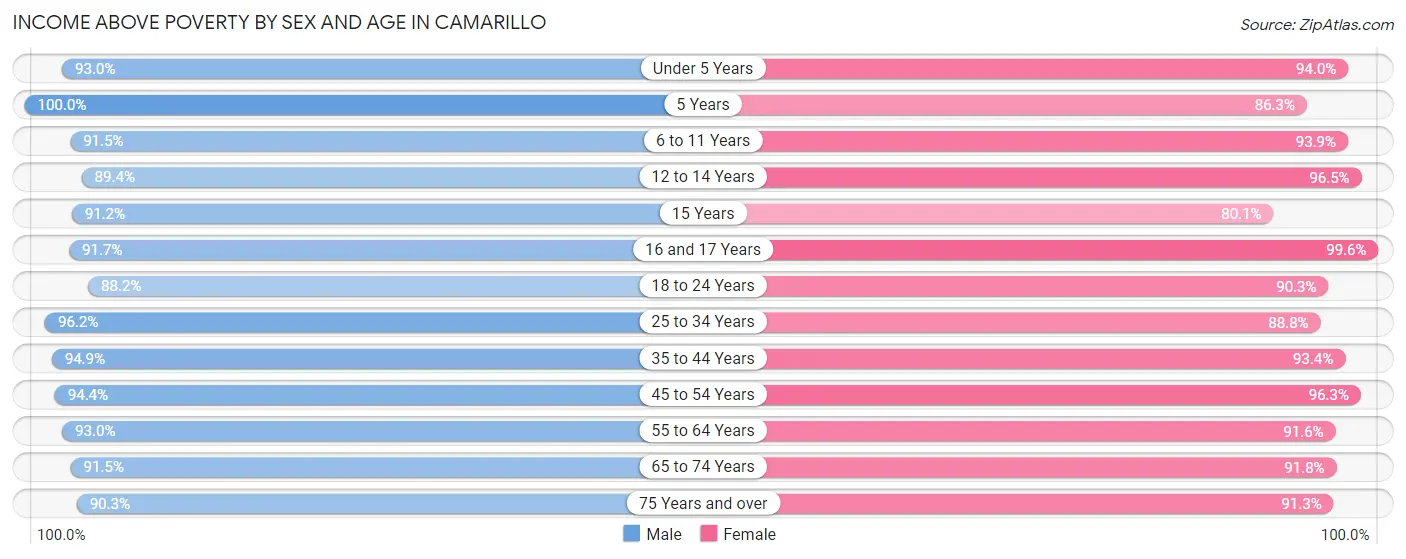
| Age Bracket | Male | Female |
| Under 5 Years | 2,188 (93.0%) | 1,843 (94.0%) |
| 5 Years | 441 (100.0%) | 233 (86.3%) |
| 6 to 11 Years | 2,270 (91.5%) | 1,856 (93.9%) |
| 12 to 14 Years | 1,080 (89.4%) | 979 (96.5%) |
| 15 Years | 468 (91.2%) | 294 (80.1%) |
| 16 and 17 Years | 775 (91.7%) | 916 (99.6%) |
| 18 to 24 Years | 2,339 (88.2%) | 2,860 (90.3%) |
| 25 to 34 Years | 4,672 (96.2%) | 4,593 (88.8%) |
| 35 to 44 Years | 4,017 (94.9%) | 3,690 (93.4%) |
| 45 to 54 Years | 3,559 (94.4%) | 3,855 (96.3%) |
| 55 to 64 Years | 3,761 (93.0%) | 4,393 (91.6%) |
| 65 to 74 Years | 3,441 (91.5%) | 4,054 (91.8%) |
| 75 Years and over | 2,231 (90.3%) | 3,738 (91.3%) |
| Total | 31,242 (92.9%) | 33,304 (92.2%) |
Income Below Poverty Among Married-Couple Families in Camarillo
The poverty statistics for married-couple families in Camarillo show that 3.2% or 445 of the total 14,082 families live below the poverty line. Families with no children have the highest poverty rate of 4.1%, comprising of 352 families. On the other hand, families with 5 or more children have the lowest poverty rate of 0.0%, which includes 0 families.
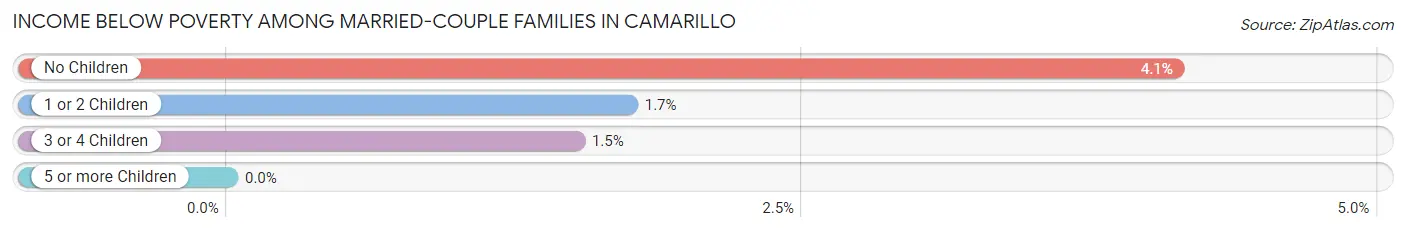
| Children | Above Poverty | Below Poverty |
| No Children | 8,189 (95.9%) | 352 (4.1%) |
| 1 or 2 Children | 4,353 (98.3%) | 77 (1.7%) |
| 3 or 4 Children | 1,047 (98.5%) | 16 (1.5%) |
| 5 or more Children | 48 (100.0%) | 0 (0.0%) |
| Total | 13,637 (96.8%) | 445 (3.2%) |
Income Below Poverty Among Single-Parent Households in Camarillo
According to the poverty data in Camarillo, 14.2% or 111 single-father households and 14.3% or 420 single-mother households are living below the poverty line. Among single-father households, those with no children have the highest poverty rate, with 70 households (15.1%) experiencing poverty. Likewise, among single-mother households, those with 3 or 4 children have the highest poverty rate, with 72 households (51.8%) falling below the poverty line.
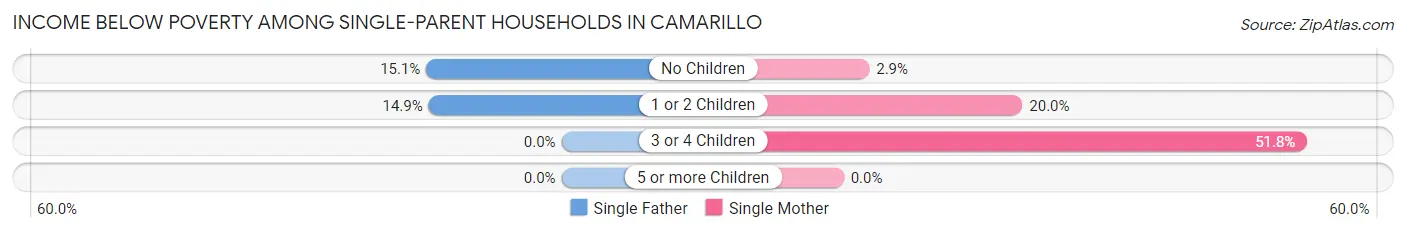
| Children | Single Father | Single Mother |
| No Children | 70 (15.1%) | 35 (2.9%) |
| 1 or 2 Children | 41 (14.9%) | 313 (20.0%) |
| 3 or 4 Children | 0 (0.0%) | 72 (51.8%) |
| 5 or more Children | 0 (0.0%) | 0 (0.0%) |
| Total | 111 (14.2%) | 420 (14.3%) |
Income Below Poverty Among Married-Couple vs Single-Parent Households in Camarillo
The poverty data for Camarillo shows that 445 of the married-couple family households (3.2%) and 531 of the single-parent households (14.3%) are living below the poverty level. Within the married-couple family households, those with no children have the highest poverty rate, with 352 households (4.1%) falling below the poverty line. Among the single-parent households, those with 3 or 4 children have the highest poverty rate, with 72 household (39.8%) living below poverty.
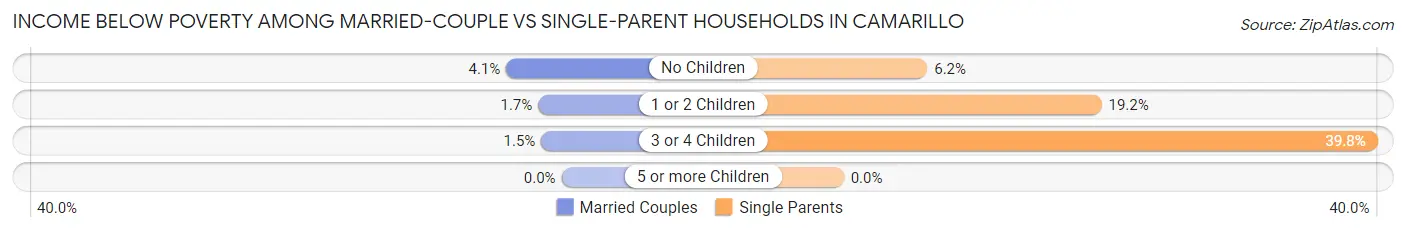
| Children | Married-Couple Families | Single-Parent Households |
| No Children | 352 (4.1%) | 105 (6.2%) |
| 1 or 2 Children | 77 (1.7%) | 354 (19.2%) |
| 3 or 4 Children | 16 (1.5%) | 72 (39.8%) |
| 5 or more Children | 0 (0.0%) | 0 (0.0%) |
| Total | 445 (3.2%) | 531 (14.3%) |
Race in Camarillo
The most populous races in Camarillo are White / Caucasian (47,017 | 66.6%), Hispanic or Latino (22,096 | 31.3%), and Two or more Races (10,135 | 14.3%).
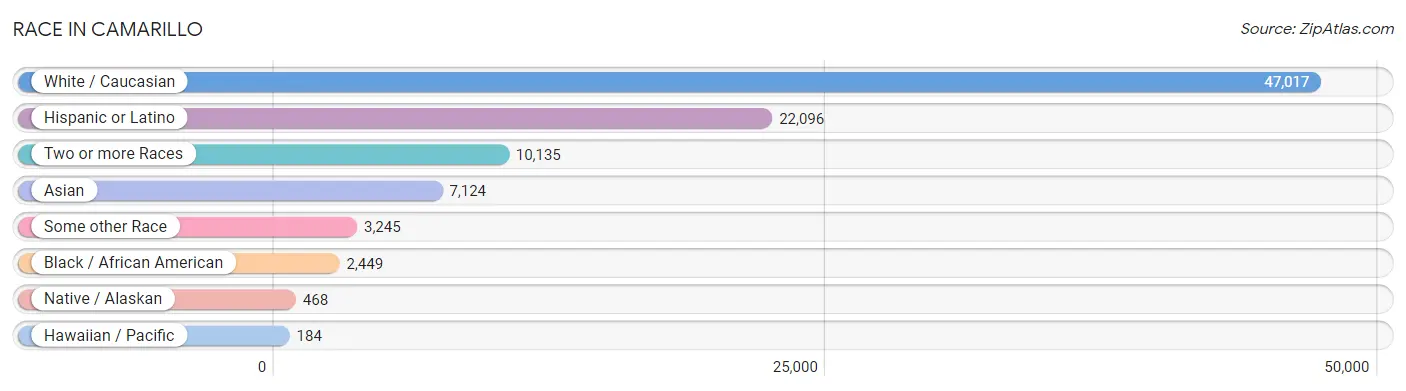
| Race | # Population | % Population |
| Asian | 7,124 | 10.1% |
| Black / African American | 2,449 | 3.5% |
| Hawaiian / Pacific | 184 | 0.3% |
| Hispanic or Latino | 22,096 | 31.3% |
| Native / Alaskan | 468 | 0.7% |
| White / Caucasian | 47,017 | 66.6% |
| Two or more Races | 10,135 | 14.3% |
| Some other Race | 3,245 | 4.6% |
| Total | 70,622 | 100.0% |
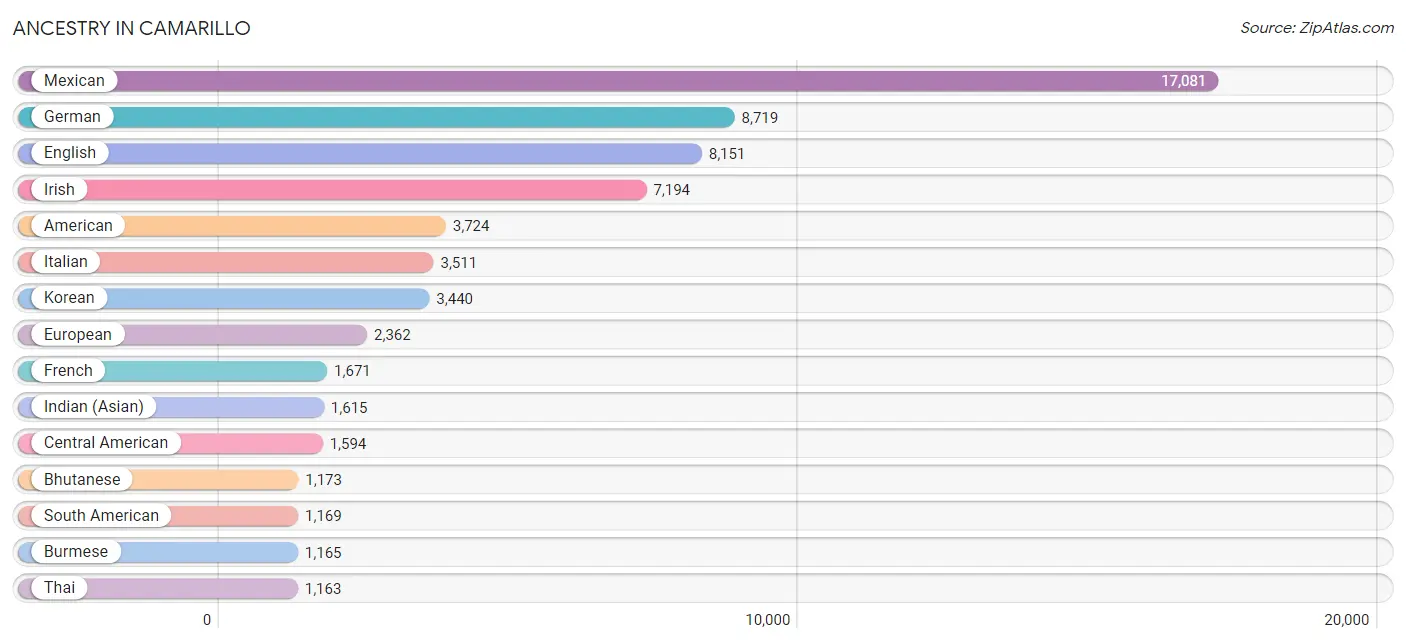
Ancestry in Camarillo
The most populous ancestries reported in Camarillo are Mexican (17,081 | 24.2%), German (8,719 | 12.3%), English (8,151 | 11.5%), Irish (7,194 | 10.2%), and American (3,724 | 5.3%), together accounting for 63.5% of all Camarillo residents.
| Ancestry | # Population | % Population |
| African | 73 | 0.1% |
| American | 3,724 | 5.3% |
| Apache | 35 | 0.1% |
| Arab | 311 | 0.4% |
| Argentinean | 183 | 0.3% |
| Armenian | 238 | 0.3% |
| Assyrian / Chaldean / Syriac | 14 | 0.0% |
| Australian | 80 | 0.1% |
| Austrian | 150 | 0.2% |
| Bangladeshi | 69 | 0.1% |
| Basque | 73 | 0.1% |
| Belgian | 131 | 0.2% |
| Belizean | 17 | 0.0% |
| Bhutanese | 1,173 | 1.7% |
| Brazilian | 22 | 0.0% |
| British | 459 | 0.6% |
| Bulgarian | 40 | 0.1% |
| Burmese | 1,165 | 1.7% |
| Cambodian | 8 | 0.0% |
| Canadian | 470 | 0.7% |
| Celtic | 80 | 0.1% |
| Central American | 1,594 | 2.3% |
| Central American Indian | 32 | 0.1% |
| Cherokee | 251 | 0.4% |
| Chilean | 74 | 0.1% |
| Choctaw | 58 | 0.1% |
| Colombian | 401 | 0.6% |
| Comanche | 45 | 0.1% |
| Cree | 3 | 0.0% |
| Creek | 12 | 0.0% |
| Croatian | 51 | 0.1% |
| Cuban | 82 | 0.1% |
| Czech | 176 | 0.3% |
| Czechoslovakian | 69 | 0.1% |
| Danish | 497 | 0.7% |
| Dominican | 47 | 0.1% |
| Dutch | 1,001 | 1.4% |
| Dutch West Indian | 6 | 0.0% |
| Eastern European | 277 | 0.4% |
| Ecuadorian | 283 | 0.4% |
| Egyptian | 72 | 0.1% |
| English | 8,151 | 11.5% |
| Estonian | 22 | 0.0% |
| Ethiopian | 15 | 0.0% |
| European | 2,362 | 3.3% |
| Filipino | 99 | 0.1% |
| Finnish | 132 | 0.2% |
| French | 1,671 | 2.4% |
| French Canadian | 329 | 0.5% |
| German | 8,719 | 12.3% |
| Greek | 332 | 0.5% |
| Guamanian / Chamorro | 165 | 0.2% |
| Guatemalan | 425 | 0.6% |
| Guyanese | 20 | 0.0% |
| Haitian | 99 | 0.1% |
| Honduran | 70 | 0.1% |
| Hungarian | 283 | 0.4% |
| Icelander | 7 | 0.0% |
| Indian (Asian) | 1,615 | 2.3% |
| Inupiat | 12 | 0.0% |
| Iranian | 317 | 0.4% |
| Irish | 7,194 | 10.2% |
| Iroquois | 35 | 0.1% |
| Israeli | 28 | 0.0% |
| Italian | 3,511 | 5.0% |
| Jamaican | 30 | 0.0% |
| Korean | 3,440 | 4.9% |
| Laotian | 64 | 0.1% |
| Latvian | 84 | 0.1% |
| Lebanese | 93 | 0.1% |
| Lithuanian | 128 | 0.2% |
| Malaysian | 28 | 0.0% |
| Mexican | 17,081 | 24.2% |
| Mexican American Indian | 145 | 0.2% |
| Moroccan | 14 | 0.0% |
| Native Hawaiian | 545 | 0.8% |
| Navajo | 31 | 0.0% |
| Nicaraguan | 455 | 0.6% |
| Nigerian | 219 | 0.3% |
| Northern European | 159 | 0.2% |
| Norwegian | 964 | 1.4% |
| Okinawan | 12 | 0.0% |
| Osage | 23 | 0.0% |
| Pakistani | 127 | 0.2% |
| Palestinian | 32 | 0.1% |
| Panamanian | 72 | 0.1% |
| Pennsylvania German | 28 | 0.0% |
| Peruvian | 210 | 0.3% |
| Pima | 20 | 0.0% |
| Polish | 1,107 | 1.6% |
| Portuguese | 144 | 0.2% |
| Potawatomi | 245 | 0.4% |
| Puerto Rican | 799 | 1.1% |
| Romanian | 31 | 0.0% |
| Russian | 658 | 0.9% |
| Salvadoran | 564 | 0.8% |
| Samoan | 89 | 0.1% |
| Scandinavian | 374 | 0.5% |
| Scotch-Irish | 599 | 0.9% |
| Scottish | 1,093 | 1.5% |
| Shoshone | 6 | 0.0% |
| Sioux | 7 | 0.0% |
| Slavic | 192 | 0.3% |
| Slovene | 7 | 0.0% |
| South African | 56 | 0.1% |
| South American | 1,169 | 1.7% |
| Spaniard | 484 | 0.7% |
| Spanish | 523 | 0.7% |
| Sri Lankan | 248 | 0.4% |
| Subsaharan African | 363 | 0.5% |
| Swedish | 762 | 1.1% |
| Swiss | 107 | 0.2% |
| Syrian | 38 | 0.1% |
| Thai | 1,163 | 1.7% |
| Tongan | 143 | 0.2% |
| Turkish | 50 | 0.1% |
| Ukrainian | 528 | 0.7% |
| Venezuelan | 18 | 0.0% |
| Welsh | 633 | 0.9% |
| Yugoslavian | 10 | 0.0% | View All 120 Rows |
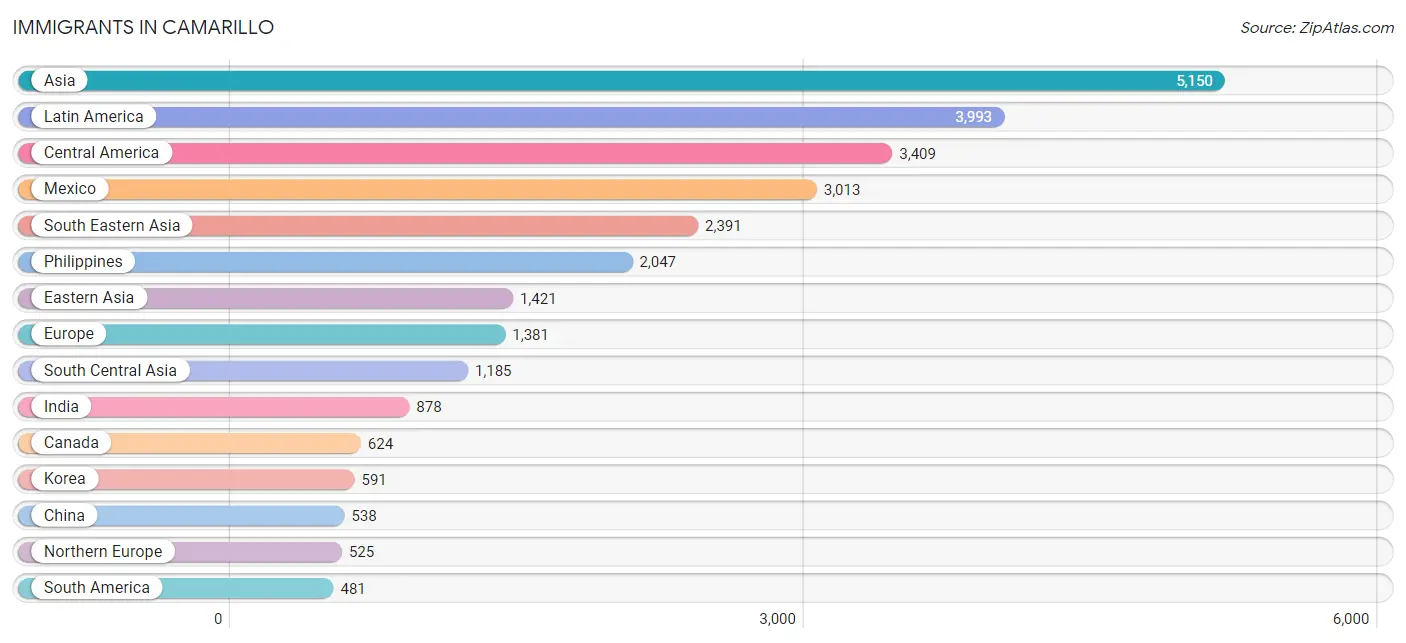
Immigrants in Camarillo
The most numerous immigrant groups reported in Camarillo came from Asia (5,150 | 7.3%), Latin America (3,993 | 5.7%), Central America (3,409 | 4.8%), Mexico (3,013 | 4.3%), and South Eastern Asia (2,391 | 3.4%), together accounting for 25.4% of all Camarillo residents.
| Immigration Origin | # Population | % Population |
| Africa | 245 | 0.4% |
| Argentina | 125 | 0.2% |
| Armenia | 17 | 0.0% |
| Asia | 5,150 | 7.3% |
| Australia | 27 | 0.0% |
| Austria | 12 | 0.0% |
| Belgium | 82 | 0.1% |
| Belize | 17 | 0.0% |
| Brazil | 54 | 0.1% |
| Canada | 624 | 0.9% |
| Caribbean | 103 | 0.2% |
| Central America | 3,409 | 4.8% |
| Chile | 43 | 0.1% |
| China | 538 | 0.8% |
| Colombia | 119 | 0.2% |
| Cuba | 39 | 0.1% |
| Czechoslovakia | 27 | 0.0% |
| Denmark | 48 | 0.1% |
| Eastern Africa | 5 | 0.0% |
| Eastern Asia | 1,421 | 2.0% |
| Eastern Europe | 344 | 0.5% |
| Ecuador | 68 | 0.1% |
| Egypt | 46 | 0.1% |
| El Salvador | 159 | 0.2% |
| England | 207 | 0.3% |
| Ethiopia | 5 | 0.0% |
| Europe | 1,381 | 2.0% |
| Fiji | 8 | 0.0% |
| France | 9 | 0.0% |
| Germany | 278 | 0.4% |
| Guatemala | 161 | 0.2% |
| Haiti | 45 | 0.1% |
| Honduras | 16 | 0.0% |
| Hong Kong | 46 | 0.1% |
| Hungary | 28 | 0.0% |
| India | 878 | 1.2% |
| Indonesia | 13 | 0.0% |
| Iran | 225 | 0.3% |
| Ireland | 58 | 0.1% |
| Israel | 18 | 0.0% |
| Italy | 68 | 0.1% |
| Jamaica | 19 | 0.0% |
| Japan | 292 | 0.4% |
| Korea | 591 | 0.8% |
| Kuwait | 20 | 0.0% |
| Laos | 18 | 0.0% |
| Latin America | 3,993 | 5.7% |
| Latvia | 17 | 0.0% |
| Lebanon | 8 | 0.0% |
| Malaysia | 16 | 0.0% |
| Mexico | 3,013 | 4.3% |
| Morocco | 24 | 0.0% |
| Netherlands | 34 | 0.1% |
| Nicaragua | 32 | 0.1% |
| Nigeria | 170 | 0.2% |
| Northern Africa | 70 | 0.1% |
| Northern Europe | 525 | 0.7% |
| Oceania | 64 | 0.1% |
| Pakistan | 34 | 0.1% |
| Peru | 54 | 0.1% |
| Philippines | 2,047 | 2.9% |
| Poland | 38 | 0.1% |
| Portugal | 29 | 0.0% |
| Russia | 49 | 0.1% |
| Scotland | 57 | 0.1% |
| Singapore | 12 | 0.0% |
| South America | 481 | 0.7% |
| South Central Asia | 1,185 | 1.7% |
| South Eastern Asia | 2,391 | 3.4% |
| Southern Europe | 97 | 0.1% |
| Sri Lanka | 18 | 0.0% |
| Syria | 58 | 0.1% |
| Taiwan | 107 | 0.2% |
| Thailand | 113 | 0.2% |
| Turkey | 10 | 0.0% |
| Ukraine | 129 | 0.2% |
| Uzbekistan | 30 | 0.0% |
| Venezuela | 18 | 0.0% |
| Vietnam | 172 | 0.2% |
| Western Africa | 170 | 0.2% |
| Western Asia | 131 | 0.2% |
| Western Europe | 415 | 0.6% | View All 82 Rows |
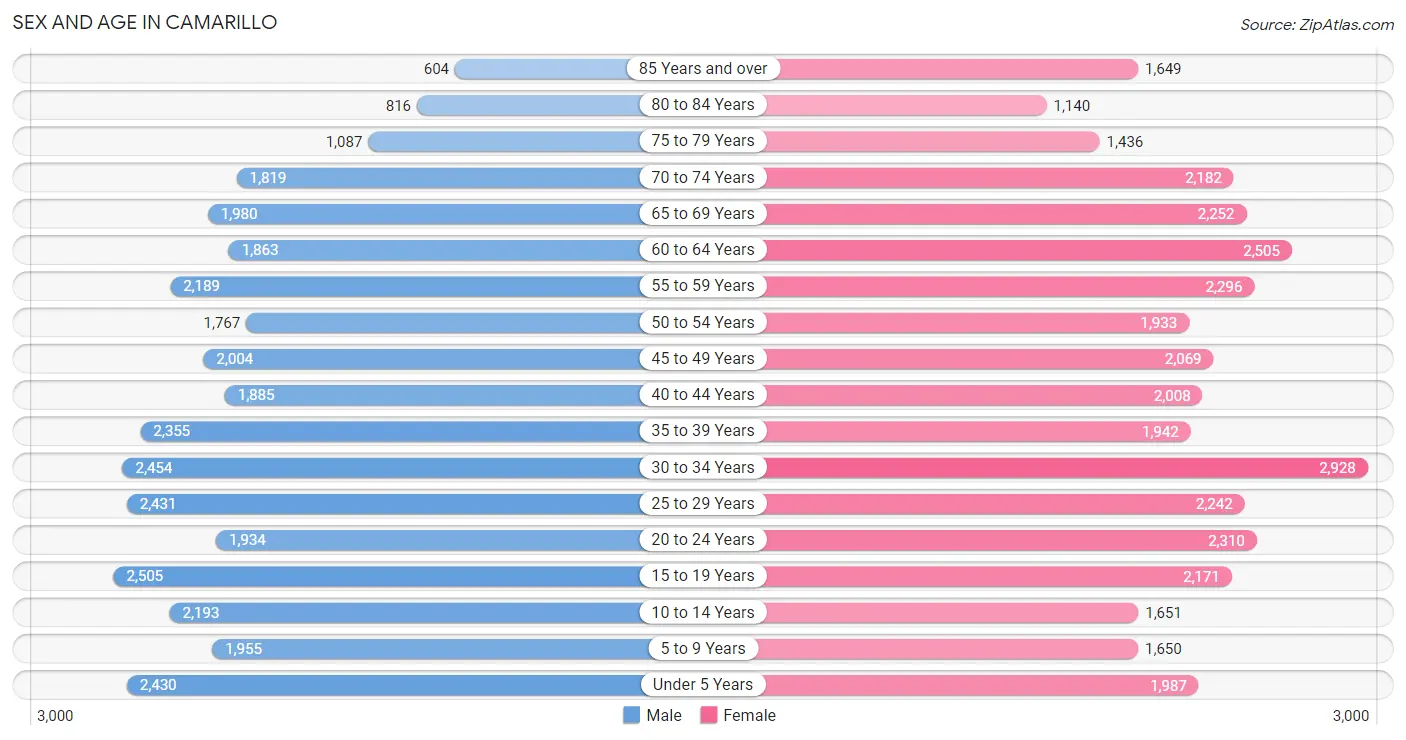
Sex and Age in Camarillo
Sex and Age in Camarillo
The most populous age groups in Camarillo are 15 to 19 Years (2,505 | 7.3%) for men and 30 to 34 Years (2,928 | 8.1%) for women.
| Age Bracket | Male | Female |
| Under 5 Years | 2,430 (7.1%) | 1,987 (5.5%) |
| 5 to 9 Years | 1,955 (5.7%) | 1,650 (4.5%) |
| 10 to 14 Years | 2,193 (6.4%) | 1,651 (4.5%) |
| 15 to 19 Years | 2,505 (7.3%) | 2,171 (6.0%) |
| 20 to 24 Years | 1,934 (5.6%) | 2,310 (6.4%) |
| 25 to 29 Years | 2,431 (7.1%) | 2,242 (6.2%) |
| 30 to 34 Years | 2,454 (7.2%) | 2,928 (8.1%) |
| 35 to 39 Years | 2,355 (6.9%) | 1,942 (5.3%) |
| 40 to 44 Years | 1,885 (5.5%) | 2,008 (5.5%) |
| 45 to 49 Years | 2,004 (5.9%) | 2,069 (5.7%) |
| 50 to 54 Years | 1,767 (5.2%) | 1,933 (5.3%) |
| 55 to 59 Years | 2,189 (6.4%) | 2,296 (6.3%) |
| 60 to 64 Years | 1,863 (5.4%) | 2,505 (6.9%) |
| 65 to 69 Years | 1,980 (5.8%) | 2,252 (6.2%) |
| 70 to 74 Years | 1,819 (5.3%) | 2,182 (6.0%) |
| 75 to 79 Years | 1,087 (3.2%) | 1,436 (4.0%) |
| 80 to 84 Years | 816 (2.4%) | 1,140 (3.1%) |
| 85 Years and over | 604 (1.8%) | 1,649 (4.5%) |
| Total | 34,271 (100.0%) | 36,351 (100.0%) |
Families and Households in Camarillo
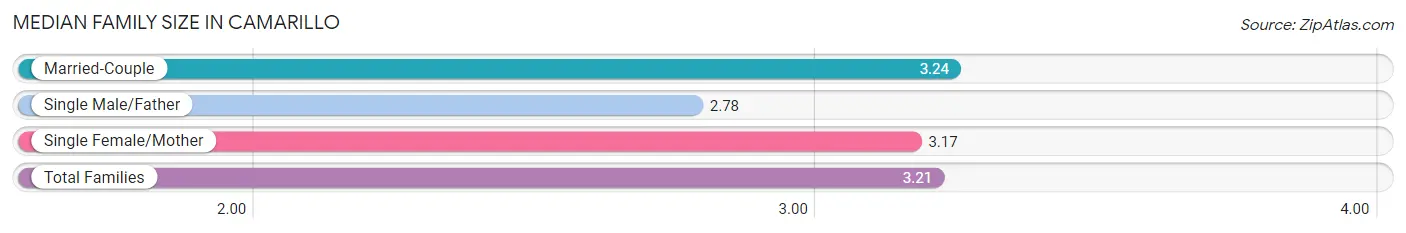
Median Family Size in Camarillo
The median family size in Camarillo is 3.21 persons per family, with married-couple families (14,082 | 79.1%) accounting for the largest median family size of 3.24 persons per family. On the other hand, single male/father families (781 | 4.4%) represent the smallest median family size with 2.78 persons per family.
| Family Type | # Families | Family Size |
| Married-Couple | 14,082 (79.1%) | 3.24 |
| Single Male/Father | 781 (4.4%) | 2.78 |
| Single Female/Mother | 2,943 (16.5%) | 3.17 |
| Total Families | 17,806 (100.0%) | 3.21 |
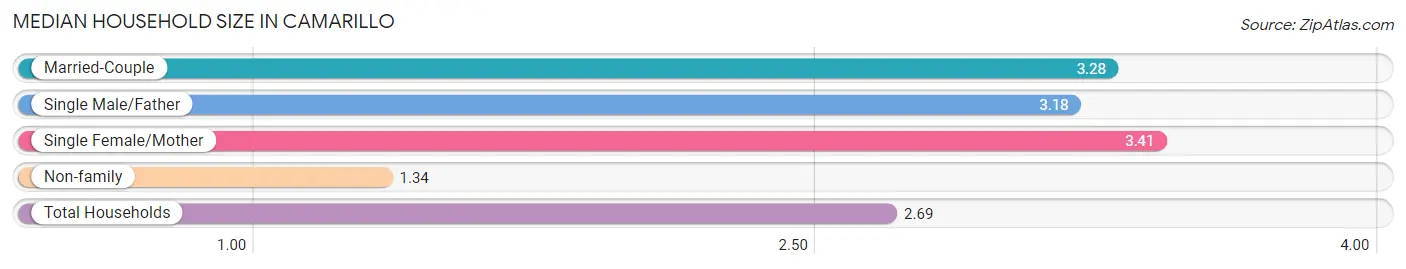
Median Household Size in Camarillo
The median household size in Camarillo is 2.69 persons per household, with single female/mother households (2,943 | 11.4%) accounting for the largest median household size of 3.41 persons per household. non-family households (8,133 | 31.4%) represent the smallest median household size with 1.34 persons per household.
| Household Type | # Households | Household Size |
| Married-Couple | 14,082 (54.3%) | 3.28 |
| Single Male/Father | 781 (3.0%) | 3.18 |
| Single Female/Mother | 2,943 (11.4%) | 3.41 |
| Non-family | 8,133 (31.4%) | 1.34 |
| Total Households | 25,939 (100.0%) | 2.69 |
Household Size by Marriage Status in Camarillo
Out of a total of 25,939 households in Camarillo, 17,806 (68.6%) are family households, while 8,133 (31.4%) are nonfamily households. The most numerous type of family households are 2-person households, comprising 8,059, and the most common type of nonfamily households are 1-person households, comprising 6,225.
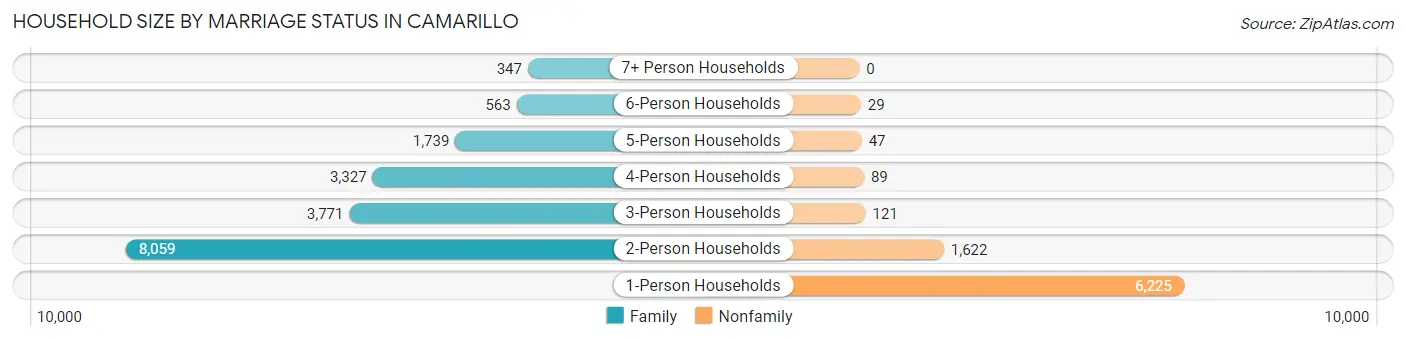
| Household Size | Family Households | Nonfamily Households |
| 1-Person Households | - | 6,225 (24.0%) |
| 2-Person Households | 8,059 (31.1%) | 1,622 (6.2%) |
| 3-Person Households | 3,771 (14.5%) | 121 (0.5%) |
| 4-Person Households | 3,327 (12.8%) | 89 (0.3%) |
| 5-Person Households | 1,739 (6.7%) | 47 (0.2%) |
| 6-Person Households | 563 (2.2%) | 29 (0.1%) |
| 7+ Person Households | 347 (1.3%) | 0 (0.0%) |
| Total | 17,806 (68.6%) | 8,133 (31.4%) |
Female Fertility in Camarillo
Fertility by Age in Camarillo
Average fertility rate in Camarillo is 37.0 births per 1,000 women. Women in the age bracket of 20 to 34 years have the highest fertility rate with 62.0 births per 1,000 women. Women in the age bracket of 20 to 34 years acount for 79.4% of all women with births.
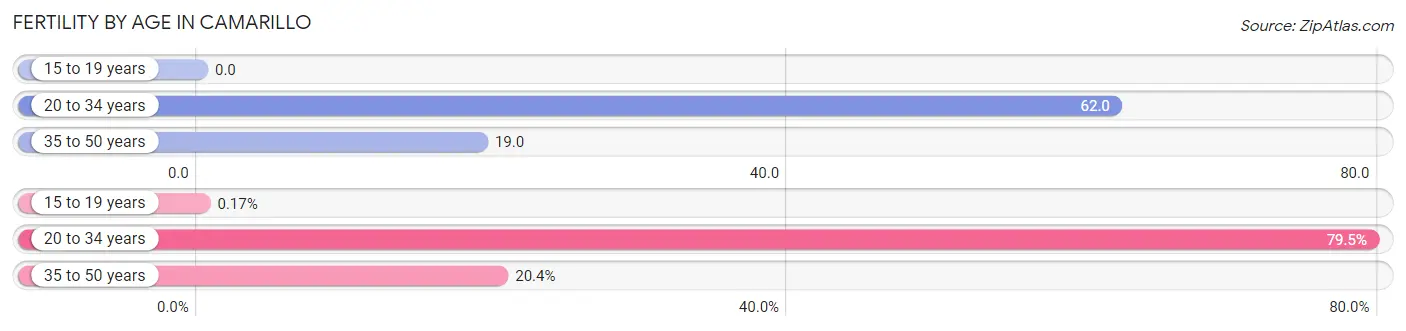
| Age Bracket | Women with Births | Births / 1,000 Women |
| 15 to 19 years | 1 (0.2%) | 0.0 |
| 20 to 34 years | 464 (79.4%) | 62.0 |
| 35 to 50 years | 119 (20.4%) | 19.0 |
| Total | 584 (100.0%) | 37.0 |
Fertility by Age by Marriage Status in Camarillo
97.8% of women with births (584) in Camarillo are married. The highest percentage of unmarried women with births falls into 20 to 34 years age bracket with 2.8% of them unmarried at the time of birth, while the lowest percentage of unmarried women with births belong to 15 to 19 years age bracket with 0.0% of them unmarried.
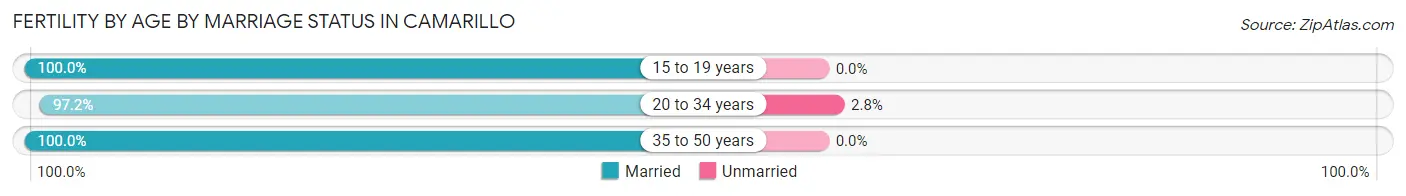
| Age Bracket | Married | Unmarried |
| 15 to 19 years | 1 (100.0%) | 0 (0.0%) |
| 20 to 34 years | 451 (97.2%) | 13 (2.8%) |
| 35 to 50 years | 119 (100.0%) | 0 (0.0%) |
| Total | 571 (97.8%) | 13 (2.2%) |
Fertility by Education in Camarillo
Average fertility rate in Camarillo is 37.0 births per 1,000 women. Women with the education attainment of bachelor's degree have the highest fertility rate of 60.0 births per 1,000 women, while women with the education attainment of less than high school have the lowest fertility at 10.0 births per 1,000 women. Women with the education attainment of bachelor's degree represent 38.4% of all women with births.
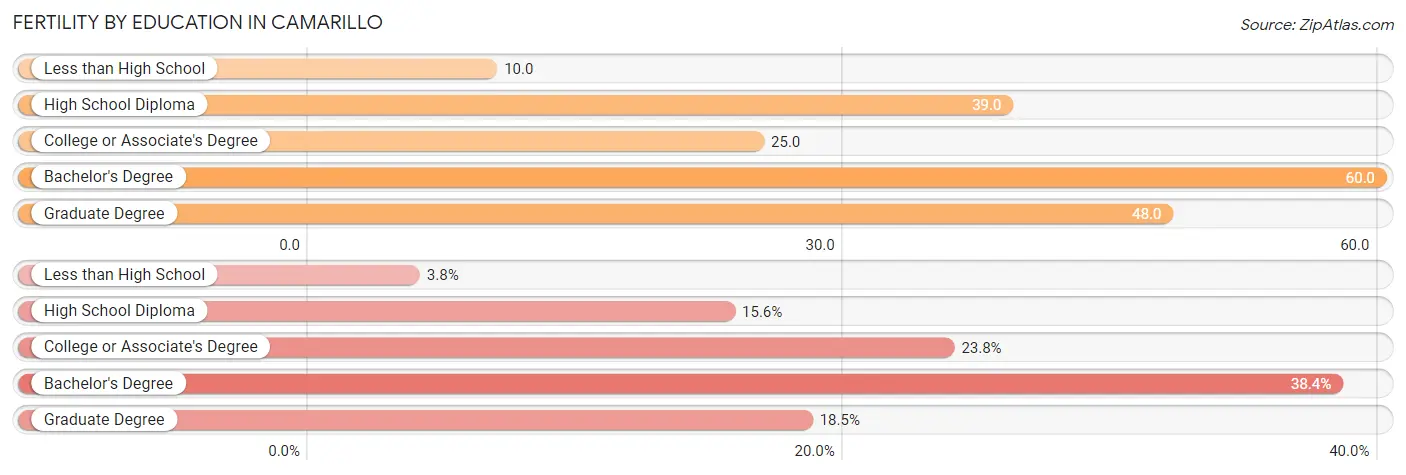
| Educational Attainment | Women with Births | Births / 1,000 Women |
| Less than High School | 22 (3.8%) | 10.0 |
| High School Diploma | 91 (15.6%) | 39.0 |
| College or Associate's Degree | 139 (23.8%) | 25.0 |
| Bachelor's Degree | 224 (38.4%) | 60.0 |
| Graduate Degree | 108 (18.5%) | 48.0 |
| Total | 584 (100.0%) | 37.0 |
Fertility by Education by Marriage Status in Camarillo
2.2% of women with births in Camarillo are unmarried. Women with the educational attainment of less than high school are most likely to be married with 100.0% of them married at childbirth, while women with the educational attainment of college or associate's degree are least likely to be married with 9.3% of them unmarried at childbirth.
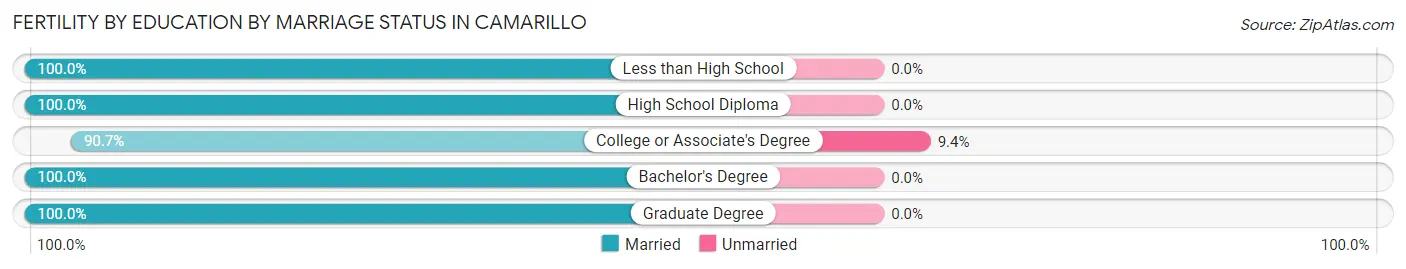
| Educational Attainment | Married | Unmarried |
| Less than High School | 22 (100.0%) | 0 (0.0%) |
| High School Diploma | 91 (100.0%) | 0 (0.0%) |
| College or Associate's Degree | 126 (90.6%) | 13 (9.3%) |
| Bachelor's Degree | 224 (100.0%) | 0 (0.0%) |
| Graduate Degree | 108 (100.0%) | 0 (0.0%) |
| Total | 571 (97.8%) | 13 (2.2%) |
Employment Characteristics in Camarillo
Employment by Class of Employer in Camarillo
Among the 33,067 employed individuals in Camarillo, private company employees (19,959 | 60.4%), local government employees (3,145 | 9.5%), and self-employed (not incorporated) (2,928 | 8.8%) make up the most common classes of employment.
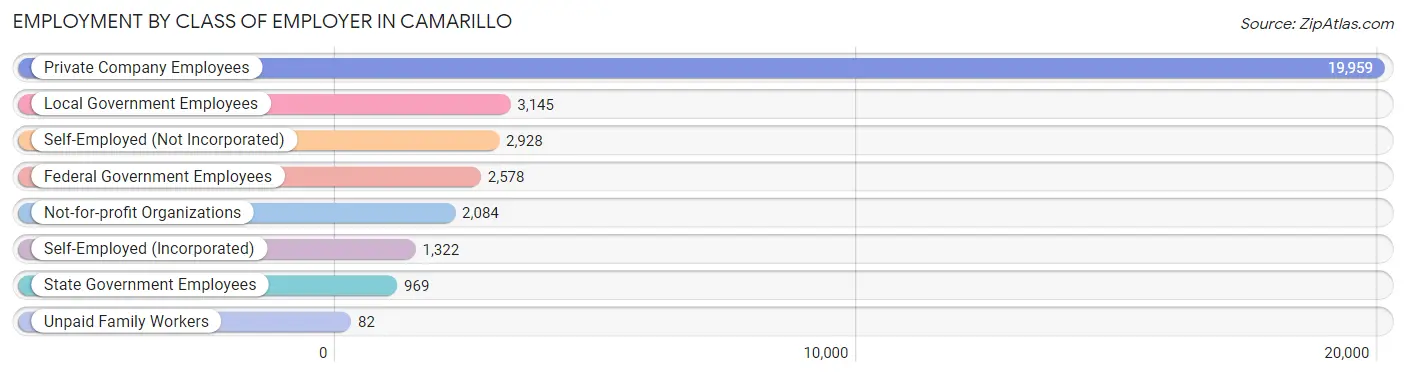
| Employer Class | # Employees | % Employees |
| Private Company Employees | 19,959 | 60.4% |
| Self-Employed (Incorporated) | 1,322 | 4.0% |
| Self-Employed (Not Incorporated) | 2,928 | 8.8% |
| Not-for-profit Organizations | 2,084 | 6.3% |
| Local Government Employees | 3,145 | 9.5% |
| State Government Employees | 969 | 2.9% |
| Federal Government Employees | 2,578 | 7.8% |
| Unpaid Family Workers | 82 | 0.3% |
| Total | 33,067 | 100.0% |
Employment Status by Age in Camarillo
According to the labor force statistics for Camarillo, out of the total population over 16 years of age (57,876), 61.6% or 35,652 individuals are in the labor force, with 4.8% or 1,711 of them unemployed. The age group with the highest labor force participation rate is 45 to 54 years, with 88.5% or 6,879 individuals in the labor force. Within the labor force, the 20 to 24 years age range has the highest percentage of unemployed individuals, with 11.8% or 357 of them being unemployed.
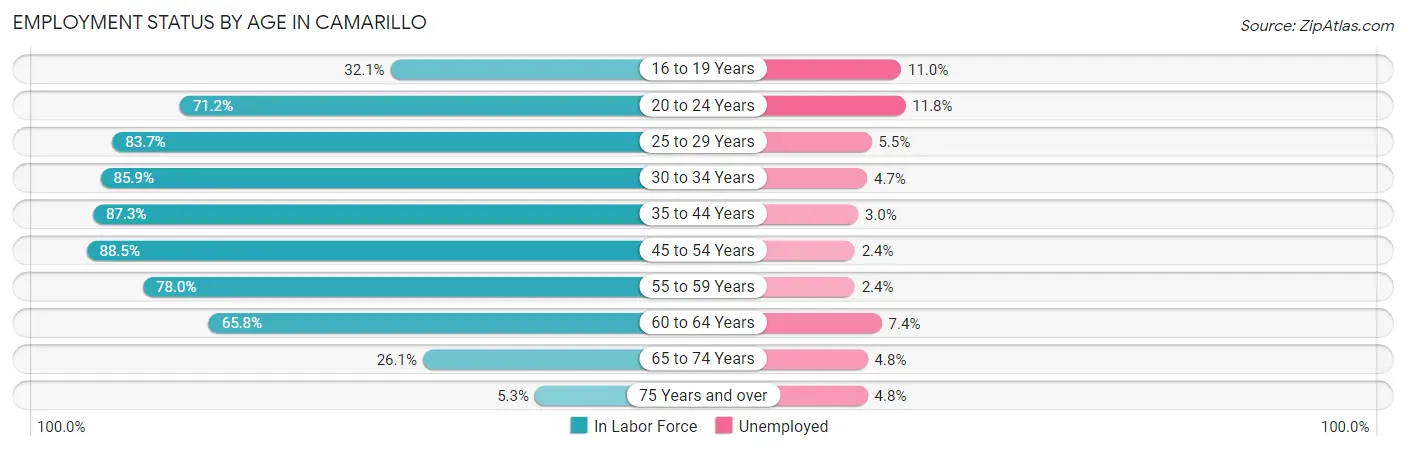
| Age Bracket | In Labor Force | Unemployed |
| 16 to 19 Years | 1,219 (32.1%) | 134 (11.0%) |
| 20 to 24 Years | 3,022 (71.2%) | 357 (11.8%) |
| 25 to 29 Years | 3,911 (83.7%) | 215 (5.5%) |
| 30 to 34 Years | 4,623 (85.9%) | 217 (4.7%) |
| 35 to 44 Years | 7,150 (87.3%) | 214 (3.0%) |
| 45 to 54 Years | 6,879 (88.5%) | 165 (2.4%) |
| 55 to 59 Years | 3,498 (78.0%) | 84 (2.4%) |
| 60 to 64 Years | 2,874 (65.8%) | 213 (7.4%) |
| 65 to 74 Years | 2,149 (26.1%) | 103 (4.8%) |
| 75 Years and over | 357 (5.3%) | 17 (4.8%) |
| Total | 35,652 (61.6%) | 1,711 (4.8%) |
Employment Status by Educational Attainment in Camarillo
According to labor force statistics for Camarillo, 83.0% of individuals (28,943) out of the total population between 25 and 64 years of age (34,871) are in the labor force, with 3.8% or 1,100 of them being unemployed. The group with the highest labor force participation rate are those with the educational attainment of bachelor's degree or higher, with 89.0% or 13,709 individuals in the labor force. Within the labor force, individuals with high school diploma education have the highest percentage of unemployment, with 7.7% or 311 of them being unemployed.
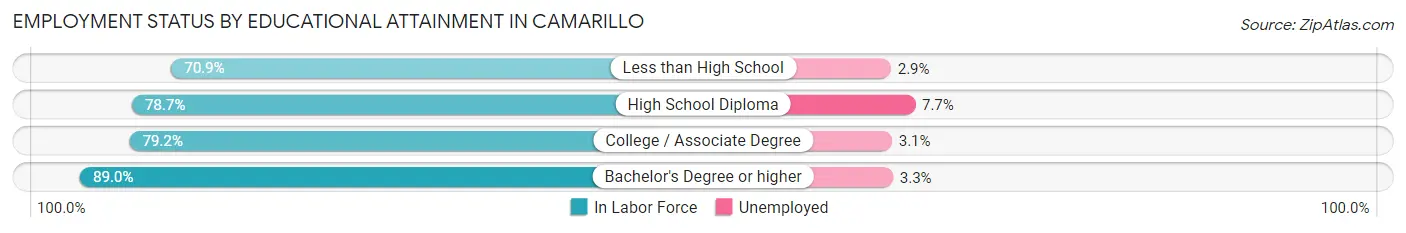
| Educational Attainment | In Labor Force | Unemployed |
| Less than High School | 1,388 (70.9%) | 57 (2.9%) |
| High School Diploma | 4,039 (78.7%) | 395 (7.7%) |
| College / Associate Degree | 9,804 (79.2%) | 384 (3.1%) |
| Bachelor's Degree or higher | 13,709 (89.0%) | 508 (3.3%) |
| Total | 28,943 (83.0%) | 1,325 (3.8%) |
Employment Occupations by Sex in Camarillo
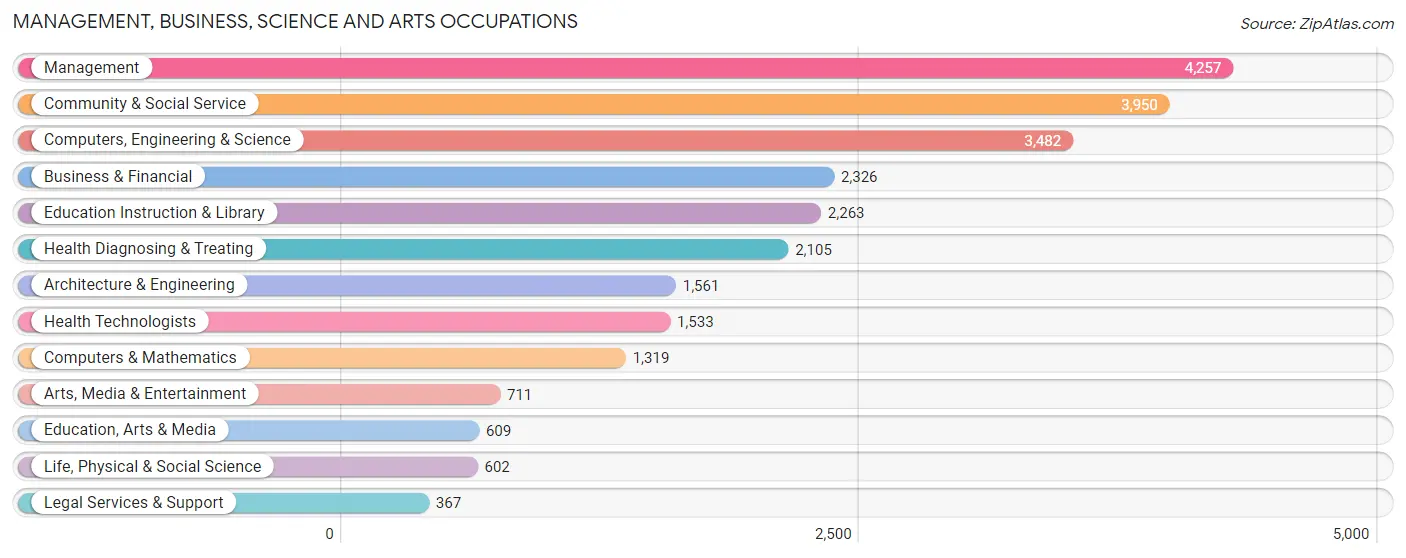
Management, Business, Science and Arts Occupations
The most common Management, Business, Science and Arts occupations in Camarillo are Management (4,257 | 12.9%), Community & Social Service (3,950 | 12.0%), Computers, Engineering & Science (3,482 | 10.5%), Business & Financial (2,326 | 7.0%), and Education Instruction & Library (2,263 | 6.9%).
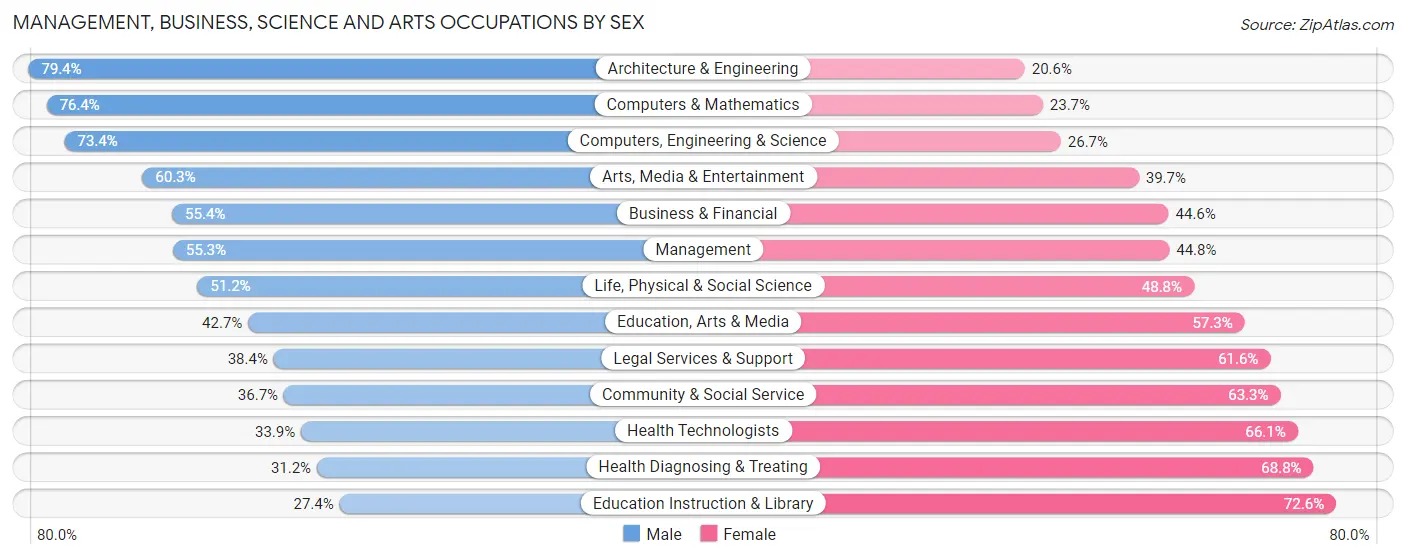
Management, Business, Science and Arts Occupations by Sex
Within the Management, Business, Science and Arts occupations in Camarillo, the most male-oriented occupations are Architecture & Engineering (79.4%), Computers & Mathematics (76.3%), and Computers, Engineering & Science (73.4%), while the most female-oriented occupations are Education Instruction & Library (72.6%), Health Diagnosing & Treating (68.8%), and Health Technologists (66.1%).
| Occupation | Male | Female |
| Management | 2,352 (55.2%) | 1,905 (44.8%) |
| Business & Financial | 1,288 (55.4%) | 1,038 (44.6%) |
| Computers, Engineering & Science | 2,554 (73.4%) | 928 (26.7%) |
| Computers & Mathematics | 1,007 (76.3%) | 312 (23.6%) |
| Architecture & Engineering | 1,239 (79.4%) | 322 (20.6%) |
| Life, Physical & Social Science | 308 (51.2%) | 294 (48.8%) |
| Community & Social Service | 1,451 (36.7%) | 2,499 (63.3%) |
| Education, Arts & Media | 260 (42.7%) | 349 (57.3%) |
| Legal Services & Support | 141 (38.4%) | 226 (61.6%) |
| Education Instruction & Library | 621 (27.4%) | 1,642 (72.6%) |
| Arts, Media & Entertainment | 429 (60.3%) | 282 (39.7%) |
| Health Diagnosing & Treating | 657 (31.2%) | 1,448 (68.8%) |
| Health Technologists | 519 (33.9%) | 1,014 (66.1%) |
| Total (Category) | 8,302 (51.5%) | 7,818 (48.5%) |
| Total (Overall) | 17,074 (51.7%) | 15,959 (48.3%) |
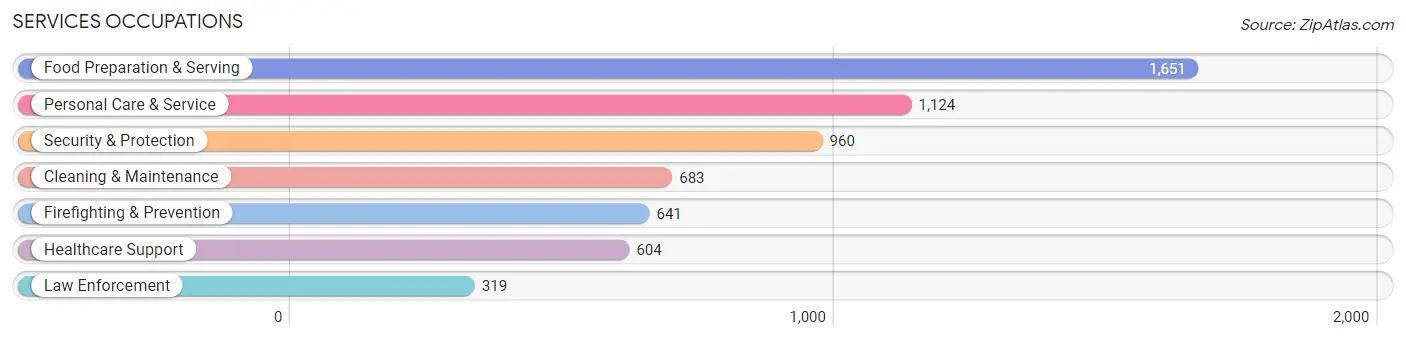
Services Occupations
The most common Services occupations in Camarillo are Food Preparation & Serving (1,651 | 5.0%), Personal Care & Service (1,124 | 3.4%), Security & Protection (960 | 2.9%), Cleaning & Maintenance (683 | 2.1%), and Firefighting & Prevention (641 | 1.9%).
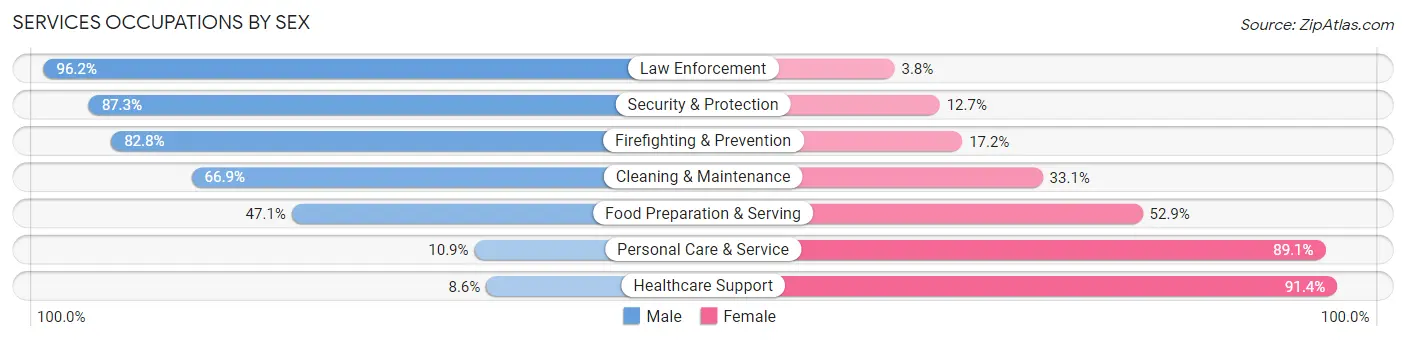
Services Occupations by Sex
Within the Services occupations in Camarillo, the most male-oriented occupations are Law Enforcement (96.2%), Security & Protection (87.3%), and Firefighting & Prevention (82.8%), while the most female-oriented occupations are Healthcare Support (91.4%), Personal Care & Service (89.1%), and Food Preparation & Serving (52.9%).
| Occupation | Male | Female |
| Healthcare Support | 52 (8.6%) | 552 (91.4%) |
| Security & Protection | 838 (87.3%) | 122 (12.7%) |
| Firefighting & Prevention | 531 (82.8%) | 110 (17.2%) |
| Law Enforcement | 307 (96.2%) | 12 (3.8%) |
| Food Preparation & Serving | 778 (47.1%) | 873 (52.9%) |
| Cleaning & Maintenance | 457 (66.9%) | 226 (33.1%) |
| Personal Care & Service | 123 (10.9%) | 1,001 (89.1%) |
| Total (Category) | 2,248 (44.8%) | 2,774 (55.2%) |
| Total (Overall) | 17,074 (51.7%) | 15,959 (48.3%) |
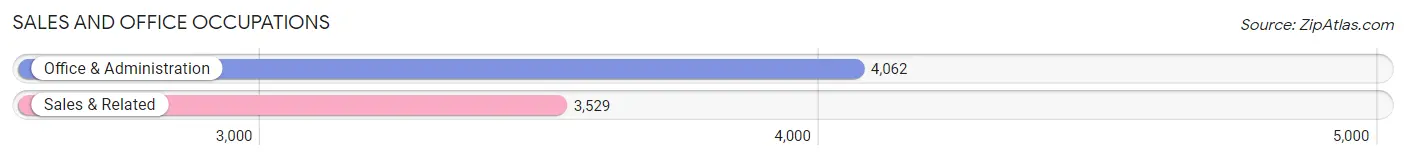
Sales and Office Occupations
The most common Sales and Office occupations in Camarillo are Office & Administration (4,062 | 12.3%), and Sales & Related (3,529 | 10.7%).
Sales and Office Occupations by Sex
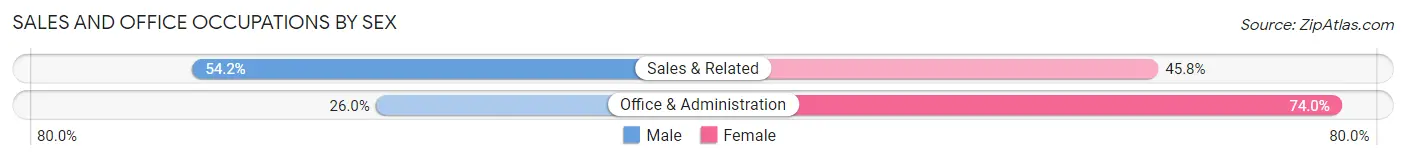
| Occupation | Male | Female |
| Sales & Related | 1,912 (54.2%) | 1,617 (45.8%) |
| Office & Administration | 1,056 (26.0%) | 3,006 (74.0%) |
| Total (Category) | 2,968 (39.1%) | 4,623 (60.9%) |
| Total (Overall) | 17,074 (51.7%) | 15,959 (48.3%) |
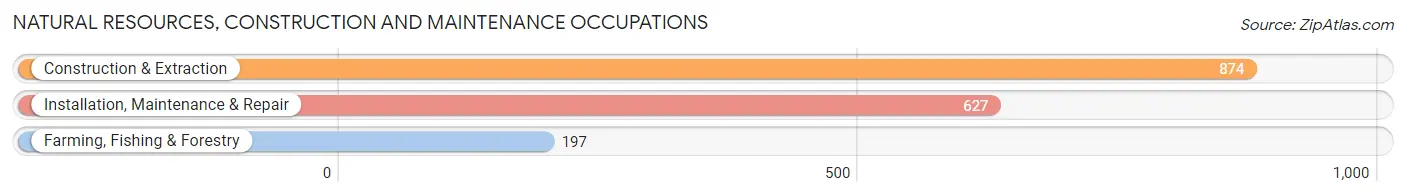
Natural Resources, Construction and Maintenance Occupations
The most common Natural Resources, Construction and Maintenance occupations in Camarillo are Construction & Extraction (874 | 2.6%), Installation, Maintenance & Repair (627 | 1.9%), and Farming, Fishing & Forestry (197 | 0.6%).
Natural Resources, Construction and Maintenance Occupations by Sex
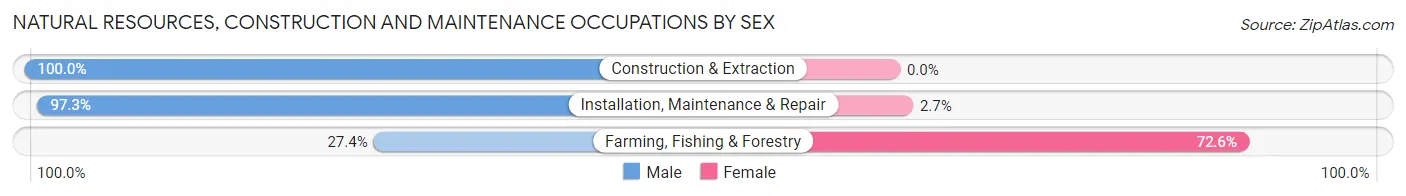
| Occupation | Male | Female |
| Farming, Fishing & Forestry | 54 (27.4%) | 143 (72.6%) |
| Construction & Extraction | 874 (100.0%) | 0 (0.0%) |
| Installation, Maintenance & Repair | 610 (97.3%) | 17 (2.7%) |
| Total (Category) | 1,538 (90.6%) | 160 (9.4%) |
| Total (Overall) | 17,074 (51.7%) | 15,959 (48.3%) |
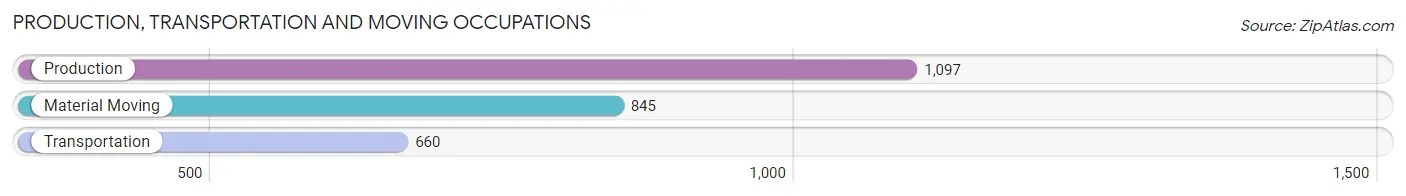
Production, Transportation and Moving Occupations
The most common Production, Transportation and Moving occupations in Camarillo are Production (1,097 | 3.3%), Material Moving (845 | 2.6%), and Transportation (660 | 2.0%).
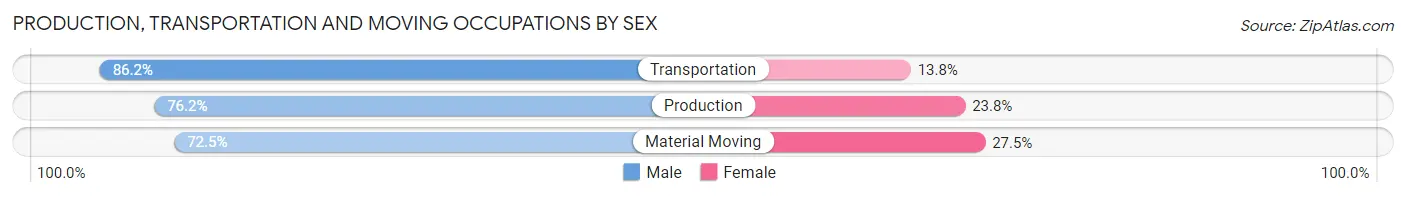
Production, Transportation and Moving Occupations by Sex
| Occupation | Male | Female |
| Production | 836 (76.2%) | 261 (23.8%) |
| Transportation | 569 (86.2%) | 91 (13.8%) |
| Material Moving | 613 (72.5%) | 232 (27.5%) |
| Total (Category) | 2,018 (77.6%) | 584 (22.4%) |
| Total (Overall) | 17,074 (51.7%) | 15,959 (48.3%) |
Employment Industries by Sex in Camarillo
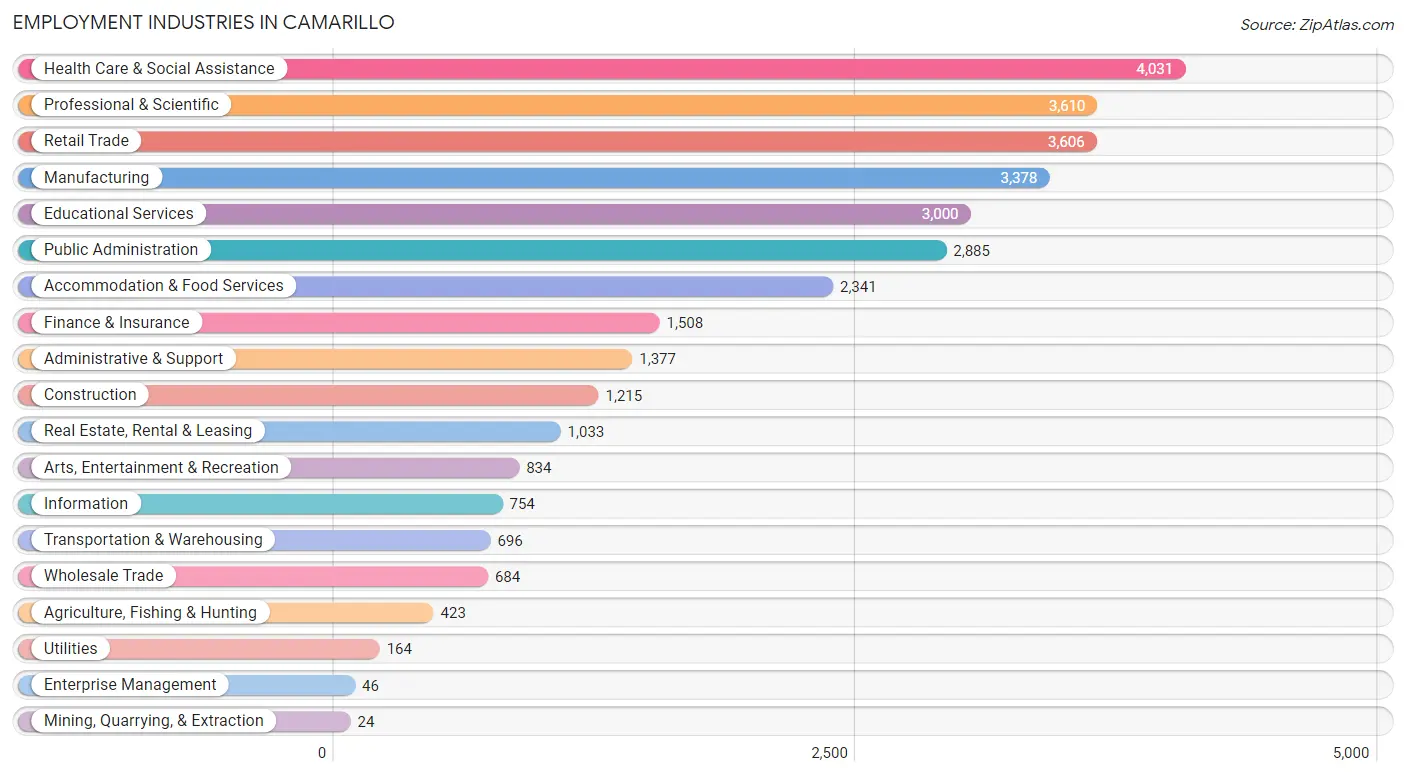
Employment Industries in Camarillo
The major employment industries in Camarillo include Health Care & Social Assistance (4,031 | 12.2%), Professional & Scientific (3,610 | 10.9%), Retail Trade (3,606 | 10.9%), Manufacturing (3,378 | 10.2%), and Educational Services (3,000 | 9.1%).
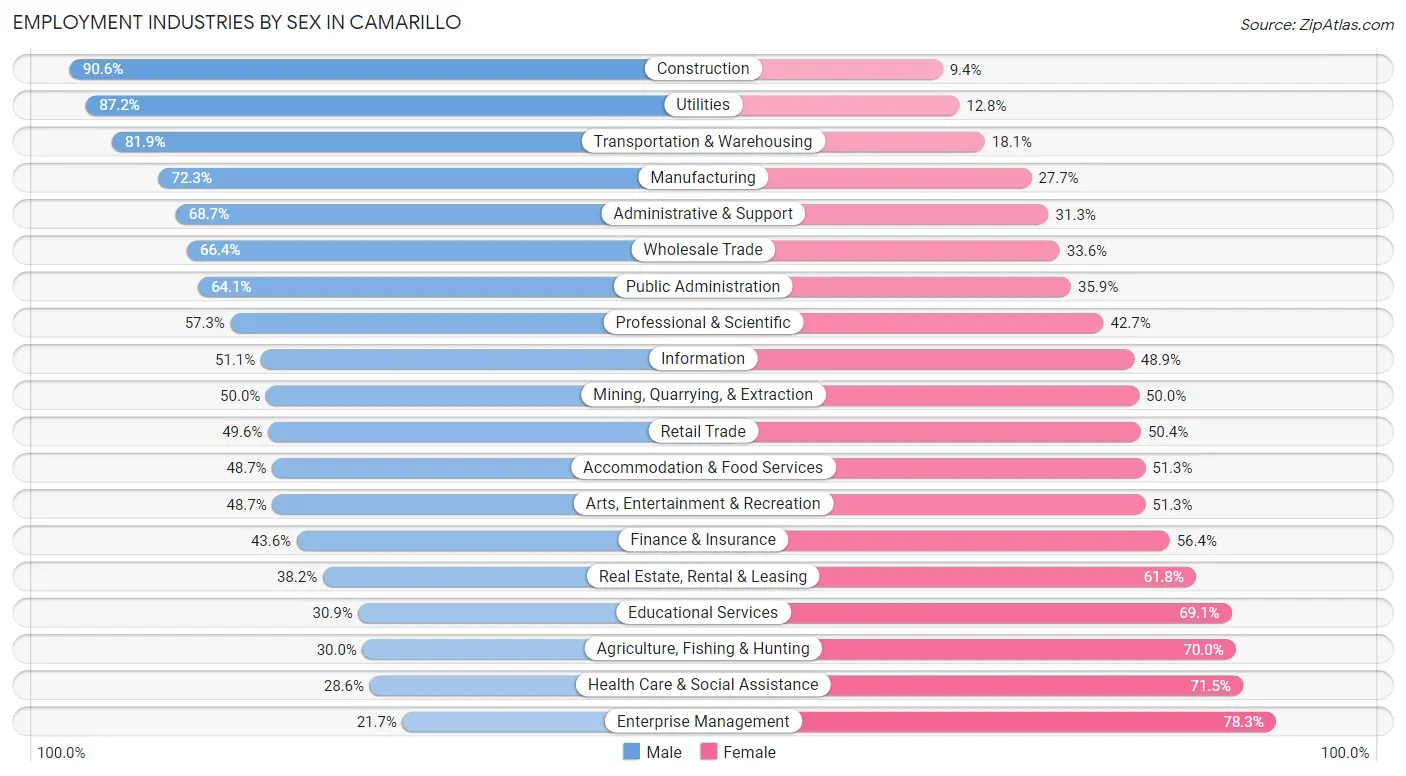
Employment Industries by Sex in Camarillo
The Camarillo industries that see more men than women are Construction (90.6%), Utilities (87.2%), and Transportation & Warehousing (81.9%), whereas the industries that tend to have a higher number of women are Enterprise Management (78.3%), Health Care & Social Assistance (71.5%), and Agriculture, Fishing & Hunting (70.0%).
| Industry | Male | Female |
| Agriculture, Fishing & Hunting | 127 (30.0%) | 296 (70.0%) |
| Mining, Quarrying, & Extraction | 12 (50.0%) | 12 (50.0%) |
| Construction | 1,101 (90.6%) | 114 (9.4%) |
| Manufacturing | 2,441 (72.3%) | 937 (27.7%) |
| Wholesale Trade | 454 (66.4%) | 230 (33.6%) |
| Retail Trade | 1,788 (49.6%) | 1,818 (50.4%) |
| Transportation & Warehousing | 570 (81.9%) | 126 (18.1%) |
| Utilities | 143 (87.2%) | 21 (12.8%) |
| Information | 385 (51.1%) | 369 (48.9%) |
| Finance & Insurance | 658 (43.6%) | 850 (56.4%) |
| Real Estate, Rental & Leasing | 395 (38.2%) | 638 (61.8%) |
| Professional & Scientific | 2,070 (57.3%) | 1,540 (42.7%) |
| Enterprise Management | 10 (21.7%) | 36 (78.3%) |
| Administrative & Support | 946 (68.7%) | 431 (31.3%) |
| Educational Services | 926 (30.9%) | 2,074 (69.1%) |
| Health Care & Social Assistance | 1,151 (28.5%) | 2,880 (71.5%) |
| Arts, Entertainment & Recreation | 406 (48.7%) | 428 (51.3%) |
| Accommodation & Food Services | 1,140 (48.7%) | 1,201 (51.3%) |
| Public Administration | 1,848 (64.1%) | 1,037 (35.9%) |
| Total | 17,074 (51.7%) | 15,959 (48.3%) |
Education in Camarillo
School Enrollment in Camarillo
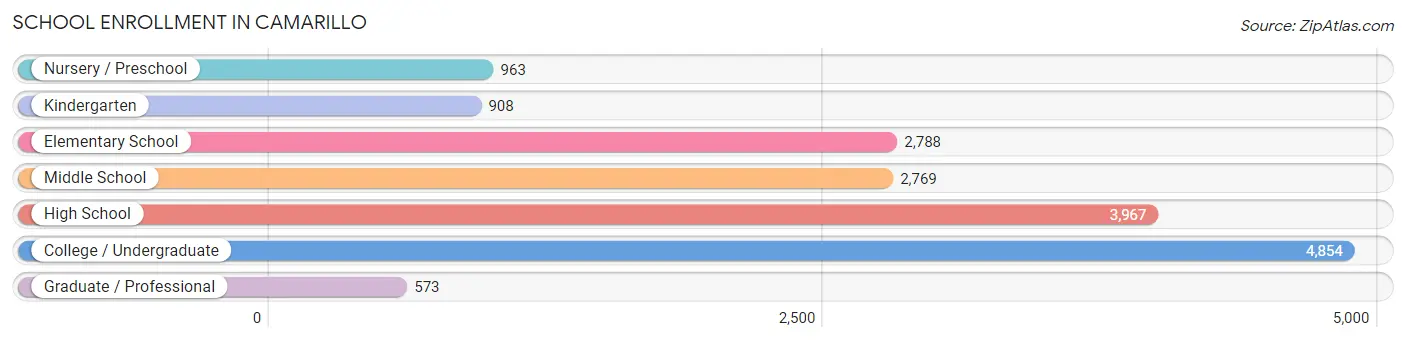
The most common levels of schooling among the 16,822 students in Camarillo are college / undergraduate (4,854 | 28.9%), high school (3,967 | 23.6%), and elementary school (2,788 | 16.6%).
| School Level | # Students | % Students |
| Nursery / Preschool | 963 | 5.7% |
| Kindergarten | 908 | 5.4% |
| Elementary School | 2,788 | 16.6% |
| Middle School | 2,769 | 16.5% |
| High School | 3,967 | 23.6% |
| College / Undergraduate | 4,854 | 28.9% |
| Graduate / Professional | 573 | 3.4% |
| Total | 16,822 | 100.0% |
School Enrollment by Age by Funding Source in Camarillo
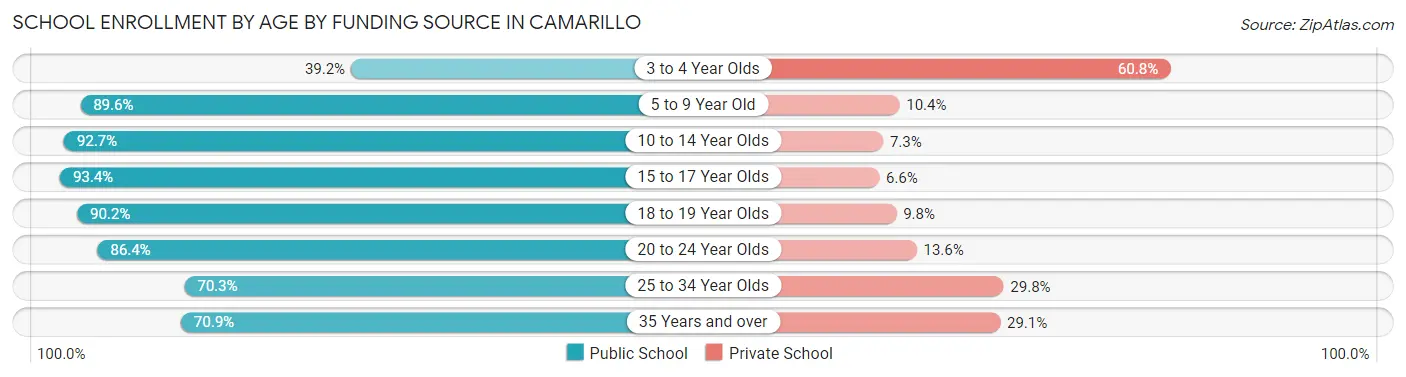
Out of a total of 16,822 students who are enrolled in schools in Camarillo, 2,389 (14.2%) attend a private institution, while the remaining 14,433 (85.8%) are enrolled in public schools. The age group of 3 to 4 year olds has the highest likelihood of being enrolled in private schools, with 476 (60.8% in the age bracket) enrolled. Conversely, the age group of 15 to 17 year olds has the lowest likelihood of being enrolled in a private school, with 2,523 (93.4% in the age bracket) attending a public institution.
| Age Bracket | Public School | Private School |
| 3 to 4 Year Olds | 307 (39.2%) | 476 (60.8%) |
| 5 to 9 Year Old | 3,028 (89.6%) | 350 (10.4%) |
| 10 to 14 Year Olds | 3,545 (92.7%) | 280 (7.3%) |
| 15 to 17 Year Olds | 2,523 (93.4%) | 178 (6.6%) |
| 18 to 19 Year Olds | 1,485 (90.2%) | 161 (9.8%) |
| 20 to 24 Year Olds | 2,082 (86.4%) | 327 (13.6%) |
| 25 to 34 Year Olds | 817 (70.3%) | 346 (29.7%) |
| 35 Years and over | 650 (70.9%) | 267 (29.1%) |
| Total | 14,433 (85.8%) | 2,389 (14.2%) |
Educational Attainment by Field of Study in Camarillo
Business (3,462 | 15.1%), social sciences (2,267 | 9.9%), engineering (2,266 | 9.9%), science & technology (2,002 | 8.7%), and education (1,974 | 8.6%) are the most common fields of study among 22,909 individuals in Camarillo who have obtained a bachelor's degree or higher.
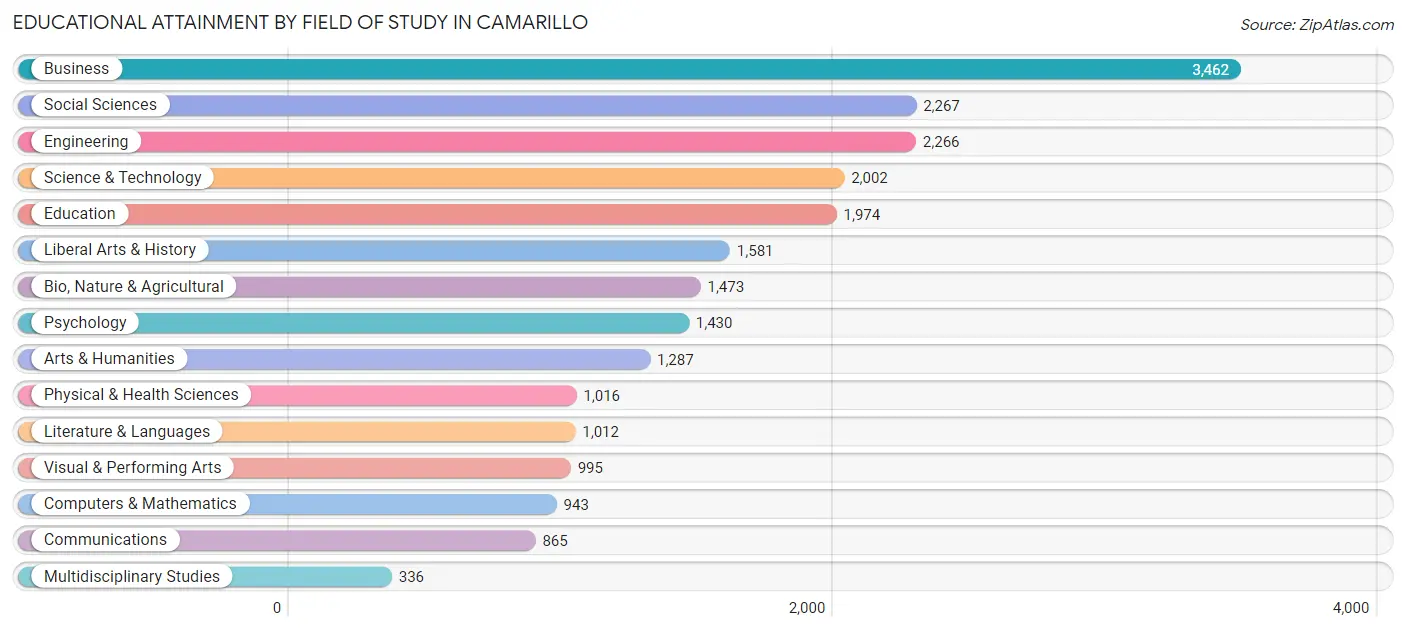
| Field of Study | # Graduates | % Graduates |
| Computers & Mathematics | 943 | 4.1% |
| Bio, Nature & Agricultural | 1,473 | 6.4% |
| Physical & Health Sciences | 1,016 | 4.4% |
| Psychology | 1,430 | 6.2% |
| Social Sciences | 2,267 | 9.9% |
| Engineering | 2,266 | 9.9% |
| Multidisciplinary Studies | 336 | 1.5% |
| Science & Technology | 2,002 | 8.7% |
| Business | 3,462 | 15.1% |
| Education | 1,974 | 8.6% |
| Literature & Languages | 1,012 | 4.4% |
| Liberal Arts & History | 1,581 | 6.9% |
| Visual & Performing Arts | 995 | 4.3% |
| Communications | 865 | 3.8% |
| Arts & Humanities | 1,287 | 5.6% |
| Total | 22,909 | 100.0% |
Transportation & Commute in Camarillo
Vehicle Availability by Sex in Camarillo
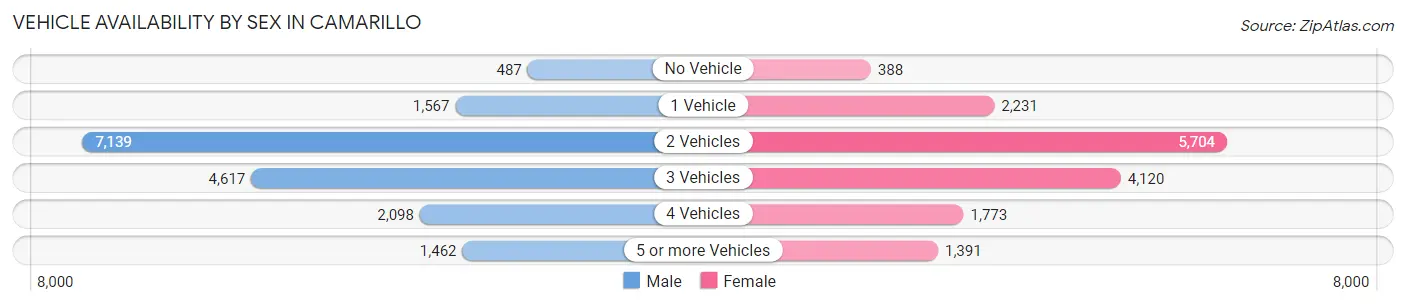
The most prevalent vehicle ownership categories in Camarillo are males with 2 vehicles (7,139, accounting for 41.1%) and females with 2 vehicles (5,704, making up 45.7%).
| Vehicles Available | Male | Female |
| No Vehicle | 487 (2.8%) | 388 (2.5%) |
| 1 Vehicle | 1,567 (9.0%) | 2,231 (14.3%) |
| 2 Vehicles | 7,139 (41.1%) | 5,704 (36.5%) |
| 3 Vehicles | 4,617 (26.6%) | 4,120 (26.4%) |
| 4 Vehicles | 2,098 (12.1%) | 1,773 (11.4%) |
| 5 or more Vehicles | 1,462 (8.4%) | 1,391 (8.9%) |
| Total | 17,370 (100.0%) | 15,607 (100.0%) |
Commute Time in Camarillo
The most frequently occuring commute durations in Camarillo are 15 to 19 minutes (5,582 commuters, 19.6%), 20 to 24 minutes (5,128 commuters, 18.0%), and 10 to 14 minutes (4,487 commuters, 15.7%).
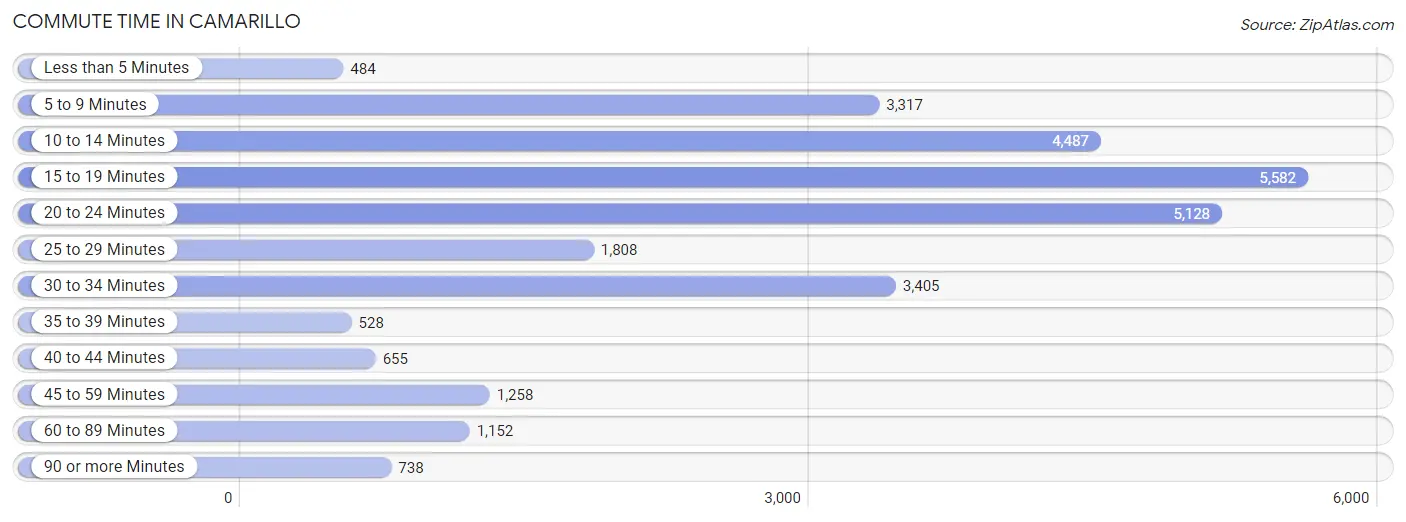
| Commute Time | # Commuters | % Commuters |
| Less than 5 Minutes | 484 | 1.7% |
| 5 to 9 Minutes | 3,317 | 11.6% |
| 10 to 14 Minutes | 4,487 | 15.7% |
| 15 to 19 Minutes | 5,582 | 19.6% |
| 20 to 24 Minutes | 5,128 | 18.0% |
| 25 to 29 Minutes | 1,808 | 6.3% |
| 30 to 34 Minutes | 3,405 | 11.9% |
| 35 to 39 Minutes | 528 | 1.8% |
| 40 to 44 Minutes | 655 | 2.3% |
| 45 to 59 Minutes | 1,258 | 4.4% |
| 60 to 89 Minutes | 1,152 | 4.0% |
| 90 or more Minutes | 738 | 2.6% |
Commute Time by Sex in Camarillo
The most common commute times in Camarillo are 15 to 19 minutes (2,936 commuters, 19.2%) for males and 15 to 19 minutes (2,646 commuters, 20.0%) for females.
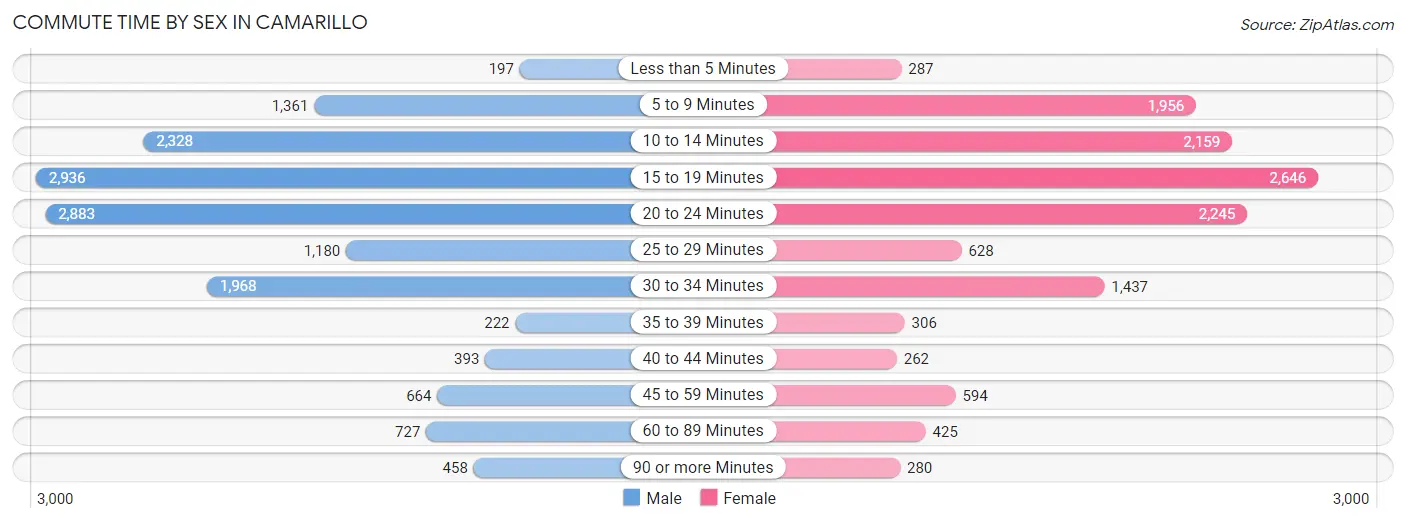
| Commute Time | Male | Female |
| Less than 5 Minutes | 197 (1.3%) | 287 (2.2%) |
| 5 to 9 Minutes | 1,361 (8.9%) | 1,956 (14.8%) |
| 10 to 14 Minutes | 2,328 (15.2%) | 2,159 (16.3%) |
| 15 to 19 Minutes | 2,936 (19.2%) | 2,646 (20.0%) |
| 20 to 24 Minutes | 2,883 (18.8%) | 2,245 (17.0%) |
| 25 to 29 Minutes | 1,180 (7.7%) | 628 (4.8%) |
| 30 to 34 Minutes | 1,968 (12.9%) | 1,437 (10.9%) |
| 35 to 39 Minutes | 222 (1.5%) | 306 (2.3%) |
| 40 to 44 Minutes | 393 (2.6%) | 262 (2.0%) |
| 45 to 59 Minutes | 664 (4.3%) | 594 (4.5%) |
| 60 to 89 Minutes | 727 (4.8%) | 425 (3.2%) |
| 90 or more Minutes | 458 (3.0%) | 280 (2.1%) |
Time of Departure to Work by Sex in Camarillo
The most frequent times of departure to work in Camarillo are 7:00 AM to 7:29 AM (2,161, 14.1%) for males and 7:30 AM to 7:59 AM (2,122, 16.1%) for females.
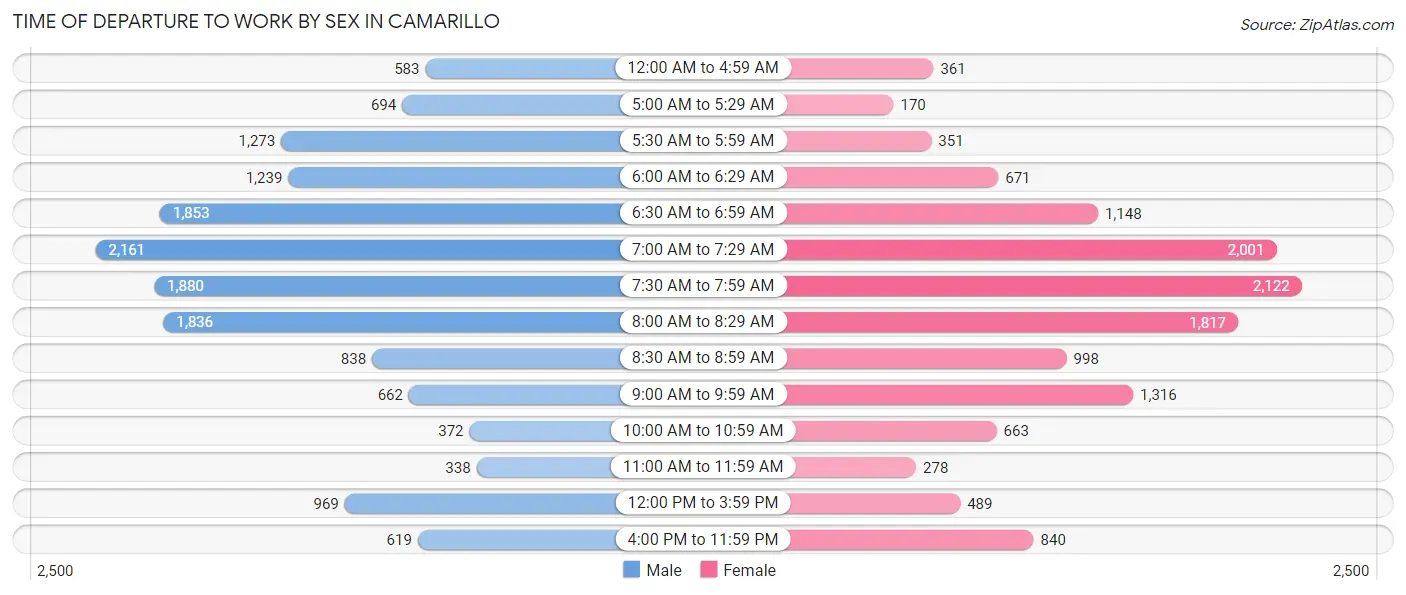
| Time of Departure | Male | Female |
| 12:00 AM to 4:59 AM | 583 (3.8%) | 361 (2.7%) |
| 5:00 AM to 5:29 AM | 694 (4.5%) | 170 (1.3%) |
| 5:30 AM to 5:59 AM | 1,273 (8.3%) | 351 (2.6%) |
| 6:00 AM to 6:29 AM | 1,239 (8.1%) | 671 (5.1%) |
| 6:30 AM to 6:59 AM | 1,853 (12.1%) | 1,148 (8.7%) |
| 7:00 AM to 7:29 AM | 2,161 (14.1%) | 2,001 (15.1%) |
| 7:30 AM to 7:59 AM | 1,880 (12.3%) | 2,122 (16.1%) |
| 8:00 AM to 8:29 AM | 1,836 (12.0%) | 1,817 (13.7%) |
| 8:30 AM to 8:59 AM | 838 (5.5%) | 998 (7.5%) |
| 9:00 AM to 9:59 AM | 662 (4.3%) | 1,316 (10.0%) |
| 10:00 AM to 10:59 AM | 372 (2.4%) | 663 (5.0%) |
| 11:00 AM to 11:59 AM | 338 (2.2%) | 278 (2.1%) |
| 12:00 PM to 3:59 PM | 969 (6.3%) | 489 (3.7%) |
| 4:00 PM to 11:59 PM | 619 (4.0%) | 840 (6.4%) |
| Total | 15,317 (100.0%) | 13,225 (100.0%) |
Housing Occupancy in Camarillo
Occupancy by Ownership in Camarillo
Of the total 25,939 dwellings in Camarillo, owner-occupied units account for 16,790 (64.7%), while renter-occupied units make up 9,149 (35.3%).
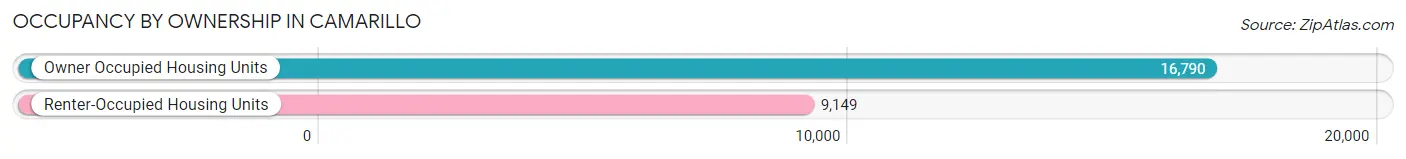
| Occupancy | # Housing Units | % Housing Units |
| Owner Occupied Housing Units | 16,790 | 64.7% |
| Renter-Occupied Housing Units | 9,149 | 35.3% |
| Total Occupied Housing Units | 25,939 | 100.0% |
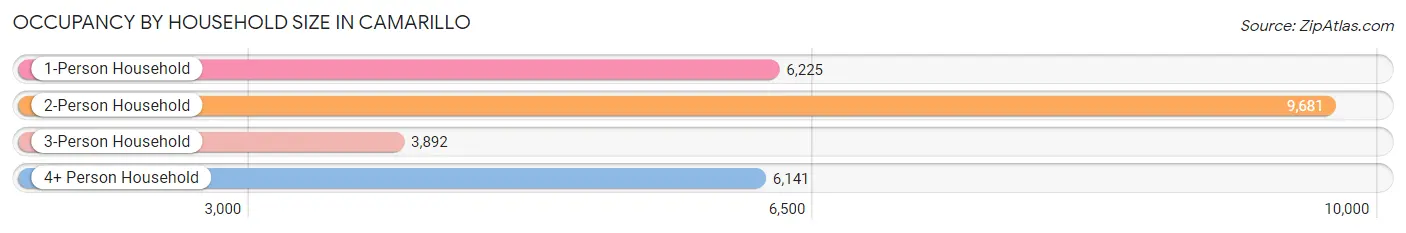
Occupancy by Household Size in Camarillo
| Household Size | # Housing Units | % Housing Units |
| 1-Person Household | 6,225 | 24.0% |
| 2-Person Household | 9,681 | 37.3% |
| 3-Person Household | 3,892 | 15.0% |
| 4+ Person Household | 6,141 | 23.7% |
| Total Housing Units | 25,939 | 100.0% |
Occupancy by Ownership by Household Size in Camarillo
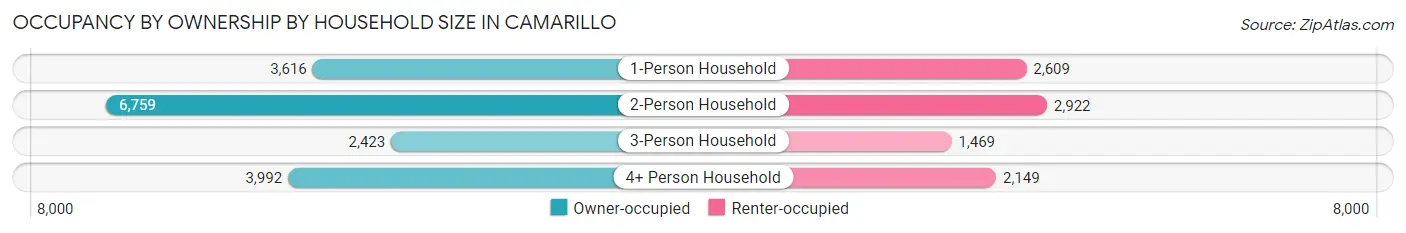
| Household Size | Owner-occupied | Renter-occupied |
| 1-Person Household | 3,616 (58.1%) | 2,609 (41.9%) |
| 2-Person Household | 6,759 (69.8%) | 2,922 (30.2%) |
| 3-Person Household | 2,423 (62.3%) | 1,469 (37.7%) |
| 4+ Person Household | 3,992 (65.0%) | 2,149 (35.0%) |
| Total Housing Units | 16,790 (64.7%) | 9,149 (35.3%) |
Occupancy by Educational Attainment in Camarillo
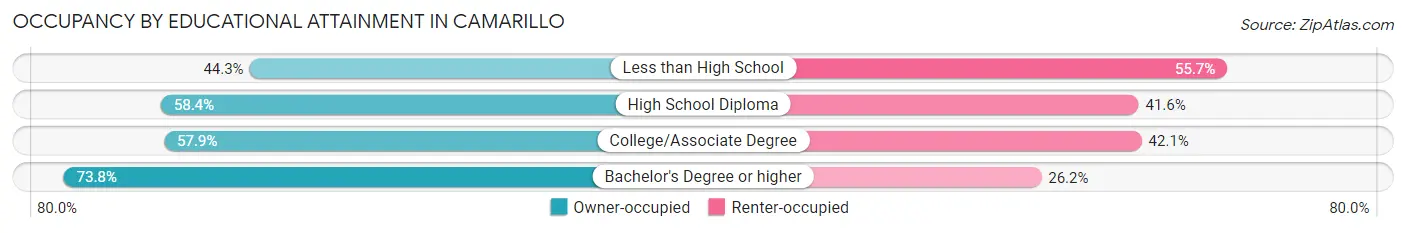
| Household Size | Owner-occupied | Renter-occupied |
| Less than High School | 439 (44.3%) | 551 (55.7%) |
| High School Diploma | 2,129 (58.4%) | 1,518 (41.6%) |
| College/Associate Degree | 5,459 (57.9%) | 3,971 (42.1%) |
| Bachelor's Degree or higher | 8,763 (73.8%) | 3,109 (26.2%) |
Occupancy by Age of Householder in Camarillo
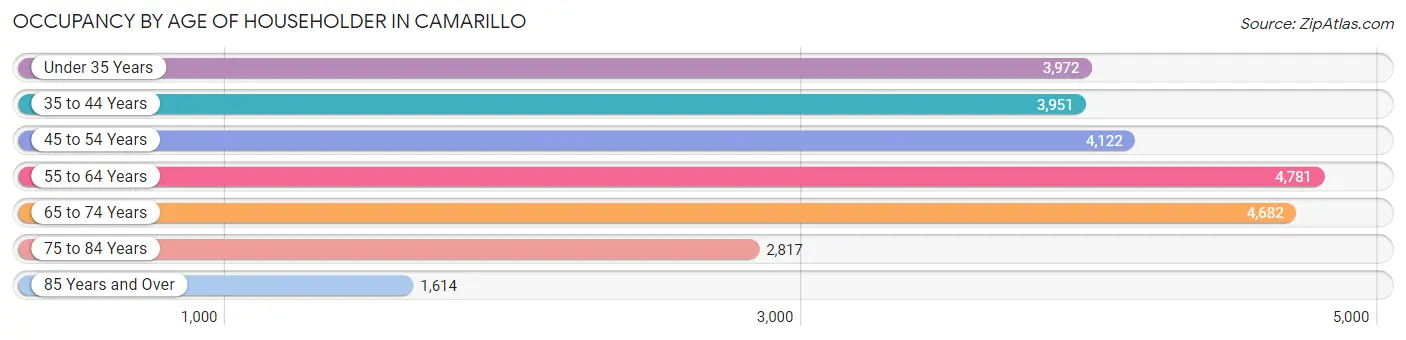
| Age Bracket | # Households | % Households |
| Under 35 Years | 3,972 | 15.3% |
| 35 to 44 Years | 3,951 | 15.2% |
| 45 to 54 Years | 4,122 | 15.9% |
| 55 to 64 Years | 4,781 | 18.4% |
| 65 to 74 Years | 4,682 | 18.0% |
| 75 to 84 Years | 2,817 | 10.9% |
| 85 Years and Over | 1,614 | 6.2% |
| Total | 25,939 | 100.0% |
Housing Finances in Camarillo
Median Income by Occupancy in Camarillo
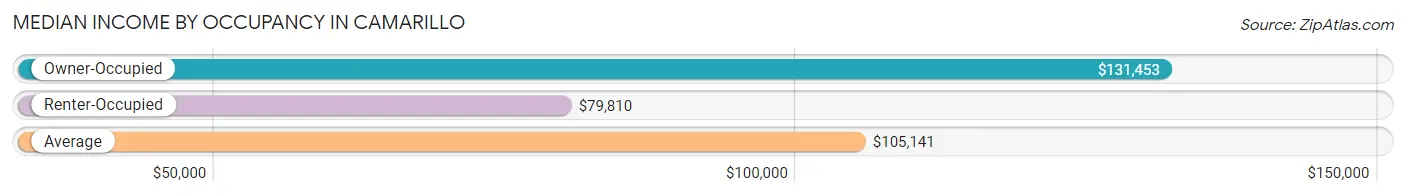
| Occupancy Type | # Households | Median Income |
| Owner-Occupied | 16,790 (64.7%) | $131,453 |
| Renter-Occupied | 9,149 (35.3%) | $79,810 |
| Average | 25,939 (100.0%) | $105,141 |
Occupancy by Householder Income Bracket in Camarillo
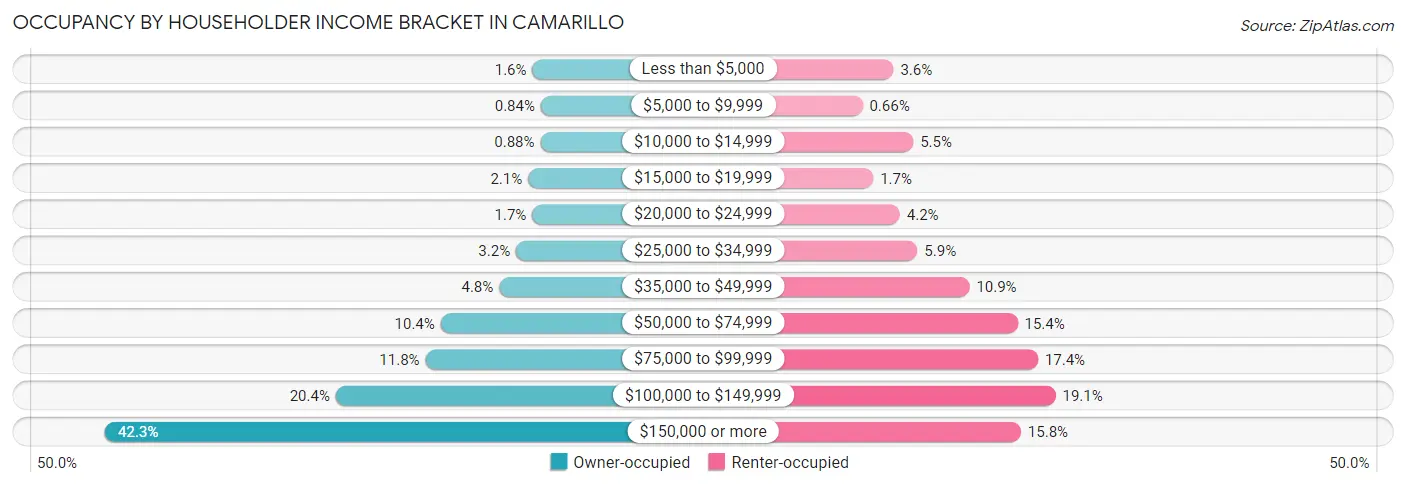
| Income Bracket | Owner-occupied | Renter-occupied |
| Less than $5,000 | 276 (1.6%) | 330 (3.6%) |
| $5,000 to $9,999 | 141 (0.8%) | 60 (0.7%) |
| $10,000 to $14,999 | 148 (0.9%) | 502 (5.5%) |
| $15,000 to $19,999 | 344 (2.1%) | 154 (1.7%) |
| $20,000 to $24,999 | 278 (1.7%) | 386 (4.2%) |
| $25,000 to $34,999 | 538 (3.2%) | 539 (5.9%) |
| $35,000 to $49,999 | 808 (4.8%) | 993 (10.8%) |
| $50,000 to $74,999 | 1,742 (10.4%) | 1,412 (15.4%) |
| $75,000 to $99,999 | 1,986 (11.8%) | 1,589 (17.4%) |
| $100,000 to $149,999 | 3,420 (20.4%) | 1,743 (19.1%) |
| $150,000 or more | 7,109 (42.3%) | 1,441 (15.8%) |
| Total | 16,790 (100.0%) | 9,149 (100.0%) |
Monthly Housing Cost Tiers in Camarillo
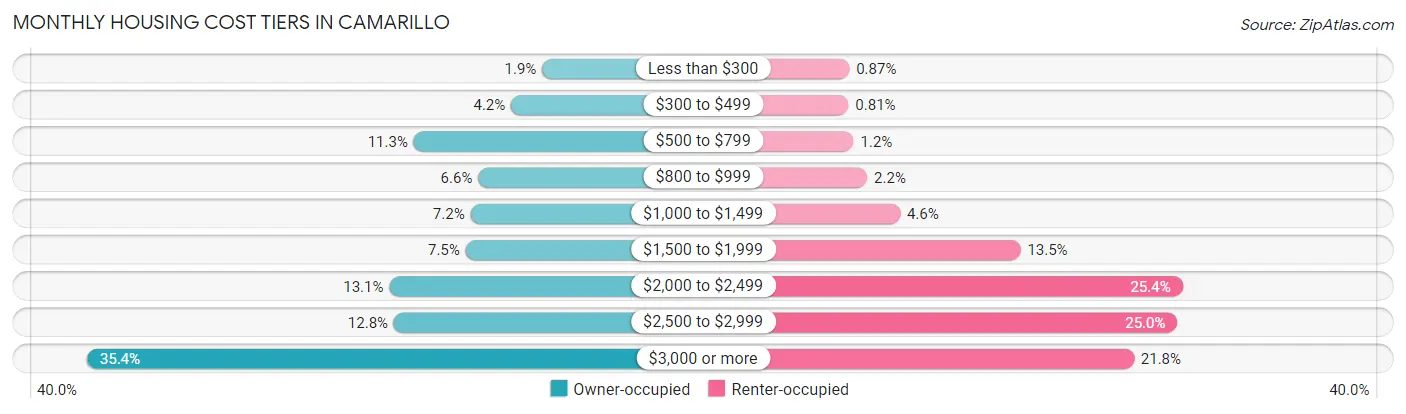
| Monthly Cost | Owner-occupied | Renter-occupied |
| Less than $300 | 315 (1.9%) | 80 (0.9%) |
| $300 to $499 | 700 (4.2%) | 74 (0.8%) |
| $500 to $799 | 1,904 (11.3%) | 109 (1.2%) |
| $800 to $999 | 1,106 (6.6%) | 200 (2.2%) |
| $1,000 to $1,499 | 1,202 (7.2%) | 422 (4.6%) |
| $1,500 to $1,999 | 1,262 (7.5%) | 1,233 (13.5%) |
| $2,000 to $2,499 | 2,206 (13.1%) | 2,325 (25.4%) |
| $2,500 to $2,999 | 2,149 (12.8%) | 2,290 (25.0%) |
| $3,000 or more | 5,946 (35.4%) | 1,997 (21.8%) |
| Total | 16,790 (100.0%) | 9,149 (100.0%) |
Physical Housing Characteristics in Camarillo
Housing Structures in Camarillo
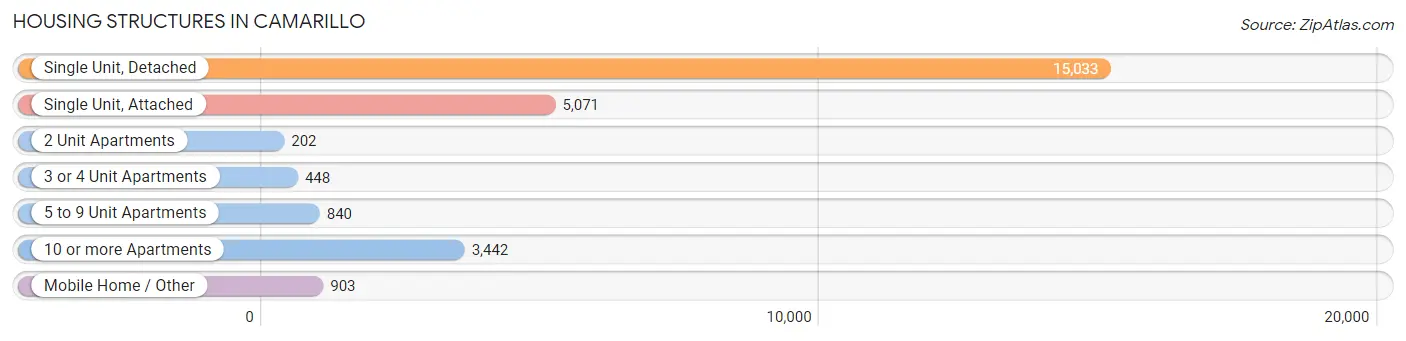
| Structure Type | # Housing Units | % Housing Units |
| Single Unit, Detached | 15,033 | 58.0% |
| Single Unit, Attached | 5,071 | 19.6% |
| 2 Unit Apartments | 202 | 0.8% |
| 3 or 4 Unit Apartments | 448 | 1.7% |
| 5 to 9 Unit Apartments | 840 | 3.2% |
| 10 or more Apartments | 3,442 | 13.3% |
| Mobile Home / Other | 903 | 3.5% |
| Total | 25,939 | 100.0% |
Housing Structures by Occupancy in Camarillo
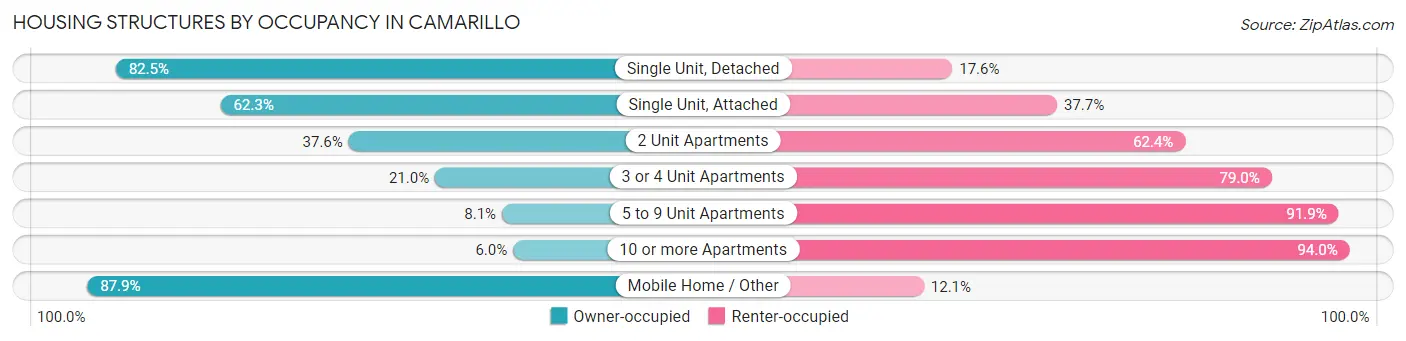
| Structure Type | Owner-occupied | Renter-occupied |
| Single Unit, Detached | 12,395 (82.5%) | 2,638 (17.5%) |
| Single Unit, Attached | 3,158 (62.3%) | 1,913 (37.7%) |
| 2 Unit Apartments | 76 (37.6%) | 126 (62.4%) |
| 3 or 4 Unit Apartments | 94 (21.0%) | 354 (79.0%) |
| 5 to 9 Unit Apartments | 68 (8.1%) | 772 (91.9%) |
| 10 or more Apartments | 205 (6.0%) | 3,237 (94.0%) |
| Mobile Home / Other | 794 (87.9%) | 109 (12.1%) |
| Total | 16,790 (64.7%) | 9,149 (35.3%) |
Housing Structures by Number of Rooms in Camarillo
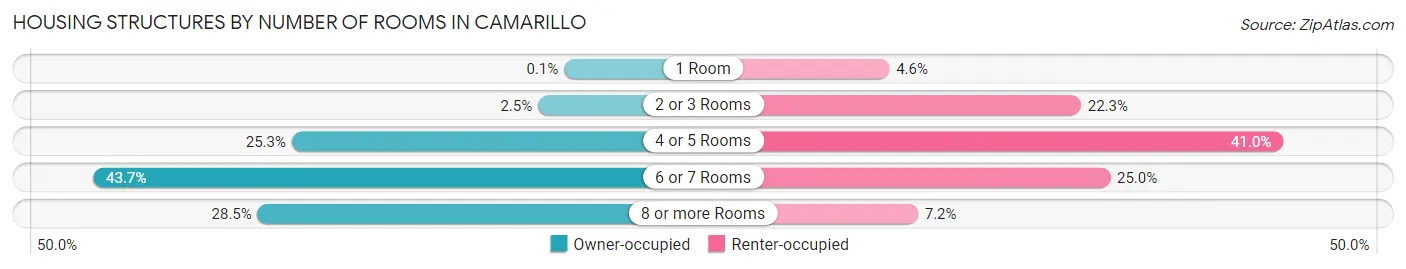
| Number of Rooms | Owner-occupied | Renter-occupied |
| 1 Room | 16 (0.1%) | 417 (4.6%) |
| 2 or 3 Rooms | 421 (2.5%) | 2,038 (22.3%) |
| 4 or 5 Rooms | 4,246 (25.3%) | 3,750 (41.0%) |
| 6 or 7 Rooms | 7,331 (43.7%) | 2,285 (25.0%) |
| 8 or more Rooms | 4,776 (28.4%) | 659 (7.2%) |
| Total | 16,790 (100.0%) | 9,149 (100.0%) |
Housing Structure by Heating Type in Camarillo
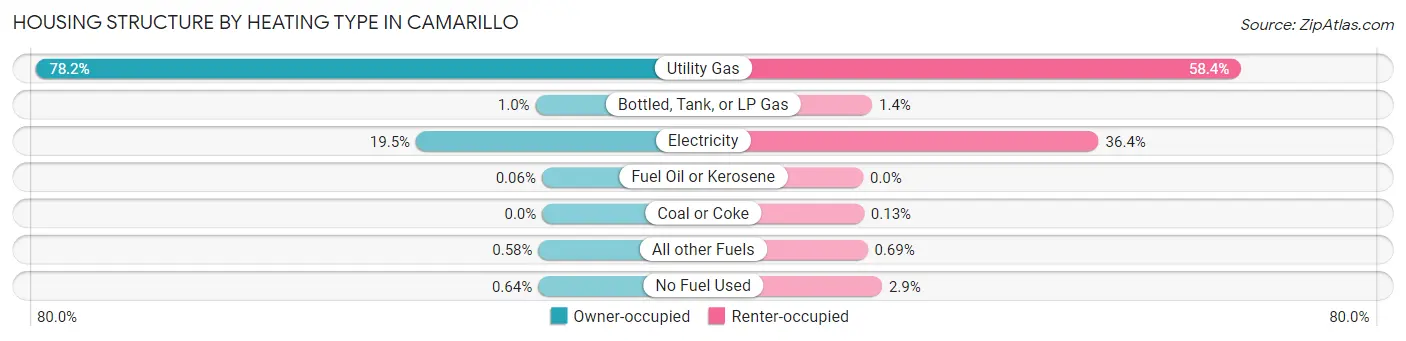
| Heating Type | Owner-occupied | Renter-occupied |
| Utility Gas | 13,128 (78.2%) | 5,346 (58.4%) |
| Bottled, Tank, or LP Gas | 173 (1.0%) | 128 (1.4%) |
| Electricity | 3,275 (19.5%) | 3,332 (36.4%) |
| Fuel Oil or Kerosene | 10 (0.1%) | 0 (0.0%) |
| Coal or Coke | 0 (0.0%) | 12 (0.1%) |
| All other Fuels | 97 (0.6%) | 63 (0.7%) |
| No Fuel Used | 107 (0.6%) | 268 (2.9%) |
| Total | 16,790 (100.0%) | 9,149 (100.0%) |
Household Vehicle Usage in Camarillo
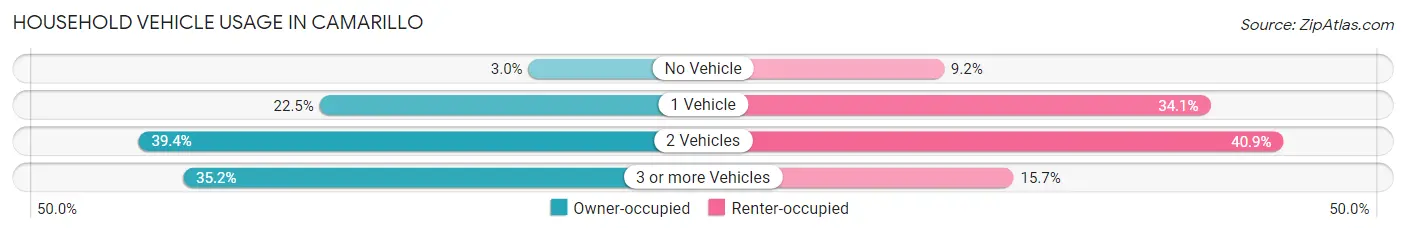
| Vehicles per Household | Owner-occupied | Renter-occupied |
| No Vehicle | 498 (3.0%) | 845 (9.2%) |
| 1 Vehicle | 3,771 (22.5%) | 3,120 (34.1%) |
| 2 Vehicles | 6,611 (39.4%) | 3,744 (40.9%) |
| 3 or more Vehicles | 5,910 (35.2%) | 1,440 (15.7%) |
| Total | 16,790 (100.0%) | 9,149 (100.0%) |
Real Estate & Mortgages in Camarillo
Real Estate and Mortgage Overview in Camarillo
| Characteristic | Without Mortgage | With Mortgage |
| Housing Units | 4,874 | 11,916 |
| Median Property Value | $662,400 | $735,400 |
| Median Household Income | $83,409 | $5,927 |
| Monthly Housing Costs | $753 | $5,869 |
| Real Estate Taxes | $3,634 | $219 |
Property Value by Mortgage Status in Camarillo
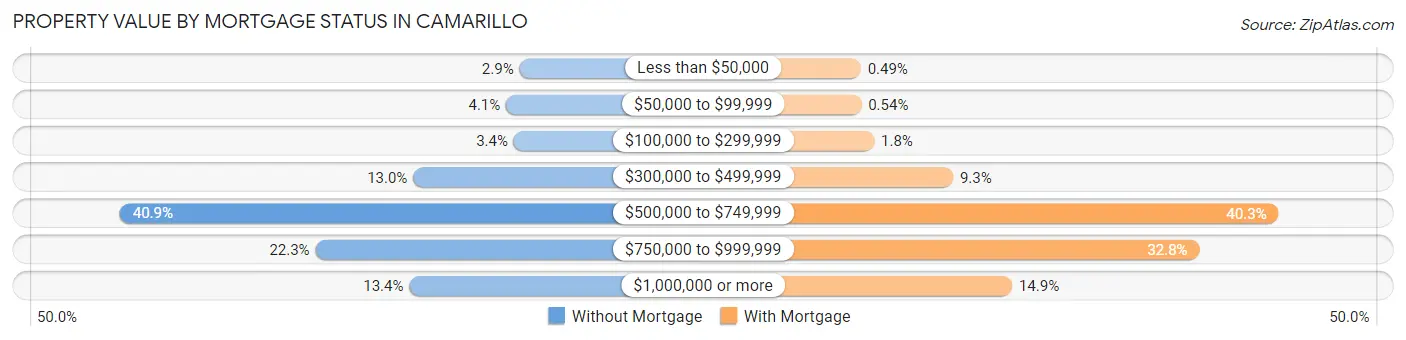
| Property Value | Without Mortgage | With Mortgage |
| Less than $50,000 | 140 (2.9%) | 58 (0.5%) |
| $50,000 to $99,999 | 202 (4.1%) | 64 (0.5%) |
| $100,000 to $299,999 | 166 (3.4%) | 211 (1.8%) |
| $300,000 to $499,999 | 633 (13.0%) | 1,106 (9.3%) |
| $500,000 to $749,999 | 1,995 (40.9%) | 4,800 (40.3%) |
| $750,000 to $999,999 | 1,087 (22.3%) | 3,902 (32.8%) |
| $1,000,000 or more | 651 (13.4%) | 1,775 (14.9%) |
| Total | 4,874 (100.0%) | 11,916 (100.0%) |
Household Income by Mortgage Status in Camarillo
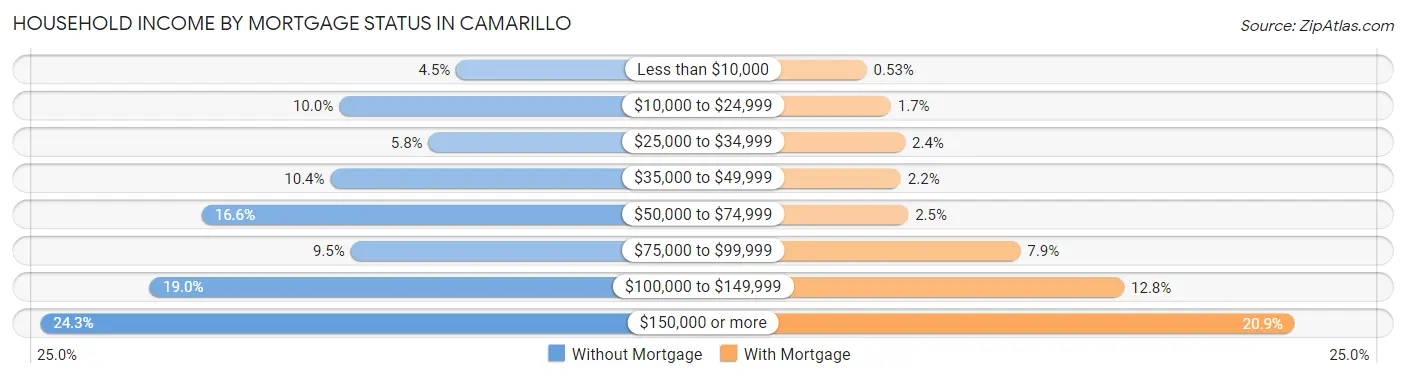
| Household Income | Without Mortgage | With Mortgage |
| Less than $10,000 | 217 (4.4%) | 63 (0.5%) |
| $10,000 to $24,999 | 489 (10.0%) | 200 (1.7%) |
| $25,000 to $34,999 | 281 (5.8%) | 281 (2.4%) |
| $35,000 to $49,999 | 509 (10.4%) | 257 (2.2%) |
| $50,000 to $74,999 | 807 (16.6%) | 299 (2.5%) |
| $75,000 to $99,999 | 462 (9.5%) | 935 (7.9%) |
| $100,000 to $149,999 | 927 (19.0%) | 1,524 (12.8%) |
| $150,000 or more | 1,182 (24.2%) | 2,493 (20.9%) |
| Total | 4,874 (100.0%) | 11,916 (100.0%) |
Property Value to Household Income Ratio in Camarillo
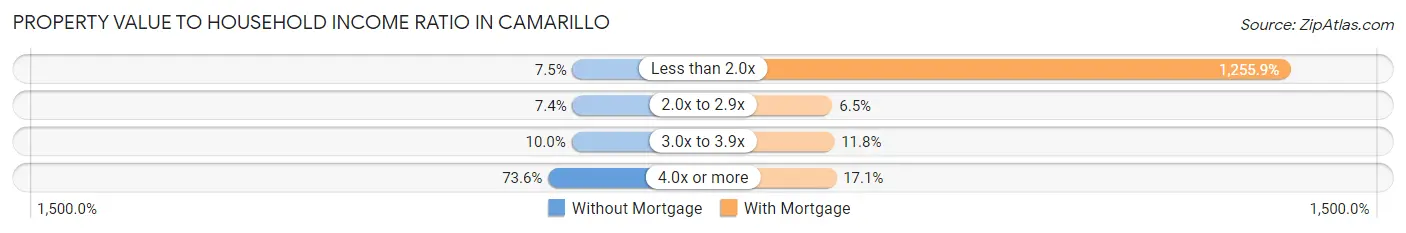
| Value-to-Income Ratio | Without Mortgage | With Mortgage |
| Less than 2.0x | 365 (7.5%) | 149,649 (1,255.9%) |
| 2.0x to 2.9x | 361 (7.4%) | 778 (6.5%) |
| 3.0x to 3.9x | 489 (10.0%) | 1,401 (11.8%) |
| 4.0x or more | 3,588 (73.6%) | 2,038 (17.1%) |
| Total | 4,874 (100.0%) | 11,916 (100.0%) |
Real Estate Taxes by Mortgage Status in Camarillo
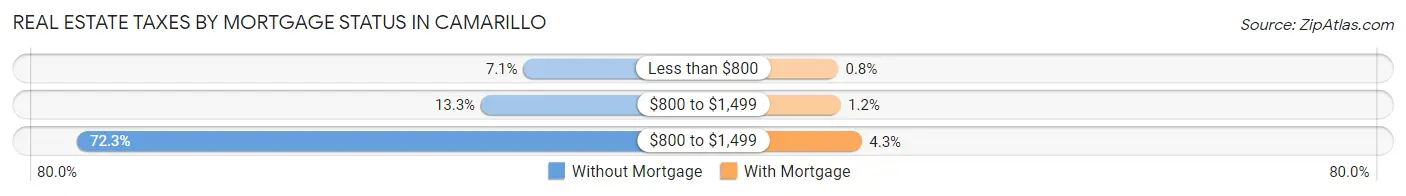
| Property Taxes | Without Mortgage | With Mortgage |
| Less than $800 | 347 (7.1%) | 95 (0.8%) |
| $800 to $1,499 | 649 (13.3%) | 141 (1.2%) |
| $800 to $1,499 | 3,525 (72.3%) | 510 (4.3%) |
| Total | 4,874 (100.0%) | 11,916 (100.0%) |
Health & Disability in Camarillo
Health Insurance Coverage by Age in Camarillo
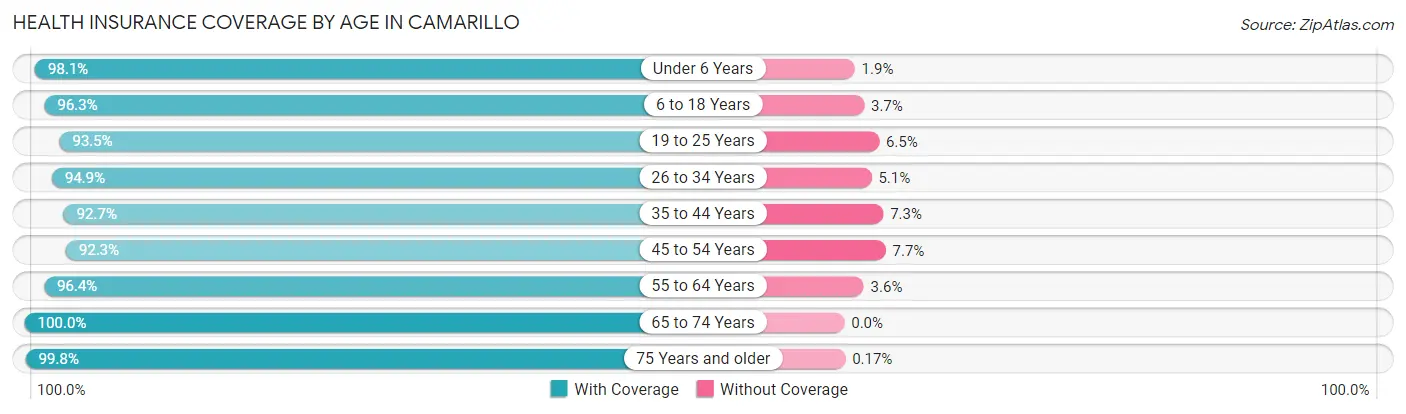
| Age Bracket | With Coverage | Without Coverage |
| Under 6 Years | 5,040 (98.1%) | 99 (1.9%) |
| 6 to 18 Years | 10,076 (96.3%) | 385 (3.7%) |
| 19 to 25 Years | 5,308 (93.5%) | 367 (6.5%) |
| 26 to 34 Years | 8,261 (94.9%) | 441 (5.1%) |
| 35 to 44 Years | 7,280 (92.7%) | 570 (7.3%) |
| 45 to 54 Years | 7,009 (92.3%) | 585 (7.7%) |
| 55 to 64 Years | 8,511 (96.4%) | 319 (3.6%) |
| 65 to 74 Years | 8,178 (100.0%) | 0 (0.0%) |
| 75 Years and older | 6,555 (99.8%) | 11 (0.2%) |
| Total | 66,218 (96.0%) | 2,777 (4.0%) |
Health Insurance Coverage by Citizenship Status in Camarillo
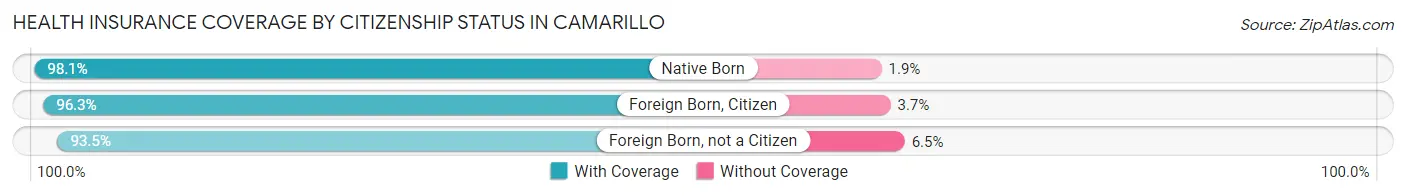
| Citizenship Status | With Coverage | Without Coverage |
| Native Born | 5,040 (98.1%) | 99 (1.9%) |
| Foreign Born, Citizen | 10,076 (96.3%) | 385 (3.7%) |
| Foreign Born, not a Citizen | 5,308 (93.5%) | 367 (6.5%) |
Health Insurance Coverage by Household Income in Camarillo
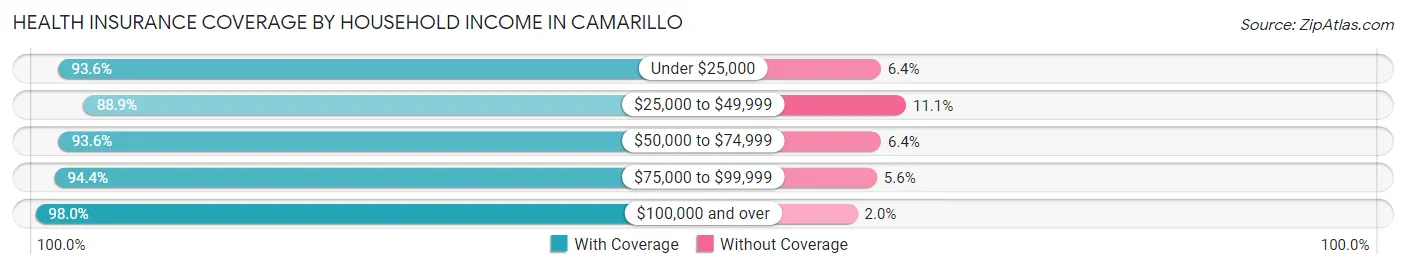
| Household Income | With Coverage | Without Coverage |
| Under $25,000 | 3,734 (93.6%) | 254 (6.4%) |
| $25,000 to $49,999 | 5,196 (88.9%) | 649 (11.1%) |
| $50,000 to $74,999 | 7,246 (93.6%) | 498 (6.4%) |
| $75,000 to $99,999 | 8,556 (94.4%) | 511 (5.6%) |
| $100,000 and over | 41,194 (98.0%) | 854 (2.0%) |
Public vs Private Health Insurance Coverage by Age in Camarillo
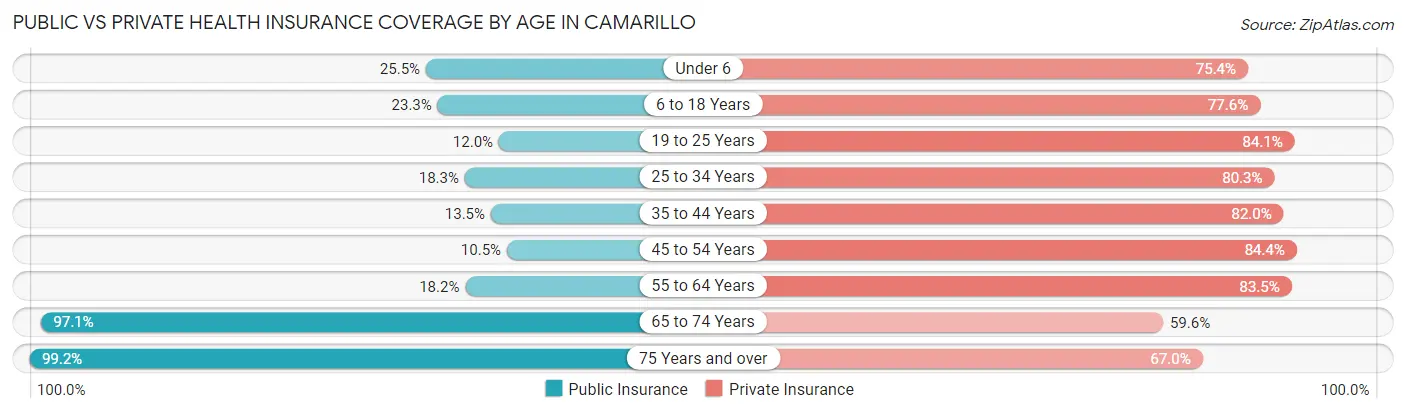
| Age Bracket | Public Insurance | Private Insurance |
| Under 6 | 1,311 (25.5%) | 3,873 (75.4%) |
| 6 to 18 Years | 2,442 (23.3%) | 8,120 (77.6%) |
| 19 to 25 Years | 679 (12.0%) | 4,770 (84.1%) |
| 25 to 34 Years | 1,592 (18.3%) | 6,985 (80.3%) |
| 35 to 44 Years | 1,057 (13.5%) | 6,436 (82.0%) |
| 45 to 54 Years | 796 (10.5%) | 6,412 (84.4%) |
| 55 to 64 Years | 1,608 (18.2%) | 7,371 (83.5%) |
| 65 to 74 Years | 7,938 (97.1%) | 4,876 (59.6%) |
| 75 Years and over | 6,513 (99.2%) | 4,396 (66.9%) |
| Total | 23,936 (34.7%) | 53,239 (77.2%) |
Disability Status by Sex by Age in Camarillo
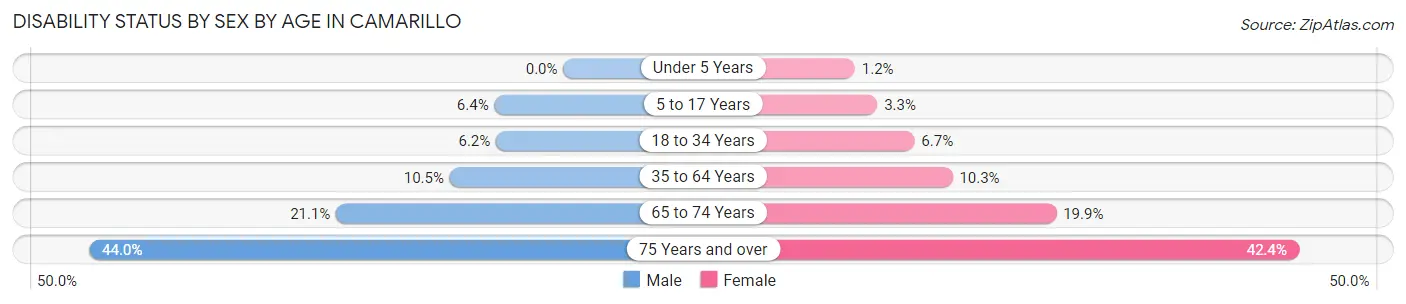
| Age Bracket | Male | Female |
| Under 5 Years | 0 (0.0%) | 24 (1.2%) |
| 5 to 17 Years | 352 (6.4%) | 151 (3.3%) |
| 18 to 34 Years | 453 (6.2%) | 554 (6.7%) |
| 35 to 64 Years | 1,223 (10.5%) | 1,302 (10.3%) |
| 65 to 74 Years | 793 (21.1%) | 879 (19.9%) |
| 75 Years and over | 1,087 (44.0%) | 1,737 (42.4%) |
Disability Class by Sex by Age in Camarillo
Disability Class: Hearing Difficulty
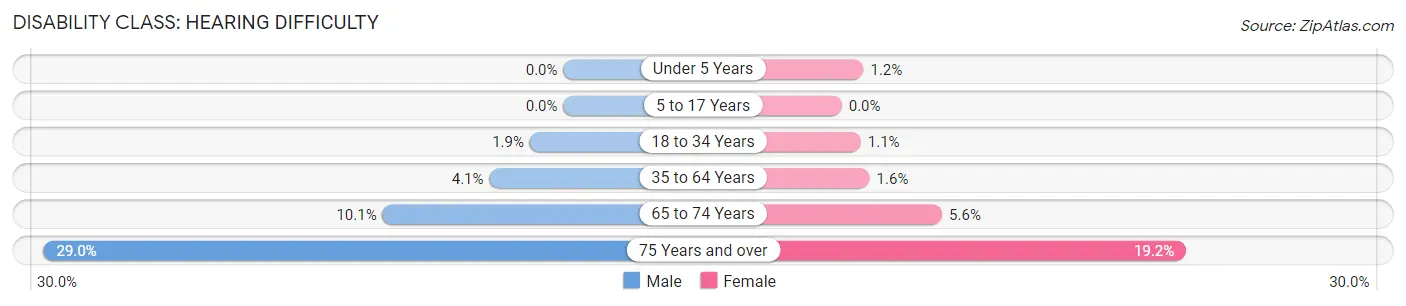
| Age Bracket | Male | Female |
| Under 5 Years | 0 (0.0%) | 24 (1.2%) |
| 5 to 17 Years | 0 (0.0%) | 0 (0.0%) |
| 18 to 34 Years | 136 (1.9%) | 87 (1.1%) |
| 35 to 64 Years | 478 (4.1%) | 197 (1.5%) |
| 65 to 74 Years | 379 (10.1%) | 247 (5.6%) |
| 75 Years and over | 715 (28.9%) | 785 (19.2%) |
Disability Class: Vision Difficulty
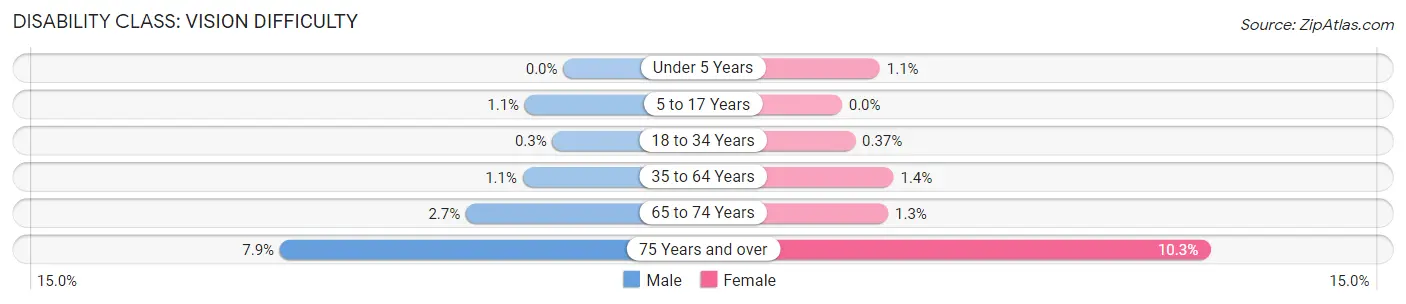
| Age Bracket | Male | Female |
| Under 5 Years | 0 (0.0%) | 21 (1.1%) |
| 5 to 17 Years | 59 (1.1%) | 0 (0.0%) |
| 18 to 34 Years | 22 (0.3%) | 30 (0.4%) |
| 35 to 64 Years | 131 (1.1%) | 183 (1.4%) |
| 65 to 74 Years | 102 (2.7%) | 57 (1.3%) |
| 75 Years and over | 195 (7.9%) | 420 (10.2%) |
Disability Class: Cognitive Difficulty
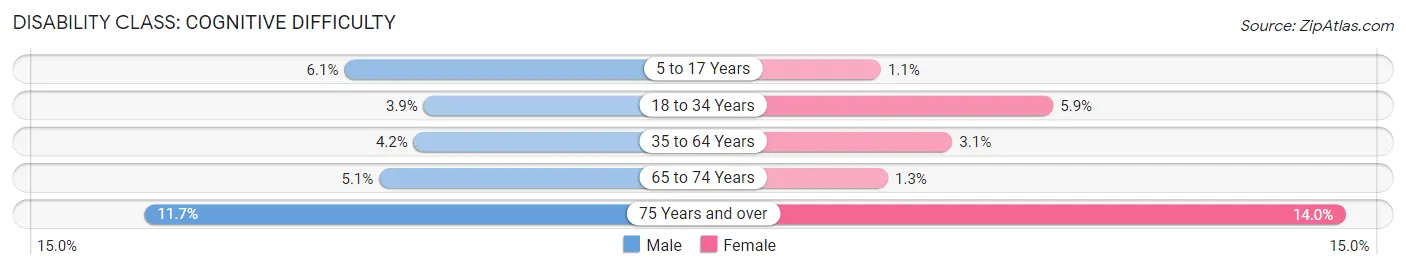
| Age Bracket | Male | Female |
| 5 to 17 Years | 336 (6.1%) | 50 (1.1%) |
| 18 to 34 Years | 282 (3.9%) | 484 (5.9%) |
| 35 to 64 Years | 484 (4.2%) | 390 (3.1%) |
| 65 to 74 Years | 193 (5.1%) | 57 (1.3%) |
| 75 Years and over | 288 (11.7%) | 574 (14.0%) |
Disability Class: Ambulatory Difficulty
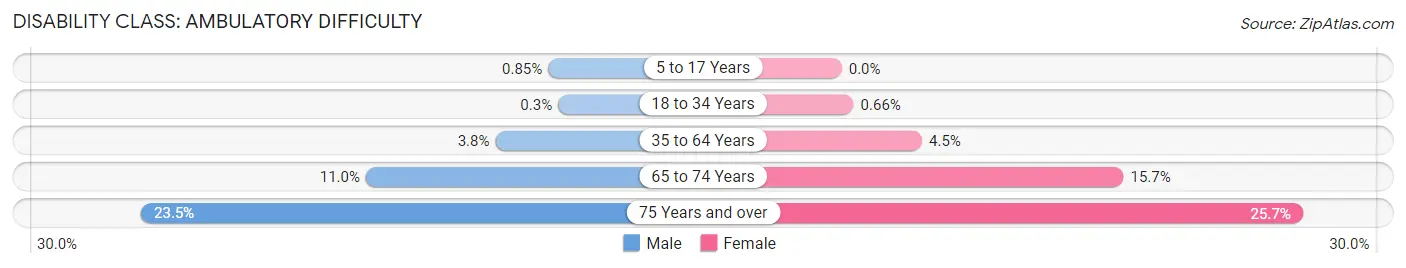
| Age Bracket | Male | Female |
| 5 to 17 Years | 47 (0.9%) | 0 (0.0%) |
| 18 to 34 Years | 22 (0.3%) | 54 (0.7%) |
| 35 to 64 Years | 440 (3.8%) | 566 (4.5%) |
| 65 to 74 Years | 414 (11.0%) | 693 (15.7%) |
| 75 Years and over | 581 (23.5%) | 1,051 (25.7%) |
Disability Class: Self-Care Difficulty
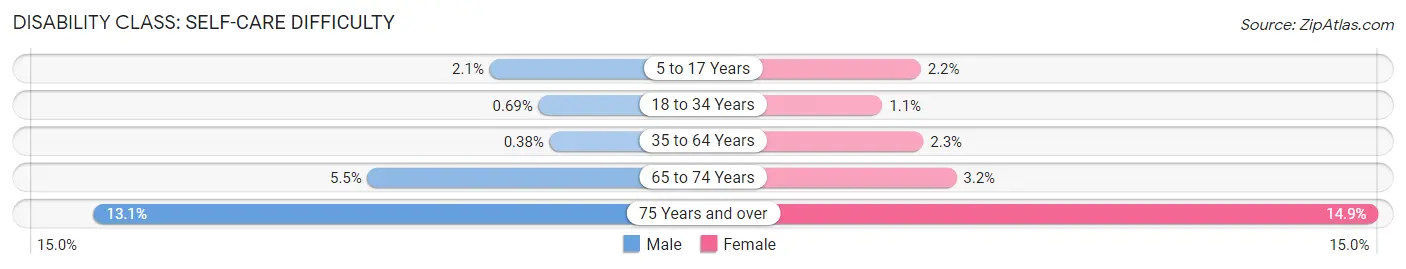
| Age Bracket | Male | Female |
| 5 to 17 Years | 113 (2.1%) | 101 (2.2%) |
| 18 to 34 Years | 50 (0.7%) | 93 (1.1%) |
| 35 to 64 Years | 44 (0.4%) | 288 (2.3%) |
| 65 to 74 Years | 205 (5.4%) | 141 (3.2%) |
| 75 Years and over | 323 (13.1%) | 612 (14.9%) |
Technology Access in Camarillo
Computing Device Access in Camarillo
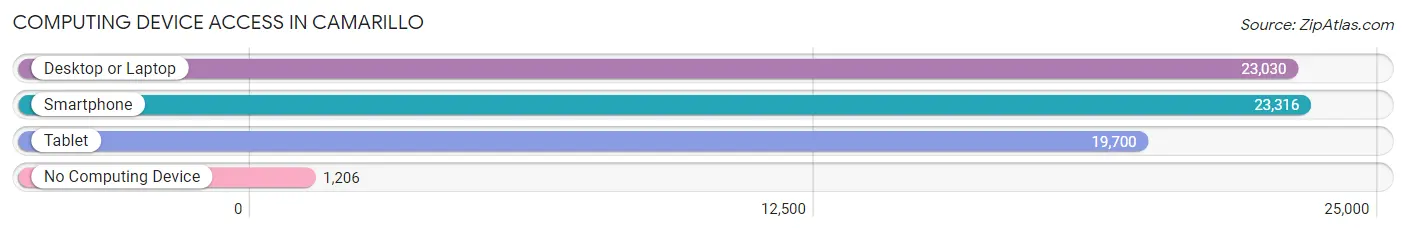
| Device Type | # Households | % Households |
| Desktop or Laptop | 23,030 | 88.8% |
| Smartphone | 23,316 | 89.9% |
| Tablet | 19,700 | 75.9% |
| No Computing Device | 1,206 | 4.6% |
| Total | 25,939 | 100.0% |
Internet Access in Camarillo
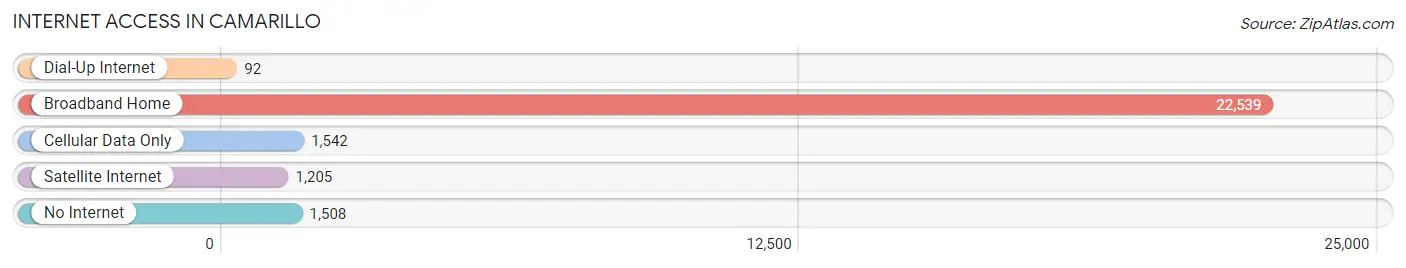
| Internet Type | # Households | % Households |
| Dial-Up Internet | 92 | 0.4% |
| Broadband Home | 22,539 | 86.9% |
| Cellular Data Only | 1,542 | 5.9% |
| Satellite Internet | 1,205 | 4.6% |
| No Internet | 1,508 | 5.8% |
| Total | 25,939 | 100.0% |
Camarillo Summary
Camarillo, California is a city located in Ventura County, California, United States. The city is situated in the western part of the county, about 37 miles northwest of downtown Los Angeles and 63 miles southeast of Santa Barbara. As of the 2010 census, the population of Camarillo was 65,201, making it the largest city in Ventura County.
History
The area of Camarillo was originally inhabited by the Chumash Native American tribe. The first Europeans to settle in the area were the Spanish, who established the Mission San Buenaventura in 1782. The area was later part of the Rancho Calleguas, a Mexican land grant given to Francisco Camarillo in 1837. The area was then part of the Rancho Calleguas, a Mexican land grant given to Francisco Camarillo in 1837.
In 1875, the area was purchased by Adolfo and Juan Camarillo, who established a cattle ranch. The area was then known as Camarillo Ranch. In 1887, Adolfo Camarillo opened a post office and the area was officially named Camarillo. The city was incorporated in 1964.
Geography
Camarillo is located at 34°14'N 119°2'W (34.23, -119.03). According to the United States Census Bureau, the city has a total area of 19.7 square miles, of which 19.6 square miles is land and 0.1 square miles (0.51%) is water.
The city is located in the western part of Ventura County, about 37 miles northwest of downtown Los Angeles and 63 miles southeast of Santa Barbara. The city is bordered by the cities of Oxnard to the northwest, Thousand Oaks to the northeast, and Simi Valley to the east.
Economy
Camarillo is home to a variety of businesses, including manufacturing, retail, and service industries. The city is also home to the Camarillo Airport, which is a general aviation airport.
The largest employers in Camarillo are the Camarillo Unified School District, the County of Ventura, and the City of Camarillo. Other major employers include Amgen, Inc., Camarillo Health Care District, and the Camarillo Premium Outlets.
Demographics
As of the 2010 census, there were 65,201 people, 22,945 households, and 17,844 families residing in the city. The population density was 3,307.2 people per square mile. The racial makeup of the city was 74.2% White, 1.2% African American, 0.7% Native American, 11.2% Asian, 0.2% Pacific Islander, 8.3% from other races, and 4.2% from two or more races. Hispanic or Latino of any race were 20.7% of the population.
The median income for a household in the city was $76,843, and the median income for a family was $90,890. The per capita income for the city was $32,945. About 5.2% of families and 7.2% of the population were below the poverty line, including 8.7% of those under age 18 and 5.2% of those age 65 or over.
Common Questions
What is Per Capita Income in Camarillo?
Per Capita income in Camarillo is $52,817.
What is the Median Family Income in Camarillo?
Median Family Income in Camarillo is $126,566.
What is the Median Household income in Camarillo?
Median Household Income in Camarillo is $105,141.
What is Income or Wage Gap in Camarillo?
Income or Wage Gap in Camarillo is 36.9%.
Women in Camarillo earn 63.1 cents for every dollar earned by a man.
What is Family Income Deficit in Camarillo?
Family Income Deficit in Camarillo is $7,526.
Families that are below poverty line in Camarillo earn $7,526 less on average than the poverty threshold level.
What is Inequality or Gini Index in Camarillo?
Inequality or Gini Index in Camarillo is 0.45.
What is the Total Population of Camarillo?
Total Population of Camarillo is 70,622.
What is the Total Male Population of Camarillo?
Total Male Population of Camarillo is 34,271.
What is the Total Female Population of Camarillo?
Total Female Population of Camarillo is 36,351.
What is the Ratio of Males per 100 Females in Camarillo?
There are 94.28 Males per 100 Females in Camarillo.
What is the Ratio of Females per 100 Males in Camarillo?
There are 106.07 Females per 100 Males in Camarillo.
What is the Median Population Age in Camarillo?
Median Population Age in Camarillo is 40.3 Years.
What is the Average Family Size in Camarillo
Average Family Size in Camarillo is 3.2 People.
What is the Average Household Size in Camarillo
Average Household Size in Camarillo is 2.7 People.
How Large is the Labor Force in Camarillo?
There are 35,652 People in the Labor Forcein in Camarillo.
What is the Percentage of People in the Labor Force in Camarillo?
61.6% of People are in the Labor Force in Camarillo.
What is the Unemployment Rate in Camarillo?
Unemployment Rate in Camarillo is 4.8%.