Yucca Valley, CA Map & Demographics
Yucca Valley Map
Yucca Valley Overview
$32,378
PER CAPITA INCOME
$72,735
AVG FAMILY INCOME
$54,153
AVG HOUSEHOLD INCOME
18.9%
WAGE / INCOME GAP [ % ]
81.1¢/ $1
WAGE / INCOME GAP [ $ ]
$7,931
FAMILY INCOME DEFICIT
0.46
INEQUALITY / GINI INDEX
21,700
TOTAL POPULATION
10,396
MALE POPULATION
11,304
FEMALE POPULATION
91.97
MALES / 100 FEMALES
108.73
FEMALES / 100 MALES
39.9
MEDIAN AGE
3.1
AVG FAMILY SIZE
2.5
AVG HOUSEHOLD SIZE
9,757
LABOR FORCE [ PEOPLE ]
56.5%
PERCENT IN LABOR FORCE
7.6%
UNEMPLOYMENT RATE
Yucca Valley Zip Codes
Yucca Valley Area Codes
Income in Yucca Valley
Income Overview in Yucca Valley
Per Capita Income in Yucca Valley is $32,378, while median incomes of families and households are $72,735 and $54,153 respectively.
| Characteristic | Number | Measure |
| Per Capita Income | 21,700 | $32,378 |
| Median Family Income | 5,116 | $72,735 |
| Mean Family Income | 5,116 | $89,278 |
| Median Household Income | 8,734 | $54,153 |
| Mean Household Income | 8,734 | $79,066 |
| Income Deficit | 5,116 | $7,931 |
| Wage / Income Gap (%) | 21,700 | 18.94% |
| Wage / Income Gap ($) | 21,700 | 81.06¢ per $1 |
| Gini / Inequality Index | 21,700 | 0.46 |
Earnings by Sex in Yucca Valley
Average Earnings in Yucca Valley are $34,677, $38,847 for men and $31,489 for women, a difference of 18.9%.
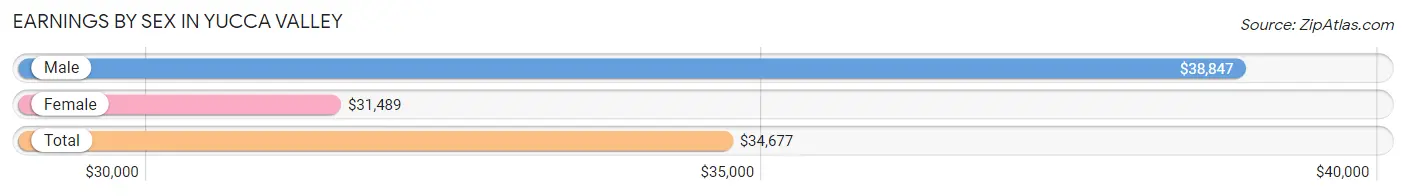
| Sex | Number | Average Earnings |
| Male | 5,385 (54.2%) | $38,847 |
| Female | 4,552 (45.8%) | $31,489 |
| Total | 9,937 (100.0%) | $34,677 |
Earnings by Sex by Income Bracket in Yucca Valley
The most common earnings brackets in Yucca Valley are $100,000+ for men (690 | 12.8%) and $25,000 to $29,999 for women (675 | 14.8%).
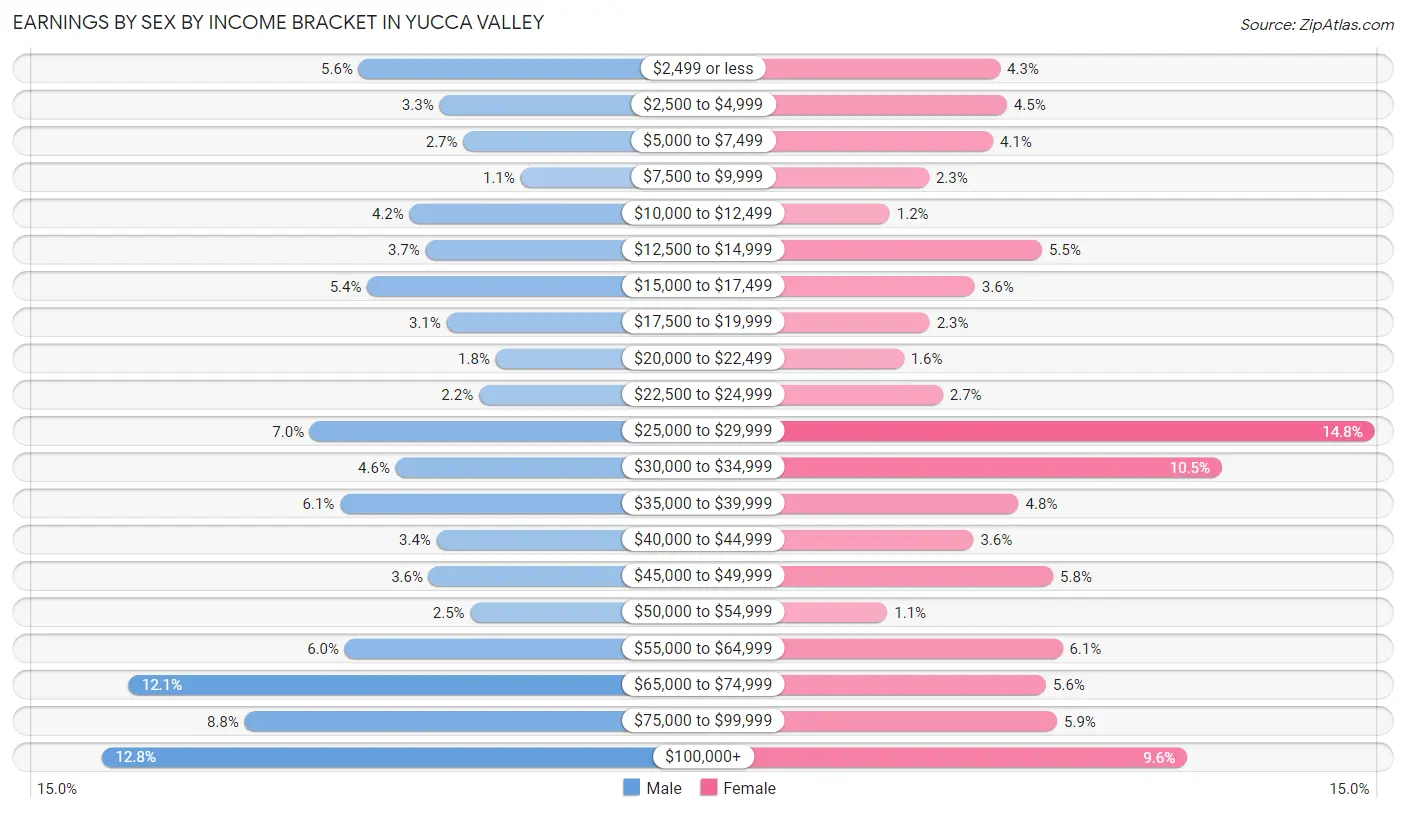
| Income | Male | Female |
| $2,499 or less | 302 (5.6%) | 196 (4.3%) |
| $2,500 to $4,999 | 180 (3.3%) | 205 (4.5%) |
| $5,000 to $7,499 | 144 (2.7%) | 187 (4.1%) |
| $7,500 to $9,999 | 57 (1.1%) | 105 (2.3%) |
| $10,000 to $12,499 | 225 (4.2%) | 55 (1.2%) |
| $12,500 to $14,999 | 201 (3.7%) | 250 (5.5%) |
| $15,000 to $17,499 | 289 (5.4%) | 164 (3.6%) |
| $17,500 to $19,999 | 169 (3.1%) | 106 (2.3%) |
| $20,000 to $22,499 | 95 (1.8%) | 73 (1.6%) |
| $22,500 to $24,999 | 120 (2.2%) | 123 (2.7%) |
| $25,000 to $29,999 | 376 (7.0%) | 675 (14.8%) |
| $30,000 to $34,999 | 246 (4.6%) | 480 (10.5%) |
| $35,000 to $39,999 | 330 (6.1%) | 220 (4.8%) |
| $40,000 to $44,999 | 184 (3.4%) | 162 (3.6%) |
| $45,000 to $49,999 | 196 (3.6%) | 264 (5.8%) |
| $50,000 to $54,999 | 133 (2.5%) | 52 (1.1%) |
| $55,000 to $64,999 | 323 (6.0%) | 276 (6.1%) |
| $65,000 to $74,999 | 650 (12.1%) | 255 (5.6%) |
| $75,000 to $99,999 | 475 (8.8%) | 269 (5.9%) |
| $100,000+ | 690 (12.8%) | 435 (9.6%) |
| Total | 5,385 (100.0%) | 4,552 (100.0%) |
Earnings by Sex by Educational Attainment in Yucca Valley
Average earnings in Yucca Valley are $46,724 for men and $35,335 for women, a difference of 24.4%. Men with an educational attainment of graduate degree enjoy the highest average annual earnings of $79,550, while those with less than high school education earn the least with $33,824. Women with an educational attainment of graduate degree earn the most with the average annual earnings of $138,854, while those with less than high school education have the smallest earnings of $25,030.
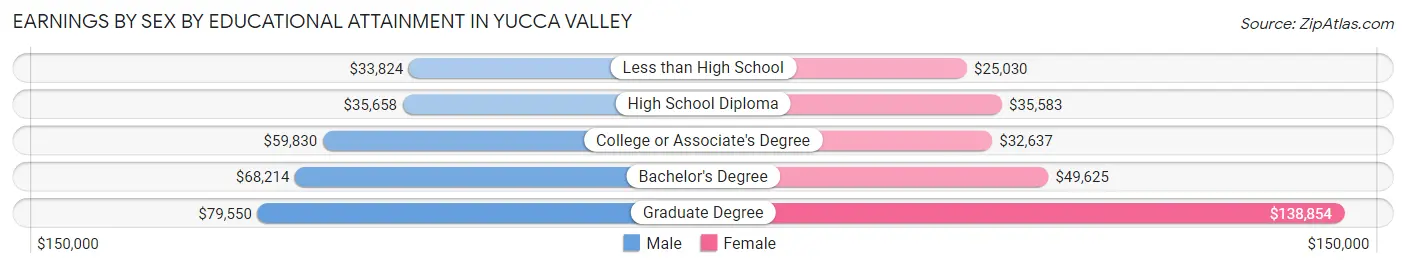
| Educational Attainment | Male Income | Female Income |
| Less than High School | $33,824 | $25,030 |
| High School Diploma | $35,658 | $35,583 |
| College or Associate's Degree | $59,830 | $32,637 |
| Bachelor's Degree | $68,214 | $49,625 |
| Graduate Degree | $79,550 | $138,854 |
| Total | $46,724 | $35,335 |
Family Income in Yucca Valley
Family Income Brackets in Yucca Valley
According to the Yucca Valley family income data, there are 962 families falling into the $100,000 to $149,999 income range, which is the most common income bracket and makes up 18.8% of all families. Conversely, the less than $10,000 income bracket is the least frequent group with only 107 families (2.1%) belonging to this category.
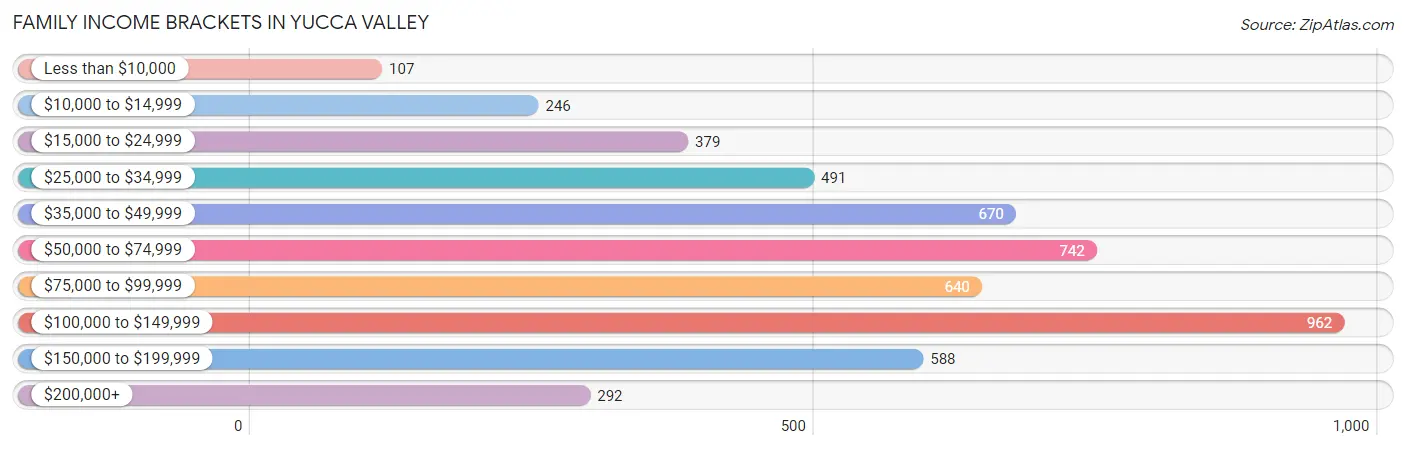
| Income Bracket | # Families | % Families |
| Less than $10,000 | 107 | 2.1% |
| $10,000 to $14,999 | 246 | 4.8% |
| $15,000 to $24,999 | 379 | 7.4% |
| $25,000 to $34,999 | 491 | 9.6% |
| $35,000 to $49,999 | 670 | 13.1% |
| $50,000 to $74,999 | 742 | 14.5% |
| $75,000 to $99,999 | 640 | 12.5% |
| $100,000 to $149,999 | 962 | 18.8% |
| $150,000 to $199,999 | 588 | 11.5% |
| $200,000+ | 292 | 5.7% |
Family Income by Famaliy Size in Yucca Valley
6-person families (206 | 4.0%) account for the highest median family income in Yucca Valley with $105,066 per family, while 2-person families (2,591 | 50.6%) have the highest median income of $29,662 per family member.
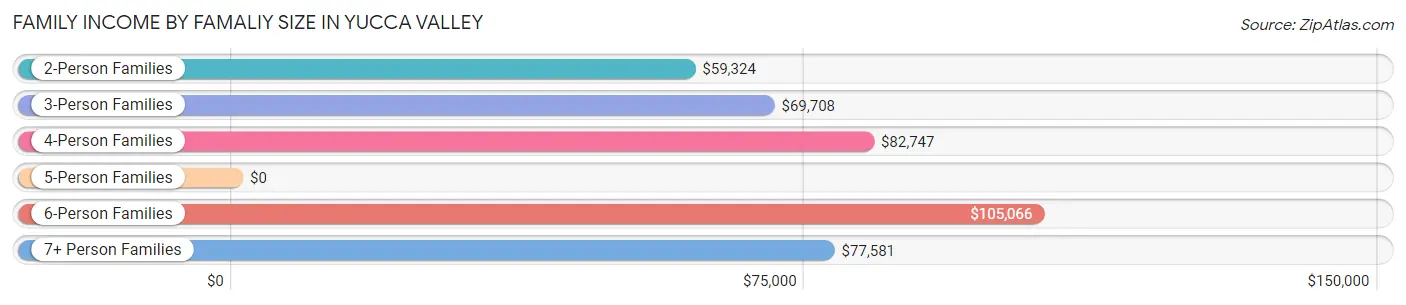
| Income Bracket | # Families | Median Income |
| 2-Person Families | 2,591 (50.6%) | $59,324 |
| 3-Person Families | 1,260 (24.6%) | $69,708 |
| 4-Person Families | 678 (13.3%) | $82,747 |
| 5-Person Families | 289 (5.7%) | $0 |
| 6-Person Families | 206 (4.0%) | $105,066 |
| 7+ Person Families | 92 (1.8%) | $77,581 |
| Total | 5,116 (100.0%) | $72,735 |
Family Income by Number of Earners in Yucca Valley
The median family income in Yucca Valley is $72,735, with families comprising 3+ earners (317) having the highest median family income of $164,632, while families with no earners (1,072) have the lowest median family income of $38,750, accounting for 6.2% and 20.9% of families, respectively.
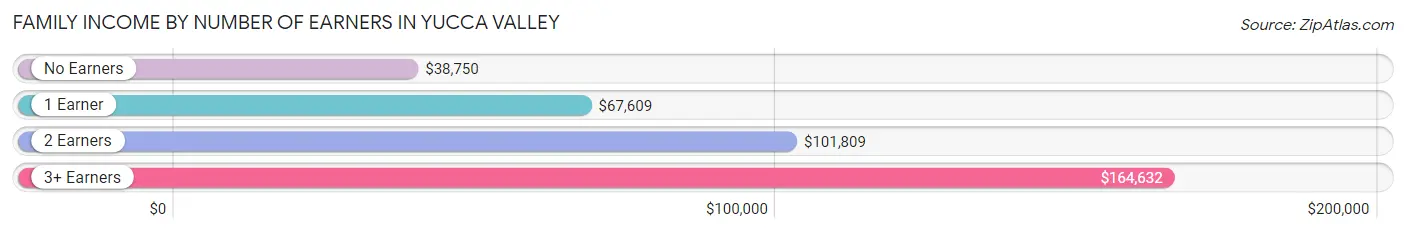
| Number of Earners | # Families | Median Income |
| No Earners | 1,072 (20.9%) | $38,750 |
| 1 Earner | 2,034 (39.8%) | $67,609 |
| 2 Earners | 1,693 (33.1%) | $101,809 |
| 3+ Earners | 317 (6.2%) | $164,632 |
| Total | 5,116 (100.0%) | $72,735 |
Household Income in Yucca Valley
Household Income Brackets in Yucca Valley
With 1,459 households falling in the category, the $35,000 to $49,999 income range is the most frequent in Yucca Valley, accounting for 16.7% of all households. In contrast, only 306 households (3.5%) fall into the less than $10,000 income bracket, making it the least populous group.
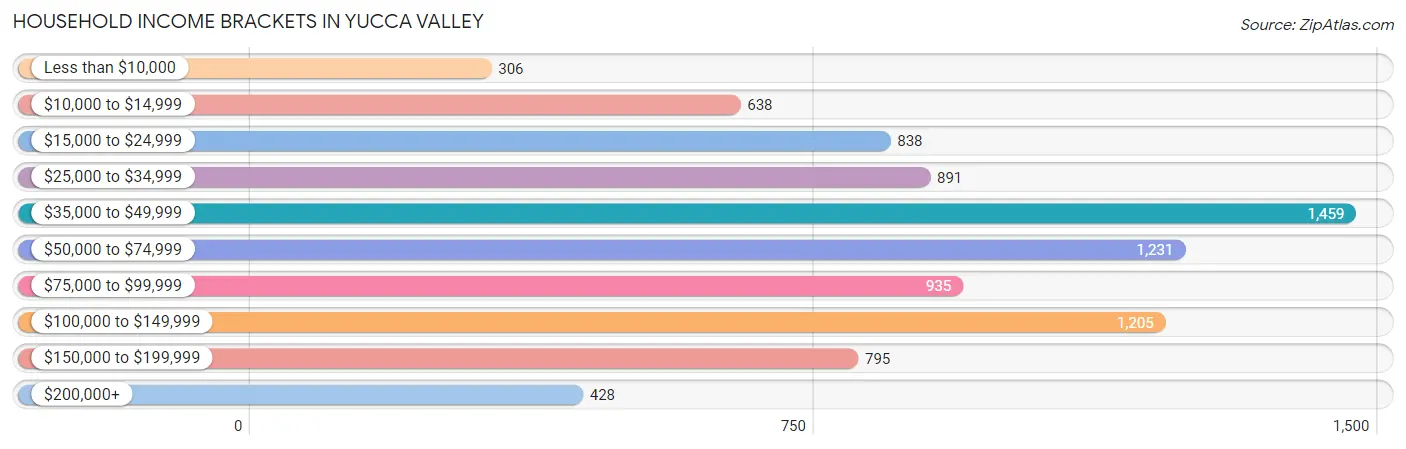
| Income Bracket | # Households | % Households |
| Less than $10,000 | 306 | 3.5% |
| $10,000 to $14,999 | 638 | 7.3% |
| $15,000 to $24,999 | 838 | 9.6% |
| $25,000 to $34,999 | 891 | 10.2% |
| $35,000 to $49,999 | 1,459 | 16.7% |
| $50,000 to $74,999 | 1,231 | 14.1% |
| $75,000 to $99,999 | 935 | 10.7% |
| $100,000 to $149,999 | 1,205 | 13.8% |
| $150,000 to $199,999 | 795 | 9.1% |
| $200,000+ | 428 | 4.9% |
Household Income by Householder Age in Yucca Valley
The median household income in Yucca Valley is $54,153, with the highest median household income of $79,383 found in the 45 to 64 years age bracket for the primary householder. A total of 2,916 households (33.4%) fall into this category. Meanwhile, the 65+ years age bracket for the primary householder has the lowest median household income of $43,007, with 2,852 households (32.7%) in this group.
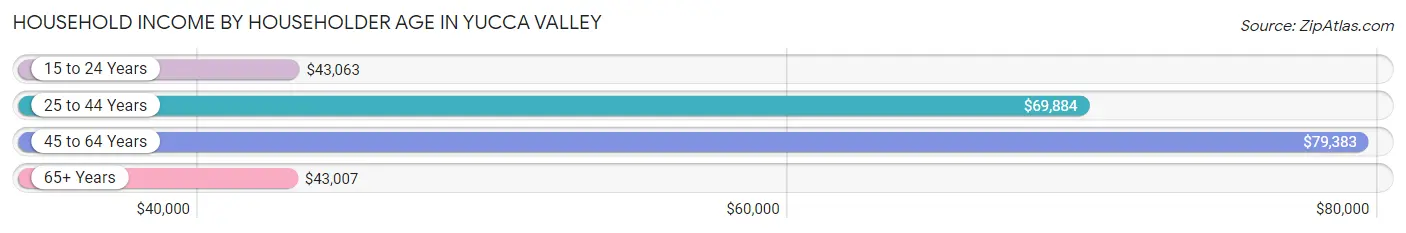
| Income Bracket | # Households | Median Income |
| 15 to 24 Years | 493 (5.6%) | $43,063 |
| 25 to 44 Years | 2,473 (28.3%) | $69,884 |
| 45 to 64 Years | 2,916 (33.4%) | $79,383 |
| 65+ Years | 2,852 (32.7%) | $43,007 |
| Total | 8,734 (100.0%) | $54,153 |
Poverty in Yucca Valley
Income Below Poverty by Sex and Age in Yucca Valley
With 17.8% poverty level for males and 22.3% for females among the residents of Yucca Valley, 5 year old males and 6 to 11 year old females are the most vulnerable to poverty, with 62 males (39.7%) and 446 females (45.2%) in their respective age groups living below the poverty level.
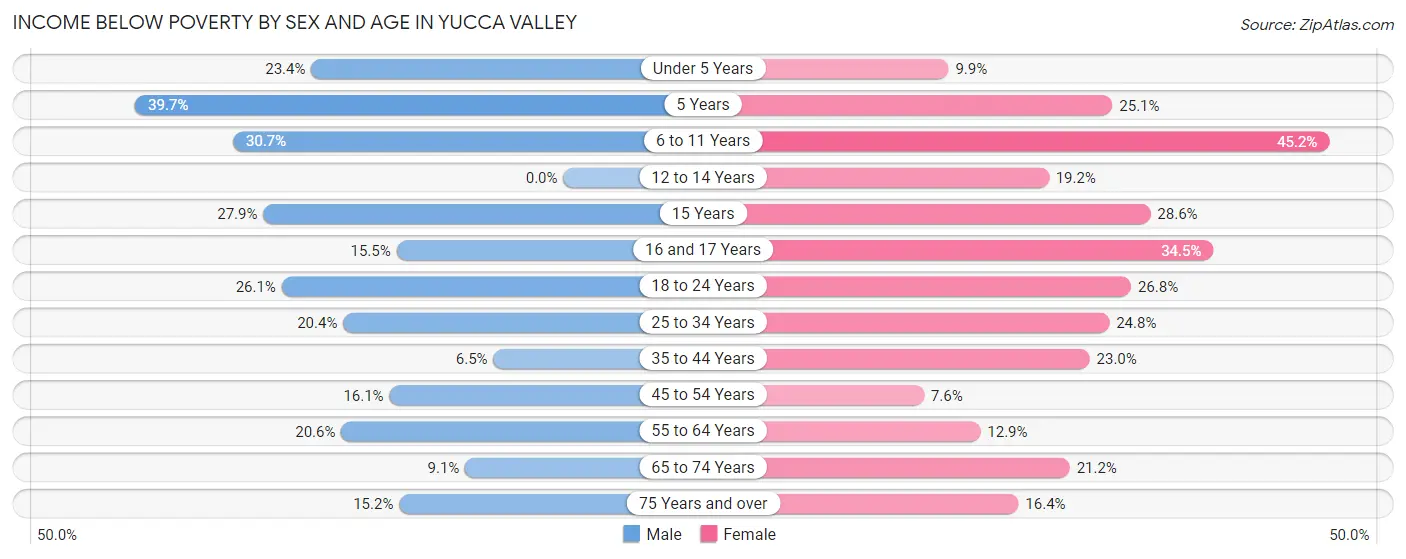
| Age Bracket | Male | Female |
| Under 5 Years | 131 (23.4%) | 31 (9.9%) |
| 5 Years | 62 (39.7%) | 57 (25.1%) |
| 6 to 11 Years | 303 (30.7%) | 446 (45.2%) |
| 12 to 14 Years | 0 (0.0%) | 77 (19.2%) |
| 15 Years | 44 (27.9%) | 57 (28.6%) |
| 16 and 17 Years | 26 (15.5%) | 162 (34.5%) |
| 18 to 24 Years | 217 (26.1%) | 284 (26.8%) |
| 25 to 34 Years | 264 (20.4%) | 338 (24.8%) |
| 35 to 44 Years | 78 (6.5%) | 304 (23.0%) |
| 45 to 54 Years | 184 (16.1%) | 58 (7.6%) |
| 55 to 64 Years | 323 (20.6%) | 185 (12.9%) |
| 65 to 74 Years | 115 (9.1%) | 299 (21.1%) |
| 75 Years and over | 90 (15.2%) | 205 (16.4%) |
| Total | 1,837 (17.8%) | 2,503 (22.3%) |
Income Above Poverty by Sex and Age in Yucca Valley
According to the poverty statistics in Yucca Valley, males aged 12 to 14 years and females aged 45 to 54 years are the age groups that are most secure financially, with 100.0% of males and 92.4% of females in these age groups living above the poverty line.
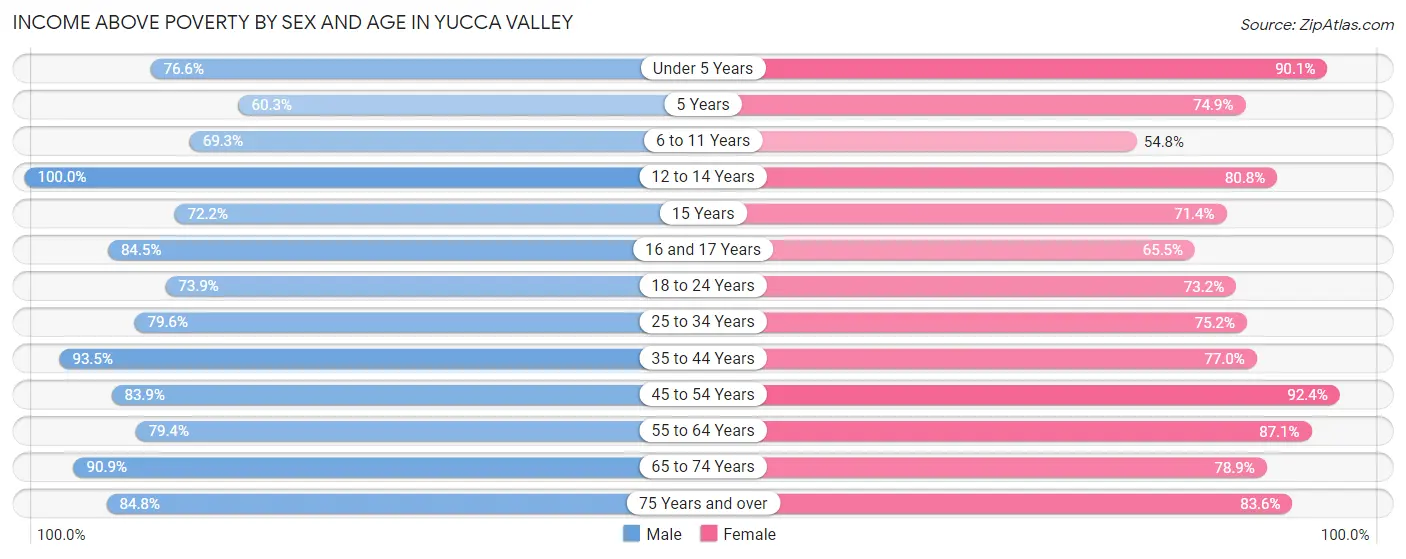
| Age Bracket | Male | Female |
| Under 5 Years | 429 (76.6%) | 282 (90.1%) |
| 5 Years | 94 (60.3%) | 170 (74.9%) |
| 6 to 11 Years | 685 (69.3%) | 540 (54.8%) |
| 12 to 14 Years | 401 (100.0%) | 324 (80.8%) |
| 15 Years | 114 (72.2%) | 142 (71.4%) |
| 16 and 17 Years | 142 (84.5%) | 308 (65.5%) |
| 18 to 24 Years | 613 (73.9%) | 774 (73.2%) |
| 25 to 34 Years | 1,028 (79.6%) | 1,024 (75.2%) |
| 35 to 44 Years | 1,124 (93.5%) | 1,018 (77.0%) |
| 45 to 54 Years | 956 (83.9%) | 703 (92.4%) |
| 55 to 64 Years | 1,244 (79.4%) | 1,254 (87.1%) |
| 65 to 74 Years | 1,147 (90.9%) | 1,115 (78.8%) |
| 75 Years and over | 501 (84.8%) | 1,046 (83.6%) |
| Total | 8,478 (82.2%) | 8,700 (77.7%) |
Income Below Poverty Among Married-Couple Families in Yucca Valley
The poverty statistics for married-couple families in Yucca Valley show that 7.7% or 269 of the total 3,480 families live below the poverty line. Families with 5 or more children have the highest poverty rate of 100.0%, comprising of 45 families. On the other hand, families with 3 or 4 children have the lowest poverty rate of 0.0%, which includes 0 families.
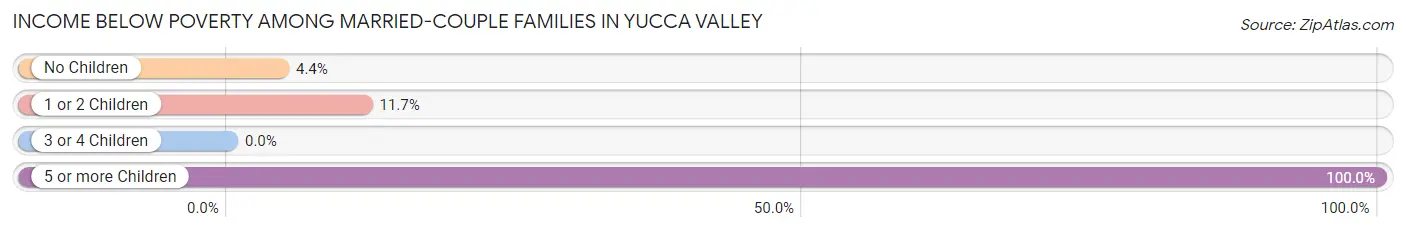
| Children | Above Poverty | Below Poverty |
| No Children | 2,089 (95.6%) | 97 (4.4%) |
| 1 or 2 Children | 958 (88.3%) | 127 (11.7%) |
| 3 or 4 Children | 164 (100.0%) | 0 (0.0%) |
| 5 or more Children | 0 (0.0%) | 45 (100.0%) |
| Total | 3,211 (92.3%) | 269 (7.7%) |
Income Below Poverty Among Single-Parent Households in Yucca Valley
According to the poverty data in Yucca Valley, 24.7% or 159 single-father households and 30.5% or 303 single-mother households are living below the poverty line. Among single-father households, those with 1 or 2 children have the highest poverty rate, with 159 households (39.9%) experiencing poverty. Likewise, among single-mother households, those with 3 or 4 children have the highest poverty rate, with 67 households (53.2%) falling below the poverty line.
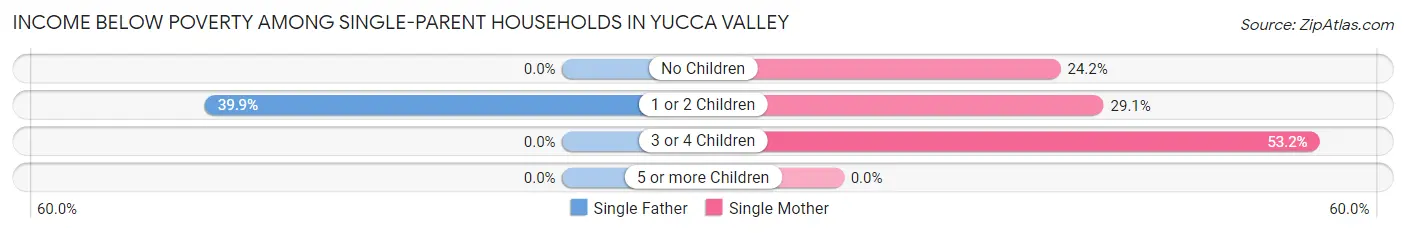
| Children | Single Father | Single Mother |
| No Children | 0 (0.0%) | 80 (24.2%) |
| 1 or 2 Children | 159 (39.9%) | 156 (29.0%) |
| 3 or 4 Children | 0 (0.0%) | 67 (53.2%) |
| 5 or more Children | 0 (0.0%) | 0 (0.0%) |
| Total | 159 (24.7%) | 303 (30.5%) |
Income Below Poverty Among Married-Couple vs Single-Parent Households in Yucca Valley
The poverty data for Yucca Valley shows that 269 of the married-couple family households (7.7%) and 462 of the single-parent households (28.2%) are living below the poverty level. Within the married-couple family households, those with 5 or more children have the highest poverty rate, with 45 households (100.0%) falling below the poverty line. Among the single-parent households, those with 3 or 4 children have the highest poverty rate, with 67 household (36.4%) living below poverty.
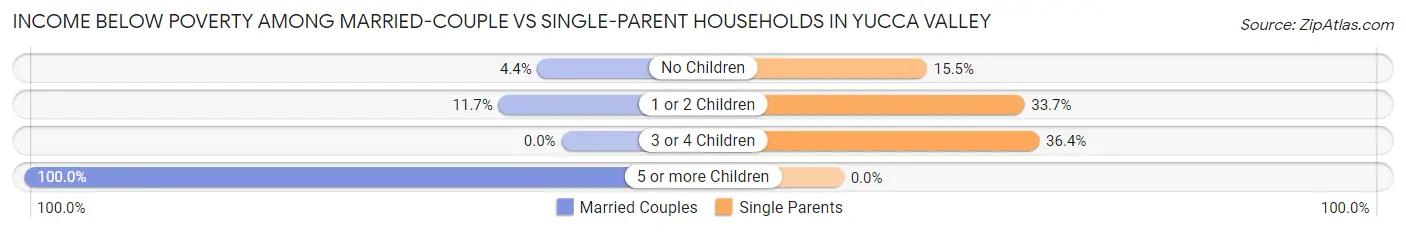
| Children | Married-Couple Families | Single-Parent Households |
| No Children | 97 (4.4%) | 80 (15.5%) |
| 1 or 2 Children | 127 (11.7%) | 315 (33.7%) |
| 3 or 4 Children | 0 (0.0%) | 67 (36.4%) |
| 5 or more Children | 45 (100.0%) | 0 (0.0%) |
| Total | 269 (7.7%) | 462 (28.2%) |
Race in Yucca Valley
The most populous races in Yucca Valley are White / Caucasian (15,452 | 71.2%), Hispanic or Latino (5,523 | 25.5%), and Two or more Races (3,434 | 15.8%).
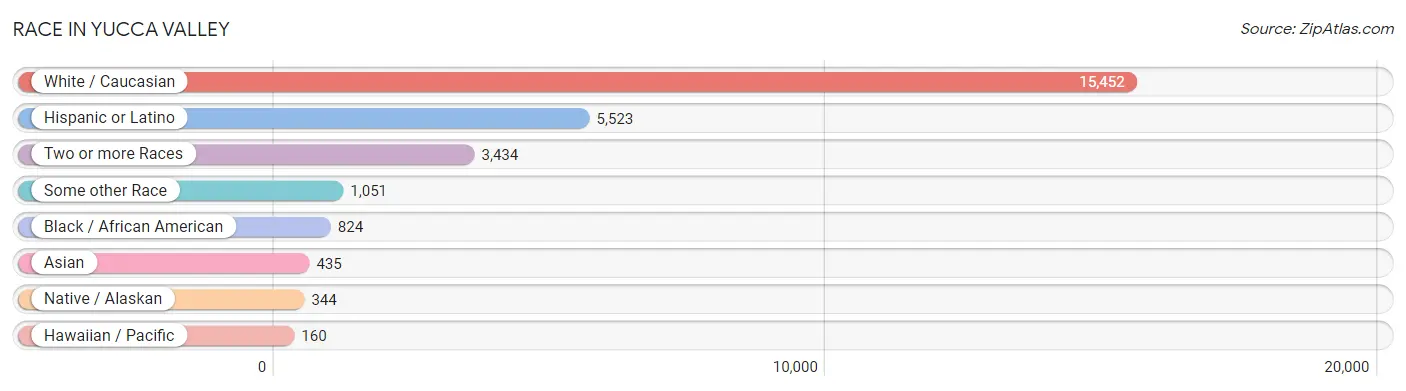
| Race | # Population | % Population |
| Asian | 435 | 2.0% |
| Black / African American | 824 | 3.8% |
| Hawaiian / Pacific | 160 | 0.7% |
| Hispanic or Latino | 5,523 | 25.5% |
| Native / Alaskan | 344 | 1.6% |
| White / Caucasian | 15,452 | 71.2% |
| Two or more Races | 3,434 | 15.8% |
| Some other Race | 1,051 | 4.8% |
| Total | 21,700 | 100.0% |
Ancestry in Yucca Valley
The most populous ancestries reported in Yucca Valley are Mexican (4,170 | 19.2%), English (2,629 | 12.1%), German (2,547 | 11.7%), Irish (2,298 | 10.6%), and Italian (1,391 | 6.4%), together accounting for 60.1% of all Yucca Valley residents.
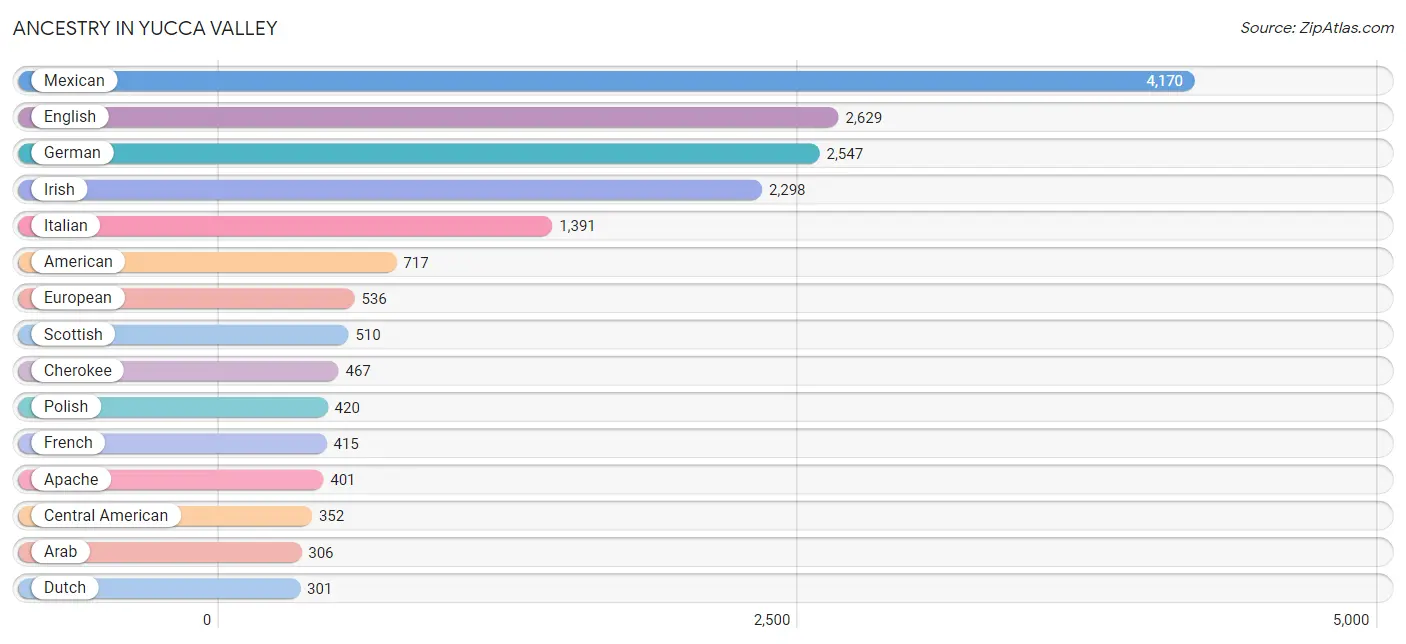
| Ancestry | # Population | % Population |
| African | 280 | 1.3% |
| American | 717 | 3.3% |
| Apache | 401 | 1.8% |
| Arab | 306 | 1.4% |
| Armenian | 240 | 1.1% |
| Austrian | 50 | 0.2% |
| Basque | 16 | 0.1% |
| Belgian | 29 | 0.1% |
| Bhutanese | 224 | 1.0% |
| British | 66 | 0.3% |
| Burmese | 116 | 0.5% |
| Canadian | 10 | 0.1% |
| Central American | 352 | 1.6% |
| Cherokee | 467 | 2.1% |
| Choctaw | 10 | 0.1% |
| Colombian | 46 | 0.2% |
| Cuban | 29 | 0.1% |
| Czech | 79 | 0.4% |
| Danish | 114 | 0.5% |
| Dutch | 301 | 1.4% |
| Eastern European | 36 | 0.2% |
| Ecuadorian | 11 | 0.1% |
| English | 2,629 | 12.1% |
| European | 536 | 2.5% |
| French | 415 | 1.9% |
| French Canadian | 34 | 0.2% |
| German | 2,547 | 11.7% |
| Greek | 44 | 0.2% |
| Guamanian / Chamorro | 15 | 0.1% |
| Guatemalan | 94 | 0.4% |
| Honduran | 99 | 0.5% |
| Hungarian | 268 | 1.2% |
| Icelander | 22 | 0.1% |
| Indian (Asian) | 56 | 0.3% |
| Iranian | 33 | 0.2% |
| Irish | 2,298 | 10.6% |
| Italian | 1,391 | 6.4% |
| Jamaican | 191 | 0.9% |
| Korean | 152 | 0.7% |
| Lebanese | 56 | 0.3% |
| Lithuanian | 10 | 0.1% |
| Malaysian | 3 | 0.0% |
| Mexican | 4,170 | 19.2% |
| Moroccan | 114 | 0.5% |
| Native Hawaiian | 24 | 0.1% |
| Navajo | 8 | 0.0% |
| Nicaraguan | 53 | 0.2% |
| Northern European | 7 | 0.0% |
| Norwegian | 281 | 1.3% |
| Pakistani | 67 | 0.3% |
| Palestinian | 136 | 0.6% |
| Peruvian | 132 | 0.6% |
| Polish | 420 | 1.9% |
| Portuguese | 56 | 0.3% |
| Puerto Rican | 217 | 1.0% |
| Russian | 177 | 0.8% |
| Salvadoran | 106 | 0.5% |
| Samoan | 99 | 0.5% |
| Scandinavian | 63 | 0.3% |
| Scotch-Irish | 69 | 0.3% |
| Scottish | 510 | 2.4% |
| Serbian | 11 | 0.1% |
| Sioux | 37 | 0.2% |
| Slovak | 46 | 0.2% |
| South American | 189 | 0.9% |
| Spaniard | 243 | 1.1% |
| Spanish | 39 | 0.2% |
| Sri Lankan | 192 | 0.9% |
| Subsaharan African | 280 | 1.3% |
| Swedish | 113 | 0.5% |
| Swiss | 11 | 0.1% |
| Thai | 27 | 0.1% |
| Tohono O'Odham | 178 | 0.8% |
| Tongan | 10 | 0.1% |
| Turkish | 20 | 0.1% |
| Ukrainian | 59 | 0.3% |
| Welsh | 141 | 0.6% |
| Yaqui | 8 | 0.0% |
| Yugoslavian | 7 | 0.0% | View All 79 Rows |
Immigrants in Yucca Valley
The most numerous immigrant groups reported in Yucca Valley came from Latin America (1,032 | 4.8%), Central America (900 | 4.2%), Mexico (739 | 3.4%), Asia (424 | 1.9%), and Europe (260 | 1.2%), together accounting for 15.5% of all Yucca Valley residents.
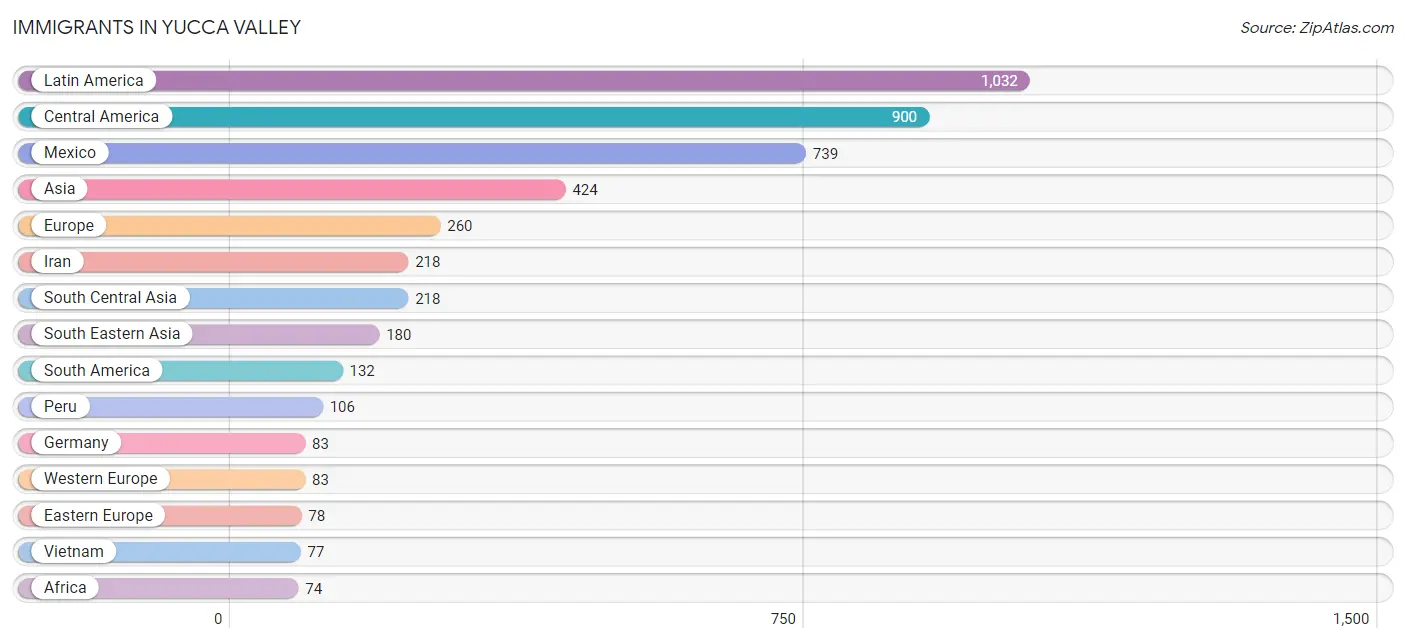
| Immigration Origin | # Population | % Population |
| Africa | 74 | 0.3% |
| Argentina | 7 | 0.0% |
| Asia | 424 | 1.9% |
| Australia | 13 | 0.1% |
| Canada | 55 | 0.3% |
| Central America | 900 | 4.2% |
| China | 10 | 0.1% |
| Colombia | 8 | 0.0% |
| Eastern Asia | 26 | 0.1% |
| Eastern Europe | 78 | 0.4% |
| Ecuador | 11 | 0.1% |
| El Salvador | 65 | 0.3% |
| Europe | 260 | 1.2% |
| Fiji | 36 | 0.2% |
| Germany | 83 | 0.4% |
| Ghana | 23 | 0.1% |
| Greece | 9 | 0.0% |
| Guatemala | 17 | 0.1% |
| Honduras | 30 | 0.1% |
| Hungary | 9 | 0.0% |
| Iran | 218 | 1.0% |
| Italy | 12 | 0.1% |
| Korea | 16 | 0.1% |
| Latin America | 1,032 | 4.8% |
| Mexico | 739 | 3.4% |
| Morocco | 51 | 0.2% |
| Northern Africa | 51 | 0.2% |
| Northern Europe | 62 | 0.3% |
| Oceania | 59 | 0.3% |
| Panama | 49 | 0.2% |
| Peru | 106 | 0.5% |
| Philippines | 36 | 0.2% |
| Russia | 48 | 0.2% |
| South America | 132 | 0.6% |
| South Central Asia | 218 | 1.0% |
| South Eastern Asia | 180 | 0.8% |
| Southern Europe | 37 | 0.2% |
| Spain | 16 | 0.1% |
| Thailand | 67 | 0.3% |
| Ukraine | 8 | 0.0% |
| Vietnam | 77 | 0.4% |
| Western Africa | 23 | 0.1% |
| Western Europe | 83 | 0.4% | View All 43 Rows |
Sex and Age in Yucca Valley
Sex and Age in Yucca Valley
The most populous age groups in Yucca Valley are 60 to 64 Years (903 | 8.7%) for men and 15 to 19 Years (1,056 | 9.3%) for women.
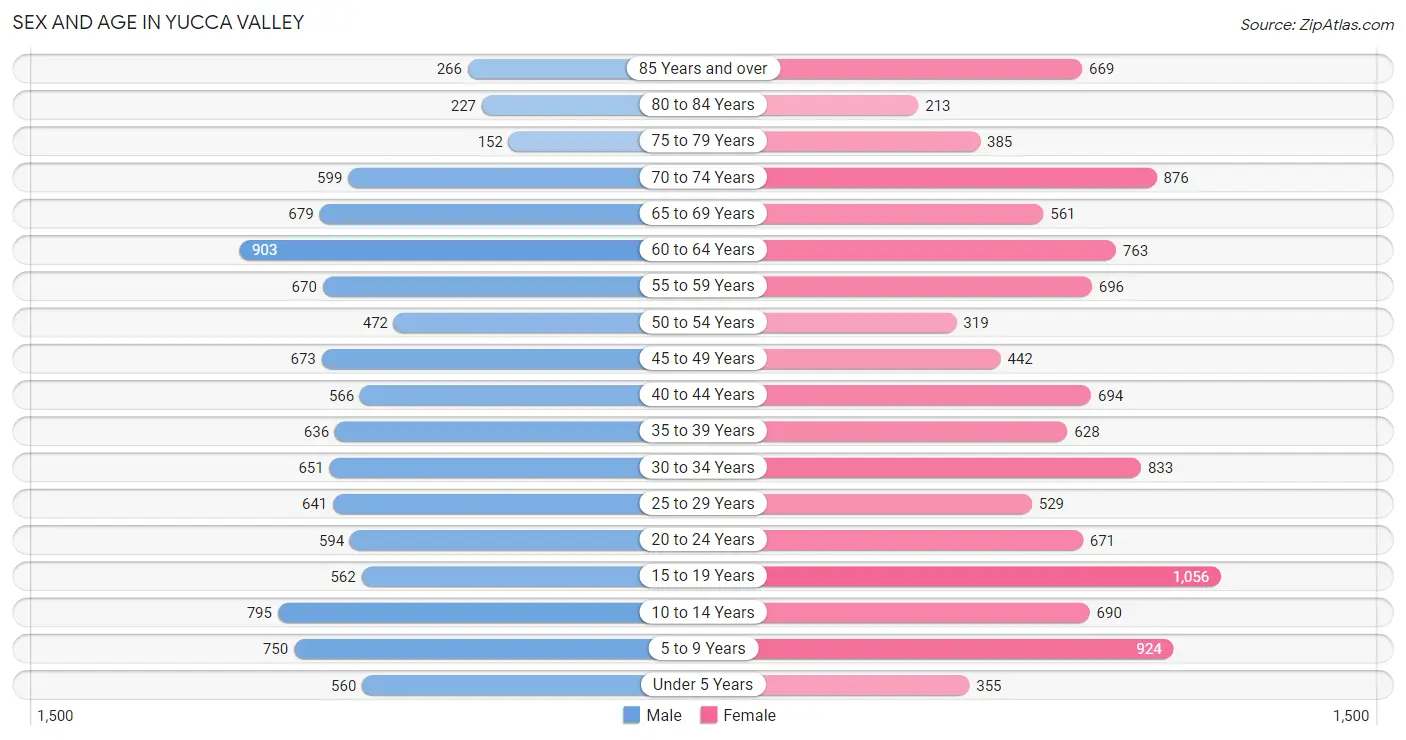
| Age Bracket | Male | Female |
| Under 5 Years | 560 (5.4%) | 355 (3.1%) |
| 5 to 9 Years | 750 (7.2%) | 924 (8.2%) |
| 10 to 14 Years | 795 (7.6%) | 690 (6.1%) |
| 15 to 19 Years | 562 (5.4%) | 1,056 (9.3%) |
| 20 to 24 Years | 594 (5.7%) | 671 (5.9%) |
| 25 to 29 Years | 641 (6.2%) | 529 (4.7%) |
| 30 to 34 Years | 651 (6.3%) | 833 (7.4%) |
| 35 to 39 Years | 636 (6.1%) | 628 (5.6%) |
| 40 to 44 Years | 566 (5.4%) | 694 (6.1%) |
| 45 to 49 Years | 673 (6.5%) | 442 (3.9%) |
| 50 to 54 Years | 472 (4.5%) | 319 (2.8%) |
| 55 to 59 Years | 670 (6.4%) | 696 (6.2%) |
| 60 to 64 Years | 903 (8.7%) | 763 (6.8%) |
| 65 to 69 Years | 679 (6.5%) | 561 (5.0%) |
| 70 to 74 Years | 599 (5.8%) | 876 (7.7%) |
| 75 to 79 Years | 152 (1.5%) | 385 (3.4%) |
| 80 to 84 Years | 227 (2.2%) | 213 (1.9%) |
| 85 Years and over | 266 (2.6%) | 669 (5.9%) |
| Total | 10,396 (100.0%) | 11,304 (100.0%) |
Families and Households in Yucca Valley
Median Family Size in Yucca Valley
The median family size in Yucca Valley is 3.14 persons per family, with single female/mother families (993 | 19.4%) accounting for the largest median family size of 3.18 persons per family. On the other hand, single male/father families (643 | 12.6%) represent the smallest median family size with 2.87 persons per family.
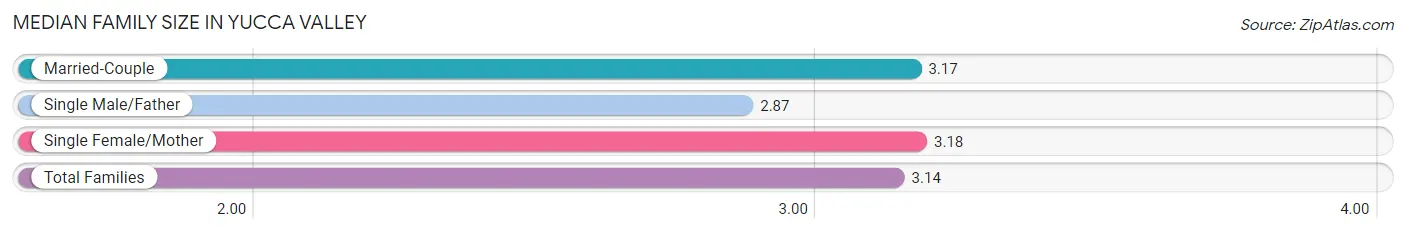
| Family Type | # Families | Family Size |
| Married-Couple | 3,480 (68.0%) | 3.17 |
| Single Male/Father | 643 (12.6%) | 2.87 |
| Single Female/Mother | 993 (19.4%) | 3.18 |
| Total Families | 5,116 (100.0%) | 3.14 |
Median Household Size in Yucca Valley
The median household size in Yucca Valley is 2.46 persons per household, with single male/father households (643 | 7.4%) accounting for the largest median household size of 3.48 persons per household. non-family households (3,618 | 41.4%) represent the smallest median household size with 1.31 persons per household.
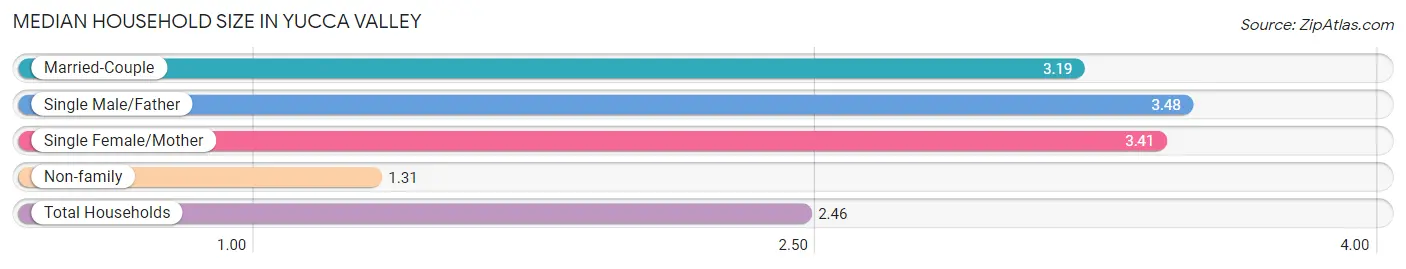
| Household Type | # Households | Household Size |
| Married-Couple | 3,480 (39.8%) | 3.19 |
| Single Male/Father | 643 (7.4%) | 3.48 |
| Single Female/Mother | 993 (11.4%) | 3.41 |
| Non-family | 3,618 (41.4%) | 1.31 |
| Total Households | 8,734 (100.0%) | 2.46 |
Household Size by Marriage Status in Yucca Valley
Out of a total of 8,734 households in Yucca Valley, 5,116 (58.6%) are family households, while 3,618 (41.4%) are nonfamily households. The most numerous type of family households are 2-person households, comprising 2,374, and the most common type of nonfamily households are 1-person households, comprising 2,603.
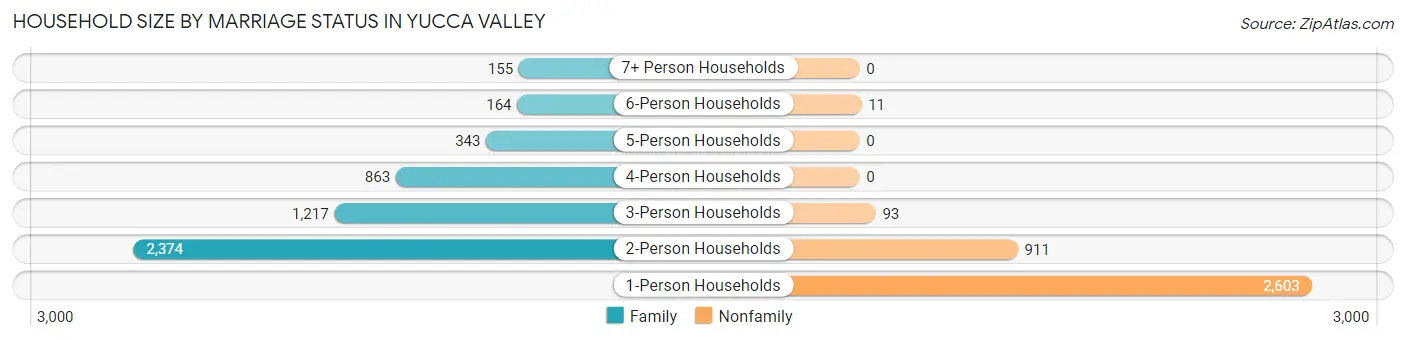
| Household Size | Family Households | Nonfamily Households |
| 1-Person Households | - | 2,603 (29.8%) |
| 2-Person Households | 2,374 (27.2%) | 911 (10.4%) |
| 3-Person Households | 1,217 (13.9%) | 93 (1.1%) |
| 4-Person Households | 863 (9.9%) | 0 (0.0%) |
| 5-Person Households | 343 (3.9%) | 0 (0.0%) |
| 6-Person Households | 164 (1.9%) | 11 (0.1%) |
| 7+ Person Households | 155 (1.8%) | 0 (0.0%) |
| Total | 5,116 (58.6%) | 3,618 (41.4%) |
Female Fertility in Yucca Valley
Fertility by Age in Yucca Valley
Average fertility rate in Yucca Valley is 30.0 births per 1,000 women. Women in the age bracket of 15 to 19 years have the highest fertility rate with 58.0 births per 1,000 women. Women in the age bracket of 15 to 19 years acount for 40.7% of all women with births.
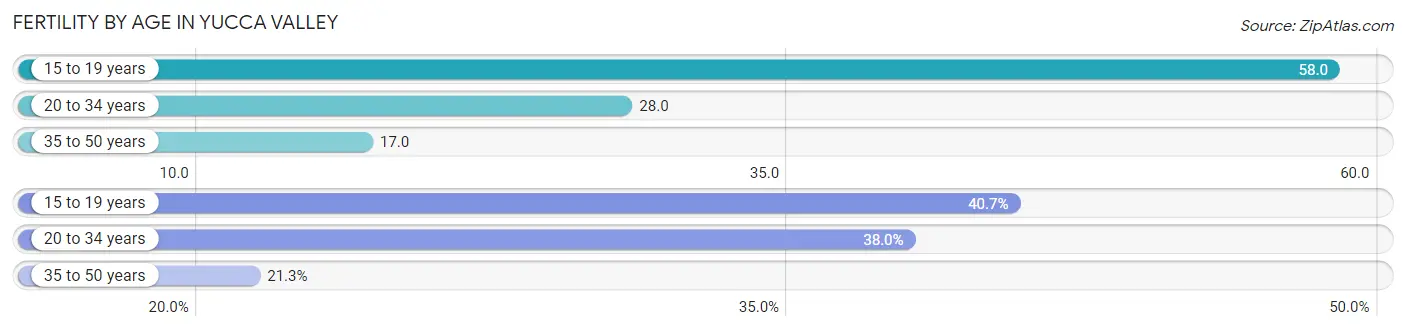
| Age Bracket | Women with Births | Births / 1,000 Women |
| 15 to 19 years | 61 (40.7%) | 58.0 |
| 20 to 34 years | 57 (38.0%) | 28.0 |
| 35 to 50 years | 32 (21.3%) | 17.0 |
| Total | 150 (100.0%) | 30.0 |
Fertility by Age by Marriage Status in Yucca Valley
50.0% of women with births (150) in Yucca Valley are married. The highest percentage of unmarried women with births falls into 35 to 50 years age bracket with 81.2% of them unmarried at the time of birth, while the lowest percentage of unmarried women with births belong to 15 to 19 years age bracket with 27.9% of them unmarried.
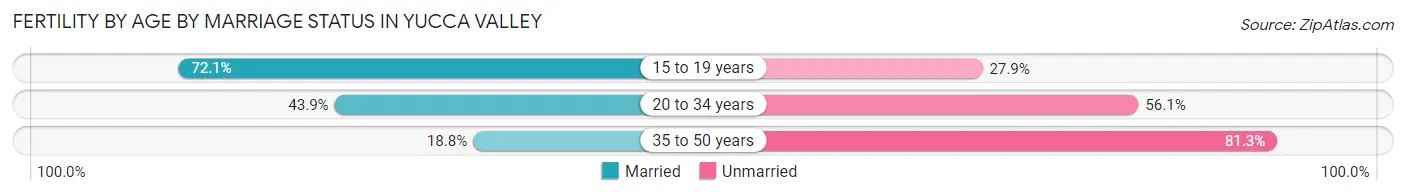
| Age Bracket | Married | Unmarried |
| 15 to 19 years | 44 (72.1%) | 17 (27.9%) |
| 20 to 34 years | 25 (43.9%) | 32 (56.1%) |
| 35 to 50 years | 6 (18.8%) | 26 (81.2%) |
| Total | 75 (50.0%) | 75 (50.0%) |
Fertility by Education in Yucca Valley
Average fertility rate in Yucca Valley is 30.0 births per 1,000 women. Women with the education attainment of high school diploma have the highest fertility rate of 50.0 births per 1,000 women, while women with the education attainment of less than high school have the lowest fertility at 16.0 births per 1,000 women. Women with the education attainment of high school diploma represent 44.7% of all women with births.
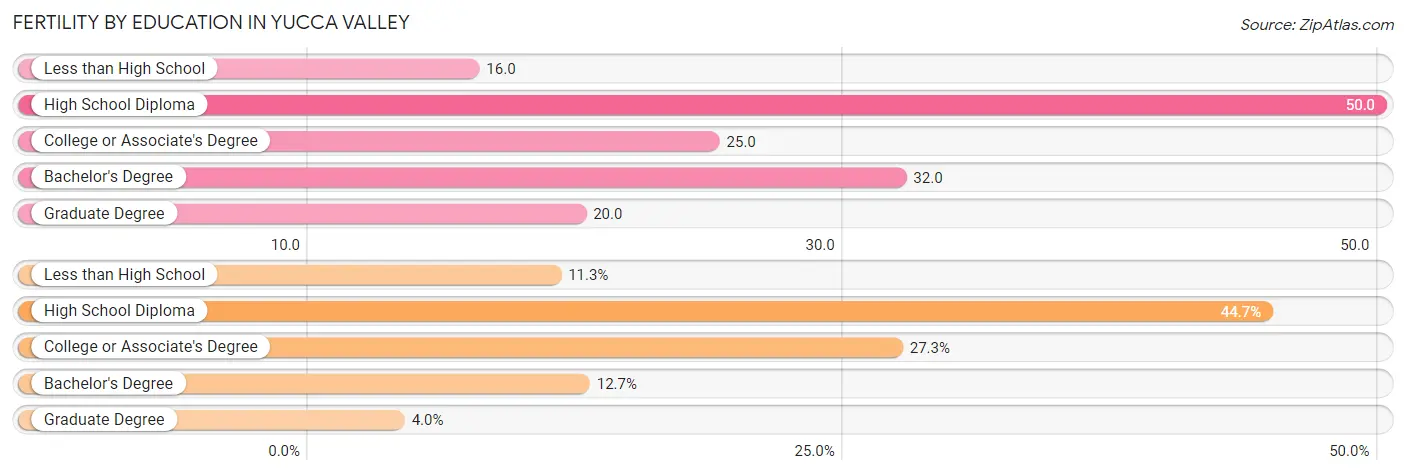
| Educational Attainment | Women with Births | Births / 1,000 Women |
| Less than High School | 17 (11.3%) | 16.0 |
| High School Diploma | 67 (44.7%) | 50.0 |
| College or Associate's Degree | 41 (27.3%) | 25.0 |
| Bachelor's Degree | 19 (12.7%) | 32.0 |
| Graduate Degree | 6 (4.0%) | 20.0 |
| Total | 150 (100.0%) | 30.0 |
Fertility by Education by Marriage Status in Yucca Valley
50.0% of women with births in Yucca Valley are unmarried. Women with the educational attainment of graduate degree are most likely to be married with 100.0% of them married at childbirth, while women with the educational attainment of less than high school are least likely to be married with 100.0% of them unmarried at childbirth.
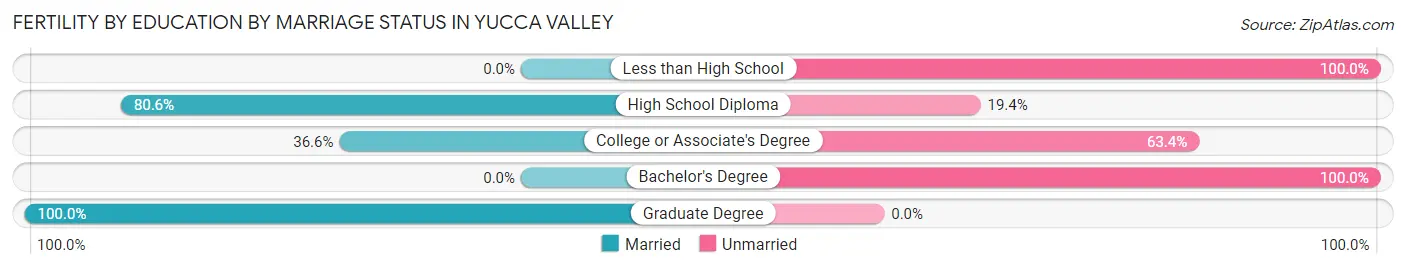
| Educational Attainment | Married | Unmarried |
| Less than High School | 0 (0.0%) | 17 (100.0%) |
| High School Diploma | 54 (80.6%) | 13 (19.4%) |
| College or Associate's Degree | 15 (36.6%) | 26 (63.4%) |
| Bachelor's Degree | 0 (0.0%) | 19 (100.0%) |
| Graduate Degree | 6 (100.0%) | 0 (0.0%) |
| Total | 75 (50.0%) | 75 (50.0%) |
Employment Characteristics in Yucca Valley
Employment by Class of Employer in Yucca Valley
Among the 8,870 employed individuals in Yucca Valley, private company employees (5,275 | 59.5%), self-employed (not incorporated) (968 | 10.9%), and not-for-profit organizations (734 | 8.3%) make up the most common classes of employment.
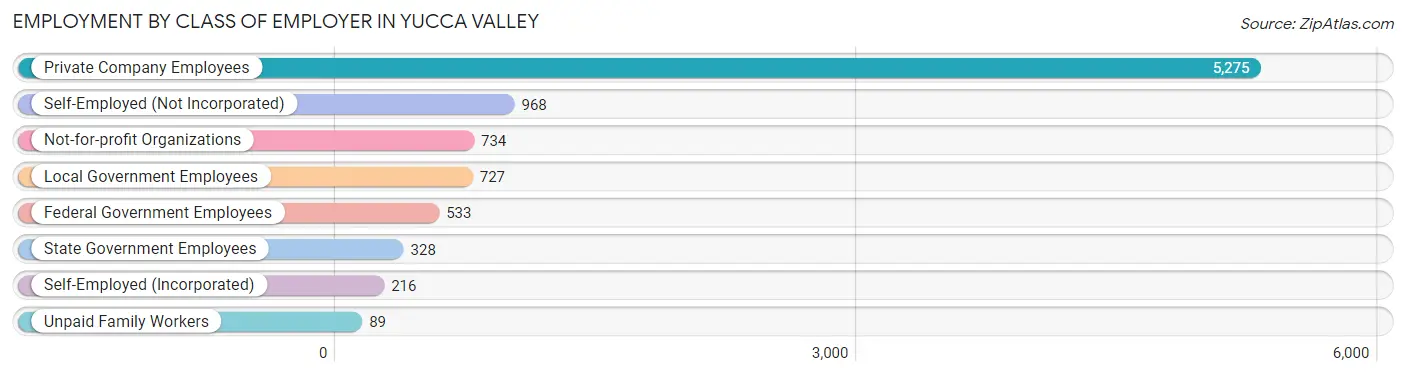
| Employer Class | # Employees | % Employees |
| Private Company Employees | 5,275 | 59.5% |
| Self-Employed (Incorporated) | 216 | 2.4% |
| Self-Employed (Not Incorporated) | 968 | 10.9% |
| Not-for-profit Organizations | 734 | 8.3% |
| Local Government Employees | 727 | 8.2% |
| State Government Employees | 328 | 3.7% |
| Federal Government Employees | 533 | 6.0% |
| Unpaid Family Workers | 89 | 1.0% |
| Total | 8,870 | 100.0% |
Employment Status by Age in Yucca Valley
According to the labor force statistics for Yucca Valley, out of the total population over 16 years of age (17,269), 56.5% or 9,757 individuals are in the labor force, with 7.6% or 742 of them unemployed. The age group with the highest labor force participation rate is 25 to 29 years, with 82.6% or 966 individuals in the labor force. Within the labor force, the 45 to 54 years age range has the highest percentage of unemployed individuals, with 11.0% or 153 of them being unemployed.
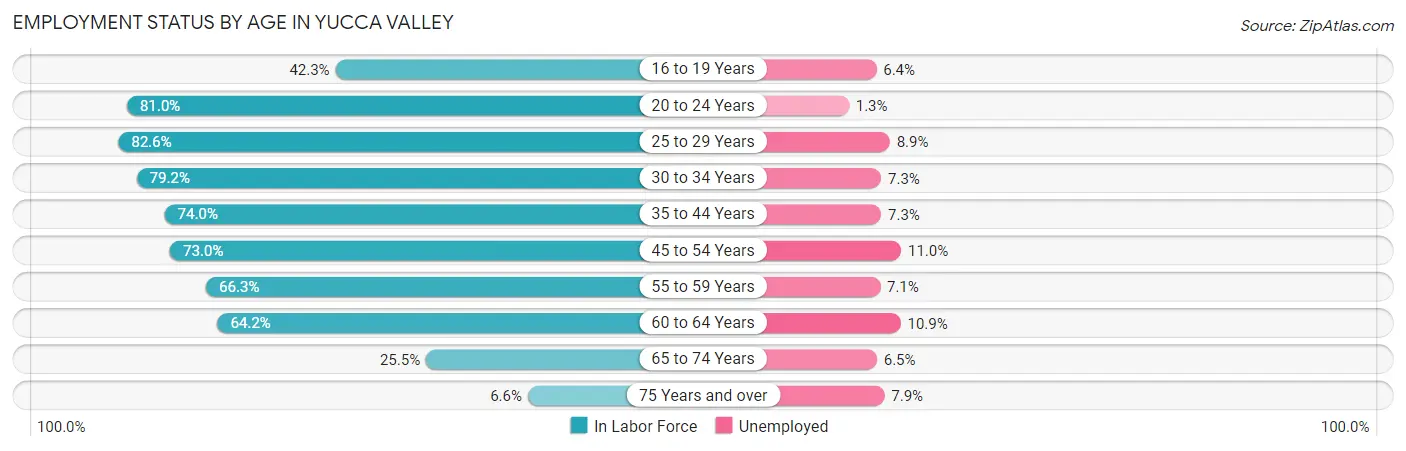
| Age Bracket | In Labor Force | Unemployed |
| 16 to 19 Years | 533 (42.3%) | 34 (6.4%) |
| 20 to 24 Years | 1,025 (81.0%) | 13 (1.3%) |
| 25 to 29 Years | 966 (82.6%) | 86 (8.9%) |
| 30 to 34 Years | 1,175 (79.2%) | 86 (7.3%) |
| 35 to 44 Years | 1,868 (74.0%) | 136 (7.3%) |
| 45 to 54 Years | 1,391 (73.0%) | 153 (11.0%) |
| 55 to 59 Years | 906 (66.3%) | 64 (7.1%) |
| 60 to 64 Years | 1,070 (64.2%) | 117 (10.9%) |
| 65 to 74 Years | 692 (25.5%) | 45 (6.5%) |
| 75 Years and over | 126 (6.6%) | 10 (7.9%) |
| Total | 9,757 (56.5%) | 742 (7.6%) |
Employment Status by Educational Attainment in Yucca Valley
According to labor force statistics for Yucca Valley, 72.9% of individuals (7,375) out of the total population between 25 and 64 years of age (10,116) are in the labor force, with 8.7% or 642 of them being unemployed. The group with the highest labor force participation rate are those with the educational attainment of bachelor's degree or higher, with 79.7% or 1,761 individuals in the labor force. Within the labor force, individuals with less than high school education have the highest percentage of unemployment, with 27.6% or 204 of them being unemployed.
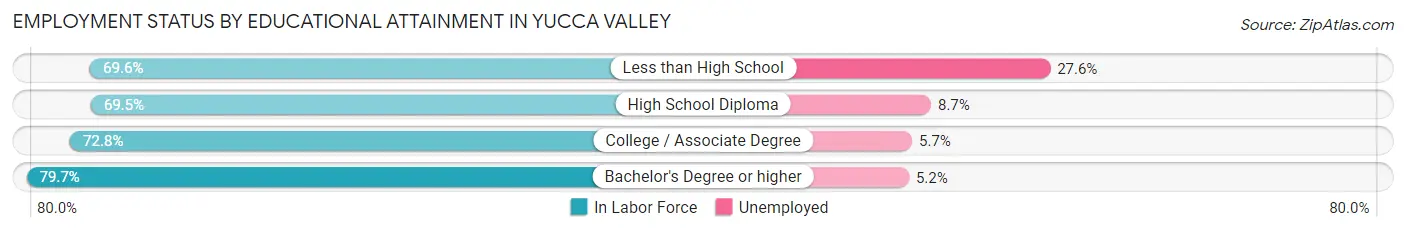
| Educational Attainment | In Labor Force | Unemployed |
| Less than High School | 738 (69.6%) | 293 (27.6%) |
| High School Diploma | 2,218 (69.5%) | 278 (8.7%) |
| College / Associate Degree | 2,660 (72.8%) | 208 (5.7%) |
| Bachelor's Degree or higher | 1,761 (79.7%) | 115 (5.2%) |
| Total | 7,375 (72.9%) | 880 (8.7%) |
Employment Occupations by Sex in Yucca Valley
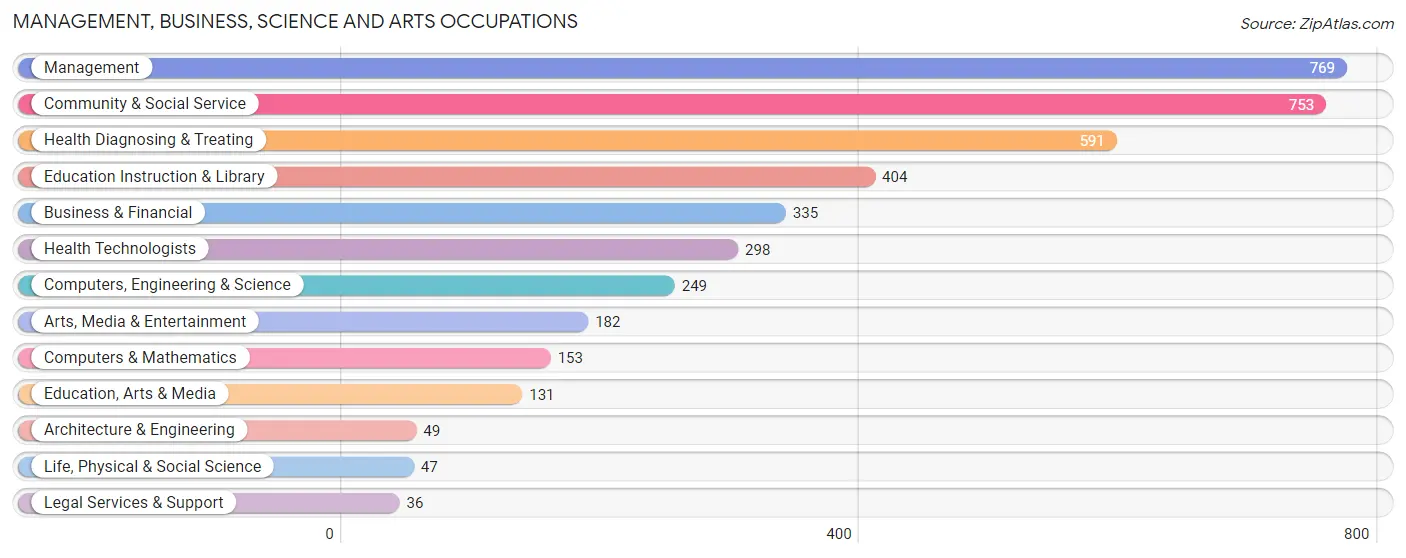
Management, Business, Science and Arts Occupations
The most common Management, Business, Science and Arts occupations in Yucca Valley are Management (769 | 8.7%), Community & Social Service (753 | 8.5%), Health Diagnosing & Treating (591 | 6.7%), Education Instruction & Library (404 | 4.5%), and Business & Financial (335 | 3.8%).
Management, Business, Science and Arts Occupations by Sex
Within the Management, Business, Science and Arts occupations in Yucca Valley, the most male-oriented occupations are Architecture & Engineering (100.0%), Life, Physical & Social Science (100.0%), and Computers, Engineering & Science (88.8%), while the most female-oriented occupations are Health Diagnosing & Treating (74.8%), Legal Services & Support (72.2%), and Health Technologists (69.1%).
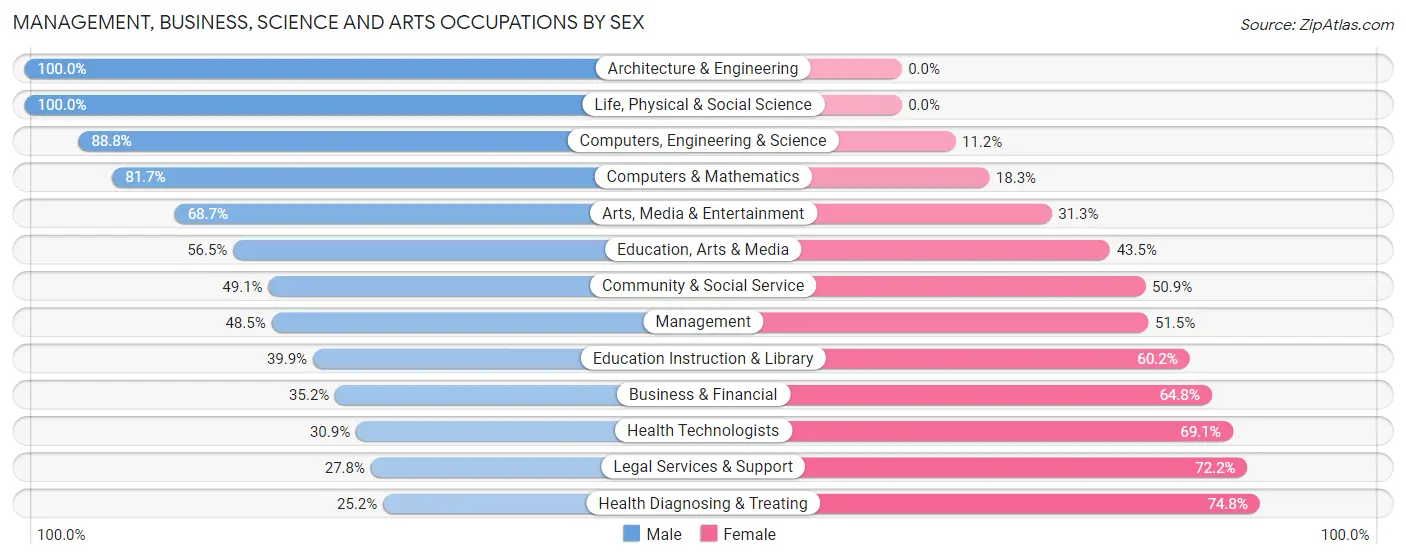
| Occupation | Male | Female |
| Management | 373 (48.5%) | 396 (51.5%) |
| Business & Financial | 118 (35.2%) | 217 (64.8%) |
| Computers, Engineering & Science | 221 (88.8%) | 28 (11.2%) |
| Computers & Mathematics | 125 (81.7%) | 28 (18.3%) |
| Architecture & Engineering | 49 (100.0%) | 0 (0.0%) |
| Life, Physical & Social Science | 47 (100.0%) | 0 (0.0%) |
| Community & Social Service | 370 (49.1%) | 383 (50.9%) |
| Education, Arts & Media | 74 (56.5%) | 57 (43.5%) |
| Legal Services & Support | 10 (27.8%) | 26 (72.2%) |
| Education Instruction & Library | 161 (39.9%) | 243 (60.2%) |
| Arts, Media & Entertainment | 125 (68.7%) | 57 (31.3%) |
| Health Diagnosing & Treating | 149 (25.2%) | 442 (74.8%) |
| Health Technologists | 92 (30.9%) | 206 (69.1%) |
| Total (Category) | 1,231 (45.6%) | 1,466 (54.4%) |
| Total (Overall) | 4,783 (53.9%) | 4,093 (46.1%) |
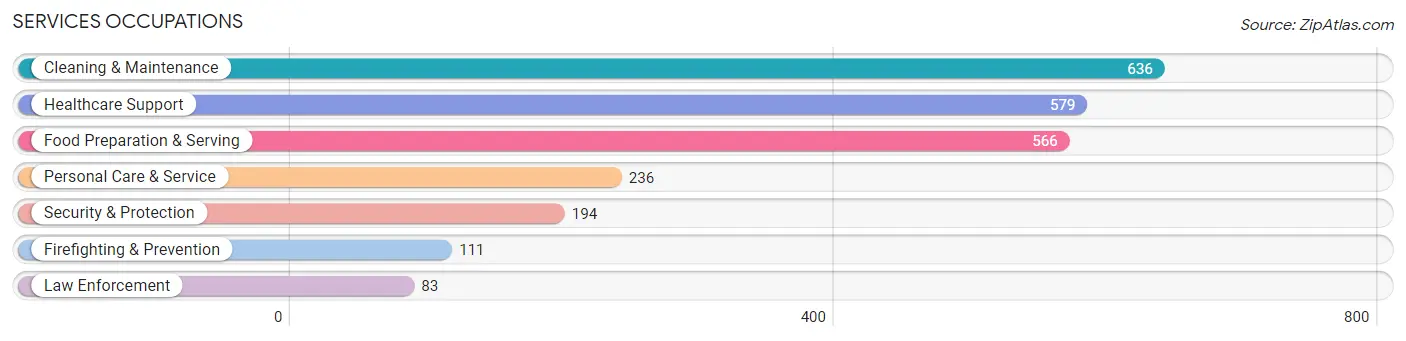
Services Occupations
The most common Services occupations in Yucca Valley are Cleaning & Maintenance (636 | 7.2%), Healthcare Support (579 | 6.5%), Food Preparation & Serving (566 | 6.4%), Personal Care & Service (236 | 2.7%), and Security & Protection (194 | 2.2%).
Services Occupations by Sex
Within the Services occupations in Yucca Valley, the most male-oriented occupations are Firefighting & Prevention (100.0%), Security & Protection (68.0%), and Food Preparation & Serving (56.2%), while the most female-oriented occupations are Healthcare Support (90.3%), Personal Care & Service (84.3%), and Law Enforcement (74.7%).
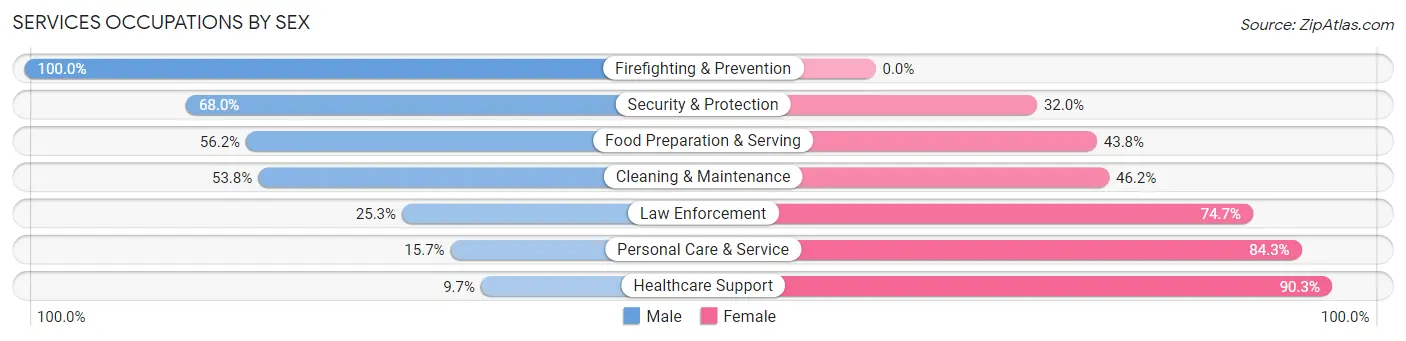
| Occupation | Male | Female |
| Healthcare Support | 56 (9.7%) | 523 (90.3%) |
| Security & Protection | 132 (68.0%) | 62 (32.0%) |
| Firefighting & Prevention | 111 (100.0%) | 0 (0.0%) |
| Law Enforcement | 21 (25.3%) | 62 (74.7%) |
| Food Preparation & Serving | 318 (56.2%) | 248 (43.8%) |
| Cleaning & Maintenance | 342 (53.8%) | 294 (46.2%) |
| Personal Care & Service | 37 (15.7%) | 199 (84.3%) |
| Total (Category) | 885 (40.0%) | 1,326 (60.0%) |
| Total (Overall) | 4,783 (53.9%) | 4,093 (46.1%) |
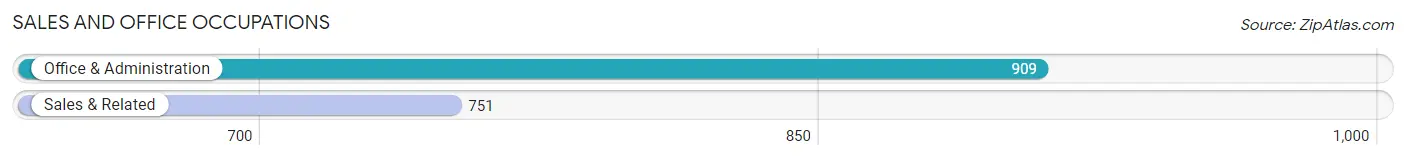
Sales and Office Occupations
The most common Sales and Office occupations in Yucca Valley are Office & Administration (909 | 10.2%), and Sales & Related (751 | 8.5%).
Sales and Office Occupations by Sex
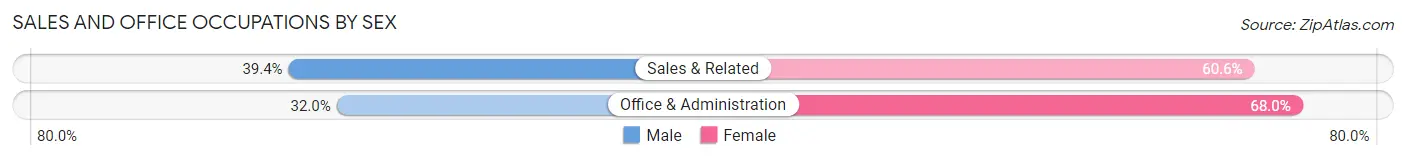
| Occupation | Male | Female |
| Sales & Related | 296 (39.4%) | 455 (60.6%) |
| Office & Administration | 291 (32.0%) | 618 (68.0%) |
| Total (Category) | 587 (35.4%) | 1,073 (64.6%) |
| Total (Overall) | 4,783 (53.9%) | 4,093 (46.1%) |
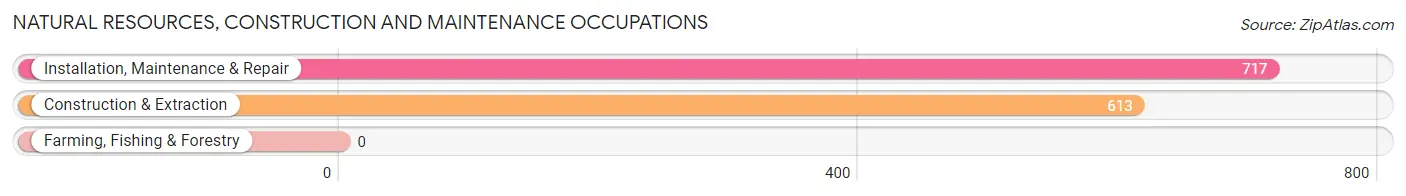
Natural Resources, Construction and Maintenance Occupations
The most common Natural Resources, Construction and Maintenance occupations in Yucca Valley are Installation, Maintenance & Repair (717 | 8.1%), and Construction & Extraction (613 | 6.9%).
Natural Resources, Construction and Maintenance Occupations by Sex
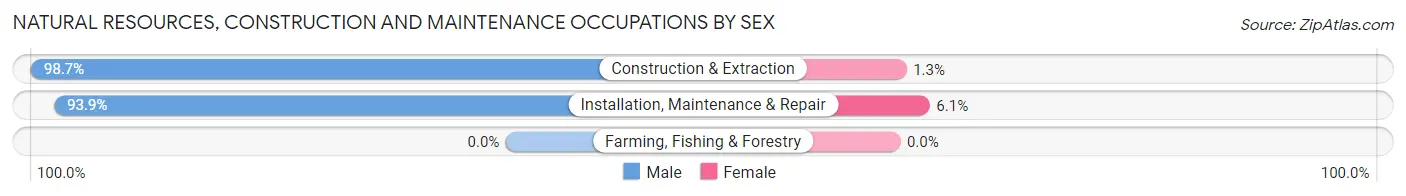
| Occupation | Male | Female |
| Farming, Fishing & Forestry | 0 (0.0%) | 0 (0.0%) |
| Construction & Extraction | 605 (98.7%) | 8 (1.3%) |
| Installation, Maintenance & Repair | 673 (93.9%) | 44 (6.1%) |
| Total (Category) | 1,278 (96.1%) | 52 (3.9%) |
| Total (Overall) | 4,783 (53.9%) | 4,093 (46.1%) |
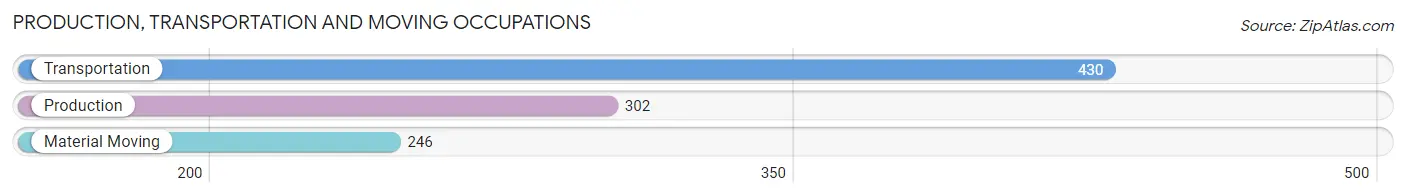
Production, Transportation and Moving Occupations
The most common Production, Transportation and Moving occupations in Yucca Valley are Transportation (430 | 4.8%), Production (302 | 3.4%), and Material Moving (246 | 2.8%).
Production, Transportation and Moving Occupations by Sex
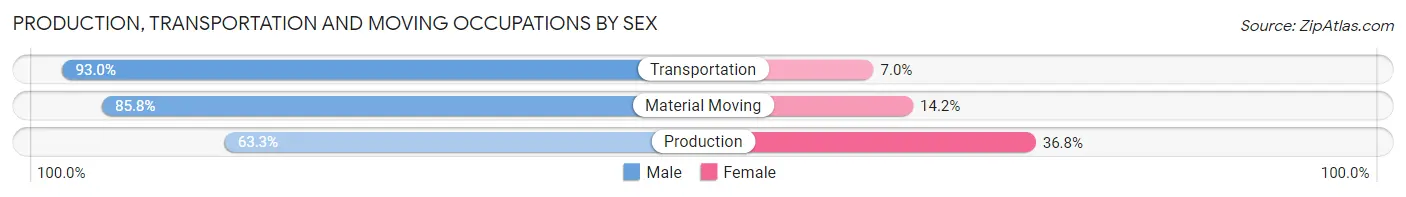
| Occupation | Male | Female |
| Production | 191 (63.2%) | 111 (36.7%) |
| Transportation | 400 (93.0%) | 30 (7.0%) |
| Material Moving | 211 (85.8%) | 35 (14.2%) |
| Total (Category) | 802 (82.0%) | 176 (18.0%) |
| Total (Overall) | 4,783 (53.9%) | 4,093 (46.1%) |
Employment Industries by Sex in Yucca Valley
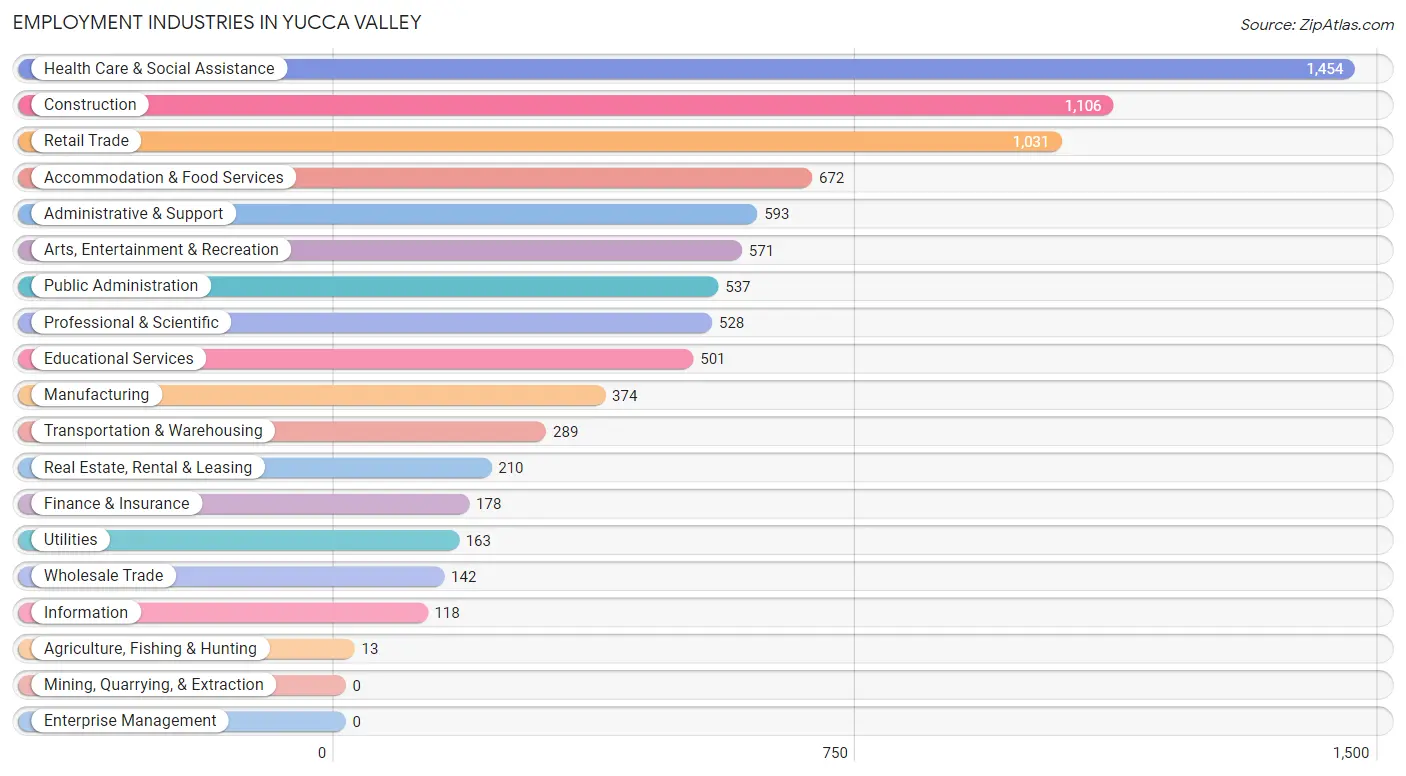
Employment Industries in Yucca Valley
The major employment industries in Yucca Valley include Health Care & Social Assistance (1,454 | 16.4%), Construction (1,106 | 12.5%), Retail Trade (1,031 | 11.6%), Accommodation & Food Services (672 | 7.6%), and Administrative & Support (593 | 6.7%).
Employment Industries by Sex in Yucca Valley
The Yucca Valley industries that see more men than women are Wholesale Trade (100.0%), Construction (93.0%), and Information (85.6%), whereas the industries that tend to have a higher number of women are Agriculture, Fishing & Hunting (100.0%), Finance & Insurance (90.4%), and Health Care & Social Assistance (73.3%).
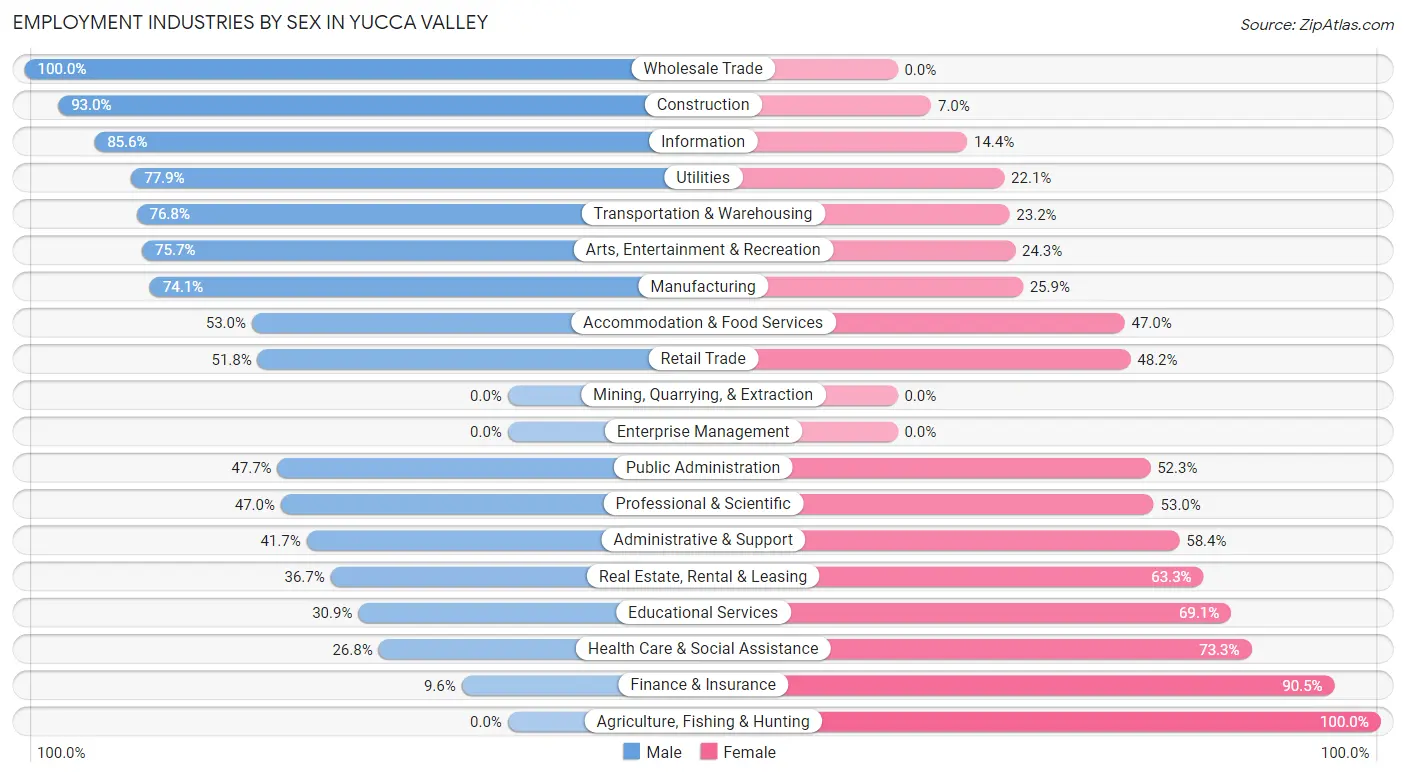
| Industry | Male | Female |
| Agriculture, Fishing & Hunting | 0 (0.0%) | 13 (100.0%) |
| Mining, Quarrying, & Extraction | 0 (0.0%) | 0 (0.0%) |
| Construction | 1,029 (93.0%) | 77 (7.0%) |
| Manufacturing | 277 (74.1%) | 97 (25.9%) |
| Wholesale Trade | 142 (100.0%) | 0 (0.0%) |
| Retail Trade | 534 (51.8%) | 497 (48.2%) |
| Transportation & Warehousing | 222 (76.8%) | 67 (23.2%) |
| Utilities | 127 (77.9%) | 36 (22.1%) |
| Information | 101 (85.6%) | 17 (14.4%) |
| Finance & Insurance | 17 (9.6%) | 161 (90.4%) |
| Real Estate, Rental & Leasing | 77 (36.7%) | 133 (63.3%) |
| Professional & Scientific | 248 (47.0%) | 280 (53.0%) |
| Enterprise Management | 0 (0.0%) | 0 (0.0%) |
| Administrative & Support | 247 (41.6%) | 346 (58.4%) |
| Educational Services | 155 (30.9%) | 346 (69.1%) |
| Health Care & Social Assistance | 389 (26.8%) | 1,065 (73.3%) |
| Arts, Entertainment & Recreation | 432 (75.7%) | 139 (24.3%) |
| Accommodation & Food Services | 356 (53.0%) | 316 (47.0%) |
| Public Administration | 256 (47.7%) | 281 (52.3%) |
| Total | 4,783 (53.9%) | 4,093 (46.1%) |
Education in Yucca Valley
School Enrollment in Yucca Valley
The most common levels of schooling among the 5,446 students in Yucca Valley are high school (1,235 | 22.7%), middle school (1,176 | 21.6%), and elementary school (1,136 | 20.9%).
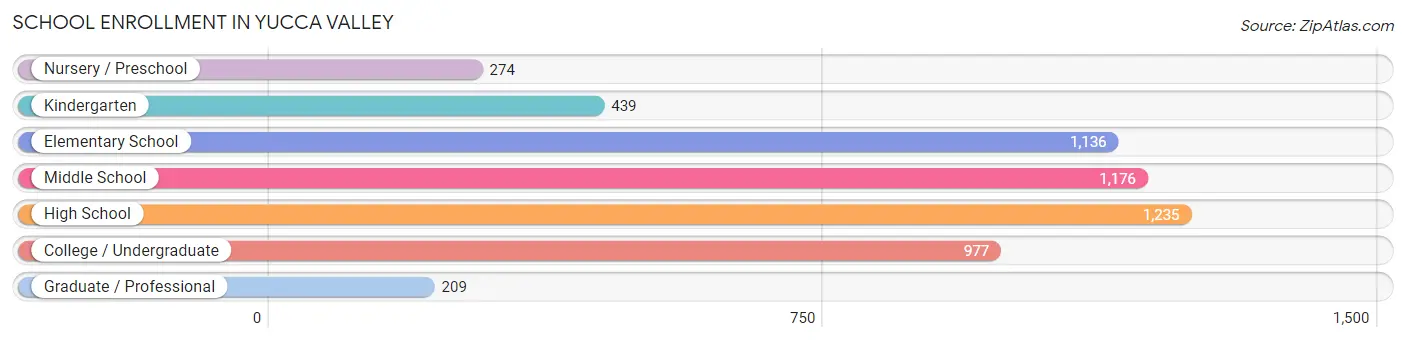
| School Level | # Students | % Students |
| Nursery / Preschool | 274 | 5.0% |
| Kindergarten | 439 | 8.1% |
| Elementary School | 1,136 | 20.9% |
| Middle School | 1,176 | 21.6% |
| High School | 1,235 | 22.7% |
| College / Undergraduate | 977 | 17.9% |
| Graduate / Professional | 209 | 3.8% |
| Total | 5,446 | 100.0% |
School Enrollment by Age by Funding Source in Yucca Valley
Out of a total of 5,446 students who are enrolled in schools in Yucca Valley, 1,008 (18.5%) attend a private institution, while the remaining 4,438 (81.5%) are enrolled in public schools. The age group of 25 to 34 year olds has the highest likelihood of being enrolled in private schools, with 171 (39.0% in the age bracket) enrolled. Conversely, the age group of 10 to 14 year olds has the lowest likelihood of being enrolled in a private school, with 1,248 (87.9% in the age bracket) attending a public institution.
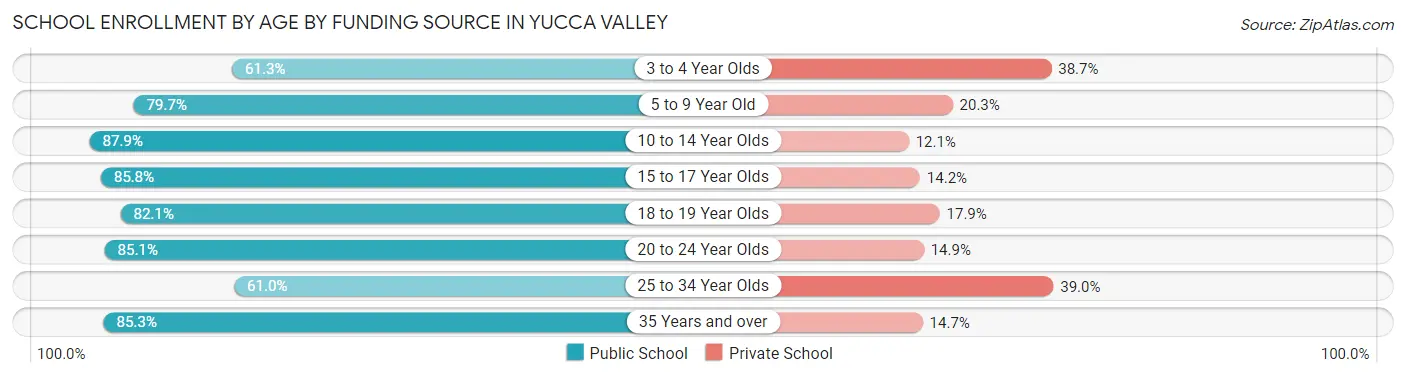
| Age Bracket | Public School | Private School |
| 3 to 4 Year Olds | 111 (61.3%) | 70 (38.7%) |
| 5 to 9 Year Old | 1,273 (79.7%) | 324 (20.3%) |
| 10 to 14 Year Olds | 1,248 (87.9%) | 172 (12.1%) |
| 15 to 17 Year Olds | 816 (85.8%) | 135 (14.2%) |
| 18 to 19 Year Olds | 239 (82.1%) | 52 (17.9%) |
| 20 to 24 Year Olds | 194 (85.1%) | 34 (14.9%) |
| 25 to 34 Year Olds | 267 (61.0%) | 171 (39.0%) |
| 35 Years and over | 290 (85.3%) | 50 (14.7%) |
| Total | 4,438 (81.5%) | 1,008 (18.5%) |
Educational Attainment by Field of Study in Yucca Valley
Business (736 | 24.4%), science & technology (334 | 11.1%), liberal arts & history (270 | 9.0%), bio, nature & agricultural (235 | 7.8%), and social sciences (214 | 7.1%) are the most common fields of study among 3,015 individuals in Yucca Valley who have obtained a bachelor's degree or higher.
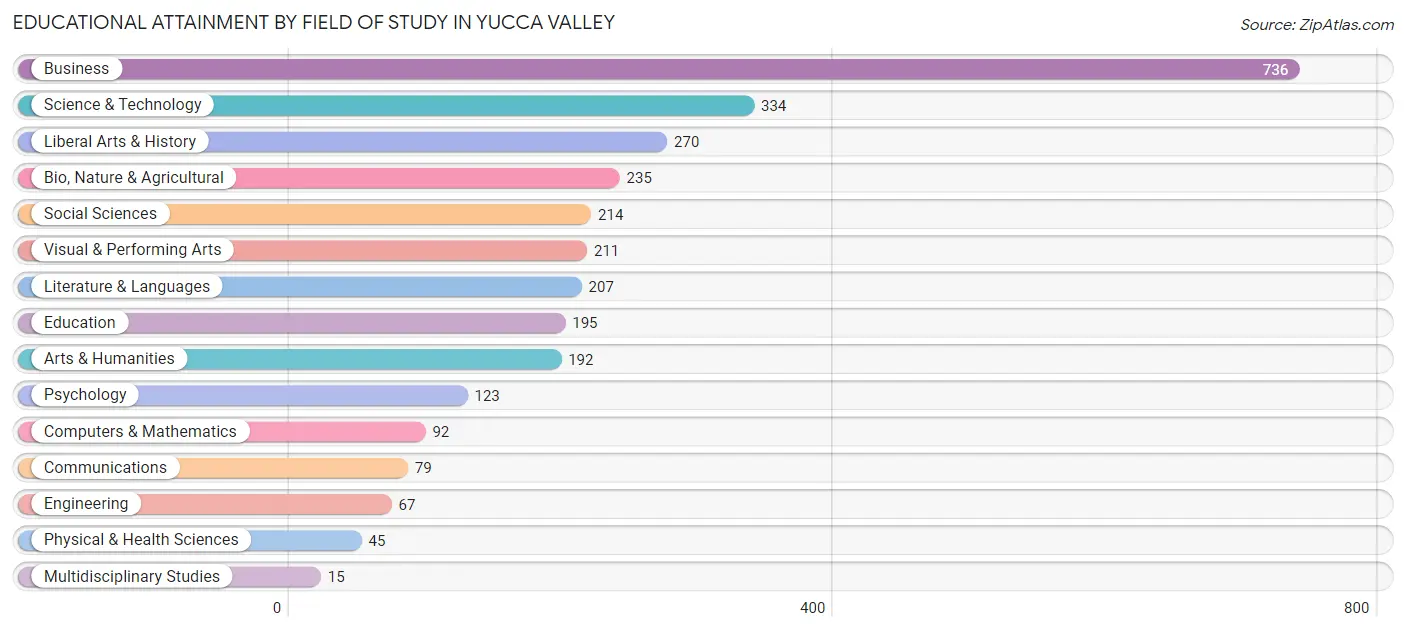
| Field of Study | # Graduates | % Graduates |
| Computers & Mathematics | 92 | 3.0% |
| Bio, Nature & Agricultural | 235 | 7.8% |
| Physical & Health Sciences | 45 | 1.5% |
| Psychology | 123 | 4.1% |
| Social Sciences | 214 | 7.1% |
| Engineering | 67 | 2.2% |
| Multidisciplinary Studies | 15 | 0.5% |
| Science & Technology | 334 | 11.1% |
| Business | 736 | 24.4% |
| Education | 195 | 6.5% |
| Literature & Languages | 207 | 6.9% |
| Liberal Arts & History | 270 | 9.0% |
| Visual & Performing Arts | 211 | 7.0% |
| Communications | 79 | 2.6% |
| Arts & Humanities | 192 | 6.4% |
| Total | 3,015 | 100.0% |
Transportation & Commute in Yucca Valley
Vehicle Availability by Sex in Yucca Valley
The most prevalent vehicle ownership categories in Yucca Valley are males with 2 vehicles (2,039, accounting for 42.5%) and females with 2 vehicles (1,396, making up 50.2%).
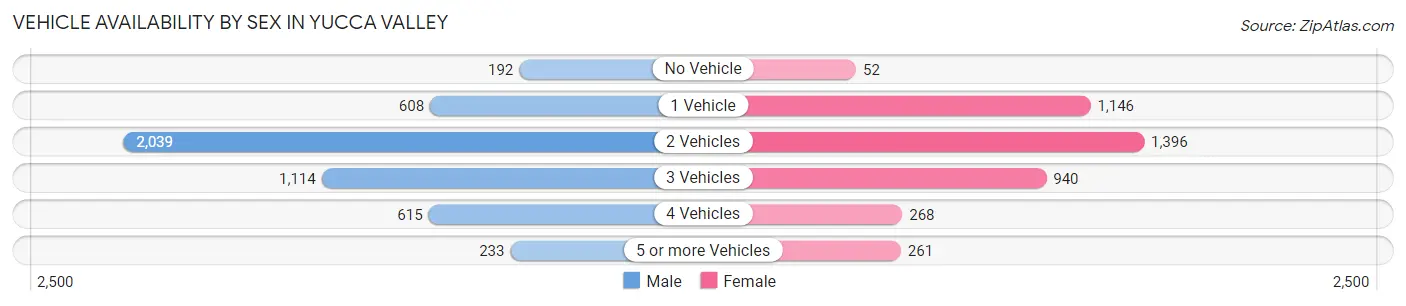
| Vehicles Available | Male | Female |
| No Vehicle | 192 (4.0%) | 52 (1.3%) |
| 1 Vehicle | 608 (12.7%) | 1,146 (28.2%) |
| 2 Vehicles | 2,039 (42.5%) | 1,396 (34.4%) |
| 3 Vehicles | 1,114 (23.2%) | 940 (23.1%) |
| 4 Vehicles | 615 (12.8%) | 268 (6.6%) |
| 5 or more Vehicles | 233 (4.9%) | 261 (6.4%) |
| Total | 4,801 (100.0%) | 4,063 (100.0%) |
Commute Time in Yucca Valley
The most frequently occuring commute durations in Yucca Valley are 10 to 14 minutes (1,904 commuters, 22.5%), 5 to 9 minutes (1,680 commuters, 19.9%), and 45 to 59 minutes (1,311 commuters, 15.5%).
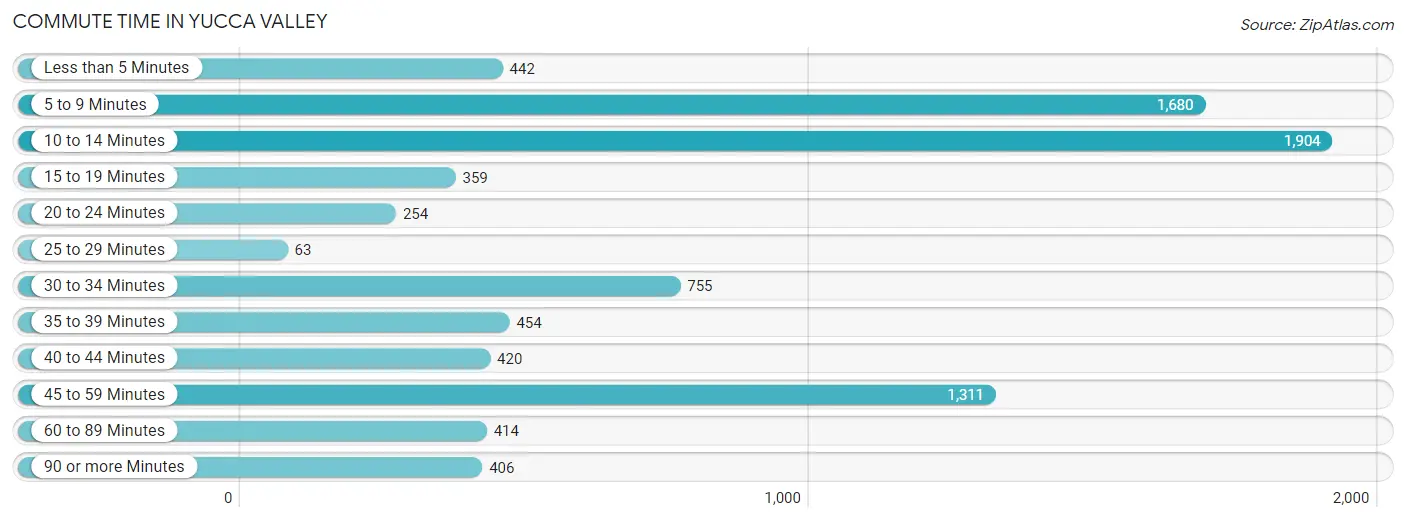
| Commute Time | # Commuters | % Commuters |
| Less than 5 Minutes | 442 | 5.2% |
| 5 to 9 Minutes | 1,680 | 19.9% |
| 10 to 14 Minutes | 1,904 | 22.5% |
| 15 to 19 Minutes | 359 | 4.2% |
| 20 to 24 Minutes | 254 | 3.0% |
| 25 to 29 Minutes | 63 | 0.7% |
| 30 to 34 Minutes | 755 | 8.9% |
| 35 to 39 Minutes | 454 | 5.4% |
| 40 to 44 Minutes | 420 | 5.0% |
| 45 to 59 Minutes | 1,311 | 15.5% |
| 60 to 89 Minutes | 414 | 4.9% |
| 90 or more Minutes | 406 | 4.8% |
Commute Time by Sex in Yucca Valley
The most common commute times in Yucca Valley are 10 to 14 minutes (916 commuters, 19.9%) for males and 5 to 9 minutes (1,050 commuters, 27.3%) for females.
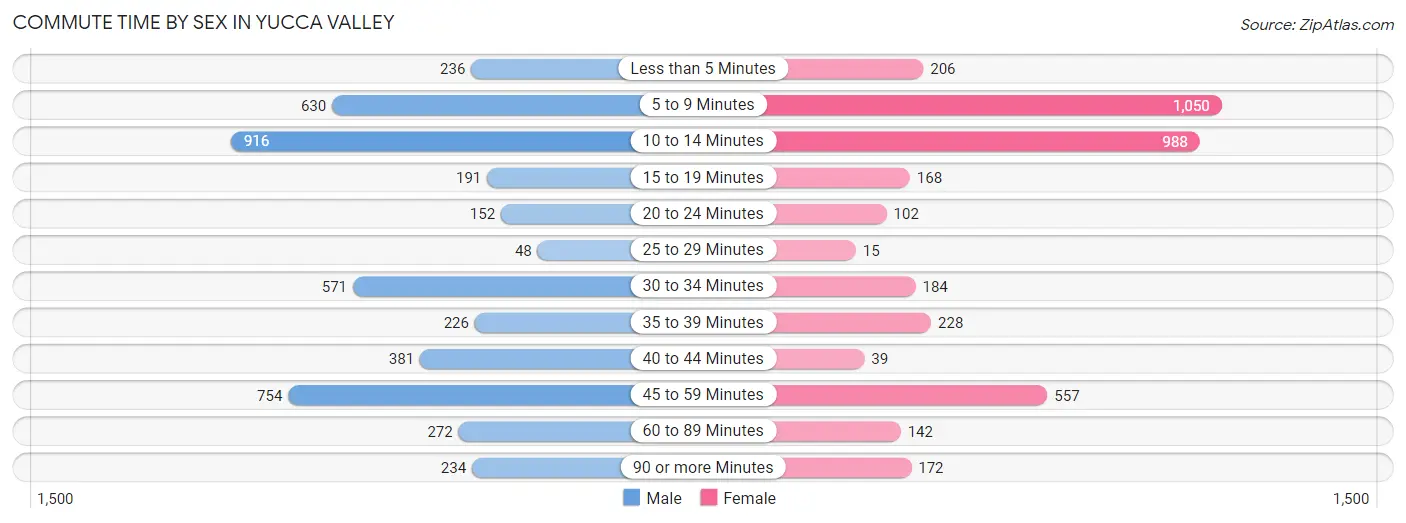
| Commute Time | Male | Female |
| Less than 5 Minutes | 236 (5.1%) | 206 (5.3%) |
| 5 to 9 Minutes | 630 (13.7%) | 1,050 (27.3%) |
| 10 to 14 Minutes | 916 (19.9%) | 988 (25.7%) |
| 15 to 19 Minutes | 191 (4.1%) | 168 (4.4%) |
| 20 to 24 Minutes | 152 (3.3%) | 102 (2.6%) |
| 25 to 29 Minutes | 48 (1.0%) | 15 (0.4%) |
| 30 to 34 Minutes | 571 (12.4%) | 184 (4.8%) |
| 35 to 39 Minutes | 226 (4.9%) | 228 (5.9%) |
| 40 to 44 Minutes | 381 (8.3%) | 39 (1.0%) |
| 45 to 59 Minutes | 754 (16.4%) | 557 (14.5%) |
| 60 to 89 Minutes | 272 (5.9%) | 142 (3.7%) |
| 90 or more Minutes | 234 (5.1%) | 172 (4.5%) |
Time of Departure to Work by Sex in Yucca Valley
The most frequent times of departure to work in Yucca Valley are 5:30 AM to 5:59 AM (610, 13.2%) for males and 9:00 AM to 9:59 AM (428, 11.1%) for females.
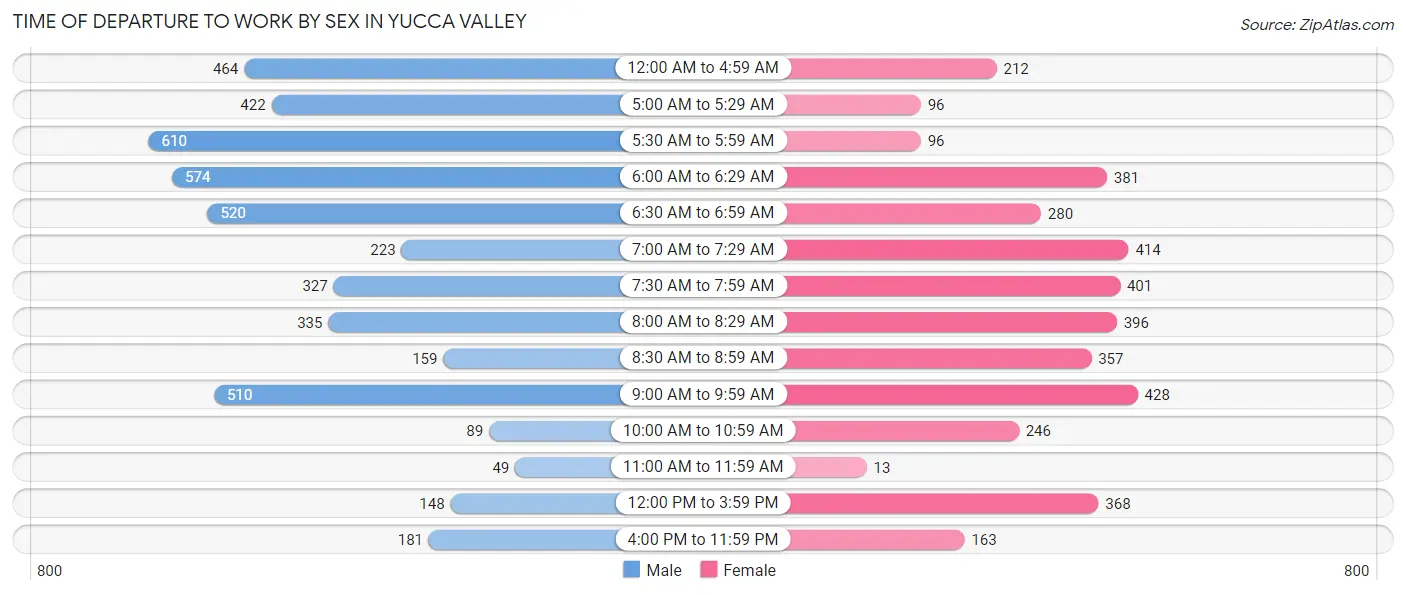
| Time of Departure | Male | Female |
| 12:00 AM to 4:59 AM | 464 (10.1%) | 212 (5.5%) |
| 5:00 AM to 5:29 AM | 422 (9.1%) | 96 (2.5%) |
| 5:30 AM to 5:59 AM | 610 (13.2%) | 96 (2.5%) |
| 6:00 AM to 6:29 AM | 574 (12.4%) | 381 (9.9%) |
| 6:30 AM to 6:59 AM | 520 (11.3%) | 280 (7.3%) |
| 7:00 AM to 7:29 AM | 223 (4.8%) | 414 (10.7%) |
| 7:30 AM to 7:59 AM | 327 (7.1%) | 401 (10.4%) |
| 8:00 AM to 8:29 AM | 335 (7.3%) | 396 (10.3%) |
| 8:30 AM to 8:59 AM | 159 (3.5%) | 357 (9.3%) |
| 9:00 AM to 9:59 AM | 510 (11.1%) | 428 (11.1%) |
| 10:00 AM to 10:59 AM | 89 (1.9%) | 246 (6.4%) |
| 11:00 AM to 11:59 AM | 49 (1.1%) | 13 (0.3%) |
| 12:00 PM to 3:59 PM | 148 (3.2%) | 368 (9.6%) |
| 4:00 PM to 11:59 PM | 181 (3.9%) | 163 (4.2%) |
| Total | 4,611 (100.0%) | 3,851 (100.0%) |
Housing Occupancy in Yucca Valley
Occupancy by Ownership in Yucca Valley
Of the total 8,734 dwellings in Yucca Valley, owner-occupied units account for 5,726 (65.6%), while renter-occupied units make up 3,008 (34.4%).
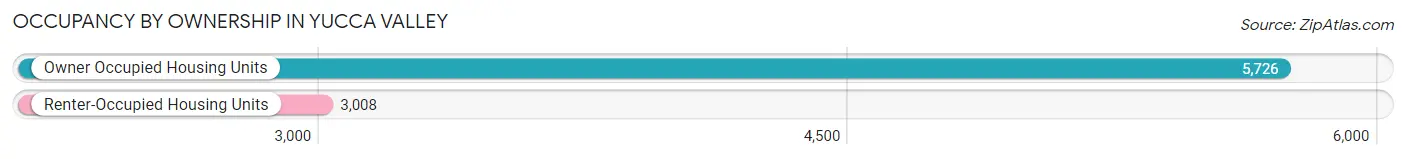
| Occupancy | # Housing Units | % Housing Units |
| Owner Occupied Housing Units | 5,726 | 65.6% |
| Renter-Occupied Housing Units | 3,008 | 34.4% |
| Total Occupied Housing Units | 8,734 | 100.0% |
Occupancy by Household Size in Yucca Valley
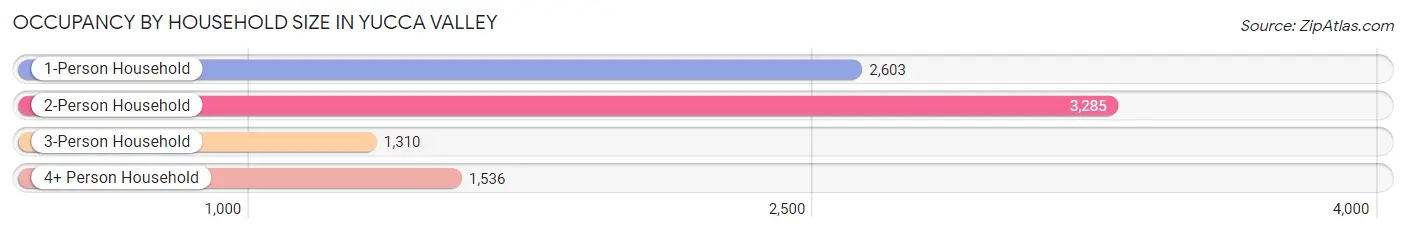
| Household Size | # Housing Units | % Housing Units |
| 1-Person Household | 2,603 | 29.8% |
| 2-Person Household | 3,285 | 37.6% |
| 3-Person Household | 1,310 | 15.0% |
| 4+ Person Household | 1,536 | 17.6% |
| Total Housing Units | 8,734 | 100.0% |
Occupancy by Ownership by Household Size in Yucca Valley
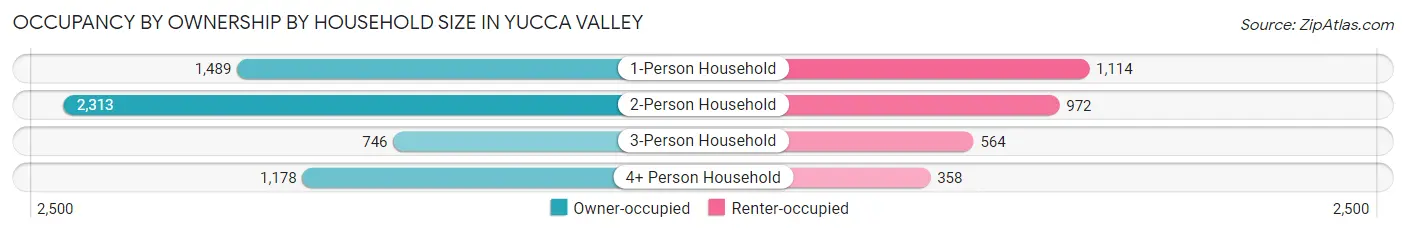
| Household Size | Owner-occupied | Renter-occupied |
| 1-Person Household | 1,489 (57.2%) | 1,114 (42.8%) |
| 2-Person Household | 2,313 (70.4%) | 972 (29.6%) |
| 3-Person Household | 746 (57.0%) | 564 (43.0%) |
| 4+ Person Household | 1,178 (76.7%) | 358 (23.3%) |
| Total Housing Units | 5,726 (65.6%) | 3,008 (34.4%) |
Occupancy by Educational Attainment in Yucca Valley
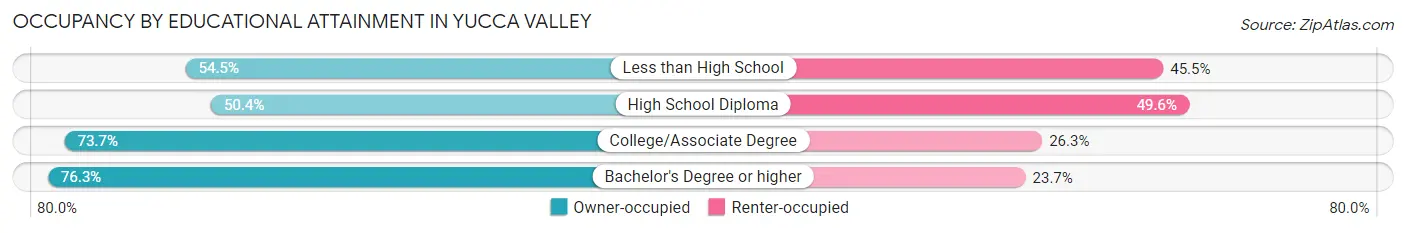
| Household Size | Owner-occupied | Renter-occupied |
| Less than High School | 440 (54.5%) | 368 (45.5%) |
| High School Diploma | 1,304 (50.4%) | 1,282 (49.6%) |
| College/Associate Degree | 2,578 (73.7%) | 922 (26.3%) |
| Bachelor's Degree or higher | 1,404 (76.3%) | 436 (23.7%) |
Occupancy by Age of Householder in Yucca Valley
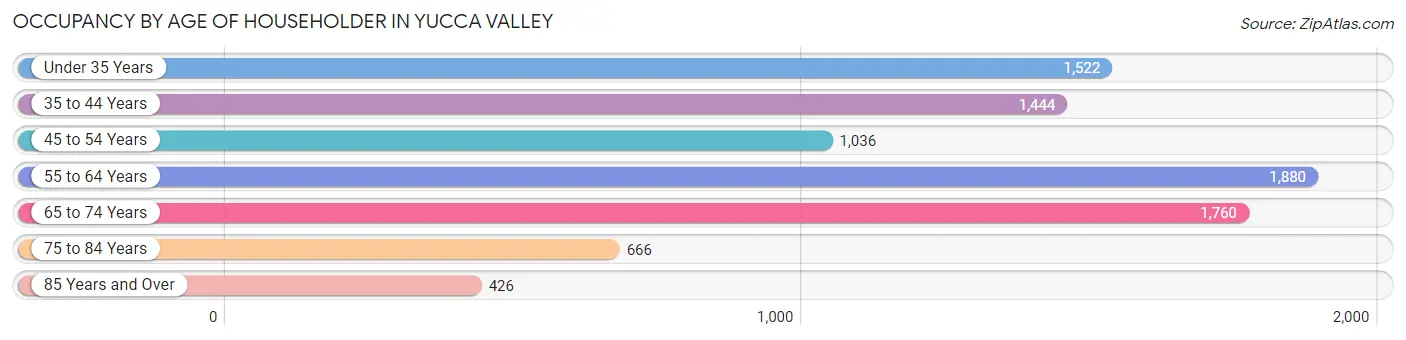
| Age Bracket | # Households | % Households |
| Under 35 Years | 1,522 | 17.4% |
| 35 to 44 Years | 1,444 | 16.5% |
| 45 to 54 Years | 1,036 | 11.9% |
| 55 to 64 Years | 1,880 | 21.5% |
| 65 to 74 Years | 1,760 | 20.2% |
| 75 to 84 Years | 666 | 7.6% |
| 85 Years and Over | 426 | 4.9% |
| Total | 8,734 | 100.0% |
Housing Finances in Yucca Valley
Median Income by Occupancy in Yucca Valley
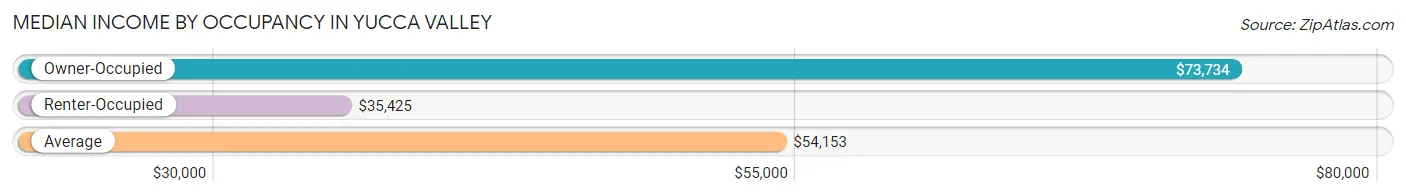
| Occupancy Type | # Households | Median Income |
| Owner-Occupied | 5,726 (65.6%) | $73,734 |
| Renter-Occupied | 3,008 (34.4%) | $35,425 |
| Average | 8,734 (100.0%) | $54,153 |
Occupancy by Householder Income Bracket in Yucca Valley
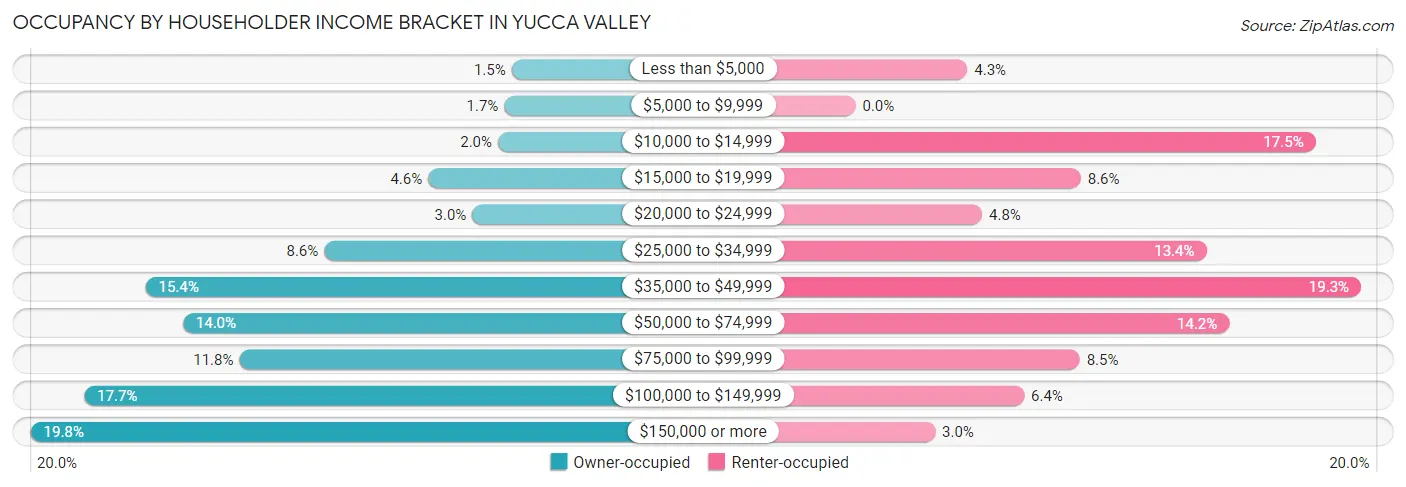
| Income Bracket | Owner-occupied | Renter-occupied |
| Less than $5,000 | 83 (1.5%) | 128 (4.3%) |
| $5,000 to $9,999 | 99 (1.7%) | 0 (0.0%) |
| $10,000 to $14,999 | 113 (2.0%) | 527 (17.5%) |
| $15,000 to $19,999 | 265 (4.6%) | 258 (8.6%) |
| $20,000 to $24,999 | 169 (2.9%) | 145 (4.8%) |
| $25,000 to $34,999 | 492 (8.6%) | 402 (13.4%) |
| $35,000 to $49,999 | 881 (15.4%) | 579 (19.3%) |
| $50,000 to $74,999 | 800 (14.0%) | 428 (14.2%) |
| $75,000 to $99,999 | 677 (11.8%) | 257 (8.5%) |
| $100,000 to $149,999 | 1,015 (17.7%) | 193 (6.4%) |
| $150,000 or more | 1,132 (19.8%) | 91 (3.0%) |
| Total | 5,726 (100.0%) | 3,008 (100.0%) |
Monthly Housing Cost Tiers in Yucca Valley
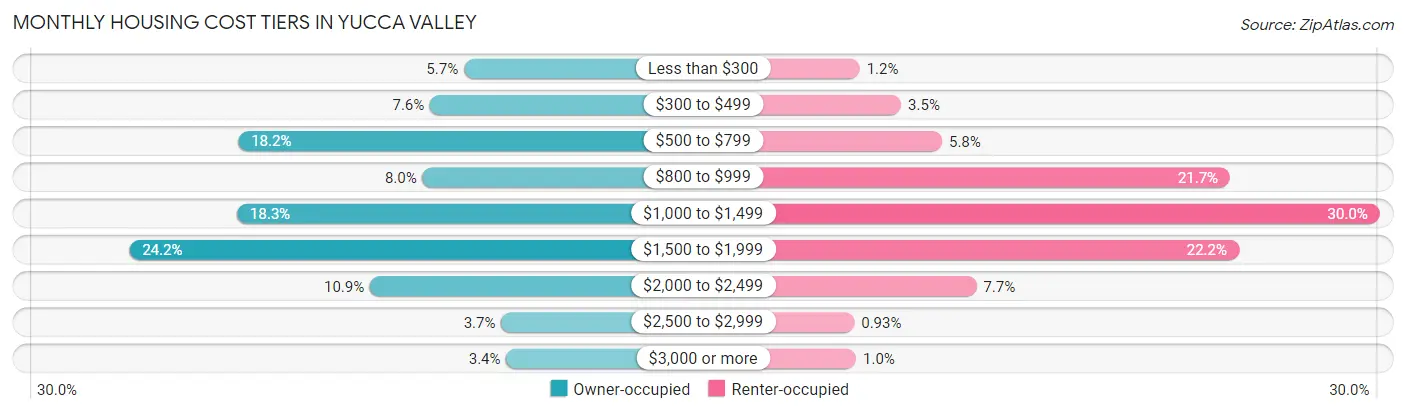
| Monthly Cost | Owner-occupied | Renter-occupied |
| Less than $300 | 328 (5.7%) | 37 (1.2%) |
| $300 to $499 | 435 (7.6%) | 106 (3.5%) |
| $500 to $799 | 1,042 (18.2%) | 174 (5.8%) |
| $800 to $999 | 459 (8.0%) | 652 (21.7%) |
| $1,000 to $1,499 | 1,046 (18.3%) | 901 (29.9%) |
| $1,500 to $1,999 | 1,387 (24.2%) | 667 (22.2%) |
| $2,000 to $2,499 | 625 (10.9%) | 231 (7.7%) |
| $2,500 to $2,999 | 210 (3.7%) | 28 (0.9%) |
| $3,000 or more | 194 (3.4%) | 31 (1.0%) |
| Total | 5,726 (100.0%) | 3,008 (100.0%) |
Physical Housing Characteristics in Yucca Valley
Housing Structures in Yucca Valley
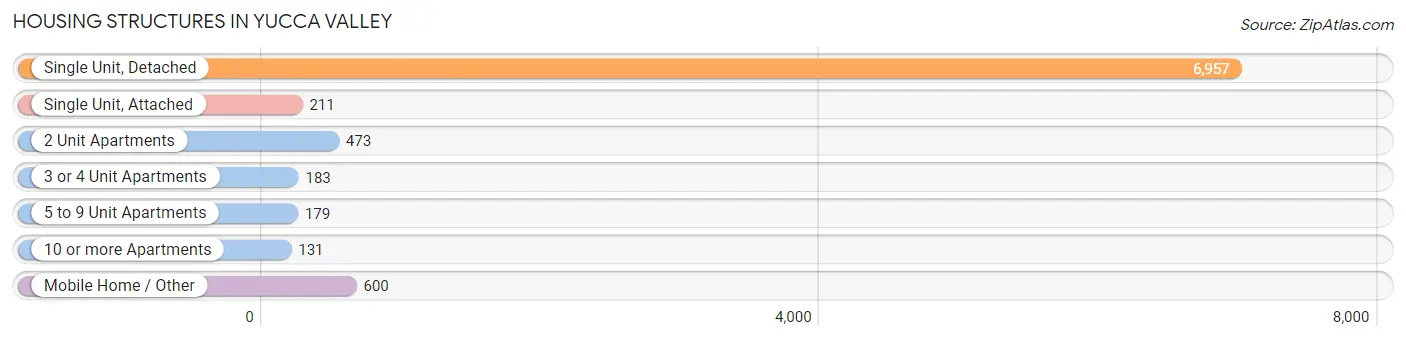
| Structure Type | # Housing Units | % Housing Units |
| Single Unit, Detached | 6,957 | 79.6% |
| Single Unit, Attached | 211 | 2.4% |
| 2 Unit Apartments | 473 | 5.4% |
| 3 or 4 Unit Apartments | 183 | 2.1% |
| 5 to 9 Unit Apartments | 179 | 2.1% |
| 10 or more Apartments | 131 | 1.5% |
| Mobile Home / Other | 600 | 6.9% |
| Total | 8,734 | 100.0% |
Housing Structures by Occupancy in Yucca Valley
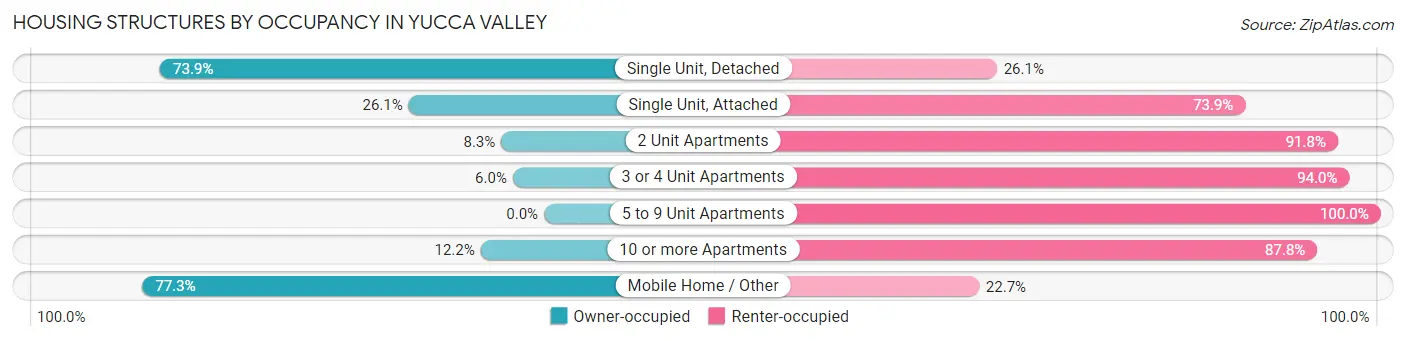
| Structure Type | Owner-occupied | Renter-occupied |
| Single Unit, Detached | 5,141 (73.9%) | 1,816 (26.1%) |
| Single Unit, Attached | 55 (26.1%) | 156 (73.9%) |
| 2 Unit Apartments | 39 (8.3%) | 434 (91.7%) |
| 3 or 4 Unit Apartments | 11 (6.0%) | 172 (94.0%) |
| 5 to 9 Unit Apartments | 0 (0.0%) | 179 (100.0%) |
| 10 or more Apartments | 16 (12.2%) | 115 (87.8%) |
| Mobile Home / Other | 464 (77.3%) | 136 (22.7%) |
| Total | 5,726 (65.6%) | 3,008 (34.4%) |
Housing Structures by Number of Rooms in Yucca Valley
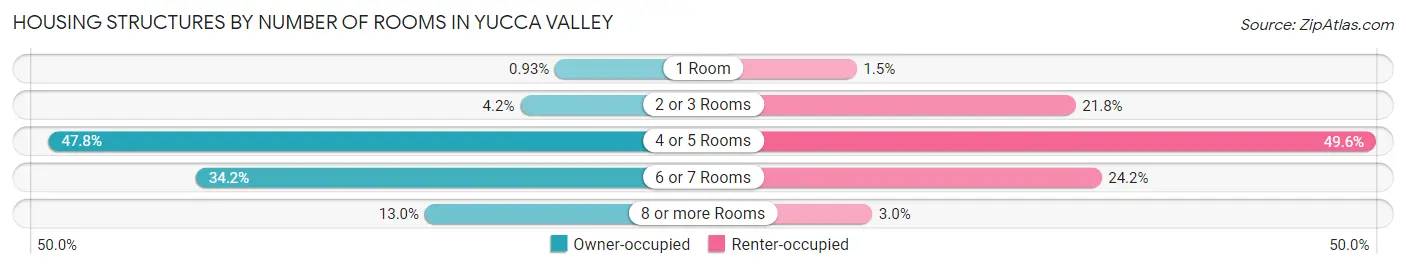
| Number of Rooms | Owner-occupied | Renter-occupied |
| 1 Room | 53 (0.9%) | 46 (1.5%) |
| 2 or 3 Rooms | 238 (4.2%) | 655 (21.8%) |
| 4 or 5 Rooms | 2,736 (47.8%) | 1,491 (49.6%) |
| 6 or 7 Rooms | 1,956 (34.2%) | 727 (24.2%) |
| 8 or more Rooms | 743 (13.0%) | 89 (3.0%) |
| Total | 5,726 (100.0%) | 3,008 (100.0%) |
Housing Structure by Heating Type in Yucca Valley
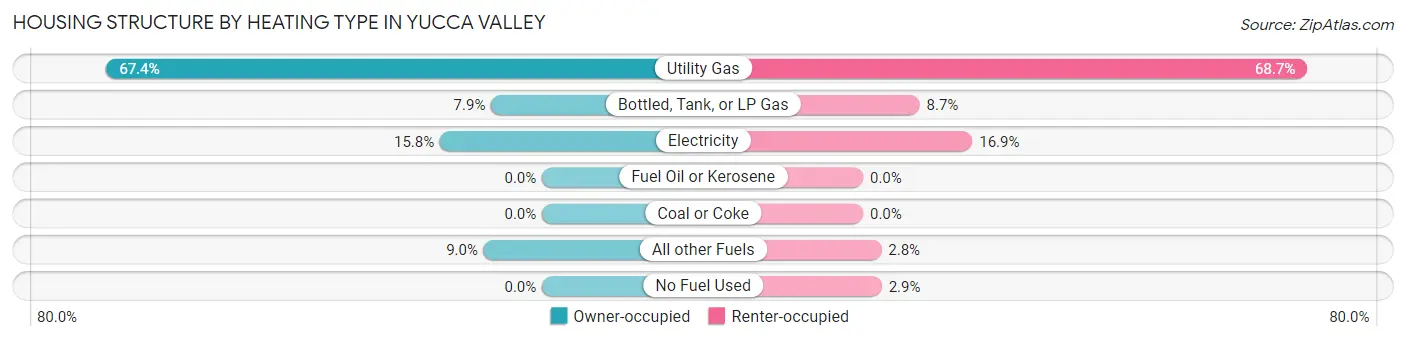
| Heating Type | Owner-occupied | Renter-occupied |
| Utility Gas | 3,857 (67.4%) | 2,065 (68.6%) |
| Bottled, Tank, or LP Gas | 450 (7.9%) | 263 (8.7%) |
| Electricity | 903 (15.8%) | 508 (16.9%) |
| Fuel Oil or Kerosene | 0 (0.0%) | 0 (0.0%) |
| Coal or Coke | 0 (0.0%) | 0 (0.0%) |
| All other Fuels | 516 (9.0%) | 85 (2.8%) |
| No Fuel Used | 0 (0.0%) | 87 (2.9%) |
| Total | 5,726 (100.0%) | 3,008 (100.0%) |
Household Vehicle Usage in Yucca Valley
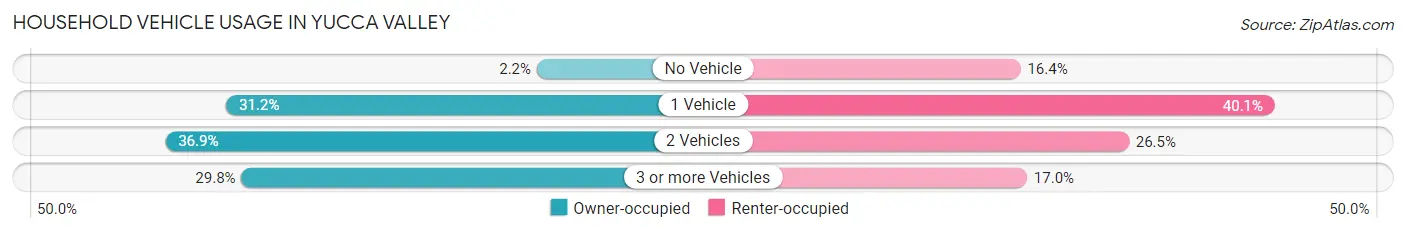
| Vehicles per Household | Owner-occupied | Renter-occupied |
| No Vehicle | 125 (2.2%) | 493 (16.4%) |
| 1 Vehicle | 1,786 (31.2%) | 1,207 (40.1%) |
| 2 Vehicles | 2,111 (36.9%) | 797 (26.5%) |
| 3 or more Vehicles | 1,704 (29.8%) | 511 (17.0%) |
| Total | 5,726 (100.0%) | 3,008 (100.0%) |
Real Estate & Mortgages in Yucca Valley
Real Estate and Mortgage Overview in Yucca Valley
| Characteristic | Without Mortgage | With Mortgage |
| Housing Units | 2,141 | 3,585 |
| Median Property Value | $213,300 | $309,200 |
| Median Household Income | $49,230 | $1,035 |
| Monthly Housing Costs | $573 | $178 |
| Real Estate Taxes | $2,024 | $99 |
Property Value by Mortgage Status in Yucca Valley
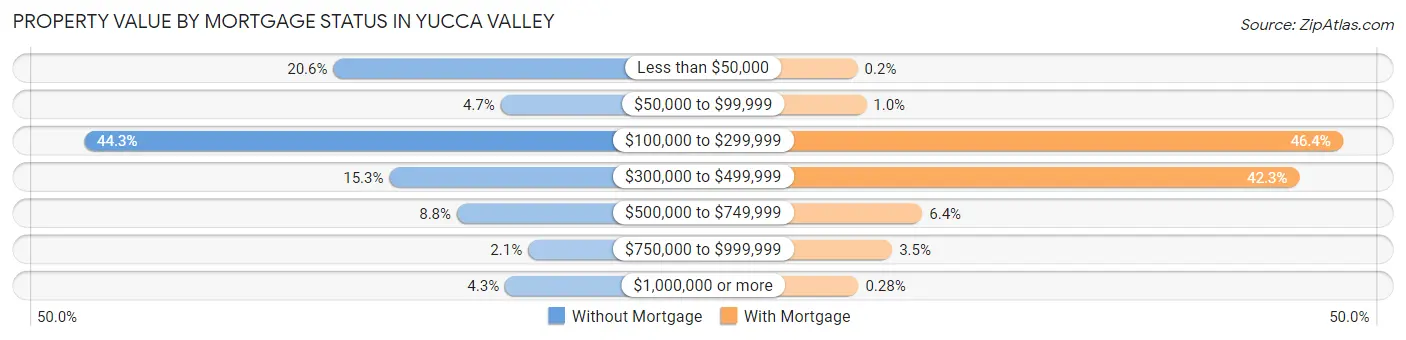
| Property Value | Without Mortgage | With Mortgage |
| Less than $50,000 | 441 (20.6%) | 7 (0.2%) |
| $50,000 to $99,999 | 100 (4.7%) | 37 (1.0%) |
| $100,000 to $299,999 | 949 (44.3%) | 1,663 (46.4%) |
| $300,000 to $499,999 | 327 (15.3%) | 1,515 (42.3%) |
| $500,000 to $749,999 | 189 (8.8%) | 228 (6.4%) |
| $750,000 to $999,999 | 44 (2.1%) | 125 (3.5%) |
| $1,000,000 or more | 91 (4.3%) | 10 (0.3%) |
| Total | 2,141 (100.0%) | 3,585 (100.0%) |
Household Income by Mortgage Status in Yucca Valley
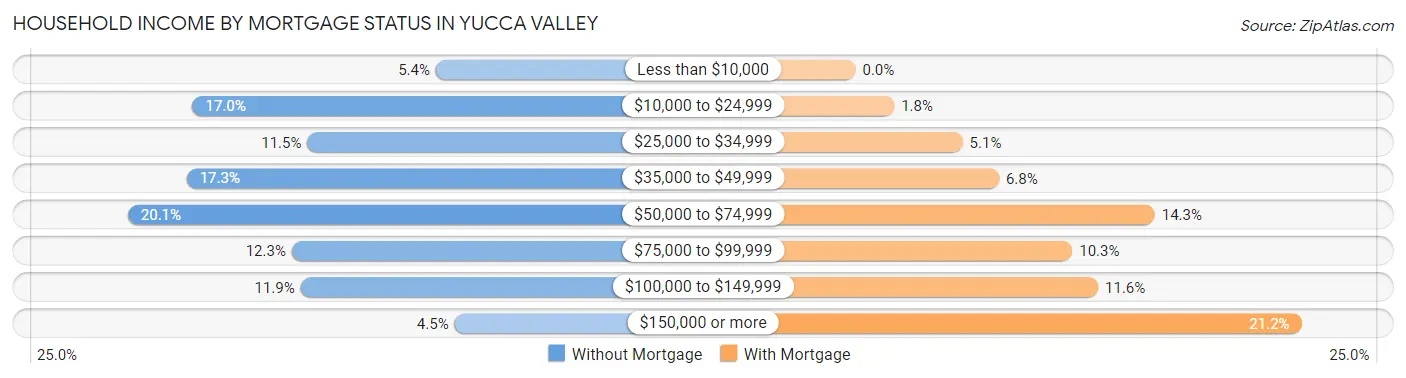
| Household Income | Without Mortgage | With Mortgage |
| Less than $10,000 | 116 (5.4%) | 0 (0.0%) |
| $10,000 to $24,999 | 364 (17.0%) | 66 (1.8%) |
| $25,000 to $34,999 | 247 (11.5%) | 183 (5.1%) |
| $35,000 to $49,999 | 370 (17.3%) | 245 (6.8%) |
| $50,000 to $74,999 | 430 (20.1%) | 511 (14.2%) |
| $75,000 to $99,999 | 263 (12.3%) | 370 (10.3%) |
| $100,000 to $149,999 | 254 (11.9%) | 414 (11.6%) |
| $150,000 or more | 97 (4.5%) | 761 (21.2%) |
| Total | 2,141 (100.0%) | 3,585 (100.0%) |
Property Value to Household Income Ratio in Yucca Valley
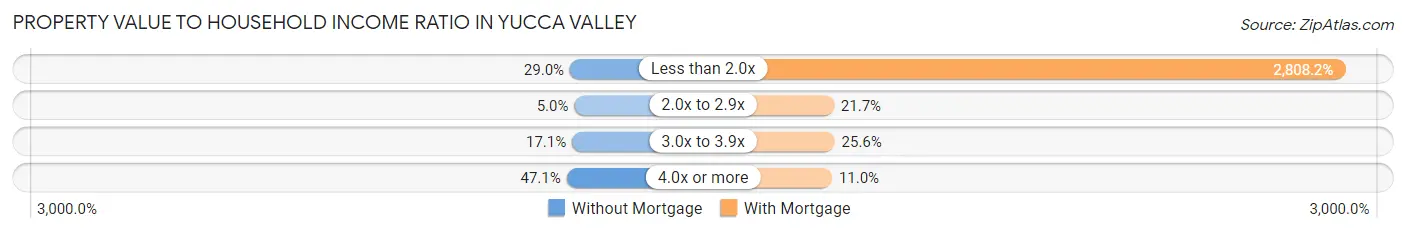
| Value-to-Income Ratio | Without Mortgage | With Mortgage |
| Less than 2.0x | 620 (29.0%) | 100,673 (2,808.2%) |
| 2.0x to 2.9x | 107 (5.0%) | 776 (21.6%) |
| 3.0x to 3.9x | 367 (17.1%) | 919 (25.6%) |
| 4.0x or more | 1,008 (47.1%) | 395 (11.0%) |
| Total | 2,141 (100.0%) | 3,585 (100.0%) |
Real Estate Taxes by Mortgage Status in Yucca Valley
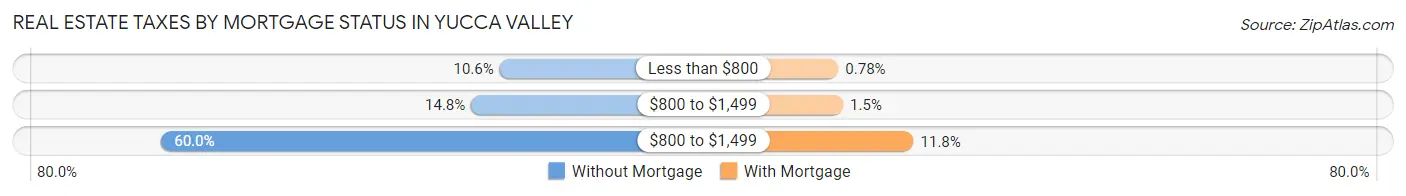
| Property Taxes | Without Mortgage | With Mortgage |
| Less than $800 | 227 (10.6%) | 28 (0.8%) |
| $800 to $1,499 | 316 (14.8%) | 53 (1.5%) |
| $800 to $1,499 | 1,285 (60.0%) | 422 (11.8%) |
| Total | 2,141 (100.0%) | 3,585 (100.0%) |
Health & Disability in Yucca Valley
Health Insurance Coverage by Age in Yucca Valley
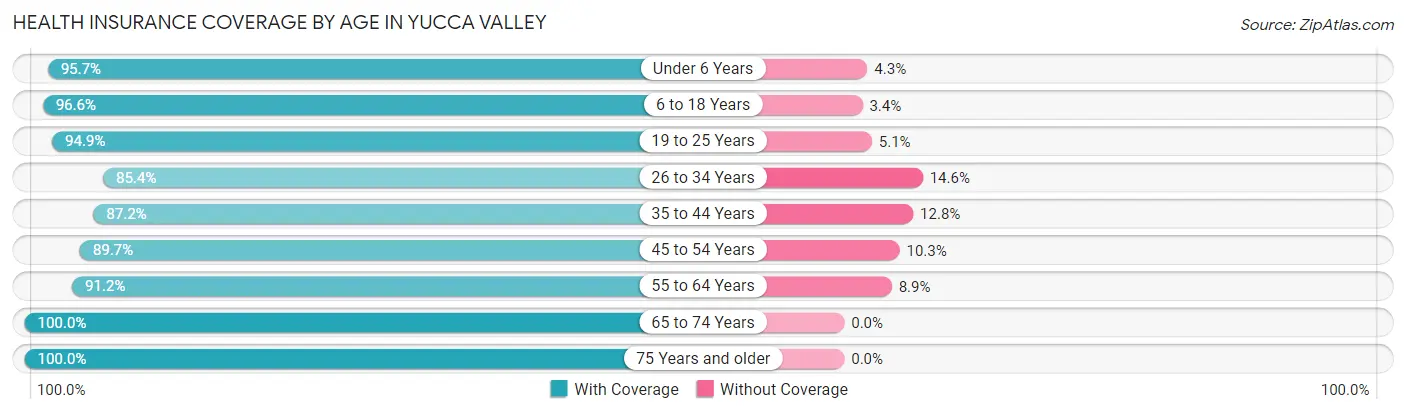
| Age Bracket | With Coverage | Without Coverage |
| Under 6 Years | 1,242 (95.7%) | 56 (4.3%) |
| 6 to 18 Years | 3,833 (96.6%) | 134 (3.4%) |
| 19 to 25 Years | 1,752 (94.9%) | 95 (5.1%) |
| 26 to 34 Years | 2,025 (85.4%) | 347 (14.6%) |
| 35 to 44 Years | 2,200 (87.2%) | 324 (12.8%) |
| 45 to 54 Years | 1,687 (89.7%) | 194 (10.3%) |
| 55 to 64 Years | 2,740 (91.1%) | 266 (8.8%) |
| 65 to 74 Years | 2,676 (100.0%) | 0 (0.0%) |
| 75 Years and older | 1,842 (100.0%) | 0 (0.0%) |
| Total | 19,997 (93.4%) | 1,416 (6.6%) |
Health Insurance Coverage by Citizenship Status in Yucca Valley
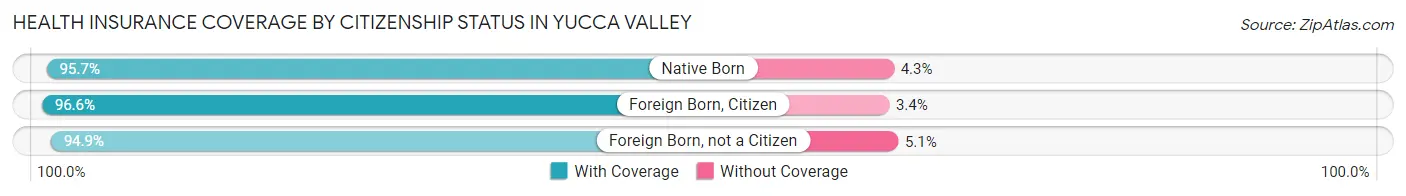
| Citizenship Status | With Coverage | Without Coverage |
| Native Born | 1,242 (95.7%) | 56 (4.3%) |
| Foreign Born, Citizen | 3,833 (96.6%) | 134 (3.4%) |
| Foreign Born, not a Citizen | 1,752 (94.9%) | 95 (5.1%) |
Health Insurance Coverage by Household Income in Yucca Valley
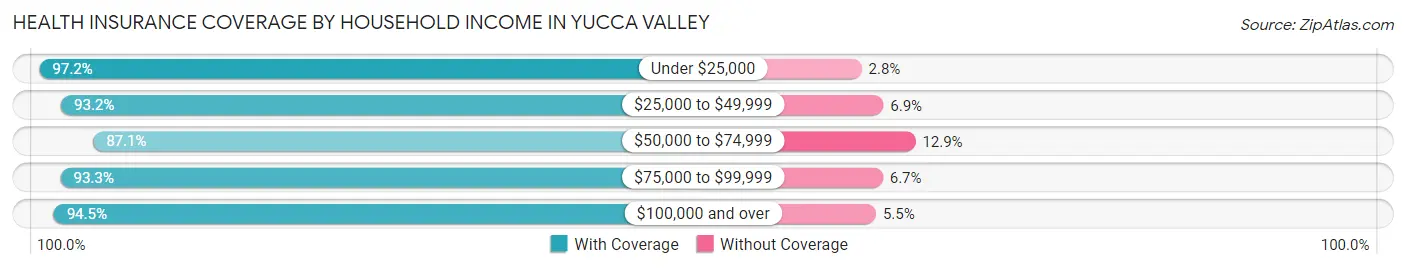
| Household Income | With Coverage | Without Coverage |
| Under $25,000 | 3,048 (97.2%) | 87 (2.8%) |
| $25,000 to $49,999 | 5,072 (93.1%) | 373 (6.9%) |
| $50,000 to $74,999 | 2,657 (87.1%) | 392 (12.9%) |
| $75,000 to $99,999 | 2,560 (93.3%) | 185 (6.7%) |
| $100,000 and over | 6,560 (94.5%) | 379 (5.5%) |
Public vs Private Health Insurance Coverage by Age in Yucca Valley
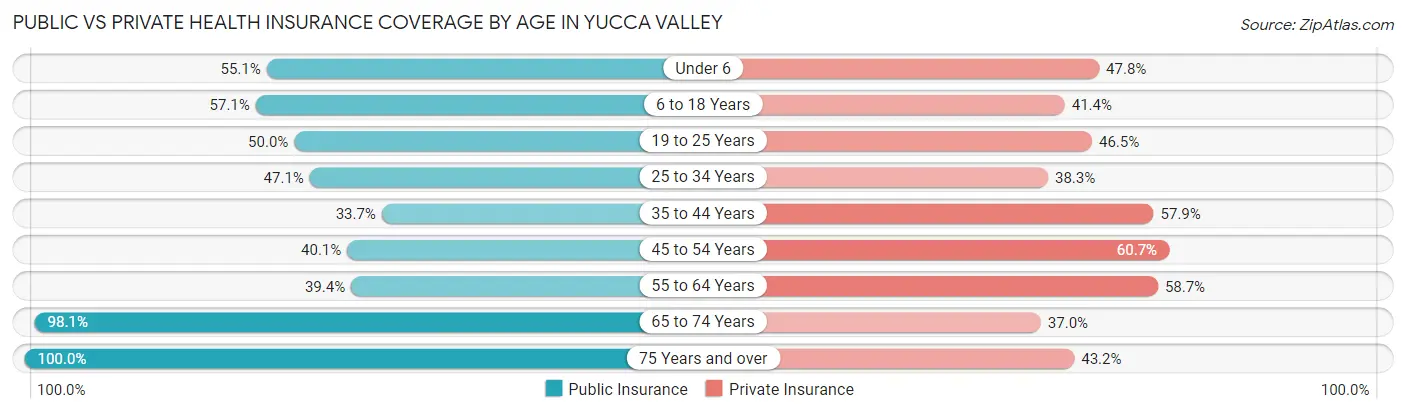
| Age Bracket | Public Insurance | Private Insurance |
| Under 6 | 715 (55.1%) | 620 (47.8%) |
| 6 to 18 Years | 2,266 (57.1%) | 1,642 (41.4%) |
| 19 to 25 Years | 923 (50.0%) | 858 (46.5%) |
| 25 to 34 Years | 1,117 (47.1%) | 908 (38.3%) |
| 35 to 44 Years | 851 (33.7%) | 1,461 (57.9%) |
| 45 to 54 Years | 755 (40.1%) | 1,142 (60.7%) |
| 55 to 64 Years | 1,185 (39.4%) | 1,764 (58.7%) |
| 65 to 74 Years | 2,626 (98.1%) | 989 (37.0%) |
| 75 Years and over | 1,842 (100.0%) | 795 (43.2%) |
| Total | 12,280 (57.4%) | 10,179 (47.5%) |
Disability Status by Sex by Age in Yucca Valley
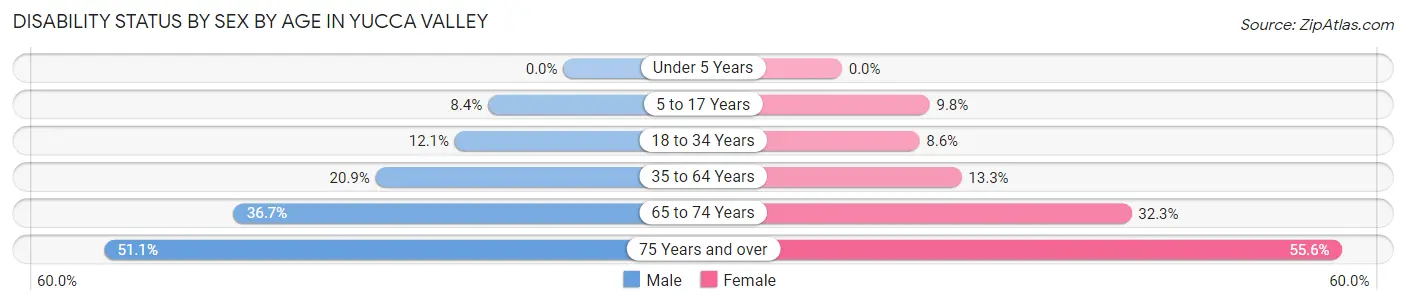
| Age Bracket | Male | Female |
| Under 5 Years | 0 (0.0%) | 0 (0.0%) |
| 5 to 17 Years | 157 (8.4%) | 223 (9.8%) |
| 18 to 34 Years | 241 (12.1%) | 209 (8.6%) |
| 35 to 64 Years | 813 (20.9%) | 469 (13.3%) |
| 65 to 74 Years | 463 (36.7%) | 456 (32.3%) |
| 75 Years and over | 302 (51.1%) | 696 (55.6%) |
Disability Class by Sex by Age in Yucca Valley
Disability Class: Hearing Difficulty
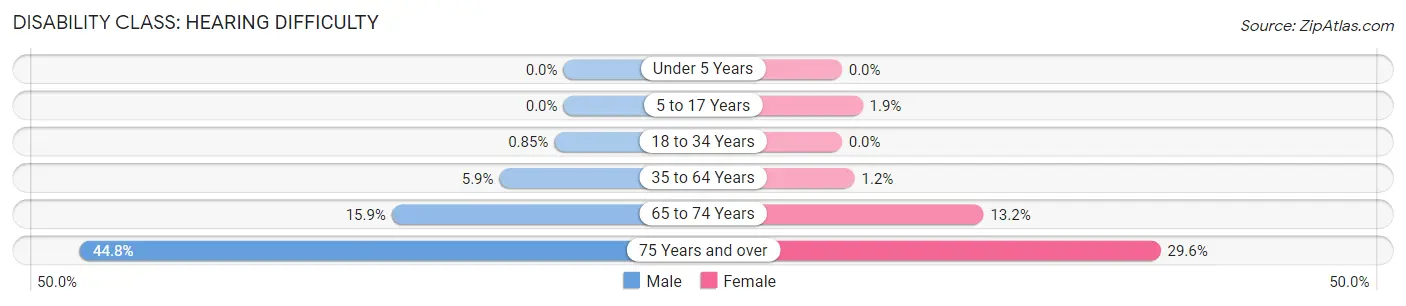
| Age Bracket | Male | Female |
| Under 5 Years | 0 (0.0%) | 0 (0.0%) |
| 5 to 17 Years | 0 (0.0%) | 44 (1.9%) |
| 18 to 34 Years | 17 (0.9%) | 0 (0.0%) |
| 35 to 64 Years | 231 (5.9%) | 42 (1.2%) |
| 65 to 74 Years | 201 (15.9%) | 186 (13.2%) |
| 75 Years and over | 265 (44.8%) | 370 (29.6%) |
Disability Class: Vision Difficulty
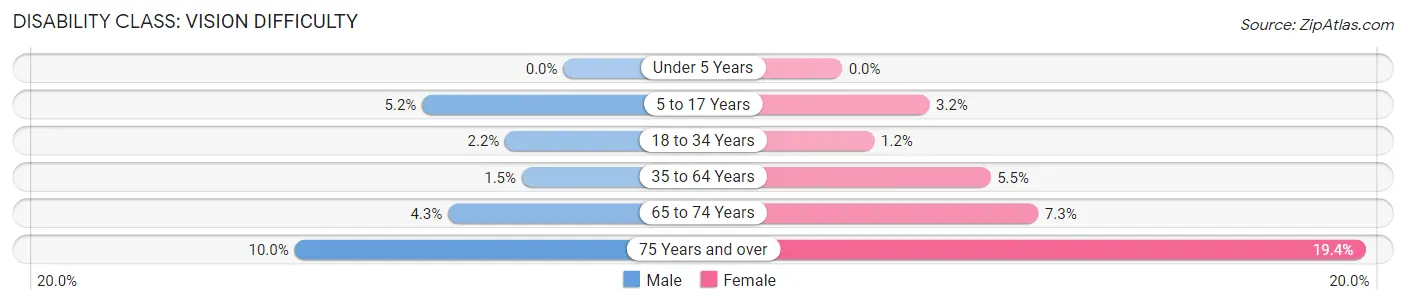
| Age Bracket | Male | Female |
| Under 5 Years | 0 (0.0%) | 0 (0.0%) |
| 5 to 17 Years | 98 (5.2%) | 74 (3.2%) |
| 18 to 34 Years | 43 (2.2%) | 29 (1.2%) |
| 35 to 64 Years | 60 (1.5%) | 194 (5.5%) |
| 65 to 74 Years | 54 (4.3%) | 103 (7.3%) |
| 75 Years and over | 59 (10.0%) | 243 (19.4%) |
Disability Class: Cognitive Difficulty
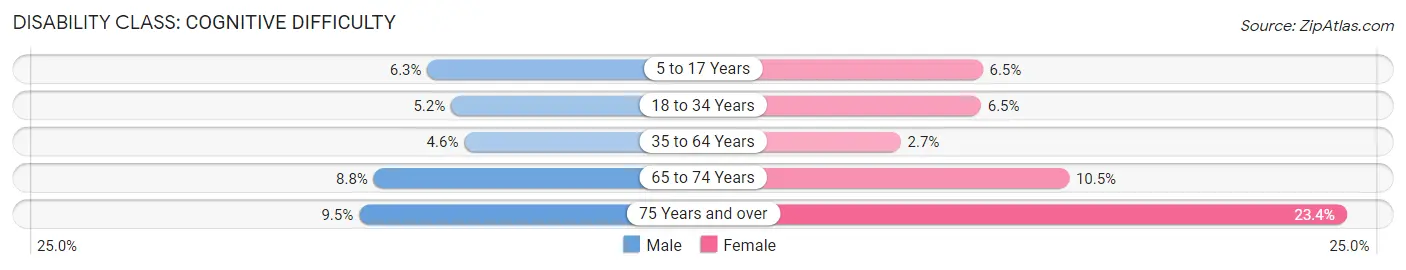
| Age Bracket | Male | Female |
| 5 to 17 Years | 118 (6.3%) | 149 (6.5%) |
| 18 to 34 Years | 104 (5.2%) | 156 (6.5%) |
| 35 to 64 Years | 179 (4.6%) | 96 (2.7%) |
| 65 to 74 Years | 111 (8.8%) | 149 (10.5%) |
| 75 Years and over | 56 (9.5%) | 293 (23.4%) |
Disability Class: Ambulatory Difficulty
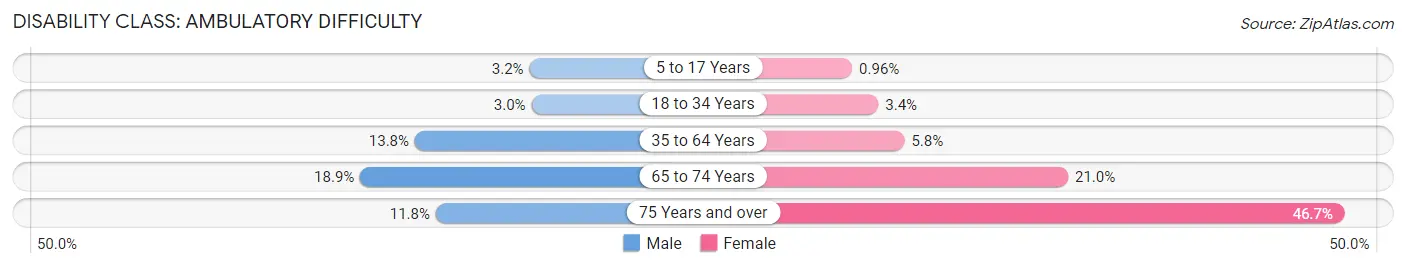
| Age Bracket | Male | Female |
| 5 to 17 Years | 59 (3.2%) | 22 (1.0%) |
| 18 to 34 Years | 59 (3.0%) | 82 (3.4%) |
| 35 to 64 Years | 536 (13.8%) | 205 (5.8%) |
| 65 to 74 Years | 238 (18.9%) | 297 (21.0%) |
| 75 Years and over | 70 (11.8%) | 584 (46.7%) |
Disability Class: Self-Care Difficulty
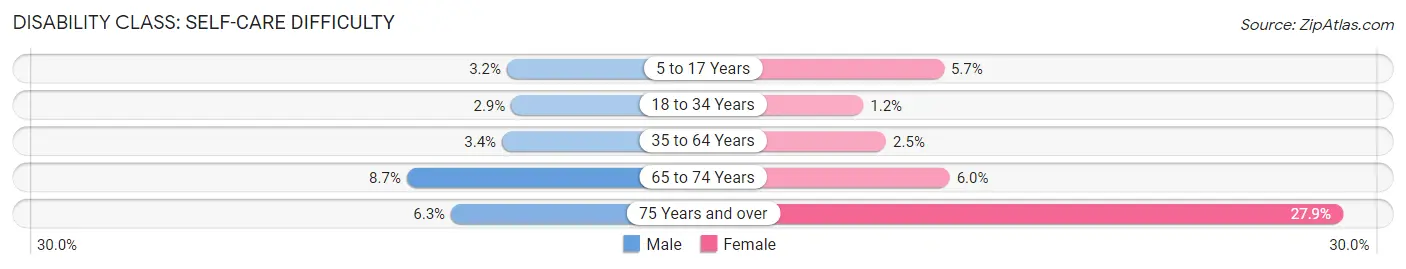
| Age Bracket | Male | Female |
| 5 to 17 Years | 59 (3.2%) | 130 (5.7%) |
| 18 to 34 Years | 58 (2.9%) | 29 (1.2%) |
| 35 to 64 Years | 133 (3.4%) | 87 (2.5%) |
| 65 to 74 Years | 110 (8.7%) | 85 (6.0%) |
| 75 Years and over | 37 (6.3%) | 349 (27.9%) |
Technology Access in Yucca Valley
Computing Device Access in Yucca Valley
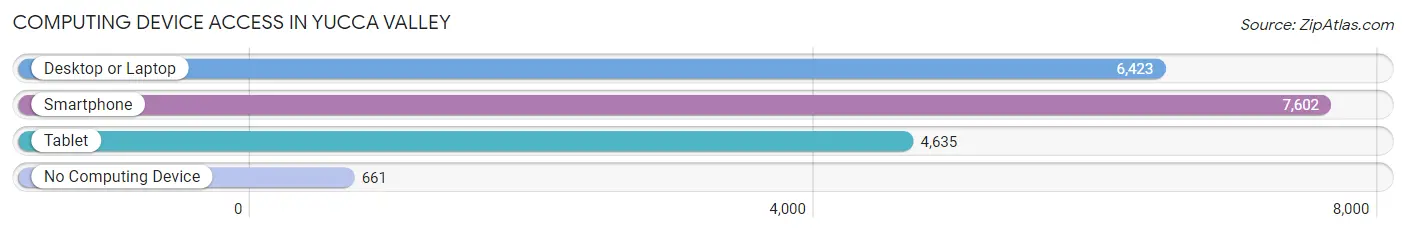
| Device Type | # Households | % Households |
| Desktop or Laptop | 6,423 | 73.5% |
| Smartphone | 7,602 | 87.0% |
| Tablet | 4,635 | 53.1% |
| No Computing Device | 661 | 7.6% |
| Total | 8,734 | 100.0% |
Internet Access in Yucca Valley
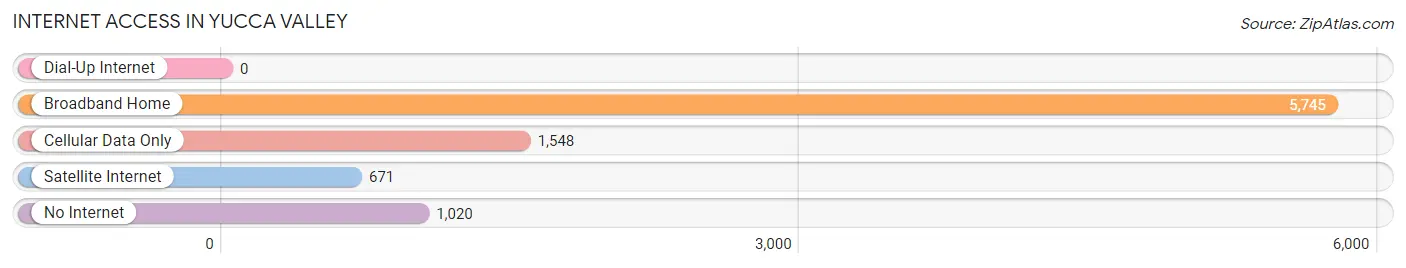
| Internet Type | # Households | % Households |
| Dial-Up Internet | 0 | 0.0% |
| Broadband Home | 5,745 | 65.8% |
| Cellular Data Only | 1,548 | 17.7% |
| Satellite Internet | 671 | 7.7% |
| No Internet | 1,020 | 11.7% |
| Total | 8,734 | 100.0% |
Yucca Valley Summary
YUCCA VALLEY CALIFORNIA
Yucca Valley is a town located in San Bernardino County, California, United States. The population was 20,700 at the 2010 census. Yucca Valley is located in the Mojave Desert, at an elevation of 3,300 feet (1,006 m). It is located east of the San Bernardino Mountains and north of the Joshua Tree National Park.
History
The area was first settled by Native Americans of the Serrano tribe, who were attracted to the area by its natural springs. The first non-native settlers arrived in the late 19th century, and the town was officially founded in 1906. The town was named after the yucca plants that were found in the area.
In the 1950s, the town began to grow rapidly as a result of the post-World War II housing boom. The town was incorporated in 1972.
Geography
Yucca Valley is located in the Mojave Desert, at an elevation of 3,300 feet (1,006 m). It is located east of the San Bernardino Mountains and north of the Joshua Tree National Park. The town is surrounded by desert terrain, with the San Bernardino Mountains to the west and the Little San Bernardino Mountains to the east.
The town is located in the High Desert region of California, which is characterized by hot, dry summers and mild winters. The average annual temperature is 73°F (23°C).
Economy
The economy of Yucca Valley is largely based on tourism, with many visitors coming to the area to explore the nearby Joshua Tree National Park. The town is also home to a number of businesses, including retail stores, restaurants, and service providers.
The town is also home to a number of government and military installations, including the Marine Corps Air Ground Combat Center Twentynine Palms and the U.S. Army's National Training Center at Fort Irwin.
Demographics
As of the 2010 census, there were 20,700 people, 8,527 households, and 5,717 families residing in the town. The population density was 545.3 people per square mile (210.9/km2). There were 9,890 housing units at an average density of 256.2 per square mile (98.9/km2). The racial makeup of the town was 79.2% White, 4.2% African American, 1.2% Native American, 1.9% Asian, 0.3% Pacific Islander, 9.7% from other races, and 3.5% from two or more races. Hispanic or Latino of any race were 22.5% of the population.
The median income for a household in the town was $37,813, and the median income for a family was $45,859. Males had a median income of $35,938 versus $27,813 for females. The per capita income for the town was $19,813. About 10.7% of families and 14.2% of the population were below the poverty line, including 19.3% of those under age 18 and 6.8% of those age 65 or over.
Conclusion
Yucca Valley is a town located in San Bernardino County, California, United States. The town is located in the Mojave Desert, at an elevation of 3,300 feet (1,006 m). It is located east of the San Bernardino Mountains and north of the Joshua Tree National Park. The economy of Yucca Valley is largely based on tourism, with many visitors coming to the area to explore the nearby Joshua Tree National Park. The town is also home to a number of businesses, including retail stores, restaurants, and service providers. As of the 2010 census, the population of Yucca Valley was 20,700. The town is largely composed of White, African American, Native American, Asian, and Pacific Islander residents. The median income for a household in the town was $37,813, and the median income for a family was $45,859.
Common Questions
What is Per Capita Income in Yucca Valley?
Per Capita income in Yucca Valley is $32,378.
What is the Median Family Income in Yucca Valley?
Median Family Income in Yucca Valley is $72,735.
What is the Median Household income in Yucca Valley?
Median Household Income in Yucca Valley is $54,153.
What is Income or Wage Gap in Yucca Valley?
Income or Wage Gap in Yucca Valley is 18.9%.
Women in Yucca Valley earn 81.1 cents for every dollar earned by a man.
What is Family Income Deficit in Yucca Valley?
Family Income Deficit in Yucca Valley is $7,931.
Families that are below poverty line in Yucca Valley earn $7,931 less on average than the poverty threshold level.
What is Inequality or Gini Index in Yucca Valley?
Inequality or Gini Index in Yucca Valley is 0.46.
What is the Total Population of Yucca Valley?
Total Population of Yucca Valley is 21,700.
What is the Total Male Population of Yucca Valley?
Total Male Population of Yucca Valley is 10,396.
What is the Total Female Population of Yucca Valley?
Total Female Population of Yucca Valley is 11,304.
What is the Ratio of Males per 100 Females in Yucca Valley?
There are 91.97 Males per 100 Females in Yucca Valley.
What is the Ratio of Females per 100 Males in Yucca Valley?
There are 108.73 Females per 100 Males in Yucca Valley.
What is the Median Population Age in Yucca Valley?
Median Population Age in Yucca Valley is 39.9 Years.
What is the Average Family Size in Yucca Valley
Average Family Size in Yucca Valley is 3.1 People.
What is the Average Household Size in Yucca Valley
Average Household Size in Yucca Valley is 2.5 People.
How Large is the Labor Force in Yucca Valley?
There are 9,757 People in the Labor Forcein in Yucca Valley.
What is the Percentage of People in the Labor Force in Yucca Valley?
56.5% of People are in the Labor Force in Yucca Valley.
What is the Unemployment Rate in Yucca Valley?
Unemployment Rate in Yucca Valley is 7.6%.