Cities with the Highest Percentage of Population Taking Public Transit to Work in Missouri
RELATED REPORTS & OPTIONS
Public Transit
Missouri
Compare Cities
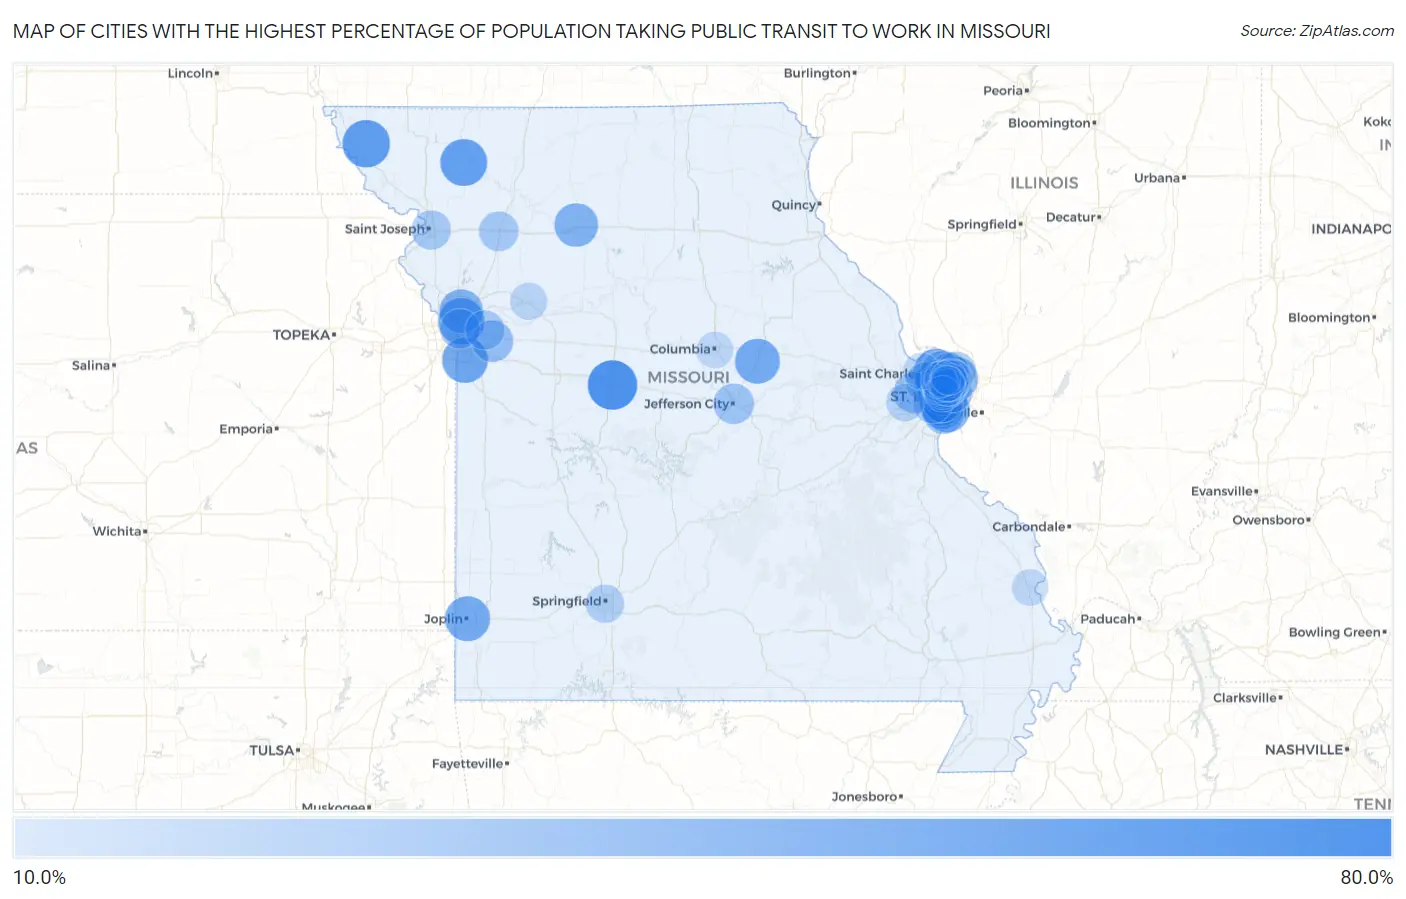
Map of Cities with the Highest Percentage of Population Taking Public Transit to Work in Missouri
0.0%
80.0%
Cities with the Highest Percentage of Population Taking Public Transit to Work in Missouri
| City | % Public Transit | vs State | vs National | |
| 1. | Sedalia | 74.2% | 35.4%(+38.8)#1 | 38.5%(+35.7)#5 |
| 2. | Sycamore Hills | 66.3% | 35.4%(+30.9)#2 | 38.5%(+27.8)#36 |
| 3. | Fairfax | 66.2% | 35.4%(+30.8)#3 | 38.5%(+27.7)#37 |
| 4. | Stanberry | 64.1% | 35.4%(+28.7)#4 | 38.5%(+25.6)#71 |
| 5. | North Kansas City | 61.6% | 35.4%(+26.2)#5 | 38.5%(+23.1)#116 |
| 6. | Maplewood | 60.9% | 35.4%(+25.5)#6 | 38.5%(+22.4)#134 |
| 7. | Grandview | 59.5% | 35.4%(+24.1)#7 | 38.5%(+21.0)#179 |
| 8. | Joplin | 56.7% | 35.4%(+21.3)#8 | 38.5%(+18.2)#325 |
| 9. | Fulton | 56.4% | 35.4%(+21.0)#9 | 38.5%(+17.9)#347 |
| 10. | Uplands Park | 55.8% | 35.4%(+20.4)#10 | 38.5%(+17.3)#394 |
| 11. | Hazelwood | 55.2% | 35.4%(+19.8)#11 | 38.5%(+16.7)#431 |
| 12. | Lemay | 54.1% | 35.4%(+18.7)#12 | 38.5%(+15.6)#514 |
| 13. | Breckenridge Hills | 52.5% | 35.4%(+17.1)#13 | 38.5%(+14.0)#654 |
| 14. | Gladstone | 51.5% | 35.4%(+16.1)#14 | 38.5%(+13.0)#716 |
| 15. | Chillicothe | 51.3% | 35.4%(+15.9)#15 | 38.5%(+12.8)#748 |
| 16. | Riverview | 51.3% | 35.4%(+15.9)#16 | 38.5%(+12.8)#752 |
| 17. | Greendale | 50.8% | 35.4%(+15.4)#17 | 38.5%(+12.3)#794 |
| 18. | Affton | 49.5% | 35.4%(+14.1)#18 | 38.5%(+11.0)#954 |
| 19. | St Ann | 48.5% | 35.4%(+13.1)#19 | 38.5%(+10.00)#1,102 |
| 20. | Bel Ridge | 46.7% | 35.4%(+11.3)#20 | 38.5%(+8.20)#1,393 |
| 21. | Marlborough | 46.3% | 35.4%(+10.9)#21 | 38.5%(+7.80)#1,460 |
| 22. | Brentwood | 45.7% | 35.4%(+10.3)#22 | 38.5%(+7.20)#1,544 |
| 23. | Pagedale | 45.7% | 35.4%(+10.3)#23 | 38.5%(+7.20)#1,547 |
| 24. | Cool Valley | 45.4% | 35.4%(+10.00)#24 | 38.5%(+6.90)#1,605 |
| 25. | Blue Springs | 43.3% | 35.4%(+7.90)#25 | 38.5%(+4.80)#1,936 |
| 26. | Chesterfield | 40.6% | 35.4%(+5.20)#26 | 38.5%(+2.10)#2,408 |
| 27. | Maryland Heights | 39.8% | 35.4%(+4.40)#27 | 38.5%(+1.30)#2,572 |
| 28. | Webster Groves | 39.8% | 35.4%(+4.40)#28 | 38.5%(+1.30)#2,574 |
| 29. | Jefferson City | 39.4% | 35.4%(+4.00)#29 | 38.5%(+0.900)#2,648 |
| 30. | Ferguson | 39.1% | 35.4%(+3.70)#30 | 38.5%(+0.600)#2,696 |
| 31. | Florissant | 39.0% | 35.4%(+3.60)#31 | 38.5%(+0.500)#2,704 |
| 32. | Mehlville | 38.9% | 35.4%(+3.50)#32 | 38.5%(+0.400)#2,714 |
| 33. | Richmond Heights | 38.9% | 35.4%(+3.50)#33 | 38.5%(+0.400)#2,722 |
| 34. | Kansas City | 37.0% | 35.4%(+1.60)#34 | 38.5%(-1.50)#2,999 |
| 35. | Shrewsbury | 36.8% | 35.4%(+1.40)#35 | 38.5%(-1.70)#3,051 |
| 36. | St Louis | 36.4% | 35.4%(+1.00)#36 | 38.5%(-2.10)#3,108 |
| 37. | Cameron | 35.9% | 35.4%(+0.500)#37 | 38.5%(-2.60)#3,175 |
| 38. | Wellston | 35.2% | 35.4%(-0.200)#38 | 38.5%(-3.30)#3,295 |
| 39. | Independence | 34.7% | 35.4%(-0.700)#39 | 38.5%(-3.80)#3,357 |
| 40. | St Joseph | 34.5% | 35.4%(-0.900)#40 | 38.5%(-4.00)#3,390 |
| 41. | Velda City | 34.5% | 35.4%(-0.900)#41 | 38.5%(-4.00)#3,402 |
| 42. | Kirkwood | 34.3% | 35.4%(-1.10)#42 | 38.5%(-4.20)#3,423 |
| 43. | Spanish Lake | 34.1% | 35.4%(-1.30)#43 | 38.5%(-4.40)#3,441 |
| 44. | Pine Lawn | 34.0% | 35.4%(-1.40)#44 | 38.5%(-4.50)#3,458 |
| 45. | Flordell Hills | 33.9% | 35.4%(-1.50)#45 | 38.5%(-4.60)#3,473 |
| 46. | Country Club Hills | 32.6% | 35.4%(-2.80)#46 | 38.5%(-5.90)#3,628 |
| 47. | Hanley Hills | 32.5% | 35.4%(-2.90)#47 | 38.5%(-6.00)#3,641 |
| 48. | Springfield | 31.1% | 35.4%(-4.30)#48 | 38.5%(-7.40)#3,766 |
| 49. | University City | 31.0% | 35.4%(-4.40)#49 | 38.5%(-7.50)#3,778 |
| 50. | Black Jack | 30.4% | 35.4%(-5.00)#50 | 38.5%(-8.10)#3,842 |
| 51. | Wildwood | 28.7% | 35.4%(-6.70)#51 | 38.5%(-9.80)#3,999 |
| 52. | Castle Point | 28.5% | 35.4%(-6.90)#52 | 38.5%(-10.0)#4,028 |
| 53. | Richmond | 26.8% | 35.4%(-8.60)#53 | 38.5%(-11.7)#4,144 |
| 54. | Bellefontaine Neighbors | 26.6% | 35.4%(-8.80)#54 | 38.5%(-11.9)#4,159 |
| 55. | Vinita Park | 26.5% | 35.4%(-8.90)#55 | 38.5%(-12.0)#4,170 |
| 56. | Jennings | 25.7% | 35.4%(-9.70)#56 | 38.5%(-12.8)#4,206 |
| 57. | St John | 25.4% | 35.4%(-10.00)#57 | 38.5%(-13.1)#4,227 |
| 58. | St Charles | 25.2% | 35.4%(-10.2)#58 | 38.5%(-13.3)#4,231 |
| 59. | Columbia | 25.0% | 35.4%(-10.4)#59 | 38.5%(-13.5)#4,237 |
| 60. | Hillsdale | 25.0% | 35.4%(-10.4)#60 | 38.5%(-13.5)#4,244 |
| 61. | Cape Girardeau | 24.8% | 35.4%(-10.6)#61 | 38.5%(-13.7)#4,257 |
| 62. | Normandy | 22.8% | 35.4%(-12.6)#62 | 38.5%(-15.7)#4,379 |
| 63. | Edmundson | 22.5% | 35.4%(-12.9)#63 | 38.5%(-16.0)#4,399 |
| 64. | Berkeley | 22.2% | 35.4%(-13.2)#64 | 38.5%(-16.3)#4,414 |
| 65. | Clayton | 20.9% | 35.4%(-14.5)#65 | 38.5%(-17.6)#4,456 |
| 66. | Norwood Court | 19.1% | 35.4%(-16.3)#66 | 38.5%(-19.4)#4,521 |
| 67. | Dellwood | 18.9% | 35.4%(-16.5)#67 | 38.5%(-19.6)#4,524 |
Common Questions
What are the Top 10 Cities with the Highest Percentage of Population Taking Public Transit to Work in Missouri?
Top 10 Cities with the Highest Percentage of Population Taking Public Transit to Work in Missouri are:
#1
74.2%
#2
66.3%
#3
66.2%
#4
64.1%
#5
61.6%
#6
60.9%
#7
59.5%
#8
56.7%
#9
56.4%
#10
55.8%
What city has the Highest Percentage of Population Taking Public Transit to Work in Missouri?
Sedalia has the Highest Percentage of Population Taking Public Transit to Work in Missouri with 74.2%.
What is the Percentage of Population Taking Public Transit to Work in the State of Missouri?
Percentage of Population Taking Public Transit to Work in Missouri is 35.4%.
What is the Percentage of Population Taking Public Transit to Work in the United States?
Percentage of Population Taking Public Transit to Work in the United States is 38.5%.