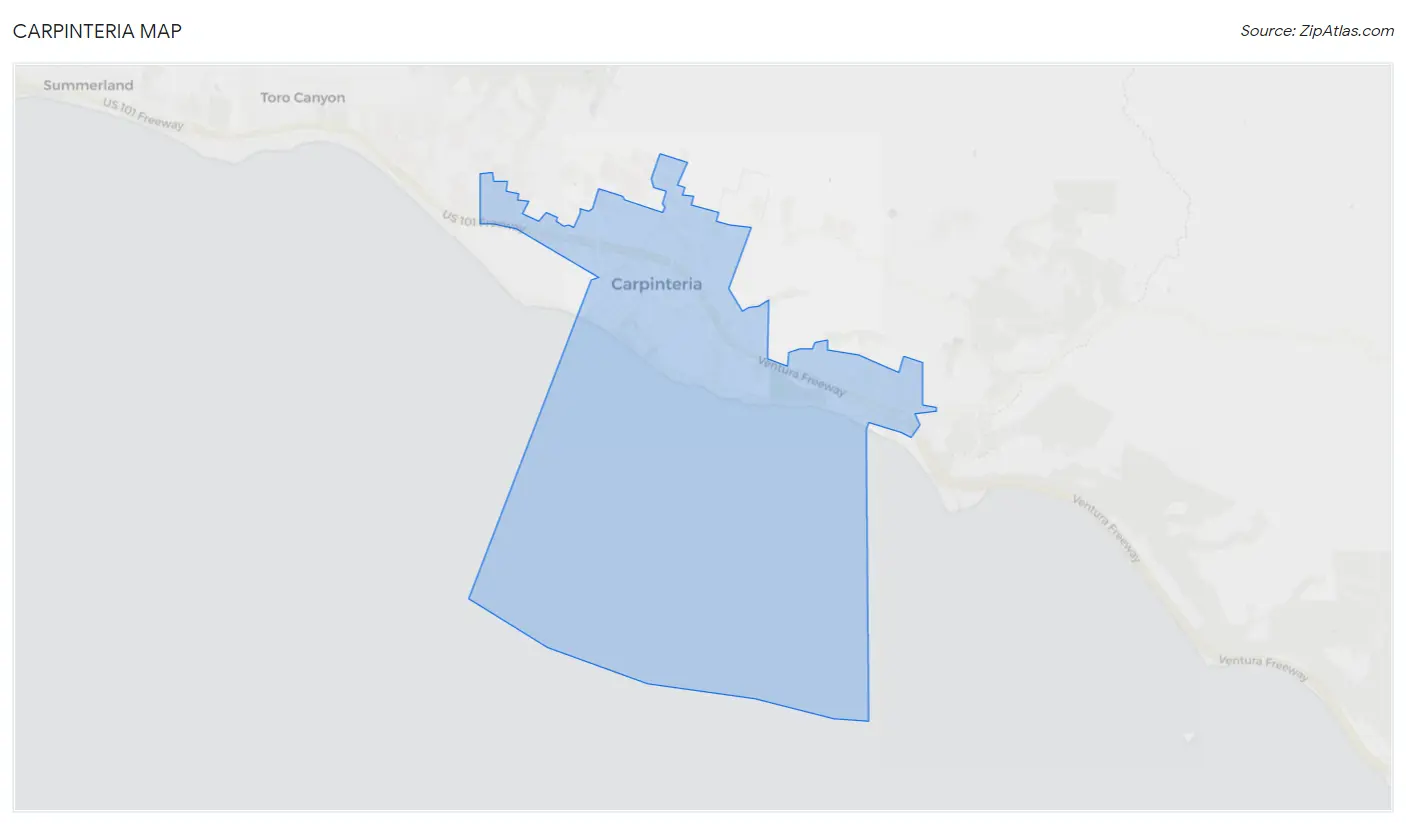
Carpinteria, CA Map & Demographics
Carpinteria Map
Carpinteria Overview
$52,303
PER CAPITA INCOME
$122,904
AVG FAMILY INCOME
$103,879
AVG HOUSEHOLD INCOME
30.2%
WAGE / INCOME GAP [ % ]
69.8¢/ $1
WAGE / INCOME GAP [ $ ]
0.45
INEQUALITY / GINI INDEX
13,187
TOTAL POPULATION
6,681
MALE POPULATION
6,506
FEMALE POPULATION
102.69
MALES / 100 FEMALES
97.38
FEMALES / 100 MALES
43.4
MEDIAN AGE
3.2
AVG FAMILY SIZE
2.6
AVG HOUSEHOLD SIZE
7,101
LABOR FORCE [ PEOPLE ]
66.2%
PERCENT IN LABOR FORCE
4.6%
UNEMPLOYMENT RATE
Carpinteria Zip Codes
Carpinteria Area Codes
Income in Carpinteria
Income Overview in Carpinteria
Per Capita Income in Carpinteria is $52,303, while median incomes of families and households are $122,904 and $103,879 respectively.
| Characteristic | Number | Measure |
| Per Capita Income | 13,187 | $52,303 |
| Median Family Income | 3,155 | $122,904 |
| Mean Family Income | 3,155 | $150,191 |
| Median Household Income | 5,079 | $103,879 |
| Mean Household Income | 5,079 | $135,993 |
| Income Deficit | 3,155 | $0 |
| Wage / Income Gap (%) | 13,187 | 30.24% |
| Wage / Income Gap ($) | 13,187 | 69.76¢ per $1 |
| Gini / Inequality Index | 13,187 | 0.45 |
Earnings by Sex in Carpinteria
Average Earnings in Carpinteria are $42,013, $51,912 for men and $36,215 for women, a difference of 30.2%.
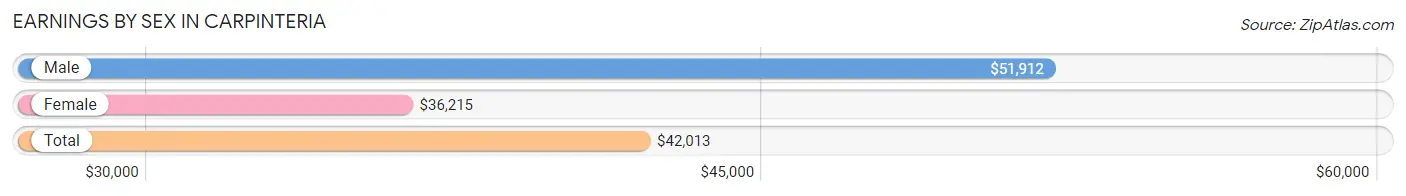
| Sex | Number | Average Earnings |
| Male | 3,928 (52.7%) | $51,912 |
| Female | 3,518 (47.2%) | $36,215 |
| Total | 7,446 (100.0%) | $42,013 |
Earnings by Sex by Income Bracket in Carpinteria
The most common earnings brackets in Carpinteria are $100,000+ for men (1,087 | 27.7%) and $100,000+ for women (568 | 16.2%).
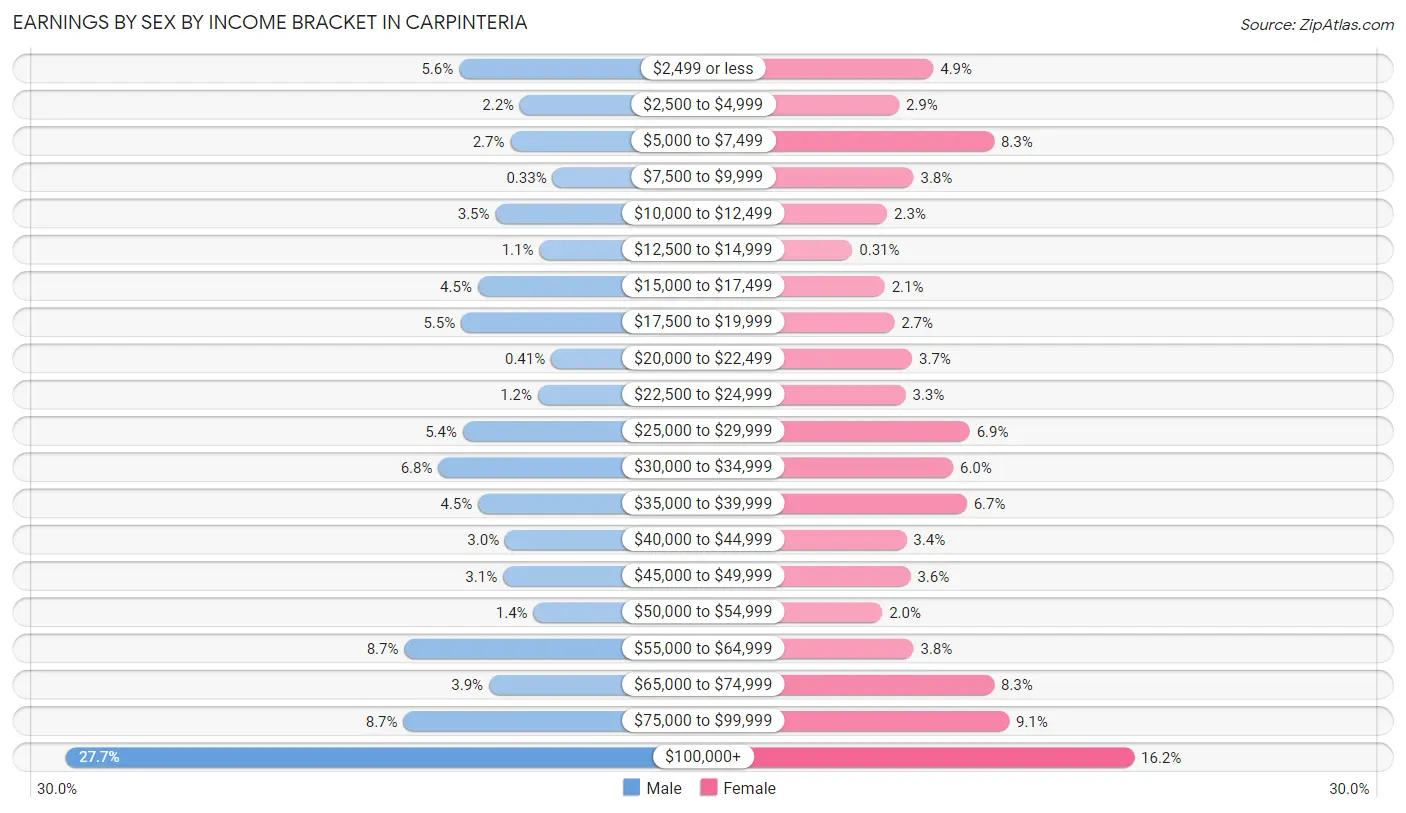
| Income | Male | Female |
| $2,499 or less | 219 (5.6%) | 171 (4.9%) |
| $2,500 to $4,999 | 85 (2.2%) | 103 (2.9%) |
| $5,000 to $7,499 | 106 (2.7%) | 291 (8.3%) |
| $7,500 to $9,999 | 13 (0.3%) | 132 (3.7%) |
| $10,000 to $12,499 | 139 (3.5%) | 80 (2.3%) |
| $12,500 to $14,999 | 42 (1.1%) | 11 (0.3%) |
| $15,000 to $17,499 | 178 (4.5%) | 75 (2.1%) |
| $17,500 to $19,999 | 215 (5.5%) | 94 (2.7%) |
| $20,000 to $22,499 | 16 (0.4%) | 129 (3.7%) |
| $22,500 to $24,999 | 45 (1.1%) | 116 (3.3%) |
| $25,000 to $29,999 | 211 (5.4%) | 243 (6.9%) |
| $30,000 to $34,999 | 265 (6.8%) | 210 (6.0%) |
| $35,000 to $39,999 | 177 (4.5%) | 237 (6.7%) |
| $40,000 to $44,999 | 118 (3.0%) | 118 (3.4%) |
| $45,000 to $49,999 | 122 (3.1%) | 126 (3.6%) |
| $50,000 to $54,999 | 55 (1.4%) | 70 (2.0%) |
| $55,000 to $64,999 | 340 (8.7%) | 132 (3.7%) |
| $65,000 to $74,999 | 153 (3.9%) | 291 (8.3%) |
| $75,000 to $99,999 | 342 (8.7%) | 321 (9.1%) |
| $100,000+ | 1,087 (27.7%) | 568 (16.2%) |
| Total | 3,928 (100.0%) | 3,518 (100.0%) |
Earnings by Sex by Educational Attainment in Carpinteria
Average earnings in Carpinteria are $58,825 for men and $42,935 for women, a difference of 27.0%. Men with an educational attainment of graduate degree enjoy the highest average annual earnings of $123,102, while those with less than high school education earn the least with $31,888. Women with an educational attainment of graduate degree earn the most with the average annual earnings of $76,500, while those with less than high school education have the smallest earnings of $24,361.
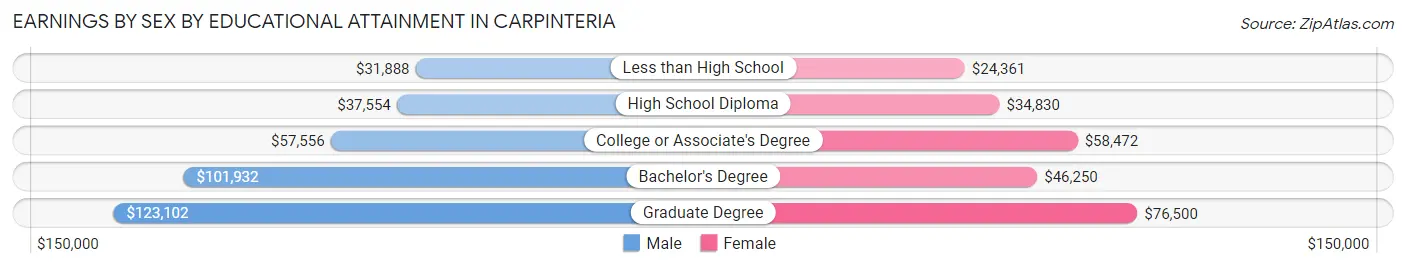
| Educational Attainment | Male Income | Female Income |
| Less than High School | $31,888 | $24,361 |
| High School Diploma | $37,554 | $34,830 |
| College or Associate's Degree | $57,556 | $58,472 |
| Bachelor's Degree | $101,932 | $46,250 |
| Graduate Degree | $123,102 | $76,500 |
| Total | $58,825 | $42,935 |
Family Income in Carpinteria
Family Income Brackets in Carpinteria
According to the Carpinteria family income data, there are 805 families falling into the $200,000+ income range, which is the most common income bracket and makes up 25.5% of all families. Conversely, the $10,000 to $14,999 income bracket is the least frequent group with only 3 families (0.1%) belonging to this category.
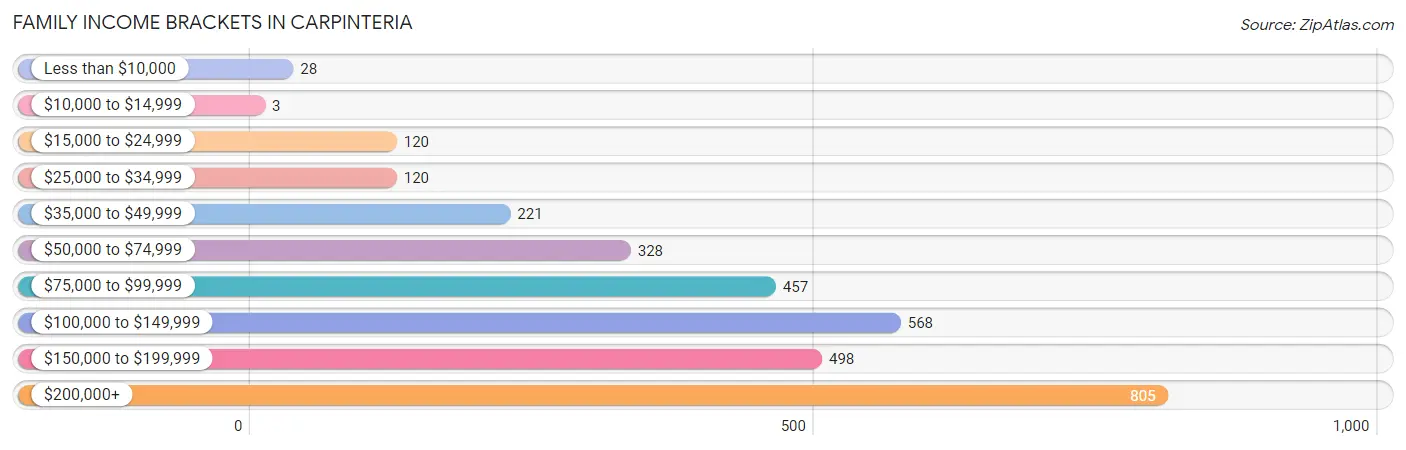
| Income Bracket | # Families | % Families |
| Less than $10,000 | 28 | 0.9% |
| $10,000 to $14,999 | 3 | 0.1% |
| $15,000 to $24,999 | 120 | 3.8% |
| $25,000 to $34,999 | 120 | 3.8% |
| $35,000 to $49,999 | 221 | 7.0% |
| $50,000 to $74,999 | 328 | 10.4% |
| $75,000 to $99,999 | 457 | 14.5% |
| $100,000 to $149,999 | 568 | 18.0% |
| $150,000 to $199,999 | 498 | 15.8% |
| $200,000+ | 805 | 25.5% |
Family Income by Famaliy Size in Carpinteria
6-person families (77 | 2.4%) account for the highest median family income in Carpinteria with $248,494 per family, while 2-person families (1,413 | 44.8%) have the highest median income of $50,364 per family member.
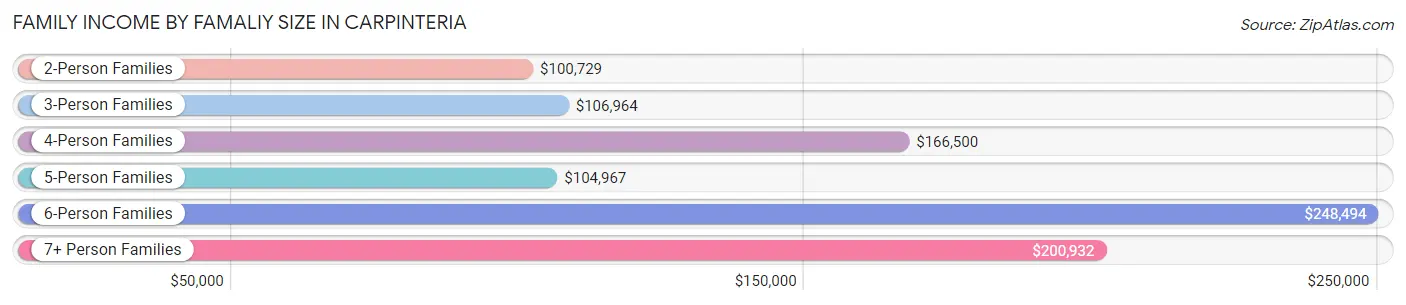
| Income Bracket | # Families | Median Income |
| 2-Person Families | 1,413 (44.8%) | $100,729 |
| 3-Person Families | 625 (19.8%) | $106,964 |
| 4-Person Families | 656 (20.8%) | $166,500 |
| 5-Person Families | 211 (6.7%) | $104,967 |
| 6-Person Families | 77 (2.4%) | $248,494 |
| 7+ Person Families | 173 (5.5%) | $200,932 |
| Total | 3,155 (100.0%) | $122,904 |
Family Income by Number of Earners in Carpinteria
The median family income in Carpinteria is $122,904, with families comprising 3+ earners (438) having the highest median family income of $192,978, while families with no earners (316) have the lowest median family income of $60,833, accounting for 13.9% and 10.0% of families, respectively.
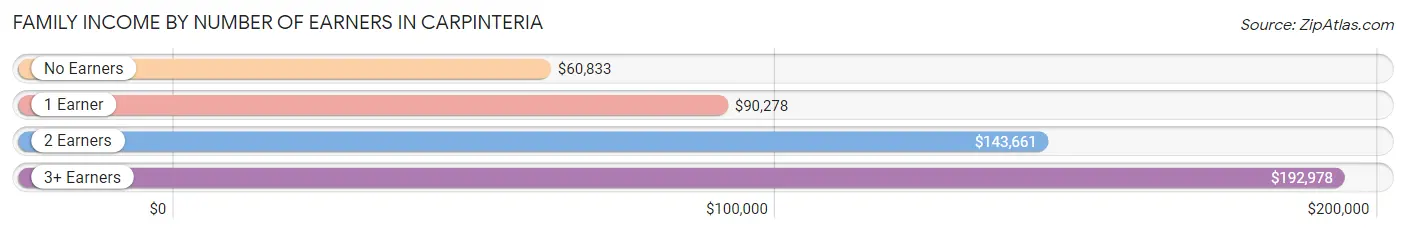
| Number of Earners | # Families | Median Income |
| No Earners | 316 (10.0%) | $60,833 |
| 1 Earner | 958 (30.4%) | $90,278 |
| 2 Earners | 1,443 (45.7%) | $143,661 |
| 3+ Earners | 438 (13.9%) | $192,978 |
| Total | 3,155 (100.0%) | $122,904 |
Household Income in Carpinteria
Household Income Brackets in Carpinteria
With 1,112 households falling in the category, the $200,000+ income range is the most frequent in Carpinteria, accounting for 21.9% of all households. In contrast, only 76 households (1.5%) fall into the $10,000 to $14,999 income bracket, making it the least populous group.
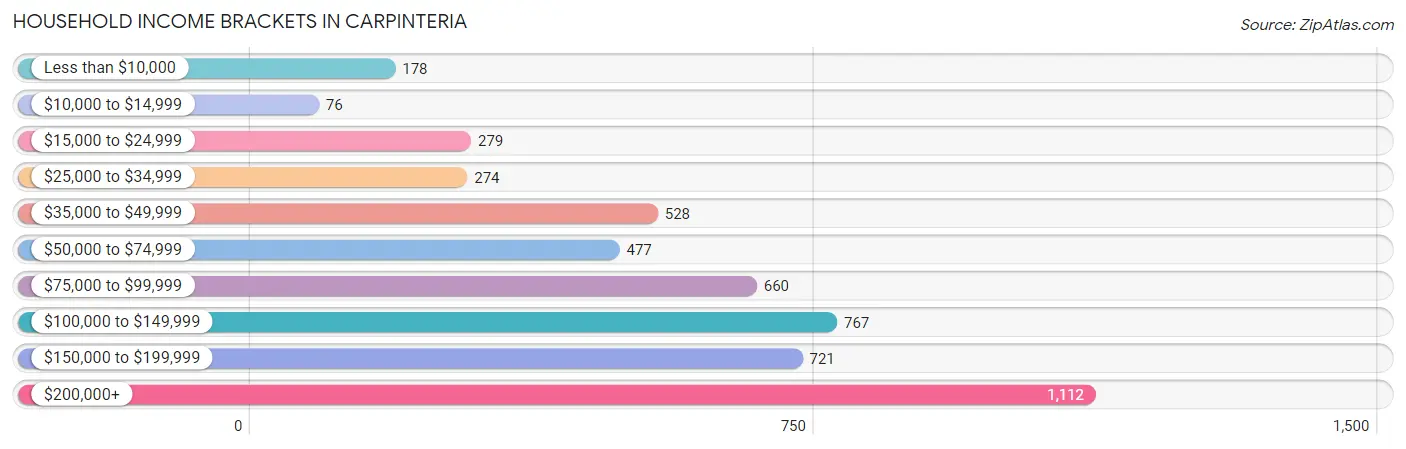
| Income Bracket | # Households | % Households |
| Less than $10,000 | 178 | 3.5% |
| $10,000 to $14,999 | 76 | 1.5% |
| $15,000 to $24,999 | 279 | 5.5% |
| $25,000 to $34,999 | 274 | 5.4% |
| $35,000 to $49,999 | 528 | 10.4% |
| $50,000 to $74,999 | 477 | 9.4% |
| $75,000 to $99,999 | 660 | 13.0% |
| $100,000 to $149,999 | 767 | 15.1% |
| $150,000 to $199,999 | 721 | 14.2% |
| $200,000+ | 1,112 | 21.9% |
Household Income by Householder Age in Carpinteria
The median household income in Carpinteria is $103,879, with the highest median household income of $128,341 found in the 45 to 64 years age bracket for the primary householder. A total of 2,005 households (39.5%) fall into this category. Meanwhile, the 15 to 24 years age bracket for the primary householder has the lowest median household income of $0, with 36 households (0.7%) in this group.
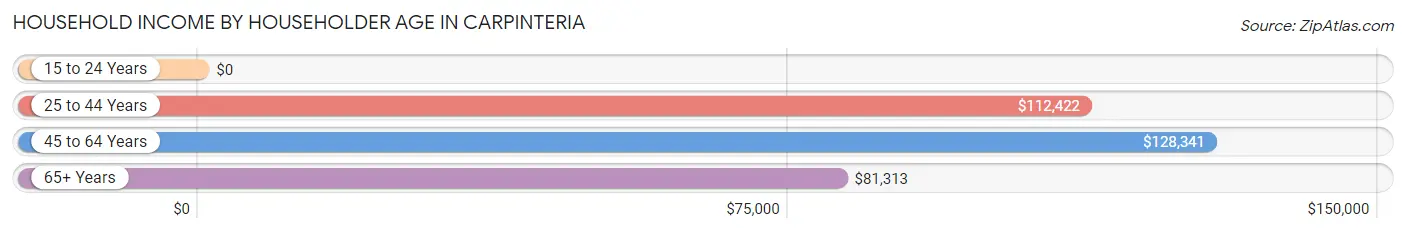
| Income Bracket | # Households | Median Income |
| 15 to 24 Years | 36 (0.7%) | $0 |
| 25 to 44 Years | 1,279 (25.2%) | $112,422 |
| 45 to 64 Years | 2,005 (39.5%) | $128,341 |
| 65+ Years | 1,759 (34.6%) | $81,313 |
| Total | 5,079 (100.0%) | $103,879 |
Poverty in Carpinteria
Income Below Poverty by Sex and Age in Carpinteria
With 4.7% poverty level for males and 6.1% for females among the residents of Carpinteria, 16 and 17 year old males and 5 year old females are the most vulnerable to poverty, with 18 males (31.0%) and 14 females (100.0%) in their respective age groups living below the poverty level.
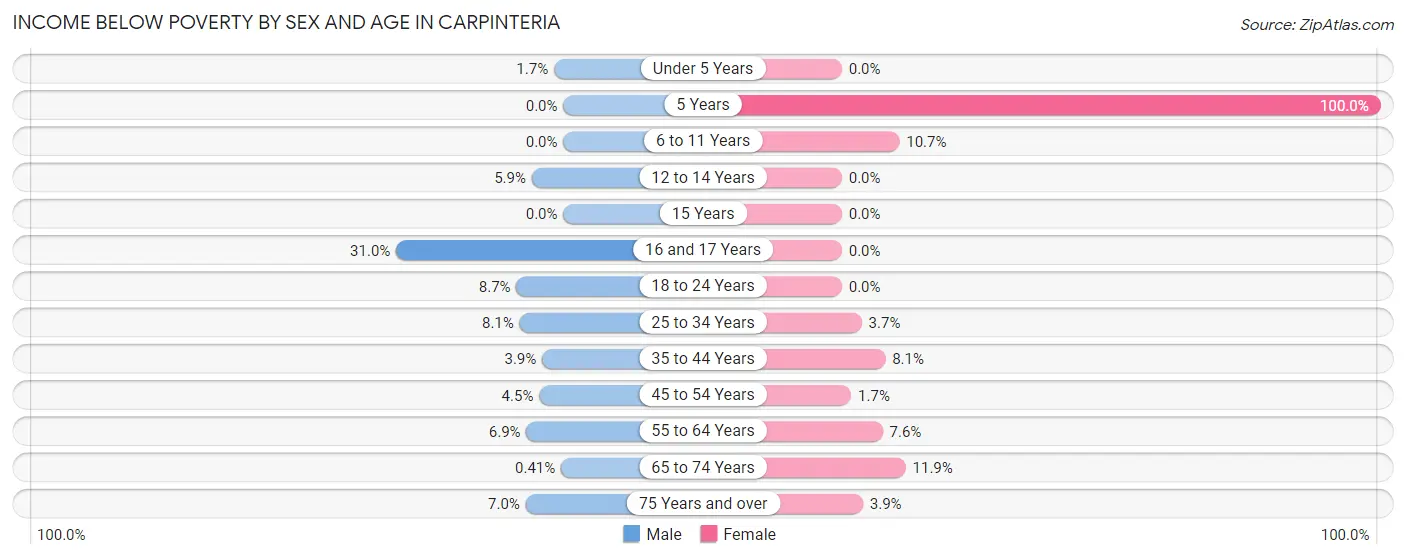
| Age Bracket | Male | Female |
| Under 5 Years | 8 (1.7%) | 0 (0.0%) |
| 5 Years | 0 (0.0%) | 14 (100.0%) |
| 6 to 11 Years | 0 (0.0%) | 52 (10.7%) |
| 12 to 14 Years | 14 (5.9%) | 0 (0.0%) |
| 15 Years | 0 (0.0%) | 0 (0.0%) |
| 16 and 17 Years | 18 (31.0%) | 0 (0.0%) |
| 18 to 24 Years | 46 (8.7%) | 0 (0.0%) |
| 25 to 34 Years | 60 (8.1%) | 24 (3.7%) |
| 35 to 44 Years | 39 (3.9%) | 74 (8.1%) |
| 45 to 54 Years | 35 (4.5%) | 15 (1.7%) |
| 55 to 64 Years | 56 (6.9%) | 80 (7.6%) |
| 65 to 74 Years | 4 (0.4%) | 118 (11.8%) |
| 75 Years and over | 31 (7.0%) | 16 (3.9%) |
| Total | 311 (4.7%) | 393 (6.1%) |
Income Above Poverty by Sex and Age in Carpinteria
According to the poverty statistics in Carpinteria, males aged 5 years and females aged under 5 years are the age groups that are most secure financially, with 100.0% of males and 100.0% of females in these age groups living above the poverty line.
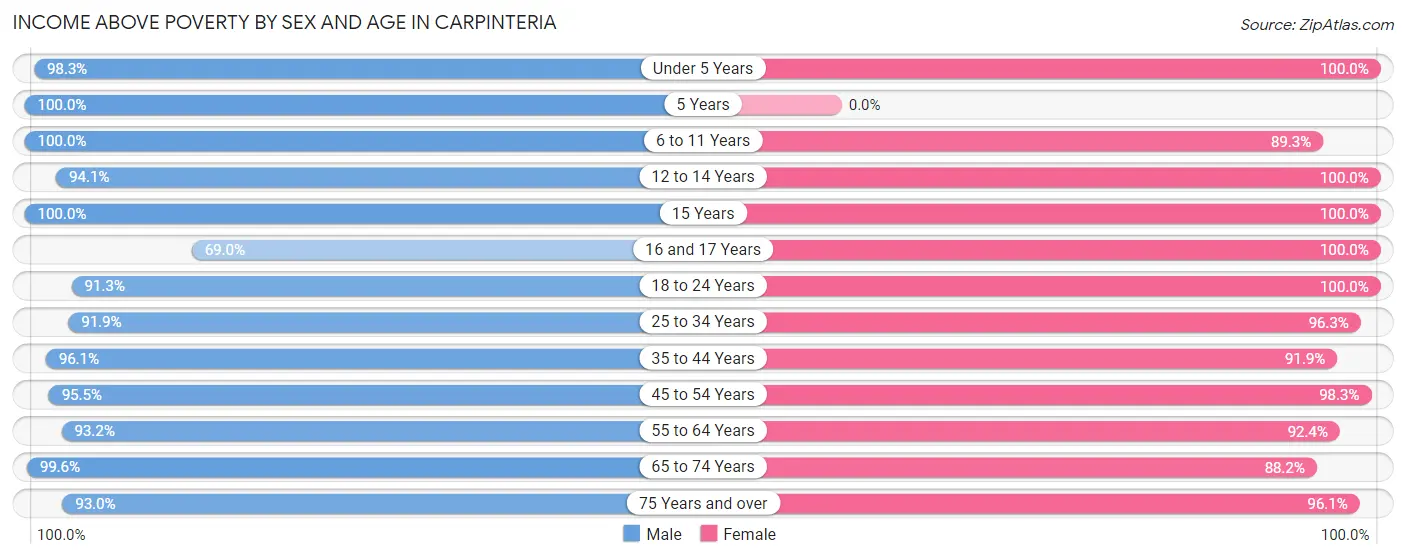
| Age Bracket | Male | Female |
| Under 5 Years | 451 (98.3%) | 302 (100.0%) |
| 5 Years | 28 (100.0%) | 0 (0.0%) |
| 6 to 11 Years | 502 (100.0%) | 435 (89.3%) |
| 12 to 14 Years | 225 (94.1%) | 238 (100.0%) |
| 15 Years | 26 (100.0%) | 25 (100.0%) |
| 16 and 17 Years | 40 (69.0%) | 92 (100.0%) |
| 18 to 24 Years | 482 (91.3%) | 389 (100.0%) |
| 25 to 34 Years | 679 (91.9%) | 626 (96.3%) |
| 35 to 44 Years | 950 (96.1%) | 844 (91.9%) |
| 45 to 54 Years | 747 (95.5%) | 846 (98.3%) |
| 55 to 64 Years | 762 (93.1%) | 975 (92.4%) |
| 65 to 74 Years | 983 (99.6%) | 878 (88.1%) |
| 75 Years and over | 412 (93.0%) | 393 (96.1%) |
| Total | 6,287 (95.3%) | 6,043 (93.9%) |
Income Below Poverty Among Married-Couple Families in Carpinteria
The poverty statistics for married-couple families in Carpinteria show that 3.3% or 86 of the total 2,611 families live below the poverty line. Families with 1 or 2 children have the highest poverty rate of 6.9%, comprising of 58 families. On the other hand, families with 3 or 4 children have the lowest poverty rate of 0.0%, which includes 0 families.
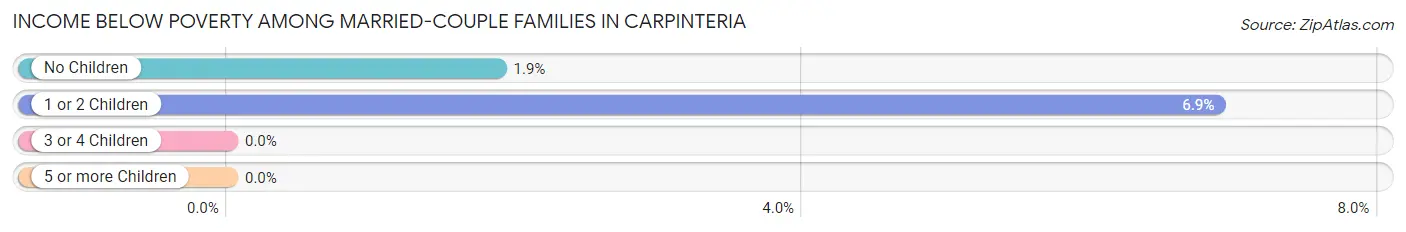
| Children | Above Poverty | Below Poverty |
| No Children | 1,471 (98.1%) | 28 (1.9%) |
| 1 or 2 Children | 785 (93.1%) | 58 (6.9%) |
| 3 or 4 Children | 269 (100.0%) | 0 (0.0%) |
| 5 or more Children | 0 (0.0%) | 0 (0.0%) |
| Total | 2,525 (96.7%) | 86 (3.3%) |
Income Below Poverty Among Single-Parent Households in Carpinteria
| Children | Single Father | Single Mother |
| No Children | 0 (0.0%) | 0 (0.0%) |
| 1 or 2 Children | 0 (0.0%) | 7 (5.3%) |
| 3 or 4 Children | 0 (0.0%) | 0 (0.0%) |
| 5 or more Children | 0 (0.0%) | 0 (0.0%) |
| Total | 0 (0.0%) | 7 (2.0%) |
Income Below Poverty Among Married-Couple vs Single-Parent Households in Carpinteria
The poverty data for Carpinteria shows that 86 of the married-couple family households (3.3%) and 7 of the single-parent households (1.3%) are living below the poverty level. Within the married-couple family households, those with 1 or 2 children have the highest poverty rate, with 58 households (6.9%) falling below the poverty line. Among the single-parent households, those with 1 or 2 children have the highest poverty rate, with 7 household (3.2%) living below poverty.
| Children | Married-Couple Families | Single-Parent Households |
| No Children | 28 (1.9%) | 0 (0.0%) |
| 1 or 2 Children | 58 (6.9%) | 7 (3.2%) |
| 3 or 4 Children | 0 (0.0%) | 0 (0.0%) |
| 5 or more Children | 0 (0.0%) | 0 (0.0%) |
| Total | 86 (3.3%) | 7 (1.3%) |
Race in Carpinteria
The most populous races in Carpinteria are White / Caucasian (8,353 | 63.3%), Hispanic or Latino (5,686 | 43.1%), and Some other Race (2,796 | 21.2%).
| Race | # Population | % Population |
| Asian | 311 | 2.4% |
| Black / African American | 114 | 0.9% |
| Hawaiian / Pacific | 0 | 0.0% |
| Hispanic or Latino | 5,686 | 43.1% |
| Native / Alaskan | 0 | 0.0% |
| White / Caucasian | 8,353 | 63.3% |
| Two or more Races | 1,613 | 12.2% |
| Some other Race | 2,796 | 21.2% |
| Total | 13,187 | 100.0% |
Ancestry in Carpinteria
The most populous ancestries reported in Carpinteria are Mexican (5,514 | 41.8%), German (1,785 | 13.5%), Irish (1,444 | 11.0%), English (1,138 | 8.6%), and Scottish (549 | 4.2%), together accounting for 79.1% of all Carpinteria residents.
| Ancestry | # Population | % Population |
| American | 290 | 2.2% |
| Arab | 69 | 0.5% |
| Argentinean | 10 | 0.1% |
| Armenian | 26 | 0.2% |
| Austrian | 43 | 0.3% |
| Belgian | 8 | 0.1% |
| Bhutanese | 116 | 0.9% |
| British | 157 | 1.2% |
| Burmese | 29 | 0.2% |
| Canadian | 12 | 0.1% |
| Central American | 42 | 0.3% |
| Central American Indian | 35 | 0.3% |
| Cherokee | 10 | 0.1% |
| Chickasaw | 7 | 0.1% |
| Chilean | 1 | 0.0% |
| Colombian | 3 | 0.0% |
| Costa Rican | 31 | 0.2% |
| Creek | 49 | 0.4% |
| Croatian | 42 | 0.3% |
| Danish | 74 | 0.6% |
| Dutch | 147 | 1.1% |
| Eastern European | 64 | 0.5% |
| English | 1,138 | 8.6% |
| European | 219 | 1.7% |
| French | 390 | 3.0% |
| German | 1,785 | 13.5% |
| Greek | 53 | 0.4% |
| Hungarian | 103 | 0.8% |
| Iranian | 27 | 0.2% |
| Irish | 1,444 | 11.0% |
| Iroquois | 24 | 0.2% |
| Italian | 505 | 3.8% |
| Korean | 223 | 1.7% |
| Laotian | 35 | 0.3% |
| Lebanese | 51 | 0.4% |
| Lithuanian | 36 | 0.3% |
| Mexican | 5,514 | 41.8% |
| Mexican American Indian | 80 | 0.6% |
| Native Hawaiian | 46 | 0.4% |
| Navajo | 10 | 0.1% |
| Nigerian | 87 | 0.7% |
| Northern European | 26 | 0.2% |
| Norwegian | 128 | 1.0% |
| Pennsylvania German | 11 | 0.1% |
| Peruvian | 14 | 0.1% |
| Polish | 246 | 1.9% |
| Portuguese | 22 | 0.2% |
| Russian | 97 | 0.7% |
| Salvadoran | 11 | 0.1% |
| Samoan | 85 | 0.6% |
| Scandinavian | 31 | 0.2% |
| Scotch-Irish | 74 | 0.6% |
| Scottish | 549 | 4.2% |
| Serbian | 14 | 0.1% |
| South American | 28 | 0.2% |
| Spanish | 13 | 0.1% |
| Sri Lankan | 8 | 0.1% |
| Subsaharan African | 87 | 0.7% |
| Swedish | 249 | 1.9% |
| Swiss | 22 | 0.2% |
| Syrian | 18 | 0.1% |
| Thai | 18 | 0.1% |
| Ukrainian | 33 | 0.3% |
| Welsh | 220 | 1.7% |
| Yugoslavian | 5 | 0.0% | View All 65 Rows |
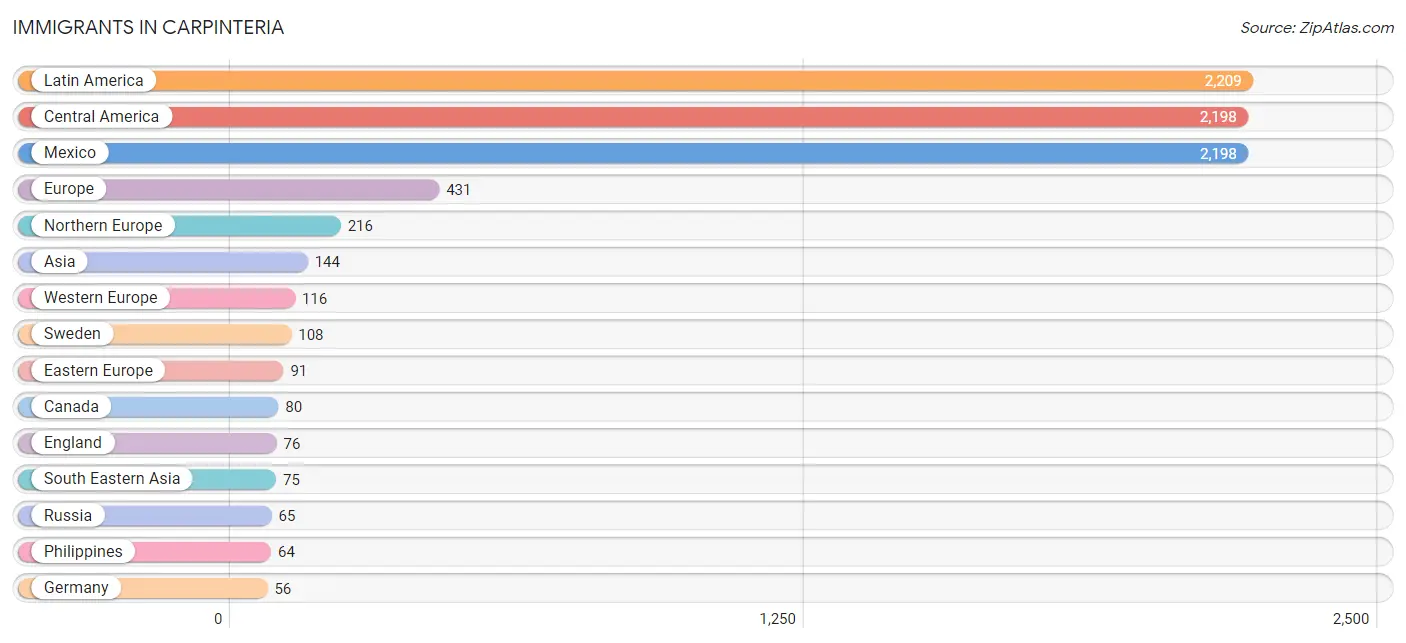
Immigrants in Carpinteria
The most numerous immigrant groups reported in Carpinteria came from Latin America (2,209 | 16.8%), Central America (2,198 | 16.7%), Mexico (2,198 | 16.7%), Europe (431 | 3.3%), and Northern Europe (216 | 1.6%), together accounting for 55.0% of all Carpinteria residents.
| Immigration Origin | # Population | % Population |
| Africa | 53 | 0.4% |
| Argentina | 10 | 0.1% |
| Asia | 144 | 1.1% |
| Austria | 53 | 0.4% |
| Canada | 80 | 0.6% |
| Central America | 2,198 | 16.7% |
| Chile | 1 | 0.0% |
| Eastern Asia | 27 | 0.2% |
| Eastern Europe | 91 | 0.7% |
| England | 76 | 0.6% |
| Europe | 431 | 3.3% |
| France | 7 | 0.1% |
| Germany | 56 | 0.4% |
| India | 7 | 0.1% |
| Indonesia | 7 | 0.1% |
| Iran | 17 | 0.1% |
| Japan | 27 | 0.2% |
| Latin America | 2,209 | 16.8% |
| Mexico | 2,198 | 16.7% |
| Nigeria | 35 | 0.3% |
| Northern Europe | 216 | 1.6% |
| Norway | 15 | 0.1% |
| Oceania | 11 | 0.1% |
| Philippines | 64 | 0.5% |
| Poland | 26 | 0.2% |
| Portugal | 8 | 0.1% |
| Russia | 65 | 0.5% |
| Scotland | 8 | 0.1% |
| South Africa | 18 | 0.1% |
| South America | 11 | 0.1% |
| South Central Asia | 24 | 0.2% |
| South Eastern Asia | 75 | 0.6% |
| Southern Europe | 8 | 0.1% |
| Sweden | 108 | 0.8% |
| Syria | 18 | 0.1% |
| Vietnam | 4 | 0.0% |
| Western Africa | 35 | 0.3% |
| Western Asia | 18 | 0.1% |
| Western Europe | 116 | 0.9% | View All 39 Rows |
Sex and Age in Carpinteria
Sex and Age in Carpinteria
The most populous age groups in Carpinteria are 40 to 44 Years (590 | 8.8%) for men and 65 to 69 Years (594 | 9.1%) for women.
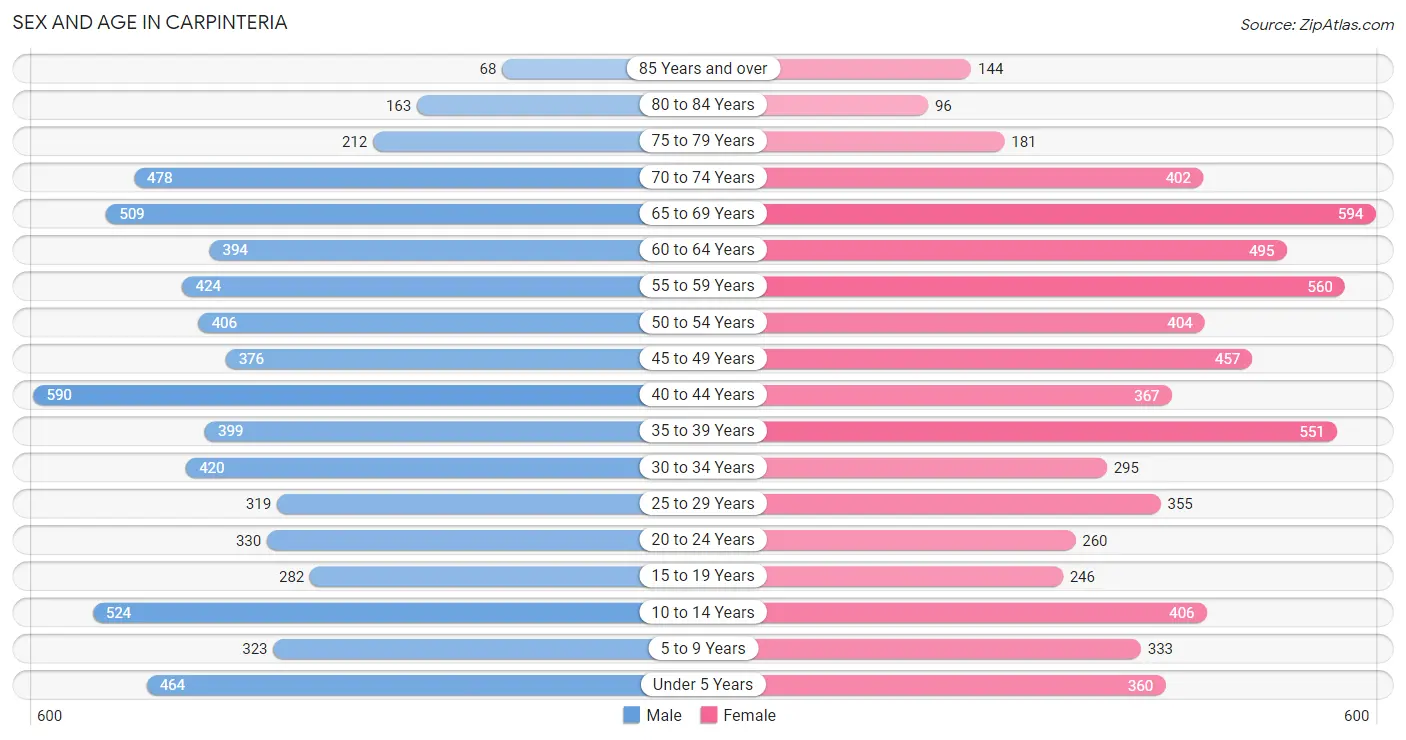
| Age Bracket | Male | Female |
| Under 5 Years | 464 (7.0%) | 360 (5.5%) |
| 5 to 9 Years | 323 (4.8%) | 333 (5.1%) |
| 10 to 14 Years | 524 (7.8%) | 406 (6.2%) |
| 15 to 19 Years | 282 (4.2%) | 246 (3.8%) |
| 20 to 24 Years | 330 (4.9%) | 260 (4.0%) |
| 25 to 29 Years | 319 (4.8%) | 355 (5.5%) |
| 30 to 34 Years | 420 (6.3%) | 295 (4.5%) |
| 35 to 39 Years | 399 (6.0%) | 551 (8.5%) |
| 40 to 44 Years | 590 (8.8%) | 367 (5.6%) |
| 45 to 49 Years | 376 (5.6%) | 457 (7.0%) |
| 50 to 54 Years | 406 (6.1%) | 404 (6.2%) |
| 55 to 59 Years | 424 (6.4%) | 560 (8.6%) |
| 60 to 64 Years | 394 (5.9%) | 495 (7.6%) |
| 65 to 69 Years | 509 (7.6%) | 594 (9.1%) |
| 70 to 74 Years | 478 (7.1%) | 402 (6.2%) |
| 75 to 79 Years | 212 (3.2%) | 181 (2.8%) |
| 80 to 84 Years | 163 (2.4%) | 96 (1.5%) |
| 85 Years and over | 68 (1.0%) | 144 (2.2%) |
| Total | 6,681 (100.0%) | 6,506 (100.0%) |
Families and Households in Carpinteria
Median Family Size in Carpinteria
The median family size in Carpinteria is 3.24 persons per family, with married-couple families (2,611 | 82.8%) accounting for the largest median family size of 3.33 persons per family. On the other hand, single male/father families (200 | 6.3%) represent the smallest median family size with 2.43 persons per family.
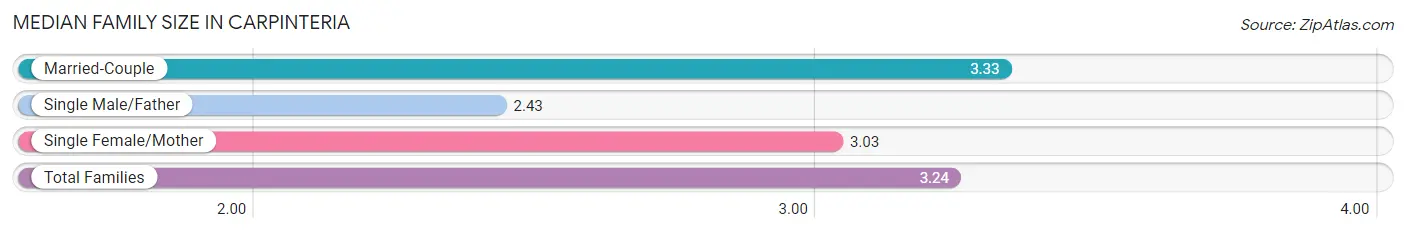
| Family Type | # Families | Family Size |
| Married-Couple | 2,611 (82.8%) | 3.33 |
| Single Male/Father | 200 (6.3%) | 2.43 |
| Single Female/Mother | 344 (10.9%) | 3.03 |
| Total Families | 3,155 (100.0%) | 3.24 |
Median Household Size in Carpinteria
The median household size in Carpinteria is 2.59 persons per household, with married-couple households (2,611 | 51.4%) accounting for the largest median household size of 3.48 persons per household. non-family households (1,924 | 37.9%) represent the smallest median household size with 1.20 persons per household.
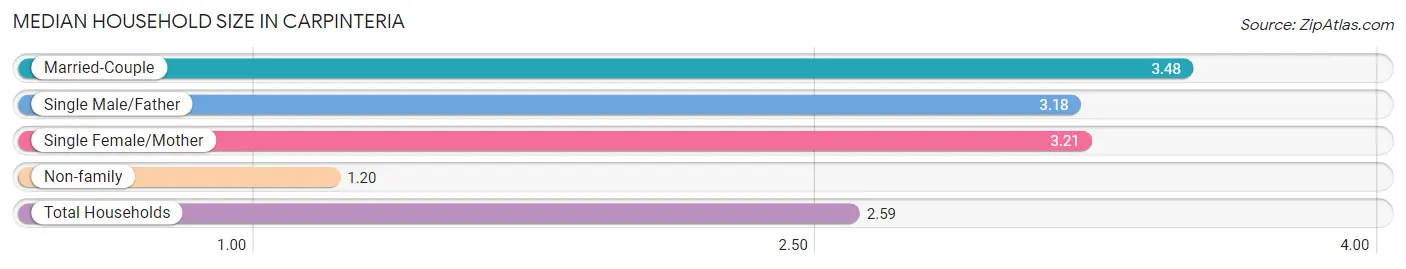
| Household Type | # Households | Household Size |
| Married-Couple | 2,611 (51.4%) | 3.48 |
| Single Male/Father | 200 (3.9%) | 3.18 |
| Single Female/Mother | 344 (6.8%) | 3.21 |
| Non-family | 1,924 (37.9%) | 1.20 |
| Total Households | 5,079 (100.0%) | 2.59 |
Household Size by Marriage Status in Carpinteria
Out of a total of 5,079 households in Carpinteria, 3,155 (62.1%) are family households, while 1,924 (37.9%) are nonfamily households. The most numerous type of family households are 2-person households, comprising 1,301, and the most common type of nonfamily households are 1-person households, comprising 1,641.
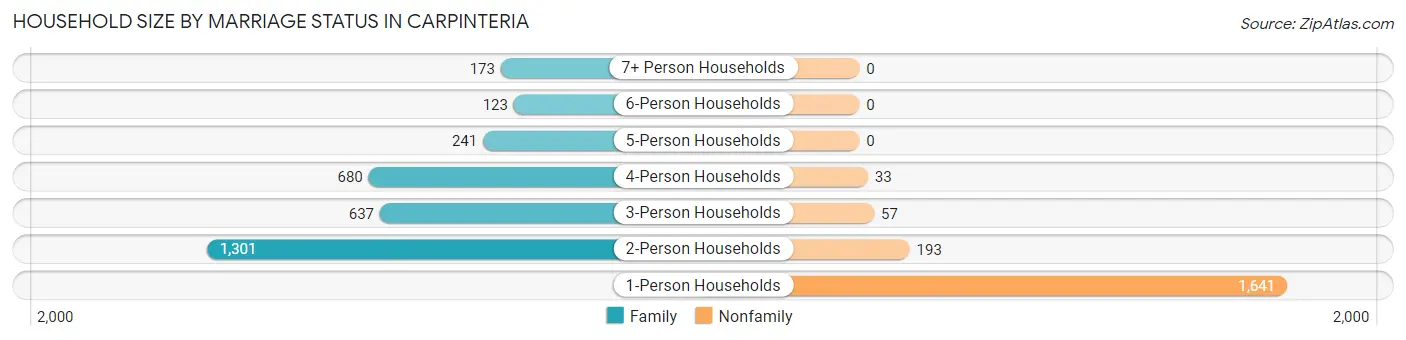
| Household Size | Family Households | Nonfamily Households |
| 1-Person Households | - | 1,641 (32.3%) |
| 2-Person Households | 1,301 (25.6%) | 193 (3.8%) |
| 3-Person Households | 637 (12.5%) | 57 (1.1%) |
| 4-Person Households | 680 (13.4%) | 33 (0.6%) |
| 5-Person Households | 241 (4.8%) | 0 (0.0%) |
| 6-Person Households | 123 (2.4%) | 0 (0.0%) |
| 7+ Person Households | 173 (3.4%) | 0 (0.0%) |
| Total | 3,155 (62.1%) | 1,924 (37.9%) |
Female Fertility in Carpinteria
Fertility by Age in Carpinteria
Average fertility rate in Carpinteria is 41.0 births per 1,000 women. Women in the age bracket of 20 to 34 years have the highest fertility rate with 46.0 births per 1,000 women. Women in the age bracket of 35 to 50 years acount for 62.5% of all women with births.
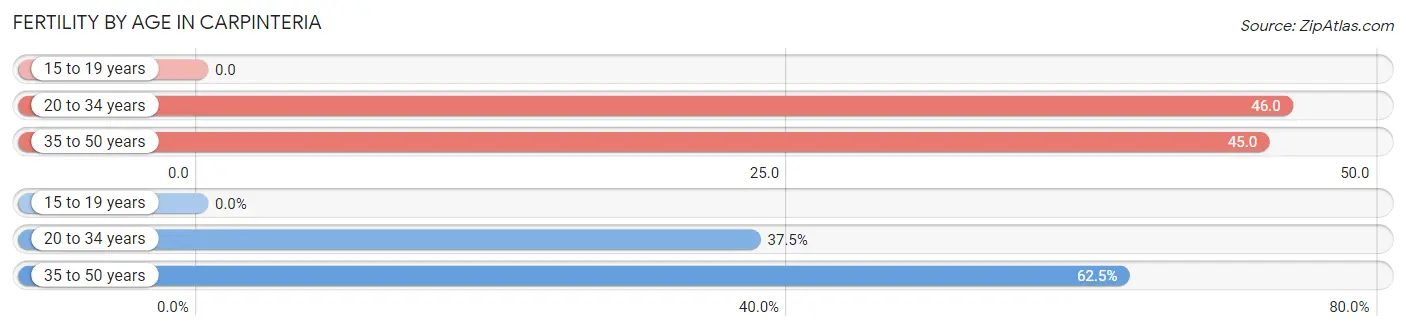
| Age Bracket | Women with Births | Births / 1,000 Women |
| 15 to 19 years | 0 (0.0%) | 0.0 |
| 20 to 34 years | 42 (37.5%) | 46.0 |
| 35 to 50 years | 70 (62.5%) | 45.0 |
| Total | 112 (100.0%) | 41.0 |
Fertility by Age by Marriage Status in Carpinteria
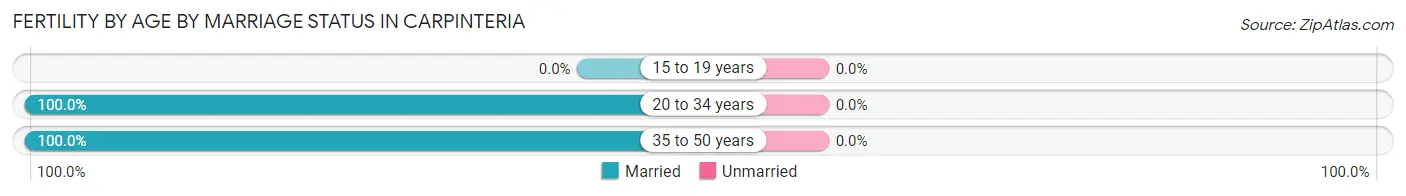
| Age Bracket | Married | Unmarried |
| 15 to 19 years | 0 (0.0%) | 0 (0.0%) |
| 20 to 34 years | 42 (100.0%) | 0 (0.0%) |
| 35 to 50 years | 70 (100.0%) | 0 (0.0%) |
| Total | 112 (100.0%) | 0 (0.0%) |
Fertility by Education in Carpinteria
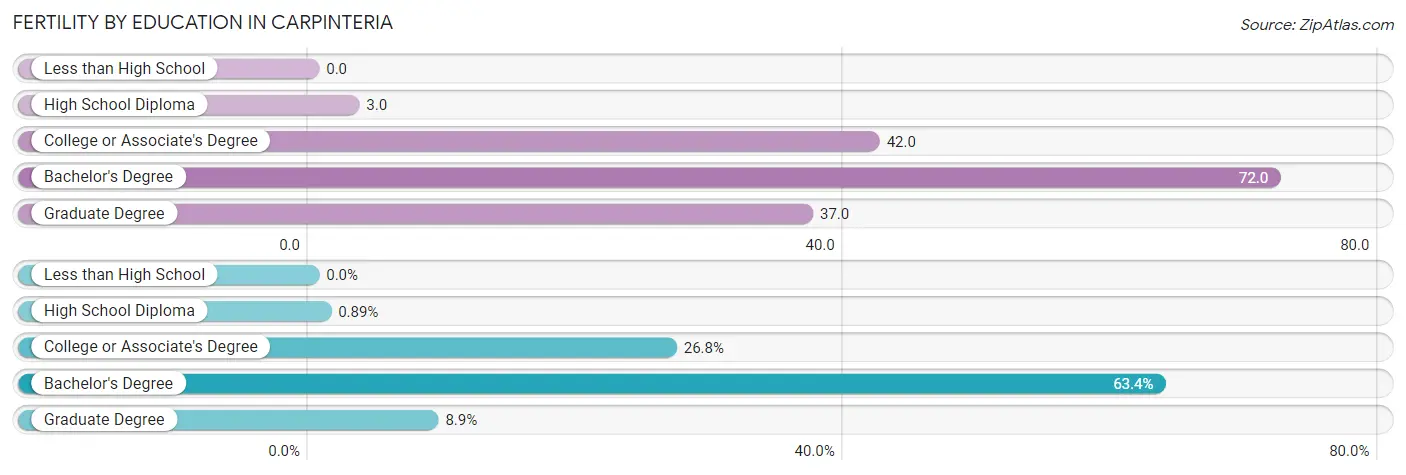
| Educational Attainment | Women with Births | Births / 1,000 Women |
| Less than High School | 0 (0.0%) | 0.0 |
| High School Diploma | 1 (0.9%) | 3.0 |
| College or Associate's Degree | 30 (26.8%) | 42.0 |
| Bachelor's Degree | 71 (63.4%) | 72.0 |
| Graduate Degree | 10 (8.9%) | 37.0 |
| Total | 112 (100.0%) | 41.0 |
Fertility by Education by Marriage Status in Carpinteria
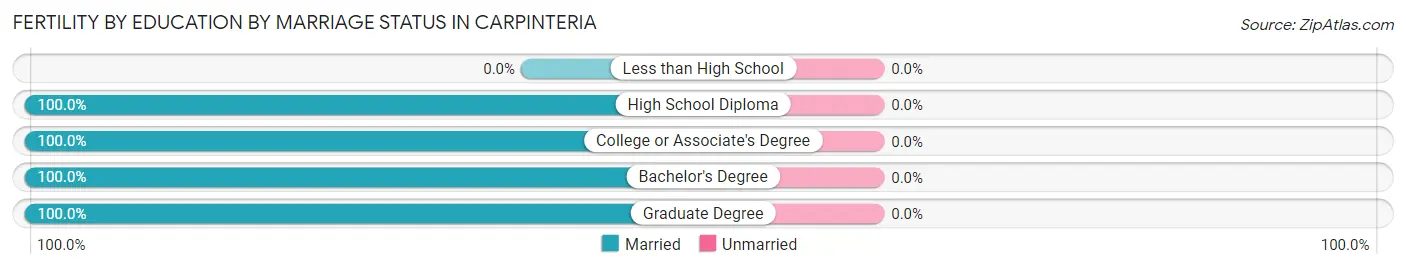
| Educational Attainment | Married | Unmarried |
| Less than High School | 0 (0.0%) | 0 (0.0%) |
| High School Diploma | 1 (100.0%) | 0 (0.0%) |
| College or Associate's Degree | 30 (100.0%) | 0 (0.0%) |
| Bachelor's Degree | 71 (100.0%) | 0 (0.0%) |
| Graduate Degree | 10 (100.0%) | 0 (0.0%) |
| Total | 112 (100.0%) | 0 (0.0%) |
Employment Characteristics in Carpinteria
Employment by Class of Employer in Carpinteria
Among the 6,511 employed individuals in Carpinteria, private company employees (4,036 | 62.0%), not-for-profit organizations (913 | 14.0%), and self-employed (not incorporated) (650 | 10.0%) make up the most common classes of employment.
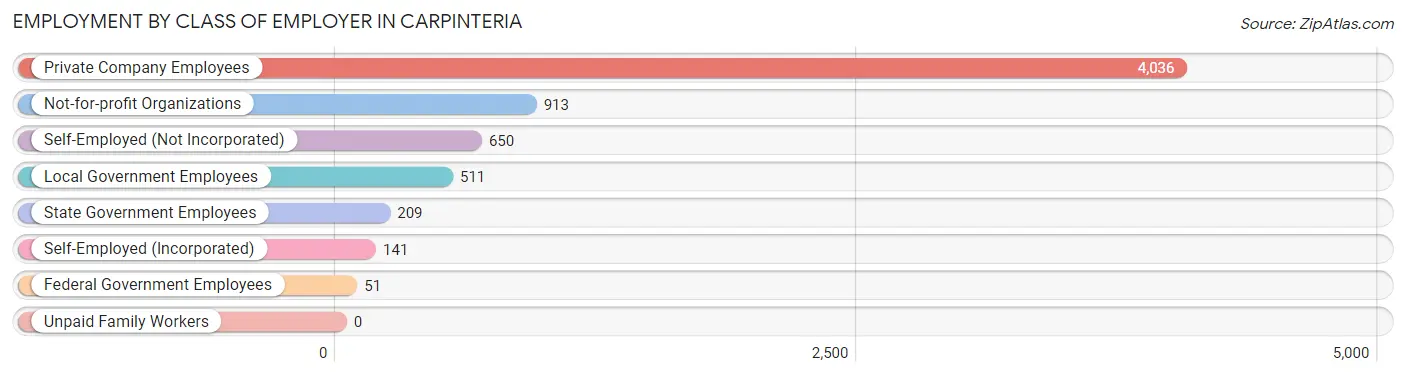
| Employer Class | # Employees | % Employees |
| Private Company Employees | 4,036 | 62.0% |
| Self-Employed (Incorporated) | 141 | 2.2% |
| Self-Employed (Not Incorporated) | 650 | 10.0% |
| Not-for-profit Organizations | 913 | 14.0% |
| Local Government Employees | 511 | 7.9% |
| State Government Employees | 209 | 3.2% |
| Federal Government Employees | 51 | 0.8% |
| Unpaid Family Workers | 0 | 0.0% |
| Total | 6,511 | 100.0% |
Employment Status by Age in Carpinteria
According to the labor force statistics for Carpinteria, out of the total population over 16 years of age (10,726), 66.2% or 7,101 individuals are in the labor force, with 4.6% or 327 of them unemployed. The age group with the highest labor force participation rate is 30 to 34 years, with 89.4% or 639 individuals in the labor force. Within the labor force, the 75 years and over age range has the highest percentage of unemployed individuals, with 33.3% or 12 of them being unemployed.
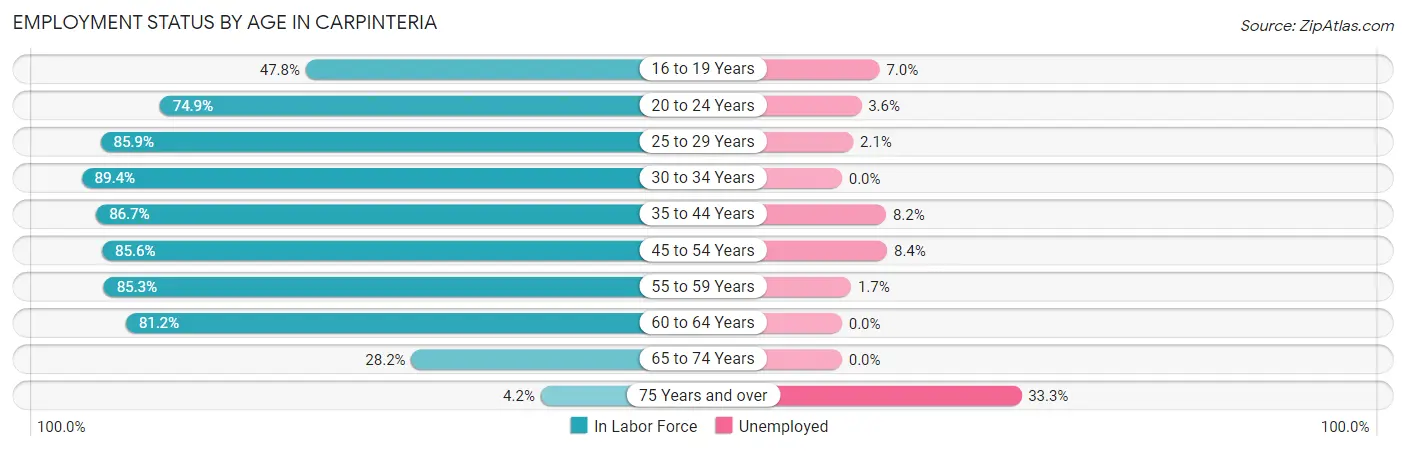
| Age Bracket | In Labor Force | Unemployed |
| 16 to 19 Years | 228 (47.8%) | 16 (7.0%) |
| 20 to 24 Years | 442 (74.9%) | 16 (3.6%) |
| 25 to 29 Years | 579 (85.9%) | 12 (2.1%) |
| 30 to 34 Years | 639 (89.4%) | 0 (0.0%) |
| 35 to 44 Years | 1,653 (86.7%) | 136 (8.2%) |
| 45 to 54 Years | 1,406 (85.6%) | 118 (8.4%) |
| 55 to 59 Years | 839 (85.3%) | 14 (1.7%) |
| 60 to 64 Years | 722 (81.2%) | 0 (0.0%) |
| 65 to 74 Years | 559 (28.2%) | 0 (0.0%) |
| 75 Years and over | 36 (4.2%) | 12 (33.3%) |
| Total | 7,101 (66.2%) | 327 (4.6%) |
Employment Status by Educational Attainment in Carpinteria
According to labor force statistics for Carpinteria, 85.7% of individuals (5,838) out of the total population between 25 and 64 years of age (6,812) are in the labor force, with 4.8% or 280 of them being unemployed. The group with the highest labor force participation rate are those with the educational attainment of high school diploma, with 94.5% or 849 individuals in the labor force. Within the labor force, individuals with college / associate degree education have the highest percentage of unemployment, with 7.9% or 122 of them being unemployed.
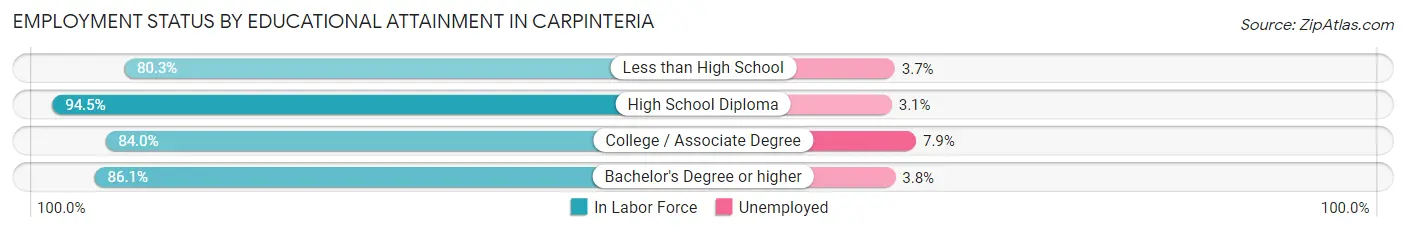
| Educational Attainment | In Labor Force | Unemployed |
| Less than High School | 892 (80.3%) | 41 (3.7%) |
| High School Diploma | 849 (94.5%) | 28 (3.1%) |
| College / Associate Degree | 1,548 (84.0%) | 146 (7.9%) |
| Bachelor's Degree or higher | 2,549 (86.1%) | 112 (3.8%) |
| Total | 5,838 (85.7%) | 327 (4.8%) |
Employment Occupations by Sex in Carpinteria
Management, Business, Science and Arts Occupations
The most common Management, Business, Science and Arts occupations in Carpinteria are Management (1,009 | 14.9%), Community & Social Service (900 | 13.3%), Education Instruction & Library (541 | 8.0%), Business & Financial (402 | 5.9%), and Computers, Engineering & Science (399 | 5.9%).
Management, Business, Science and Arts Occupations by Sex
Within the Management, Business, Science and Arts occupations in Carpinteria, the most male-oriented occupations are Computers & Mathematics (94.4%), Computers, Engineering & Science (83.7%), and Architecture & Engineering (82.1%), while the most female-oriented occupations are Education, Arts & Media (92.6%), Legal Services & Support (88.6%), and Education Instruction & Library (72.1%).
| Occupation | Male | Female |
| Management | 502 (49.7%) | 507 (50.2%) |
| Business & Financial | 245 (61.0%) | 157 (39.1%) |
| Computers, Engineering & Science | 334 (83.7%) | 65 (16.3%) |
| Computers & Mathematics | 220 (94.4%) | 13 (5.6%) |
| Architecture & Engineering | 78 (82.1%) | 17 (17.9%) |
| Life, Physical & Social Science | 36 (50.7%) | 35 (49.3%) |
| Community & Social Service | 275 (30.6%) | 625 (69.4%) |
| Education, Arts & Media | 5 (7.3%) | 63 (92.6%) |
| Legal Services & Support | 12 (11.4%) | 93 (88.6%) |
| Education Instruction & Library | 151 (27.9%) | 390 (72.1%) |
| Arts, Media & Entertainment | 107 (57.5%) | 79 (42.5%) |
| Health Diagnosing & Treating | 86 (31.0%) | 191 (69.0%) |
| Health Technologists | 86 (37.9%) | 141 (62.1%) |
| Total (Category) | 1,442 (48.3%) | 1,545 (51.7%) |
| Total (Overall) | 3,656 (53.9%) | 3,124 (46.1%) |
Services Occupations
The most common Services occupations in Carpinteria are Cleaning & Maintenance (568 | 8.4%), Healthcare Support (338 | 5.0%), Food Preparation & Serving (266 | 3.9%), Personal Care & Service (152 | 2.2%), and Security & Protection (71 | 1.1%).
Services Occupations by Sex
Within the Services occupations in Carpinteria, the most male-oriented occupations are Firefighting & Prevention (100.0%), Security & Protection (88.7%), and Law Enforcement (74.2%), while the most female-oriented occupations are Personal Care & Service (91.4%), Healthcare Support (75.4%), and Food Preparation & Serving (60.2%).
| Occupation | Male | Female |
| Healthcare Support | 83 (24.6%) | 255 (75.4%) |
| Security & Protection | 63 (88.7%) | 8 (11.3%) |
| Firefighting & Prevention | 40 (100.0%) | 0 (0.0%) |
| Law Enforcement | 23 (74.2%) | 8 (25.8%) |
| Food Preparation & Serving | 106 (39.9%) | 160 (60.2%) |
| Cleaning & Maintenance | 353 (62.2%) | 215 (37.9%) |
| Personal Care & Service | 13 (8.6%) | 139 (91.4%) |
| Total (Category) | 618 (44.3%) | 777 (55.7%) |
| Total (Overall) | 3,656 (53.9%) | 3,124 (46.1%) |
Sales and Office Occupations
The most common Sales and Office occupations in Carpinteria are Office & Administration (657 | 9.7%), and Sales & Related (455 | 6.7%).
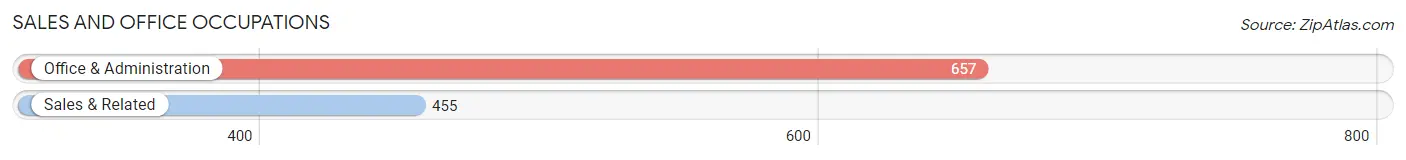
Sales and Office Occupations by Sex
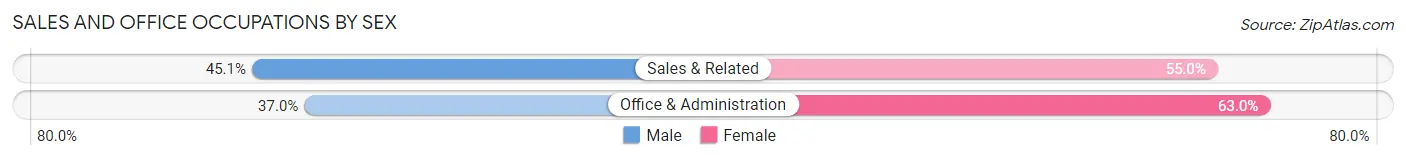
| Occupation | Male | Female |
| Sales & Related | 205 (45.1%) | 250 (54.9%) |
| Office & Administration | 243 (37.0%) | 414 (63.0%) |
| Total (Category) | 448 (40.3%) | 664 (59.7%) |
| Total (Overall) | 3,656 (53.9%) | 3,124 (46.1%) |
Natural Resources, Construction and Maintenance Occupations
The most common Natural Resources, Construction and Maintenance occupations in Carpinteria are Construction & Extraction (327 | 4.8%), Installation, Maintenance & Repair (215 | 3.2%), and Farming, Fishing & Forestry (135 | 2.0%).
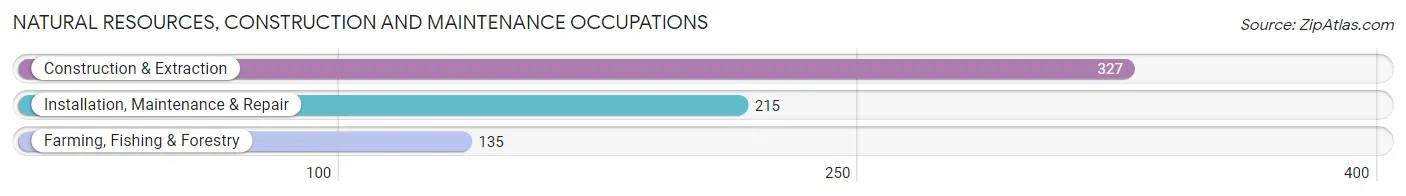
Natural Resources, Construction and Maintenance Occupations by Sex
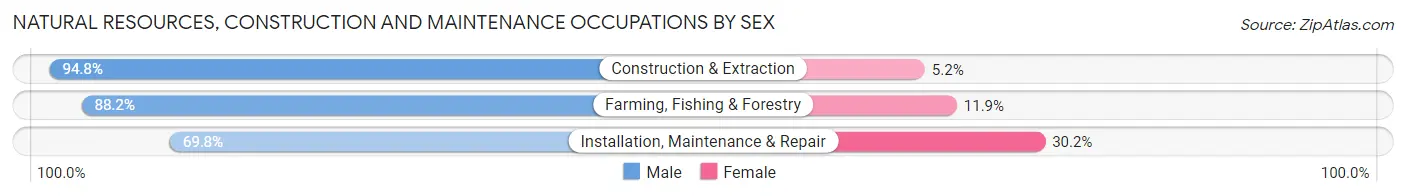
| Occupation | Male | Female |
| Farming, Fishing & Forestry | 119 (88.1%) | 16 (11.8%) |
| Construction & Extraction | 310 (94.8%) | 17 (5.2%) |
| Installation, Maintenance & Repair | 150 (69.8%) | 65 (30.2%) |
| Total (Category) | 579 (85.5%) | 98 (14.5%) |
| Total (Overall) | 3,656 (53.9%) | 3,124 (46.1%) |
Production, Transportation and Moving Occupations
The most common Production, Transportation and Moving occupations in Carpinteria are Production (279 | 4.1%), Material Moving (166 | 2.5%), and Transportation (164 | 2.4%).
Production, Transportation and Moving Occupations by Sex
| Occupation | Male | Female |
| Production | 242 (86.7%) | 37 (13.3%) |
| Transportation | 164 (100.0%) | 0 (0.0%) |
| Material Moving | 163 (98.2%) | 3 (1.8%) |
| Total (Category) | 569 (93.4%) | 40 (6.6%) |
| Total (Overall) | 3,656 (53.9%) | 3,124 (46.1%) |
Employment Industries by Sex in Carpinteria
Employment Industries in Carpinteria
The major employment industries in Carpinteria include Health Care & Social Assistance (930 | 13.7%), Educational Services (763 | 11.3%), Manufacturing (673 | 9.9%), Retail Trade (659 | 9.7%), and Professional & Scientific (592 | 8.7%).
Employment Industries by Sex in Carpinteria
The Carpinteria industries that see more men than women are Mining, Quarrying, & Extraction (100.0%), Utilities (100.0%), and Construction (93.7%), whereas the industries that tend to have a higher number of women are Real Estate, Rental & Leasing (76.7%), Educational Services (67.6%), and Health Care & Social Assistance (65.8%).
| Industry | Male | Female |
| Agriculture, Fishing & Hunting | 385 (85.6%) | 65 (14.4%) |
| Mining, Quarrying, & Extraction | 23 (100.0%) | 0 (0.0%) |
| Construction | 507 (93.7%) | 34 (6.3%) |
| Manufacturing | 319 (47.4%) | 354 (52.6%) |
| Wholesale Trade | 39 (37.1%) | 66 (62.9%) |
| Retail Trade | 392 (59.5%) | 267 (40.5%) |
| Transportation & Warehousing | 85 (88.5%) | 11 (11.5%) |
| Utilities | 61 (100.0%) | 0 (0.0%) |
| Information | 140 (70.7%) | 58 (29.3%) |
| Finance & Insurance | 103 (50.2%) | 102 (49.8%) |
| Real Estate, Rental & Leasing | 34 (23.3%) | 112 (76.7%) |
| Professional & Scientific | 355 (60.0%) | 237 (40.0%) |
| Enterprise Management | 0 (0.0%) | 0 (0.0%) |
| Administrative & Support | 267 (82.2%) | 58 (17.8%) |
| Educational Services | 247 (32.4%) | 516 (67.6%) |
| Health Care & Social Assistance | 318 (34.2%) | 612 (65.8%) |
| Arts, Entertainment & Recreation | 68 (46.9%) | 77 (53.1%) |
| Accommodation & Food Services | 95 (40.6%) | 139 (59.4%) |
| Public Administration | 70 (52.6%) | 63 (47.4%) |
| Total | 3,656 (53.9%) | 3,124 (46.1%) |
Education in Carpinteria
School Enrollment in Carpinteria
The most common levels of schooling among the 3,197 students in Carpinteria are college / undergraduate (933 | 29.2%), middle school (783 | 24.5%), and elementary school (665 | 20.8%).
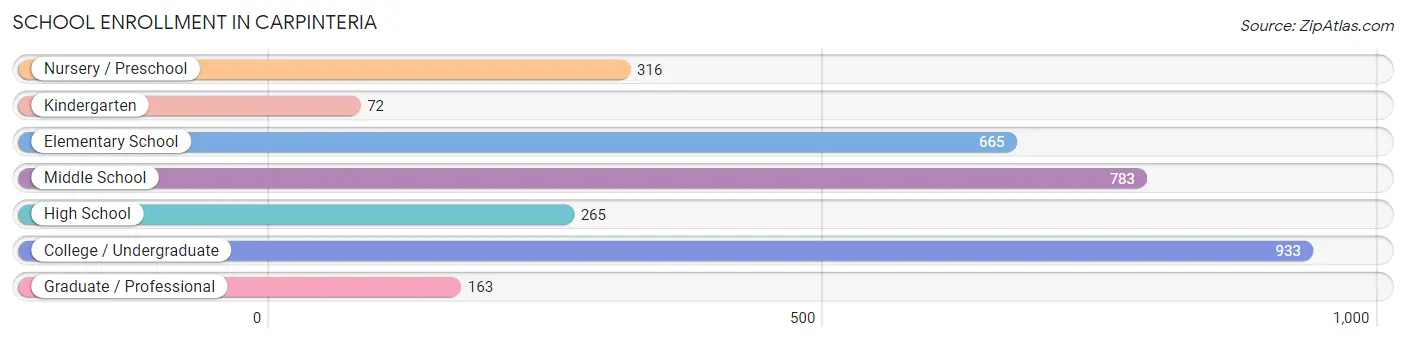
| School Level | # Students | % Students |
| Nursery / Preschool | 316 | 9.9% |
| Kindergarten | 72 | 2.2% |
| Elementary School | 665 | 20.8% |
| Middle School | 783 | 24.5% |
| High School | 265 | 8.3% |
| College / Undergraduate | 933 | 29.2% |
| Graduate / Professional | 163 | 5.1% |
| Total | 3,197 | 100.0% |
School Enrollment by Age by Funding Source in Carpinteria
Out of a total of 3,197 students who are enrolled in schools in Carpinteria, 639 (20.0%) attend a private institution, while the remaining 2,558 (80.0%) are enrolled in public schools. The age group of 3 to 4 year olds has the highest likelihood of being enrolled in private schools, with 174 (60.2% in the age bracket) enrolled. Conversely, the age group of 20 to 24 year olds has the lowest likelihood of being enrolled in a private school, with 255 (100.0% in the age bracket) attending a public institution.
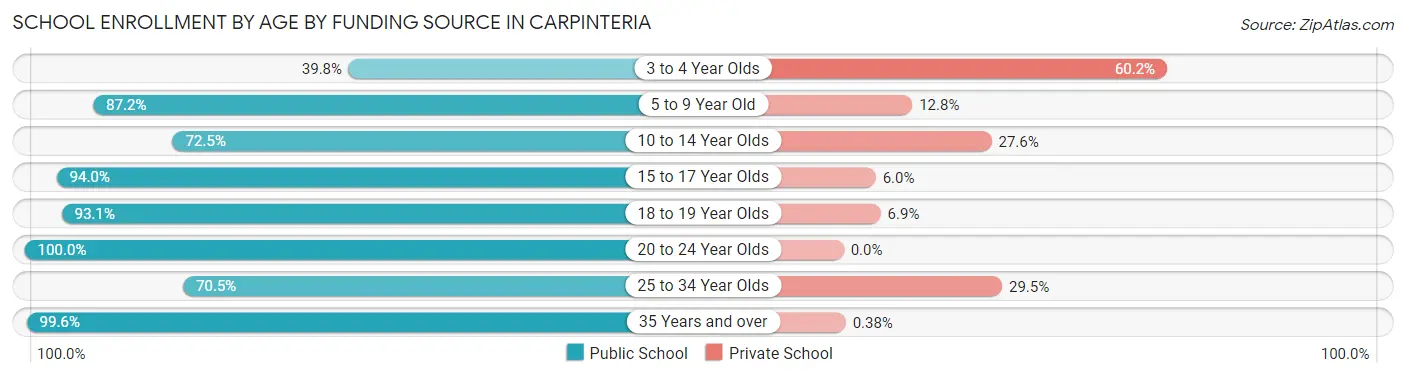
| Age Bracket | Public School | Private School |
| 3 to 4 Year Olds | 115 (39.8%) | 174 (60.2%) |
| 5 to 9 Year Old | 560 (87.2%) | 82 (12.8%) |
| 10 to 14 Year Olds | 668 (72.5%) | 254 (27.6%) |
| 15 to 17 Year Olds | 189 (94.0%) | 12 (6.0%) |
| 18 to 19 Year Olds | 284 (93.1%) | 21 (6.9%) |
| 20 to 24 Year Olds | 255 (100.0%) | 0 (0.0%) |
| 25 to 34 Year Olds | 227 (70.5%) | 95 (29.5%) |
| 35 Years and over | 260 (99.6%) | 1 (0.4%) |
| Total | 2,558 (80.0%) | 639 (20.0%) |
Educational Attainment by Field of Study in Carpinteria
Social sciences (782 | 17.9%), business (583 | 13.3%), visual & performing arts (381 | 8.7%), literature & languages (322 | 7.4%), and bio, nature & agricultural (310 | 7.1%) are the most common fields of study among 4,372 individuals in Carpinteria who have obtained a bachelor's degree or higher.
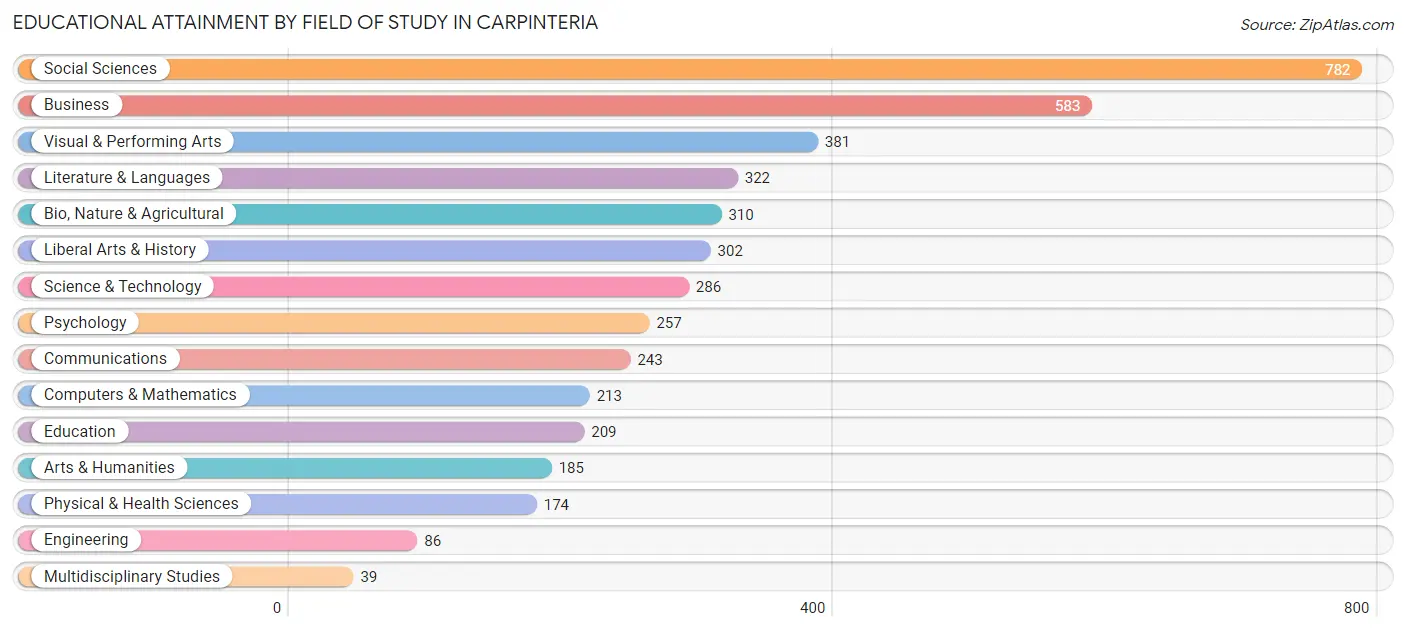
| Field of Study | # Graduates | % Graduates |
| Computers & Mathematics | 213 | 4.9% |
| Bio, Nature & Agricultural | 310 | 7.1% |
| Physical & Health Sciences | 174 | 4.0% |
| Psychology | 257 | 5.9% |
| Social Sciences | 782 | 17.9% |
| Engineering | 86 | 2.0% |
| Multidisciplinary Studies | 39 | 0.9% |
| Science & Technology | 286 | 6.5% |
| Business | 583 | 13.3% |
| Education | 209 | 4.8% |
| Literature & Languages | 322 | 7.4% |
| Liberal Arts & History | 302 | 6.9% |
| Visual & Performing Arts | 381 | 8.7% |
| Communications | 243 | 5.6% |
| Arts & Humanities | 185 | 4.2% |
| Total | 4,372 | 100.0% |
Transportation & Commute in Carpinteria
Vehicle Availability by Sex in Carpinteria
The most prevalent vehicle ownership categories in Carpinteria are males with 2 vehicles (1,508, accounting for 42.7%) and females with 2 vehicles (1,313, making up 50.8%).
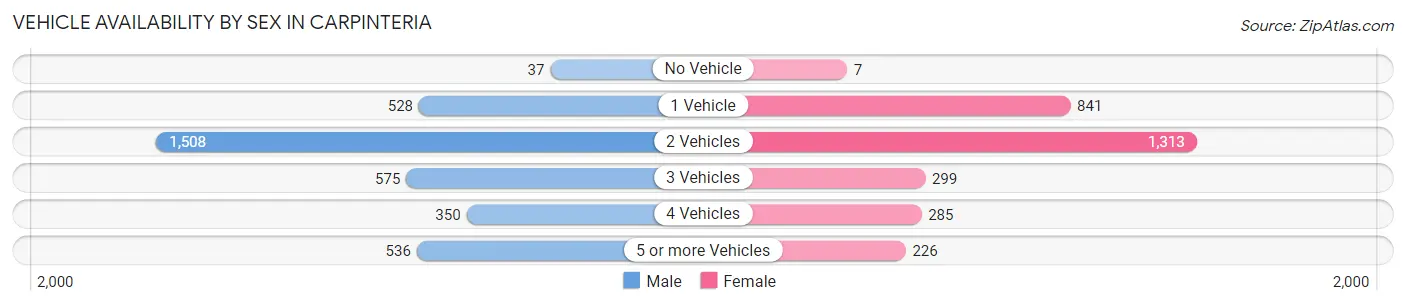
| Vehicles Available | Male | Female |
| No Vehicle | 37 (1.1%) | 7 (0.2%) |
| 1 Vehicle | 528 (14.9%) | 841 (28.3%) |
| 2 Vehicles | 1,508 (42.7%) | 1,313 (44.2%) |
| 3 Vehicles | 575 (16.3%) | 299 (10.1%) |
| 4 Vehicles | 350 (9.9%) | 285 (9.6%) |
| 5 or more Vehicles | 536 (15.2%) | 226 (7.6%) |
| Total | 3,534 (100.0%) | 2,971 (100.0%) |
Commute Time in Carpinteria
The most frequently occuring commute durations in Carpinteria are 5 to 9 minutes (993 commuters, 17.4%), 15 to 19 minutes (923 commuters, 16.2%), and 20 to 24 minutes (834 commuters, 14.6%).
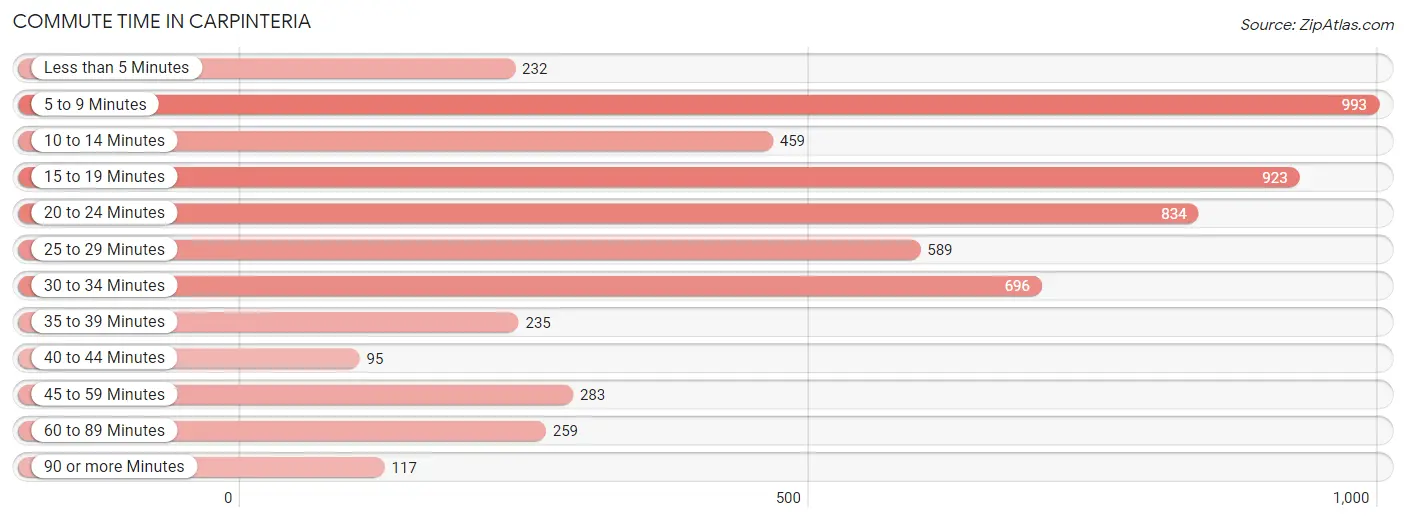
| Commute Time | # Commuters | % Commuters |
| Less than 5 Minutes | 232 | 4.1% |
| 5 to 9 Minutes | 993 | 17.4% |
| 10 to 14 Minutes | 459 | 8.0% |
| 15 to 19 Minutes | 923 | 16.2% |
| 20 to 24 Minutes | 834 | 14.6% |
| 25 to 29 Minutes | 589 | 10.3% |
| 30 to 34 Minutes | 696 | 12.2% |
| 35 to 39 Minutes | 235 | 4.1% |
| 40 to 44 Minutes | 95 | 1.7% |
| 45 to 59 Minutes | 283 | 5.0% |
| 60 to 89 Minutes | 259 | 4.5% |
| 90 or more Minutes | 117 | 2.1% |
Commute Time by Sex in Carpinteria
The most common commute times in Carpinteria are 15 to 19 minutes (619 commuters, 19.9%) for males and 5 to 9 minutes (565 commuters, 21.7%) for females.
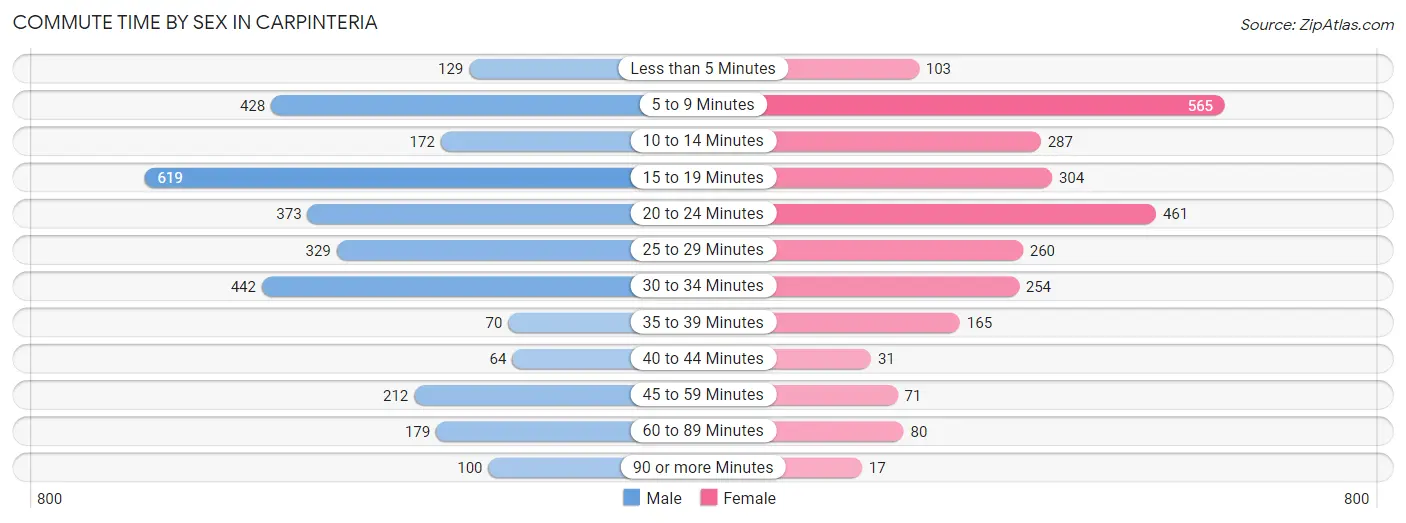
| Commute Time | Male | Female |
| Less than 5 Minutes | 129 (4.1%) | 103 (4.0%) |
| 5 to 9 Minutes | 428 (13.7%) | 565 (21.7%) |
| 10 to 14 Minutes | 172 (5.5%) | 287 (11.1%) |
| 15 to 19 Minutes | 619 (19.9%) | 304 (11.7%) |
| 20 to 24 Minutes | 373 (12.0%) | 461 (17.7%) |
| 25 to 29 Minutes | 329 (10.6%) | 260 (10.0%) |
| 30 to 34 Minutes | 442 (14.2%) | 254 (9.8%) |
| 35 to 39 Minutes | 70 (2.2%) | 165 (6.4%) |
| 40 to 44 Minutes | 64 (2.1%) | 31 (1.2%) |
| 45 to 59 Minutes | 212 (6.8%) | 71 (2.7%) |
| 60 to 89 Minutes | 179 (5.7%) | 80 (3.1%) |
| 90 or more Minutes | 100 (3.2%) | 17 (0.6%) |
Time of Departure to Work by Sex in Carpinteria
The most frequent times of departure to work in Carpinteria are 6:30 AM to 6:59 AM (530, 17.0%) for males and 8:30 AM to 8:59 AM (399, 15.4%) for females.
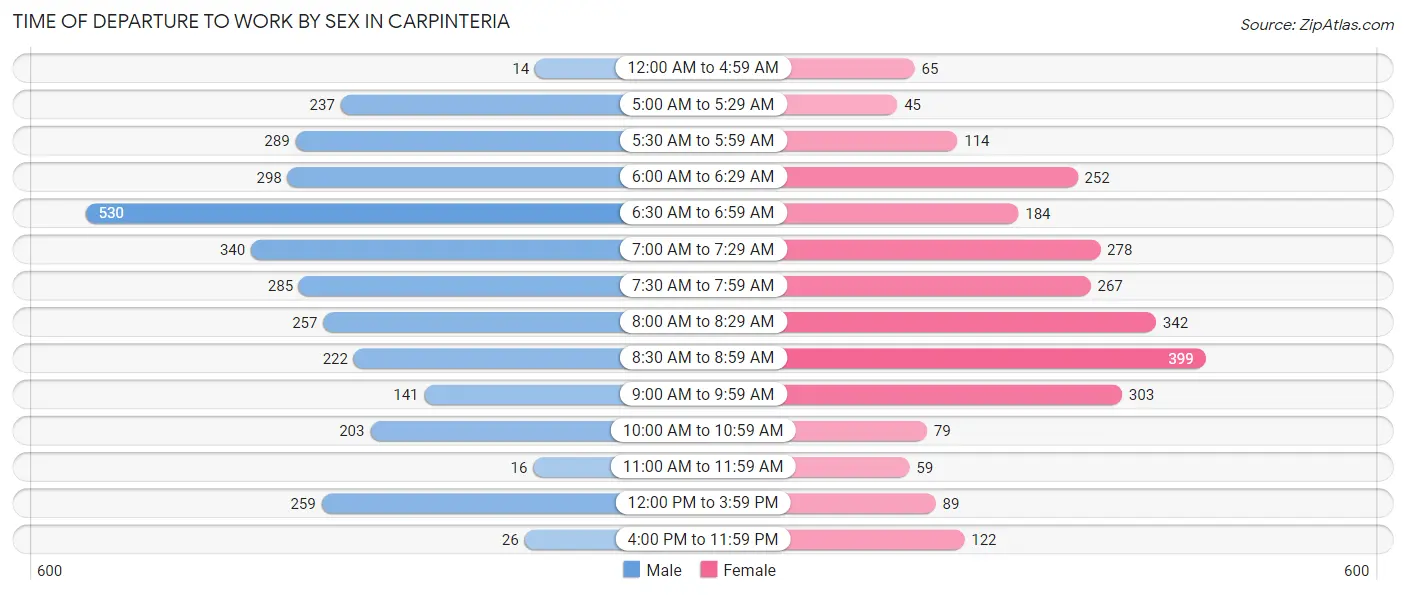
| Time of Departure | Male | Female |
| 12:00 AM to 4:59 AM | 14 (0.4%) | 65 (2.5%) |
| 5:00 AM to 5:29 AM | 237 (7.6%) | 45 (1.7%) |
| 5:30 AM to 5:59 AM | 289 (9.3%) | 114 (4.4%) |
| 6:00 AM to 6:29 AM | 298 (9.6%) | 252 (9.7%) |
| 6:30 AM to 6:59 AM | 530 (17.0%) | 184 (7.1%) |
| 7:00 AM to 7:29 AM | 340 (10.9%) | 278 (10.7%) |
| 7:30 AM to 7:59 AM | 285 (9.1%) | 267 (10.3%) |
| 8:00 AM to 8:29 AM | 257 (8.3%) | 342 (13.2%) |
| 8:30 AM to 8:59 AM | 222 (7.1%) | 399 (15.4%) |
| 9:00 AM to 9:59 AM | 141 (4.5%) | 303 (11.7%) |
| 10:00 AM to 10:59 AM | 203 (6.5%) | 79 (3.0%) |
| 11:00 AM to 11:59 AM | 16 (0.5%) | 59 (2.3%) |
| 12:00 PM to 3:59 PM | 259 (8.3%) | 89 (3.4%) |
| 4:00 PM to 11:59 PM | 26 (0.8%) | 122 (4.7%) |
| Total | 3,117 (100.0%) | 2,598 (100.0%) |
Housing Occupancy in Carpinteria
Occupancy by Ownership in Carpinteria
Of the total 5,079 dwellings in Carpinteria, owner-occupied units account for 2,941 (57.9%), while renter-occupied units make up 2,138 (42.1%).
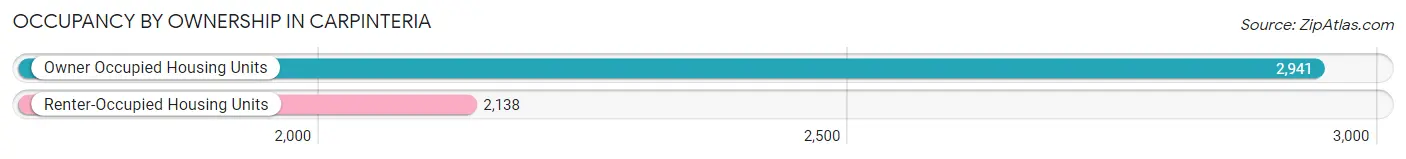
| Occupancy | # Housing Units | % Housing Units |
| Owner Occupied Housing Units | 2,941 | 57.9% |
| Renter-Occupied Housing Units | 2,138 | 42.1% |
| Total Occupied Housing Units | 5,079 | 100.0% |
Occupancy by Household Size in Carpinteria
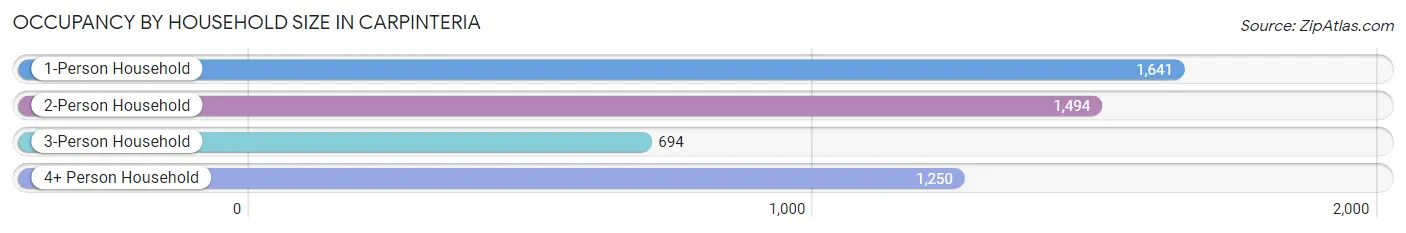
| Household Size | # Housing Units | % Housing Units |
| 1-Person Household | 1,641 | 32.3% |
| 2-Person Household | 1,494 | 29.4% |
| 3-Person Household | 694 | 13.7% |
| 4+ Person Household | 1,250 | 24.6% |
| Total Housing Units | 5,079 | 100.0% |
Occupancy by Ownership by Household Size in Carpinteria
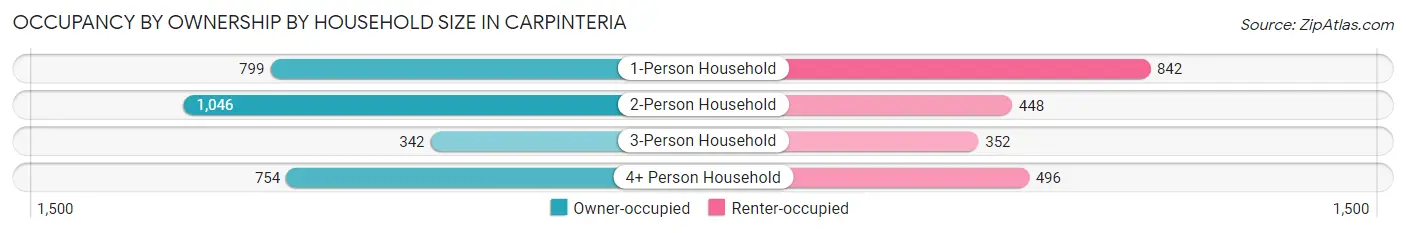
| Household Size | Owner-occupied | Renter-occupied |
| 1-Person Household | 799 (48.7%) | 842 (51.3%) |
| 2-Person Household | 1,046 (70.0%) | 448 (30.0%) |
| 3-Person Household | 342 (49.3%) | 352 (50.7%) |
| 4+ Person Household | 754 (60.3%) | 496 (39.7%) |
| Total Housing Units | 2,941 (57.9%) | 2,138 (42.1%) |
Occupancy by Educational Attainment in Carpinteria
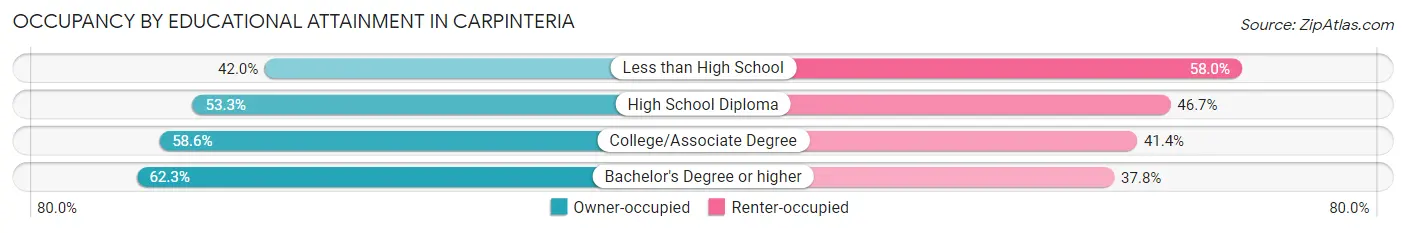
| Household Size | Owner-occupied | Renter-occupied |
| Less than High School | 234 (42.0%) | 323 (58.0%) |
| High School Diploma | 319 (53.3%) | 279 (46.7%) |
| College/Associate Degree | 889 (58.6%) | 627 (41.4%) |
| Bachelor's Degree or higher | 1,499 (62.3%) | 909 (37.8%) |
Occupancy by Age of Householder in Carpinteria
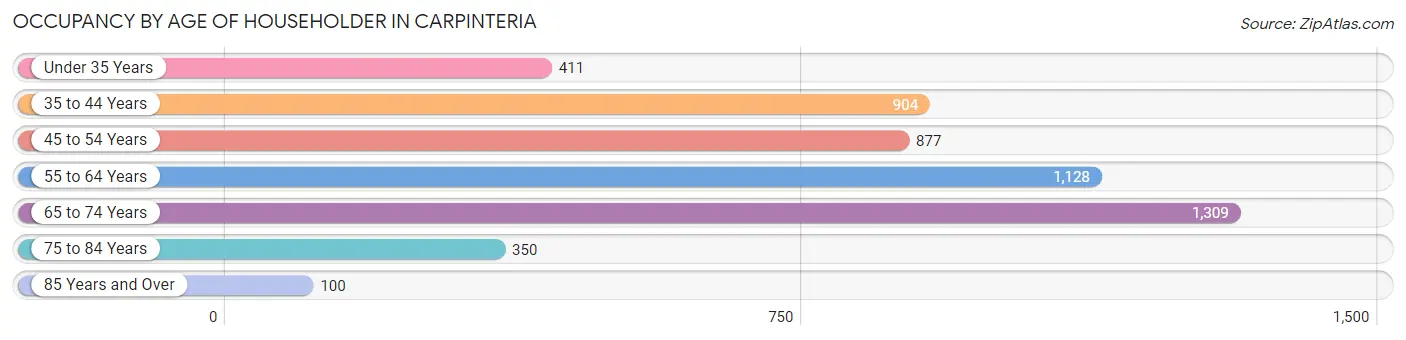
| Age Bracket | # Households | % Households |
| Under 35 Years | 411 | 8.1% |
| 35 to 44 Years | 904 | 17.8% |
| 45 to 54 Years | 877 | 17.3% |
| 55 to 64 Years | 1,128 | 22.2% |
| 65 to 74 Years | 1,309 | 25.8% |
| 75 to 84 Years | 350 | 6.9% |
| 85 Years and Over | 100 | 2.0% |
| Total | 5,079 | 100.0% |
Housing Finances in Carpinteria
Median Income by Occupancy in Carpinteria
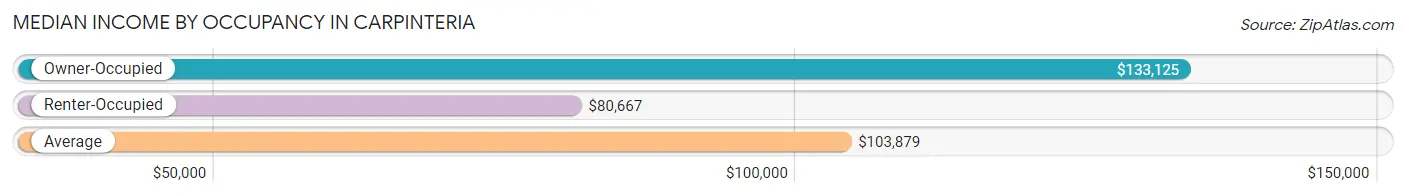
| Occupancy Type | # Households | Median Income |
| Owner-Occupied | 2,941 (57.9%) | $133,125 |
| Renter-Occupied | 2,138 (42.1%) | $80,667 |
| Average | 5,079 (100.0%) | $103,879 |
Occupancy by Householder Income Bracket in Carpinteria
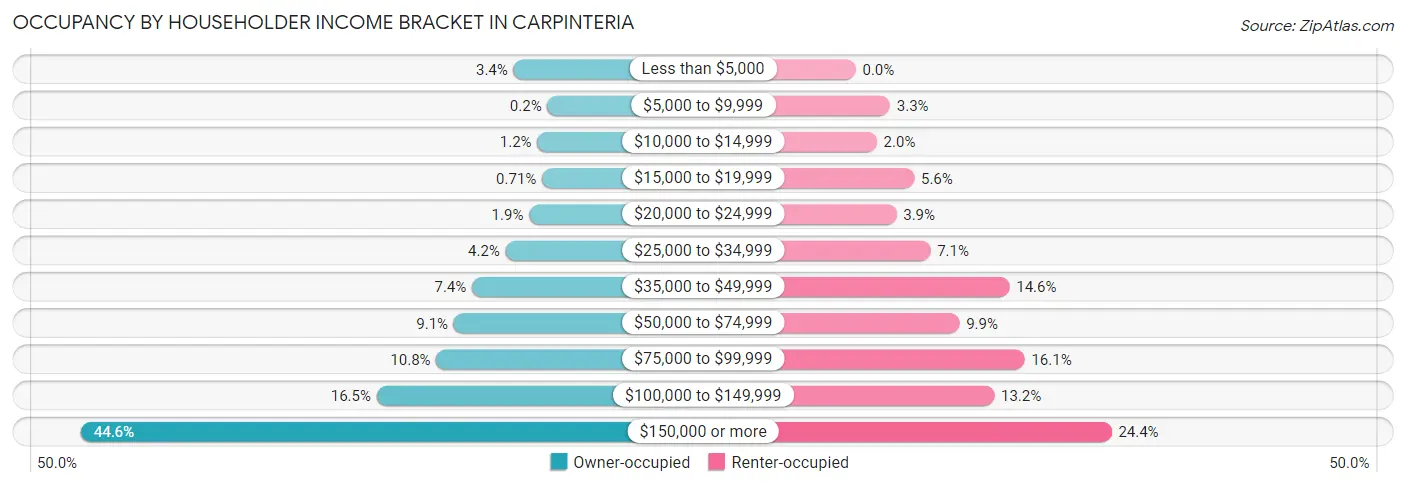
| Income Bracket | Owner-occupied | Renter-occupied |
| Less than $5,000 | 101 (3.4%) | 0 (0.0%) |
| $5,000 to $9,999 | 6 (0.2%) | 70 (3.3%) |
| $10,000 to $14,999 | 34 (1.2%) | 43 (2.0%) |
| $15,000 to $19,999 | 21 (0.7%) | 119 (5.6%) |
| $20,000 to $24,999 | 57 (1.9%) | 83 (3.9%) |
| $25,000 to $34,999 | 123 (4.2%) | 152 (7.1%) |
| $35,000 to $49,999 | 217 (7.4%) | 313 (14.6%) |
| $50,000 to $74,999 | 268 (9.1%) | 211 (9.9%) |
| $75,000 to $99,999 | 317 (10.8%) | 344 (16.1%) |
| $100,000 to $149,999 | 484 (16.5%) | 282 (13.2%) |
| $150,000 or more | 1,313 (44.6%) | 521 (24.4%) |
| Total | 2,941 (100.0%) | 2,138 (100.0%) |
Monthly Housing Cost Tiers in Carpinteria
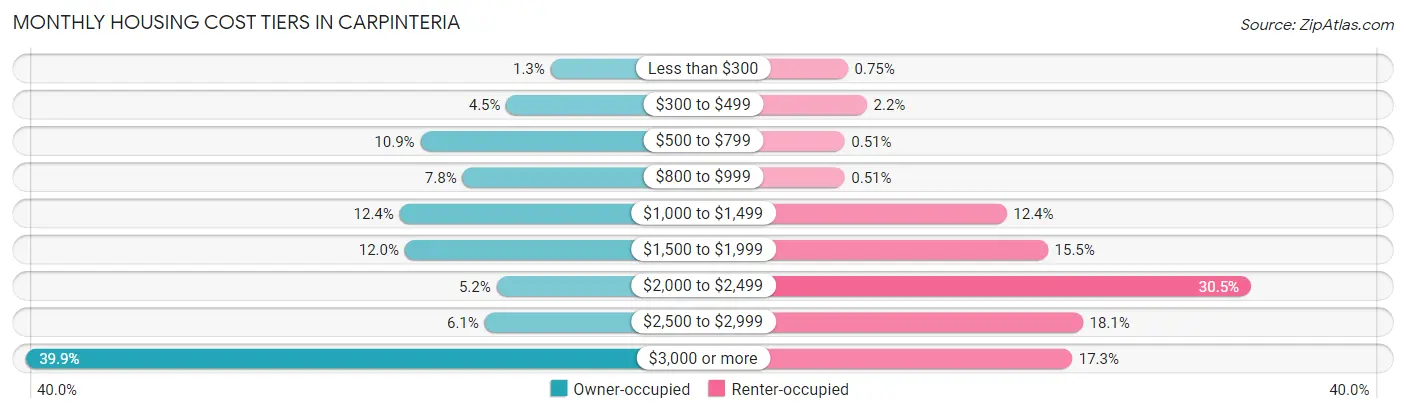
| Monthly Cost | Owner-occupied | Renter-occupied |
| Less than $300 | 37 (1.3%) | 16 (0.7%) |
| $300 to $499 | 133 (4.5%) | 46 (2.1%) |
| $500 to $799 | 319 (10.8%) | 11 (0.5%) |
| $800 to $999 | 228 (7.7%) | 11 (0.5%) |
| $1,000 to $1,499 | 364 (12.4%) | 266 (12.4%) |
| $1,500 to $1,999 | 353 (12.0%) | 331 (15.5%) |
| $2,000 to $2,499 | 154 (5.2%) | 651 (30.4%) |
| $2,500 to $2,999 | 180 (6.1%) | 386 (18.0%) |
| $3,000 or more | 1,173 (39.9%) | 369 (17.3%) |
| Total | 2,941 (100.0%) | 2,138 (100.0%) |
Physical Housing Characteristics in Carpinteria
Housing Structures in Carpinteria
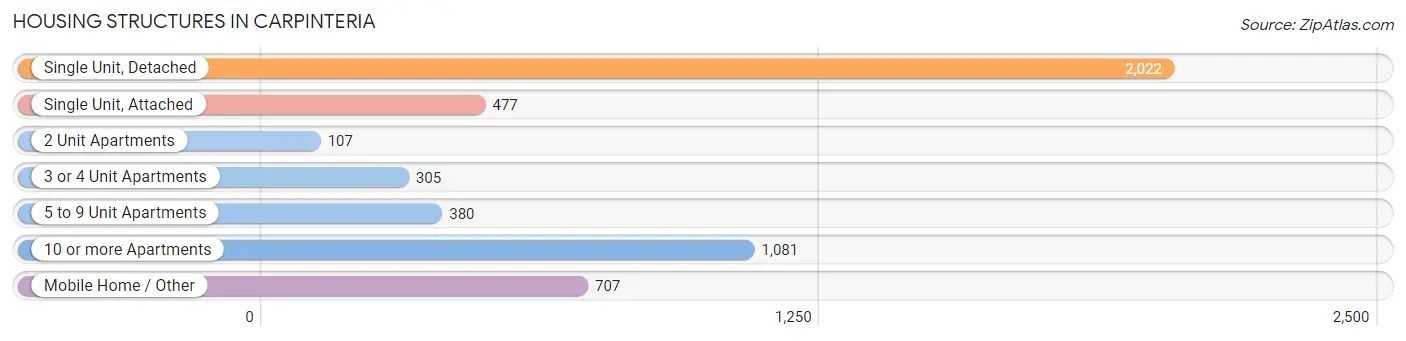
| Structure Type | # Housing Units | % Housing Units |
| Single Unit, Detached | 2,022 | 39.8% |
| Single Unit, Attached | 477 | 9.4% |
| 2 Unit Apartments | 107 | 2.1% |
| 3 or 4 Unit Apartments | 305 | 6.0% |
| 5 to 9 Unit Apartments | 380 | 7.5% |
| 10 or more Apartments | 1,081 | 21.3% |
| Mobile Home / Other | 707 | 13.9% |
| Total | 5,079 | 100.0% |
Housing Structures by Occupancy in Carpinteria
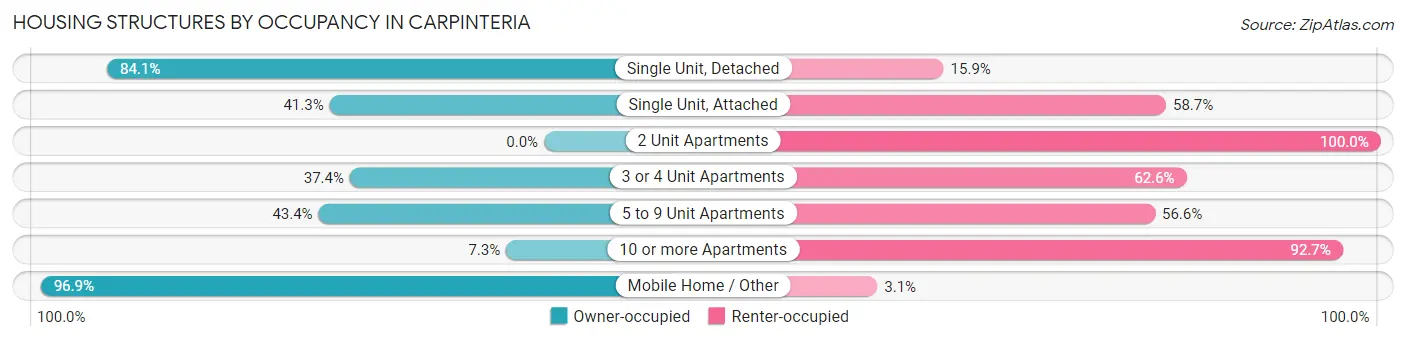
| Structure Type | Owner-occupied | Renter-occupied |
| Single Unit, Detached | 1,701 (84.1%) | 321 (15.9%) |
| Single Unit, Attached | 197 (41.3%) | 280 (58.7%) |
| 2 Unit Apartments | 0 (0.0%) | 107 (100.0%) |
| 3 or 4 Unit Apartments | 114 (37.4%) | 191 (62.6%) |
| 5 to 9 Unit Apartments | 165 (43.4%) | 215 (56.6%) |
| 10 or more Apartments | 79 (7.3%) | 1,002 (92.7%) |
| Mobile Home / Other | 685 (96.9%) | 22 (3.1%) |
| Total | 2,941 (57.9%) | 2,138 (42.1%) |
Housing Structures by Number of Rooms in Carpinteria
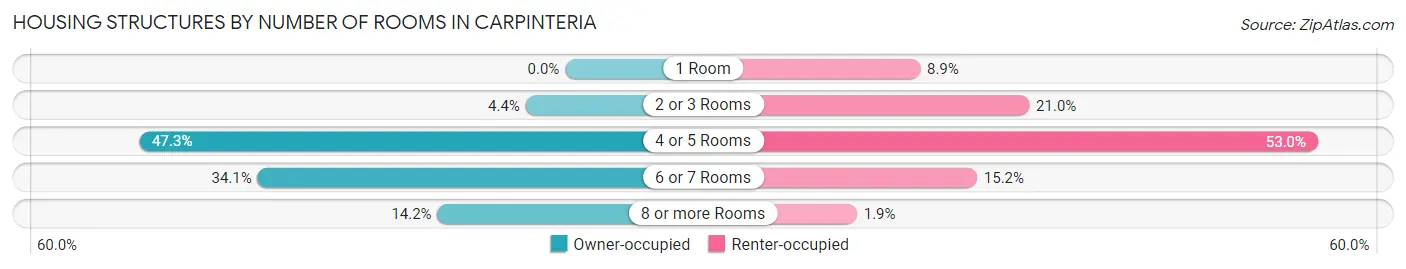
| Number of Rooms | Owner-occupied | Renter-occupied |
| 1 Room | 0 (0.0%) | 190 (8.9%) |
| 2 or 3 Rooms | 129 (4.4%) | 449 (21.0%) |
| 4 or 5 Rooms | 1,391 (47.3%) | 1,134 (53.0%) |
| 6 or 7 Rooms | 1,004 (34.1%) | 325 (15.2%) |
| 8 or more Rooms | 417 (14.2%) | 40 (1.9%) |
| Total | 2,941 (100.0%) | 2,138 (100.0%) |
Housing Structure by Heating Type in Carpinteria
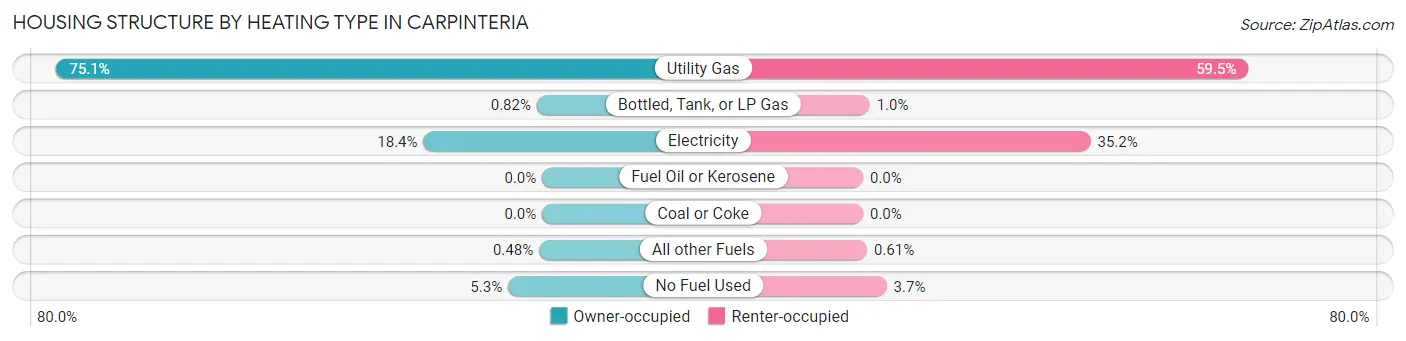
| Heating Type | Owner-occupied | Renter-occupied |
| Utility Gas | 2,208 (75.1%) | 1,273 (59.5%) |
| Bottled, Tank, or LP Gas | 24 (0.8%) | 22 (1.0%) |
| Electricity | 540 (18.4%) | 752 (35.2%) |
| Fuel Oil or Kerosene | 0 (0.0%) | 0 (0.0%) |
| Coal or Coke | 0 (0.0%) | 0 (0.0%) |
| All other Fuels | 14 (0.5%) | 13 (0.6%) |
| No Fuel Used | 155 (5.3%) | 78 (3.6%) |
| Total | 2,941 (100.0%) | 2,138 (100.0%) |
Household Vehicle Usage in Carpinteria
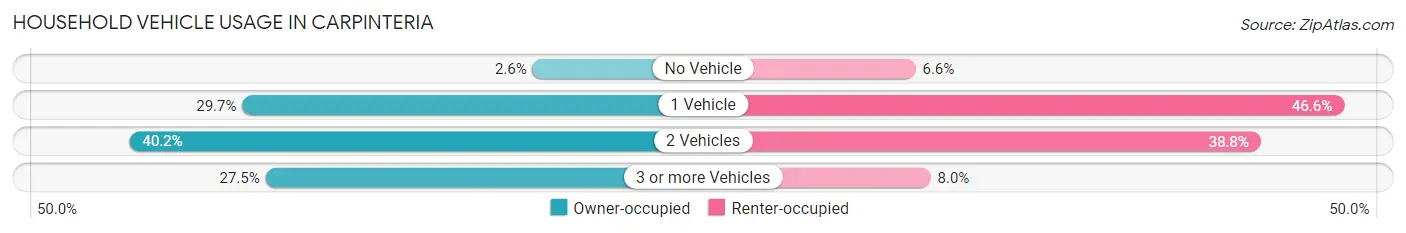
| Vehicles per Household | Owner-occupied | Renter-occupied |
| No Vehicle | 76 (2.6%) | 141 (6.6%) |
| 1 Vehicle | 873 (29.7%) | 996 (46.6%) |
| 2 Vehicles | 1,183 (40.2%) | 830 (38.8%) |
| 3 or more Vehicles | 809 (27.5%) | 171 (8.0%) |
| Total | 2,941 (100.0%) | 2,138 (100.0%) |
Real Estate & Mortgages in Carpinteria
Real Estate and Mortgage Overview in Carpinteria
| Characteristic | Without Mortgage | With Mortgage |
| Housing Units | 1,017 | 1,924 |
| Median Property Value | $651,700 | $1,023,900 |
| Median Household Income | $80,108 | $1,094 |
| Monthly Housing Costs | $813 | $1,173 |
| Real Estate Taxes | $2,978 | $174 |
Property Value by Mortgage Status in Carpinteria
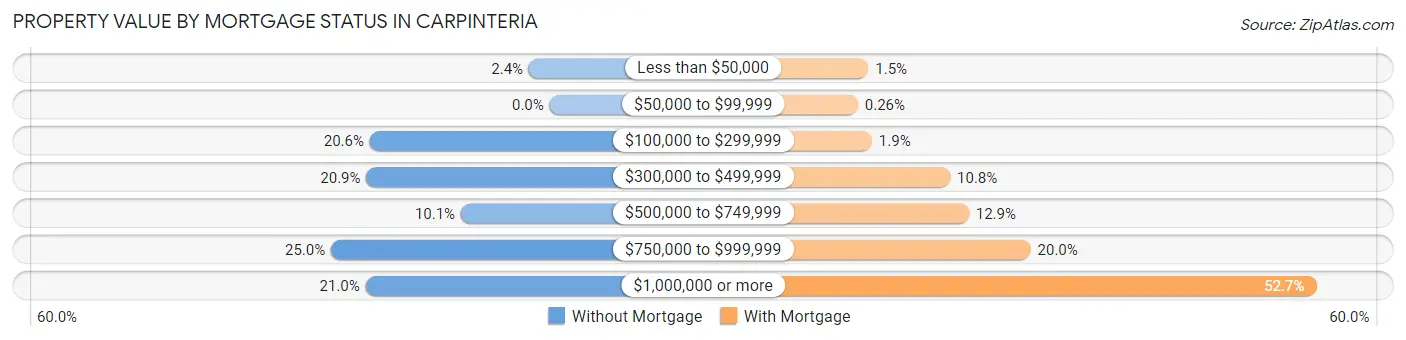
| Property Value | Without Mortgage | With Mortgage |
| Less than $50,000 | 24 (2.4%) | 28 (1.5%) |
| $50,000 to $99,999 | 0 (0.0%) | 5 (0.3%) |
| $100,000 to $299,999 | 209 (20.5%) | 36 (1.9%) |
| $300,000 to $499,999 | 213 (20.9%) | 208 (10.8%) |
| $500,000 to $749,999 | 103 (10.1%) | 249 (12.9%) |
| $750,000 to $999,999 | 254 (25.0%) | 385 (20.0%) |
| $1,000,000 or more | 214 (21.0%) | 1,013 (52.6%) |
| Total | 1,017 (100.0%) | 1,924 (100.0%) |
Household Income by Mortgage Status in Carpinteria
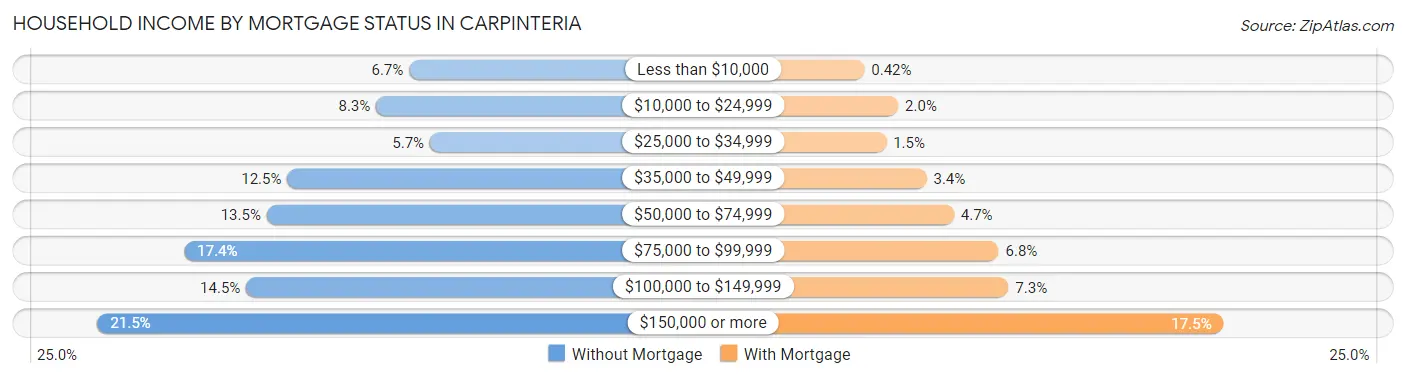
| Household Income | Without Mortgage | With Mortgage |
| Less than $10,000 | 68 (6.7%) | 8 (0.4%) |
| $10,000 to $24,999 | 84 (8.3%) | 39 (2.0%) |
| $25,000 to $34,999 | 58 (5.7%) | 28 (1.5%) |
| $35,000 to $49,999 | 127 (12.5%) | 65 (3.4%) |
| $50,000 to $74,999 | 137 (13.5%) | 90 (4.7%) |
| $75,000 to $99,999 | 177 (17.4%) | 131 (6.8%) |
| $100,000 to $149,999 | 147 (14.4%) | 140 (7.3%) |
| $150,000 or more | 219 (21.5%) | 337 (17.5%) |
| Total | 1,017 (100.0%) | 1,924 (100.0%) |
Property Value to Household Income Ratio in Carpinteria
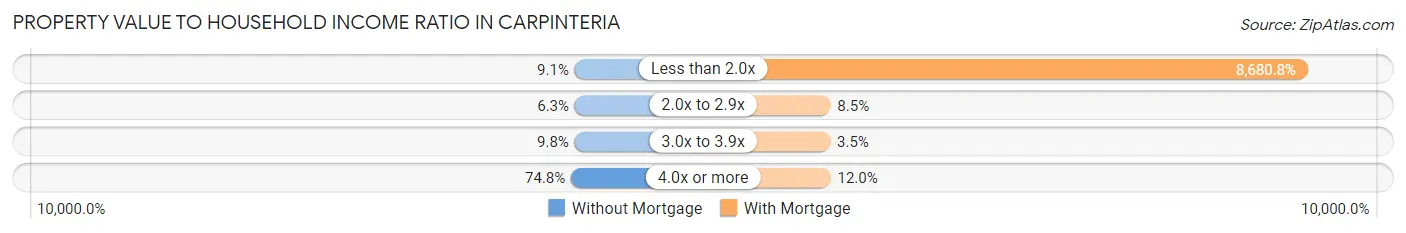
| Value-to-Income Ratio | Without Mortgage | With Mortgage |
| Less than 2.0x | 92 (9.0%) | 167,019 (8,680.8%) |
| 2.0x to 2.9x | 64 (6.3%) | 164 (8.5%) |
| 3.0x to 3.9x | 100 (9.8%) | 67 (3.5%) |
| 4.0x or more | 761 (74.8%) | 230 (11.9%) |
| Total | 1,017 (100.0%) | 1,924 (100.0%) |
Real Estate Taxes by Mortgage Status in Carpinteria
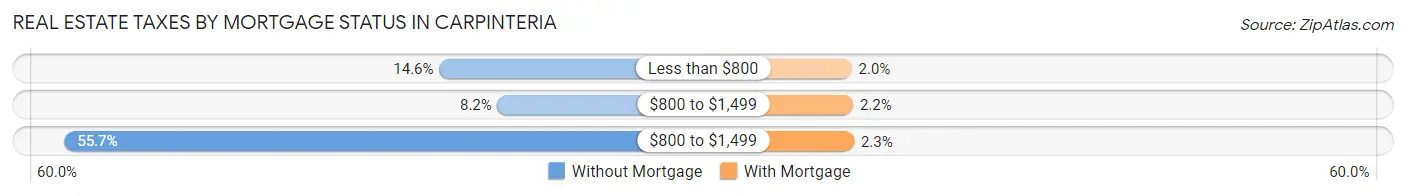
| Property Taxes | Without Mortgage | With Mortgage |
| Less than $800 | 148 (14.5%) | 39 (2.0%) |
| $800 to $1,499 | 83 (8.2%) | 42 (2.2%) |
| $800 to $1,499 | 566 (55.6%) | 44 (2.3%) |
| Total | 1,017 (100.0%) | 1,924 (100.0%) |
Health & Disability in Carpinteria
Health Insurance Coverage by Age in Carpinteria
| Age Bracket | With Coverage | Without Coverage |
| Under 6 Years | 867 (98.8%) | 11 (1.3%) |
| 6 to 18 Years | 1,863 (97.5%) | 47 (2.5%) |
| 19 to 25 Years | 689 (77.3%) | 202 (22.7%) |
| 26 to 34 Years | 1,096 (88.5%) | 142 (11.5%) |
| 35 to 44 Years | 1,682 (88.2%) | 225 (11.8%) |
| 45 to 54 Years | 1,426 (86.8%) | 217 (13.2%) |
| 55 to 64 Years | 1,726 (92.1%) | 147 (7.9%) |
| 65 to 74 Years | 1,979 (99.8%) | 4 (0.2%) |
| 75 Years and older | 852 (100.0%) | 0 (0.0%) |
| Total | 12,180 (92.4%) | 995 (7.5%) |
Health Insurance Coverage by Citizenship Status in Carpinteria
| Citizenship Status | With Coverage | Without Coverage |
| Native Born | 867 (98.8%) | 11 (1.3%) |
| Foreign Born, Citizen | 1,863 (97.5%) | 47 (2.5%) |
| Foreign Born, not a Citizen | 689 (77.3%) | 202 (22.7%) |
Health Insurance Coverage by Household Income in Carpinteria
| Household Income | With Coverage | Without Coverage |
| Under $25,000 | 711 (90.2%) | 77 (9.8%) |
| $25,000 to $49,999 | 1,244 (86.0%) | 202 (14.0%) |
| $50,000 to $74,999 | 914 (92.4%) | 75 (7.6%) |
| $75,000 to $99,999 | 1,686 (88.6%) | 217 (11.4%) |
| $100,000 and over | 7,591 (94.8%) | 419 (5.2%) |
Public vs Private Health Insurance Coverage by Age in Carpinteria
| Age Bracket | Public Insurance | Private Insurance |
| Under 6 | 210 (23.9%) | 667 (76.0%) |
| 6 to 18 Years | 453 (23.7%) | 1,535 (80.4%) |
| 19 to 25 Years | 87 (9.8%) | 602 (67.6%) |
| 25 to 34 Years | 51 (4.1%) | 1,054 (85.1%) |
| 35 to 44 Years | 128 (6.7%) | 1,578 (82.8%) |
| 45 to 54 Years | 227 (13.8%) | 1,225 (74.6%) |
| 55 to 64 Years | 297 (15.9%) | 1,468 (78.4%) |
| 65 to 74 Years | 1,917 (96.7%) | 1,145 (57.7%) |
| 75 Years and over | 852 (100.0%) | 646 (75.8%) |
| Total | 4,222 (32.1%) | 9,920 (75.3%) |
Disability Status by Sex by Age in Carpinteria
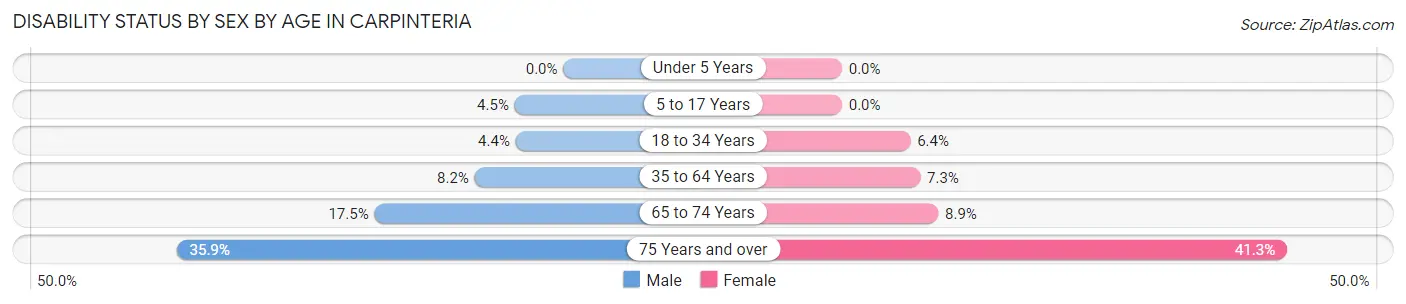
| Age Bracket | Male | Female |
| Under 5 Years | 0 (0.0%) | 0 (0.0%) |
| 5 to 17 Years | 42 (4.5%) | 0 (0.0%) |
| 18 to 34 Years | 56 (4.4%) | 66 (6.4%) |
| 35 to 64 Years | 213 (8.2%) | 206 (7.3%) |
| 65 to 74 Years | 173 (17.5%) | 89 (8.9%) |
| 75 Years and over | 159 (35.9%) | 169 (41.3%) |
Disability Class by Sex by Age in Carpinteria
Disability Class: Hearing Difficulty
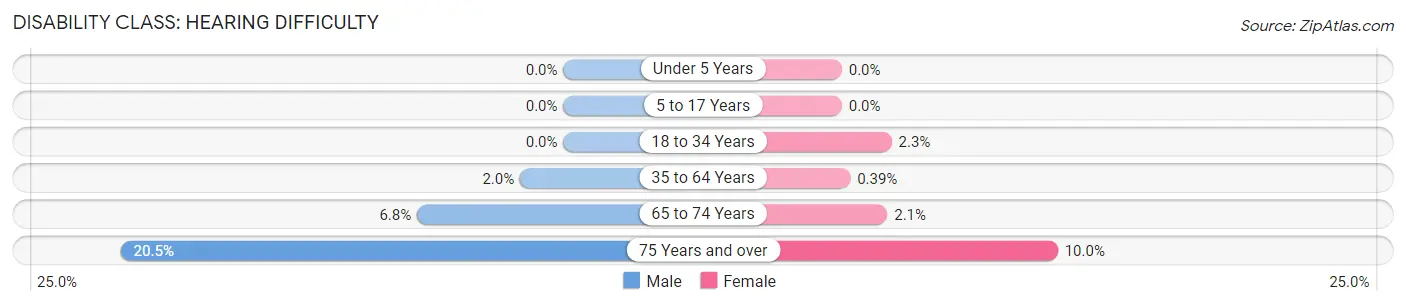
| Age Bracket | Male | Female |
| Under 5 Years | 0 (0.0%) | 0 (0.0%) |
| 5 to 17 Years | 0 (0.0%) | 0 (0.0%) |
| 18 to 34 Years | 0 (0.0%) | 24 (2.3%) |
| 35 to 64 Years | 52 (2.0%) | 11 (0.4%) |
| 65 to 74 Years | 67 (6.8%) | 21 (2.1%) |
| 75 Years and over | 91 (20.5%) | 41 (10.0%) |
Disability Class: Vision Difficulty
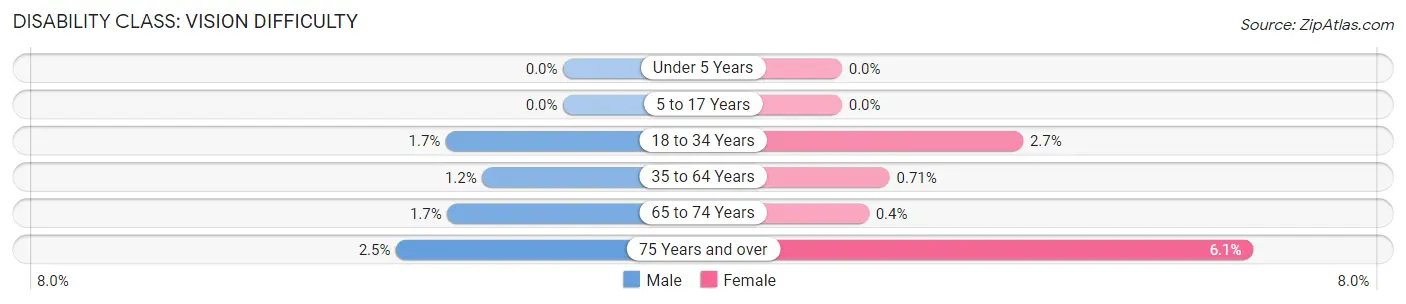
| Age Bracket | Male | Female |
| Under 5 Years | 0 (0.0%) | 0 (0.0%) |
| 5 to 17 Years | 0 (0.0%) | 0 (0.0%) |
| 18 to 34 Years | 22 (1.7%) | 28 (2.7%) |
| 35 to 64 Years | 31 (1.2%) | 20 (0.7%) |
| 65 to 74 Years | 17 (1.7%) | 4 (0.4%) |
| 75 Years and over | 11 (2.5%) | 25 (6.1%) |
Disability Class: Cognitive Difficulty
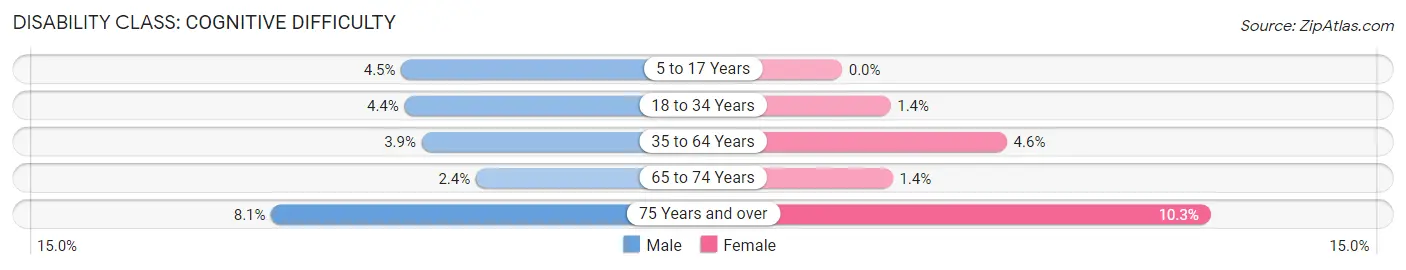
| Age Bracket | Male | Female |
| 5 to 17 Years | 42 (4.5%) | 0 (0.0%) |
| 18 to 34 Years | 56 (4.4%) | 14 (1.3%) |
| 35 to 64 Years | 102 (3.9%) | 130 (4.6%) |
| 65 to 74 Years | 24 (2.4%) | 14 (1.4%) |
| 75 Years and over | 36 (8.1%) | 42 (10.3%) |
Disability Class: Ambulatory Difficulty
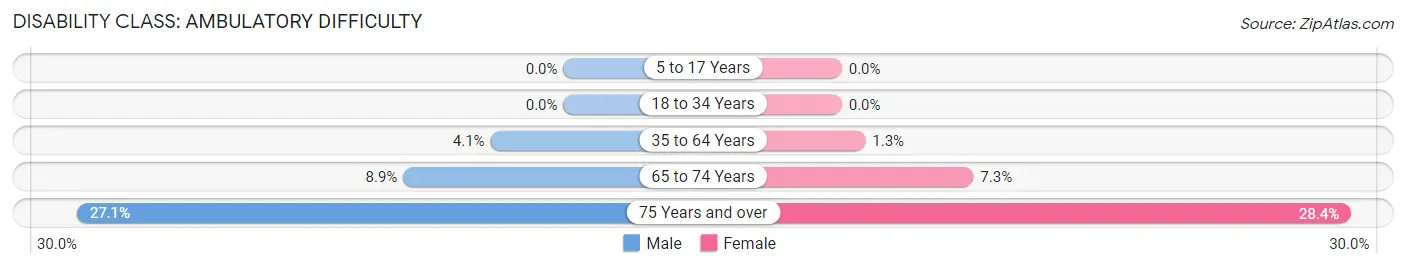
| Age Bracket | Male | Female |
| 5 to 17 Years | 0 (0.0%) | 0 (0.0%) |
| 18 to 34 Years | 0 (0.0%) | 0 (0.0%) |
| 35 to 64 Years | 105 (4.1%) | 37 (1.3%) |
| 65 to 74 Years | 88 (8.9%) | 73 (7.3%) |
| 75 Years and over | 120 (27.1%) | 116 (28.4%) |
Disability Class: Self-Care Difficulty
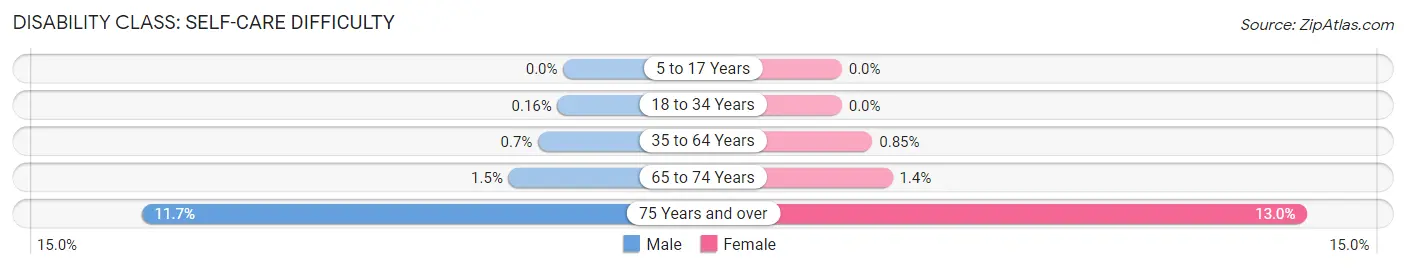
| Age Bracket | Male | Female |
| 5 to 17 Years | 0 (0.0%) | 0 (0.0%) |
| 18 to 34 Years | 2 (0.2%) | 0 (0.0%) |
| 35 to 64 Years | 18 (0.7%) | 24 (0.9%) |
| 65 to 74 Years | 15 (1.5%) | 14 (1.4%) |
| 75 Years and over | 52 (11.7%) | 53 (13.0%) |
Technology Access in Carpinteria
Computing Device Access in Carpinteria
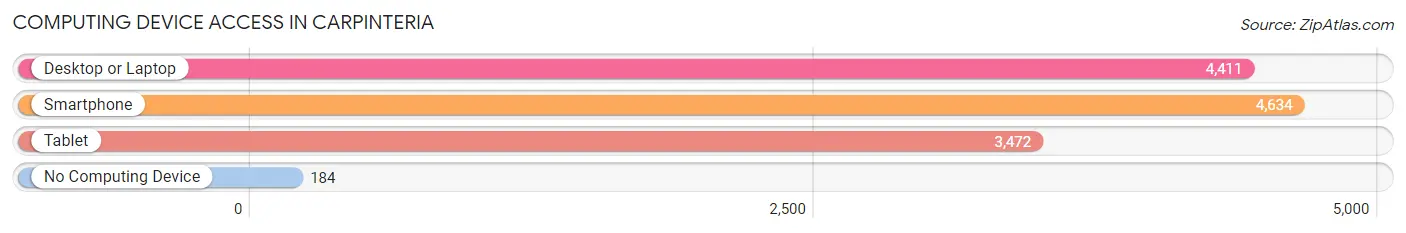
| Device Type | # Households | % Households |
| Desktop or Laptop | 4,411 | 86.9% |
| Smartphone | 4,634 | 91.2% |
| Tablet | 3,472 | 68.4% |
| No Computing Device | 184 | 3.6% |
| Total | 5,079 | 100.0% |
Internet Access in Carpinteria
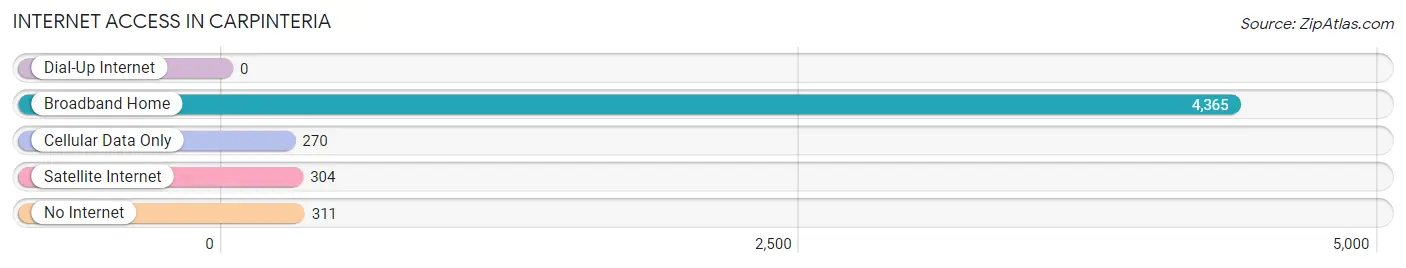
| Internet Type | # Households | % Households |
| Dial-Up Internet | 0 | 0.0% |
| Broadband Home | 4,365 | 85.9% |
| Cellular Data Only | 270 | 5.3% |
| Satellite Internet | 304 | 6.0% |
| No Internet | 311 | 6.1% |
| Total | 5,079 | 100.0% |
Carpinteria Summary
Carpinteria is a small coastal city located in Santa Barbara County, California. It is situated along the Pacific Ocean, just south of Santa Barbara and north of Ventura. The city is known for its beautiful beaches, lush landscapes, and small-town charm. Carpinteria is home to a population of approximately 13,000 people, and is a popular tourist destination for its many attractions and activities.
History
The area now known as Carpinteria was originally inhabited by the Chumash people, who lived in the area for thousands of years. The first European settlers arrived in the area in the late 1700s, and the town was officially founded in 1874. The town was named after the Chumash word for “carpentry”, as the area was known for its carpentry and furniture-making industry.
In the late 1800s, Carpinteria became a popular tourist destination, and the town’s economy began to grow. The town was home to several resorts, and the area’s beaches were a popular destination for visitors. In the early 1900s, the town’s economy shifted to agriculture, and the area became known for its production of avocados, lemons, and other fruits and vegetables.
Geography
Carpinteria is located in Santa Barbara County, California, along the Pacific Ocean. The city is situated between the cities of Santa Barbara and Ventura, and is bordered by the Santa Ynez Mountains to the east. The city covers an area of approximately 5.5 square miles, and has a population of approximately 13,000 people.
The city is known for its beautiful beaches, which are popular for swimming, surfing, and other water activities. The city is also home to several parks, including Carpinteria State Beach, Tar Pits Park, and Carpinteria Bluffs Nature Preserve.
Economy
Carpinteria’s economy is largely based on tourism and agriculture. The city is home to several resorts and hotels, which attract visitors from all over the world. The city is also known for its production of avocados, lemons, and other fruits and vegetables.
The city is also home to several businesses, including restaurants, retail stores, and other services. The city is also home to several manufacturing companies, which produce a variety of products, including furniture, electronics, and medical equipment.
Demographics
As of the 2010 census, the population of Carpinteria was 13,040. The population is largely white (83.3%), with smaller percentages of Hispanic (7.7%), Asian (3.3%), and African American (1.2%) residents. The median household income in the city is $68,845, and the median age is 44.
Carpinteria is a small, diverse city with a rich history and a vibrant economy. The city is known for its beautiful beaches, lush landscapes, and small-town charm. The city is home to a population of approximately 13,000 people, and is a popular tourist destination for its many attractions and activities.
Common Questions
What is Per Capita Income in Carpinteria?
Per Capita income in Carpinteria is $52,303.
What is the Median Family Income in Carpinteria?
Median Family Income in Carpinteria is $122,904.
What is the Median Household income in Carpinteria?
Median Household Income in Carpinteria is $103,879.
What is Income or Wage Gap in Carpinteria?
Income or Wage Gap in Carpinteria is 30.2%.
Women in Carpinteria earn 69.8 cents for every dollar earned by a man.
What is Inequality or Gini Index in Carpinteria?
Inequality or Gini Index in Carpinteria is 0.45.
What is the Total Population of Carpinteria?
Total Population of Carpinteria is 13,187.
What is the Total Male Population of Carpinteria?
Total Male Population of Carpinteria is 6,681.
What is the Total Female Population of Carpinteria?
Total Female Population of Carpinteria is 6,506.
What is the Ratio of Males per 100 Females in Carpinteria?
There are 102.69 Males per 100 Females in Carpinteria.
What is the Ratio of Females per 100 Males in Carpinteria?
There are 97.38 Females per 100 Males in Carpinteria.
What is the Median Population Age in Carpinteria?
Median Population Age in Carpinteria is 43.4 Years.
What is the Average Family Size in Carpinteria
Average Family Size in Carpinteria is 3.2 People.
What is the Average Household Size in Carpinteria
Average Household Size in Carpinteria is 2.6 People.
How Large is the Labor Force in Carpinteria?
There are 7,101 People in the Labor Forcein in Carpinteria.
What is the Percentage of People in the Labor Force in Carpinteria?
66.2% of People are in the Labor Force in Carpinteria.
What is the Unemployment Rate in Carpinteria?
Unemployment Rate in Carpinteria is 4.6%.