Cities with the Highest Percentage of Population Taking Public Transit to Work in Connecticut
RELATED REPORTS & OPTIONS
Public Transit
Connecticut
Compare Cities
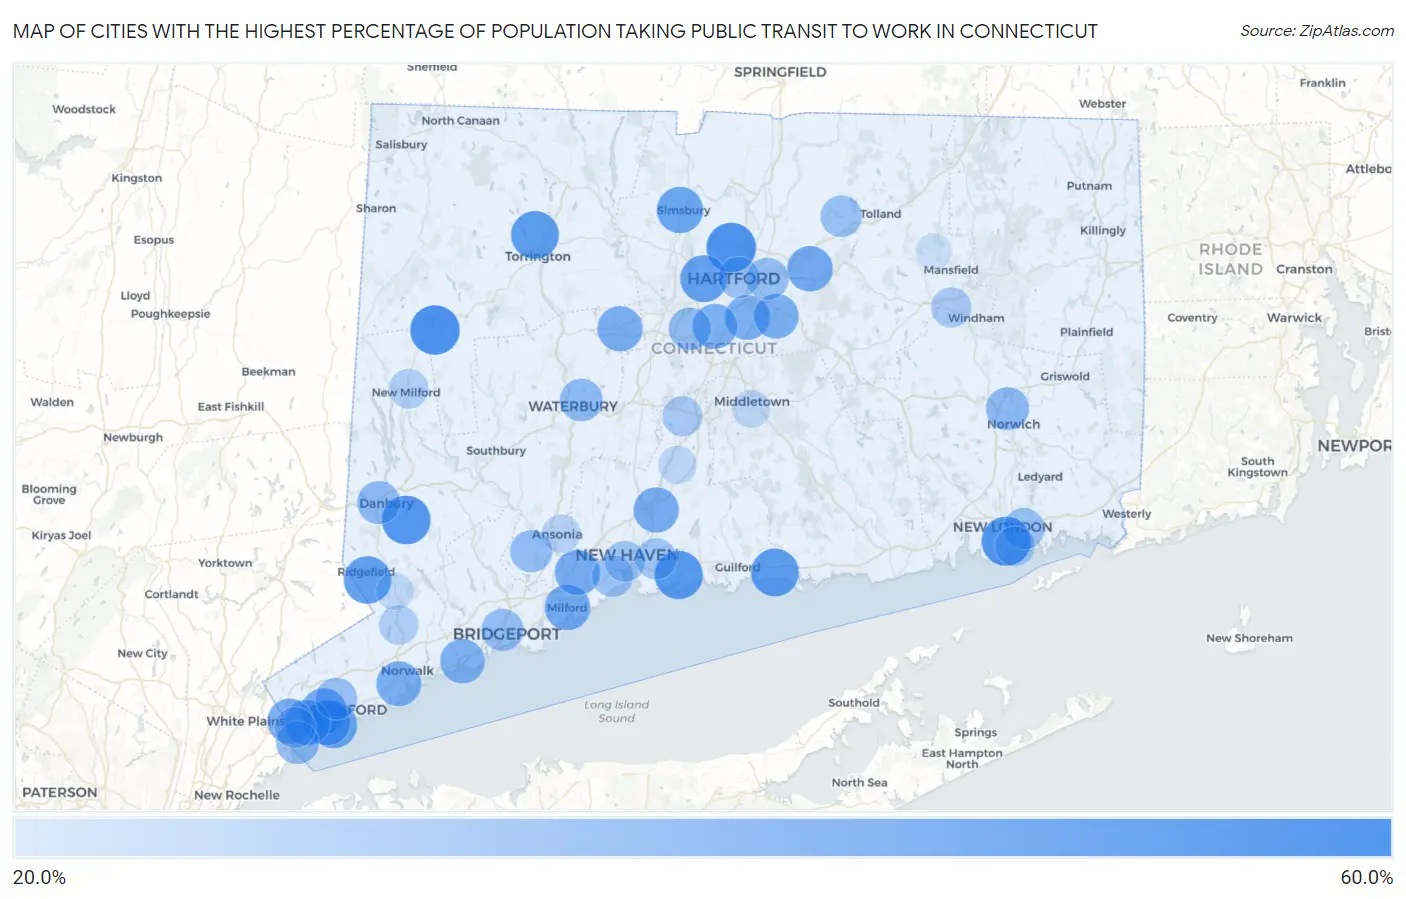
Map of Cities with the Highest Percentage of Population Taking Public Transit to Work in Connecticut
0.0%
60.0%
Cities with the Highest Percentage of Population Taking Public Transit to Work in Connecticut
| City | % Public Transit | vs State | vs National | |
| 1. | Blue Hills | 58.2% | 41.4%(+16.8)#1 | 38.5%(+19.7)#248 |
| 2. | New Preston | 58.1% | 41.4%(+16.7)#2 | 38.5%(+19.6)#258 |
| 3. | New London | 57.2% | 41.4%(+15.8)#3 | 38.5%(+18.7)#301 |
| 4. | Bethel | 55.6% | 41.4%(+14.2)#4 | 38.5%(+17.1)#402 |
| 5. | Branford Center | 54.6% | 41.4%(+13.2)#5 | 38.5%(+16.1)#471 |
| 6. | Greens Farms | 54.0% | 41.4%(+12.6)#6 | 38.5%(+15.5)#524 |
| 7. | Coleytown | 53.9% | 41.4%(+12.5)#7 | 38.5%(+15.4)#530 |
| 8. | Poplar Plains | 53.4% | 41.4%(+12.0)#8 | 38.5%(+14.9)#575 |
| 9. | Lordship | 53.3% | 41.4%(+11.9)#9 | 38.5%(+14.8)#584 |
| 10. | Torrington | 53.2% | 41.4%(+11.8)#10 | 38.5%(+14.7)#587 |
| 11. | Madison Center | 53.2% | 41.4%(+11.8)#11 | 38.5%(+14.7)#596 |
| 12. | Darien Downtown | 53.0% | 41.4%(+11.6)#12 | 38.5%(+14.5)#613 |
| 13. | Ridgefield | 52.0% | 41.4%(+10.6)#13 | 38.5%(+13.5)#691 |
| 14. | Trumbull Center | 50.9% | 41.4%(+9.50)#14 | 38.5%(+12.4)#787 |
| 15. | West Hartford | 50.5% | 41.4%(+9.10)#15 | 38.5%(+12.0)#819 |
| 16. | Woodmont Borough | 50.3% | 41.4%(+8.90)#16 | 38.5%(+11.8)#855 |
| 17. | Saugatuck | 50.2% | 41.4%(+8.80)#17 | 38.5%(+11.7)#875 |
| 18. | Murray | 49.7% | 41.4%(+8.30)#18 | 38.5%(+11.2)#923 |
| 19. | Old Greenwich | 49.5% | 41.4%(+8.10)#19 | 38.5%(+11.0)#961 |
| 20. | Ridgebury | 49.0% | 41.4%(+7.60)#20 | 38.5%(+10.5)#1,054 |
| 21. | Westport | 48.8% | 41.4%(+7.40)#21 | 38.5%(+10.3)#1,067 |
| 22. | Sandy Hook | 48.7% | 41.4%(+7.30)#22 | 38.5%(+10.2)#1,080 |
| 23. | Lakes East | 48.7% | 41.4%(+7.30)#23 | 38.5%(+10.2)#1,083 |
| 24. | Simsbury Center | 48.6% | 41.4%(+7.20)#24 | 38.5%(+10.1)#1,094 |
| 25. | Old Hill | 47.9% | 41.4%(+6.50)#25 | 38.5%(+9.40)#1,194 |
| 26. | Tokeneke | 47.5% | 41.4%(+6.10)#26 | 38.5%(+9.00)#1,263 |
| 27. | Compo | 47.2% | 41.4%(+5.80)#27 | 38.5%(+8.70)#1,319 |
| 28. | Cos Cob | 47.1% | 41.4%(+5.70)#28 | 38.5%(+8.60)#1,334 |
| 29. | Riverside | 46.8% | 41.4%(+5.40)#29 | 38.5%(+8.30)#1,374 |
| 30. | Greenwich | 46.7% | 41.4%(+5.30)#30 | 38.5%(+8.20)#1,385 |
| 31. | Staples | 46.7% | 41.4%(+5.30)#31 | 38.5%(+8.20)#1,390 |
| 32. | Manchester | 46.5% | 41.4%(+5.10)#32 | 38.5%(+8.00)#1,412 |
| 33. | South Wilton | 46.2% | 41.4%(+4.80)#33 | 38.5%(+7.70)#1,480 |
| 34. | Milford City Balance | 46.1% | 41.4%(+4.70)#34 | 38.5%(+7.60)#1,483 |
| 35. | Noroton Heights | 46.1% | 41.4%(+4.70)#35 | 38.5%(+7.60)#1,497 |
| 36. | North Haven | 45.3% | 41.4%(+3.90)#36 | 38.5%(+6.80)#1,611 |
| 37. | Orange | 45.3% | 41.4%(+3.90)#37 | 38.5%(+6.80)#1,614 |
| 38. | Glenville | 45.2% | 41.4%(+3.80)#38 | 38.5%(+6.70)#1,639 |
| 39. | Bristol | 45.0% | 41.4%(+3.60)#39 | 38.5%(+6.50)#1,663 |
| 40. | Wethersfield | 44.3% | 41.4%(+2.90)#40 | 38.5%(+5.80)#1,775 |
| 41. | Norwalk | 44.2% | 41.4%(+2.80)#41 | 38.5%(+5.70)#1,793 |
| 42. | Newington | 44.1% | 41.4%(+2.70)#42 | 38.5%(+5.60)#1,820 |
| 43. | Glastonbury Center | 44.1% | 41.4%(+2.70)#43 | 38.5%(+5.60)#1,828 |
| 44. | Noroton | 43.3% | 41.4%(+1.90)#44 | 38.5%(+4.80)#1,956 |
| 45. | Southport | 43.2% | 41.4%(+1.80)#45 | 38.5%(+4.70)#1,979 |
| 46. | Daniels Farm | 42.7% | 41.4%(+1.30)#46 | 38.5%(+4.20)#2,081 |
| 47. | New Canaan | 40.1% | 41.4%(-1.30)#47 | 38.5%(+1.60)#2,526 |
| 48. | Norwich | 38.8% | 41.4%(-2.60)#48 | 38.5%(+0.300)#2,737 |
| 49. | Danbury | 38.3% | 41.4%(-3.10)#49 | 38.5%(-0.200)#2,830 |
| 50. | Byram | 38.3% | 41.4%(-3.10)#50 | 38.5%(-0.200)#2,838 |
| 51. | Waterbury | 37.7% | 41.4%(-3.70)#51 | 38.5%(-0.800)#2,900 |
| 52. | New Britain | 37.0% | 41.4%(-4.40)#52 | 38.5%(-1.50)#3,002 |
| 53. | Shelton | 36.3% | 41.4%(-5.10)#53 | 38.5%(-2.20)#3,125 |
| 54. | East Hartford | 36.2% | 41.4%(-5.20)#54 | 38.5%(-2.30)#3,137 |
| 55. | Bridgeport | 35.8% | 41.4%(-5.60)#55 | 38.5%(-2.70)#3,180 |
| 56. | Stamford | 35.3% | 41.4%(-6.10)#56 | 38.5%(-3.20)#3,263 |
| 57. | West Cornwall | 34.8% | 41.4%(-6.60)#57 | 38.5%(-3.70)#3,356 |
| 58. | Hartford | 34.5% | 41.4%(-6.90)#58 | 38.5%(-4.00)#3,387 |
| 59. | Long Hill | 34.5% | 41.4%(-6.90)#59 | 38.5%(-4.00)#3,399 |
| 60. | Rockville | 34.4% | 41.4%(-7.00)#60 | 38.5%(-4.10)#3,417 |
| 61. | West Haven | 33.9% | 41.4%(-7.50)#61 | 38.5%(-4.60)#3,462 |
| 62. | Mill Plain | 33.8% | 41.4%(-7.60)#62 | 38.5%(-4.70)#3,484 |
| 63. | East Haven | 33.1% | 41.4%(-8.30)#63 | 38.5%(-5.40)#3,562 |
| 64. | Pemberwick | 32.8% | 41.4%(-8.60)#64 | 38.5%(-5.70)#3,595 |
| 65. | Stratford Downtown | 32.3% | 41.4%(-9.10)#65 | 38.5%(-6.20)#3,661 |
| 66. | New Haven | 32.2% | 41.4%(-9.20)#66 | 38.5%(-6.30)#3,663 |
| 67. | Willimantic | 30.3% | 41.4%(-11.1)#67 | 38.5%(-8.20)#3,845 |
| 68. | Meriden | 30.2% | 41.4%(-11.2)#68 | 38.5%(-8.30)#3,851 |
| 69. | Groton | 29.7% | 41.4%(-11.7)#69 | 38.5%(-8.80)#3,910 |
| 70. | New Milford | 28.6% | 41.4%(-12.8)#70 | 38.5%(-9.90)#4,015 |
| 71. | Wilton Center | 28.6% | 41.4%(-12.8)#71 | 38.5%(-9.90)#4,016 |
| 72. | Ansonia | 25.5% | 41.4%(-15.9)#72 | 38.5%(-13.0)#4,221 |
| 73. | Wallingford Center | 24.8% | 41.4%(-16.6)#73 | 38.5%(-13.7)#4,258 |
| 74. | Middletown | 23.8% | 41.4%(-17.6)#74 | 38.5%(-14.7)#4,313 |
| 75. | Naugatuck Borough | 23.6% | 41.4%(-17.8)#75 | 38.5%(-14.9)#4,329 |
| 76. | Georgetown | 23.0% | 41.4%(-18.4)#76 | 38.5%(-15.5)#4,363 |
| 77. | Quinnipiac University | 20.5% | 41.4%(-20.9)#77 | 38.5%(-18.0)#4,485 |
| 78. | Storrs | 20.1% | 41.4%(-21.3)#78 | 38.5%(-18.4)#4,491 |
Common Questions
What are the Top 10 Cities with the Highest Percentage of Population Taking Public Transit to Work in Connecticut?
Top 10 Cities with the Highest Percentage of Population Taking Public Transit to Work in Connecticut are:
#1
58.2%
#2
58.1%
#3
57.2%
#4
55.6%
#5
54.6%
#6
53.2%
#7
53.2%
#8
52.0%
#9
50.5%
#10
49.5%
What city has the Highest Percentage of Population Taking Public Transit to Work in Connecticut?
Blue Hills has the Highest Percentage of Population Taking Public Transit to Work in Connecticut with 58.2%.
What is the Percentage of Population Taking Public Transit to Work in the State of Connecticut?
Percentage of Population Taking Public Transit to Work in Connecticut is 41.4%.
What is the Percentage of Population Taking Public Transit to Work in the United States?
Percentage of Population Taking Public Transit to Work in the United States is 38.5%.