Cities with the Highest Percentage of Population Taking Public Transit to Work in the United States
RELATED REPORTS & OPTIONS
Public Transit
United States
Compare Cities
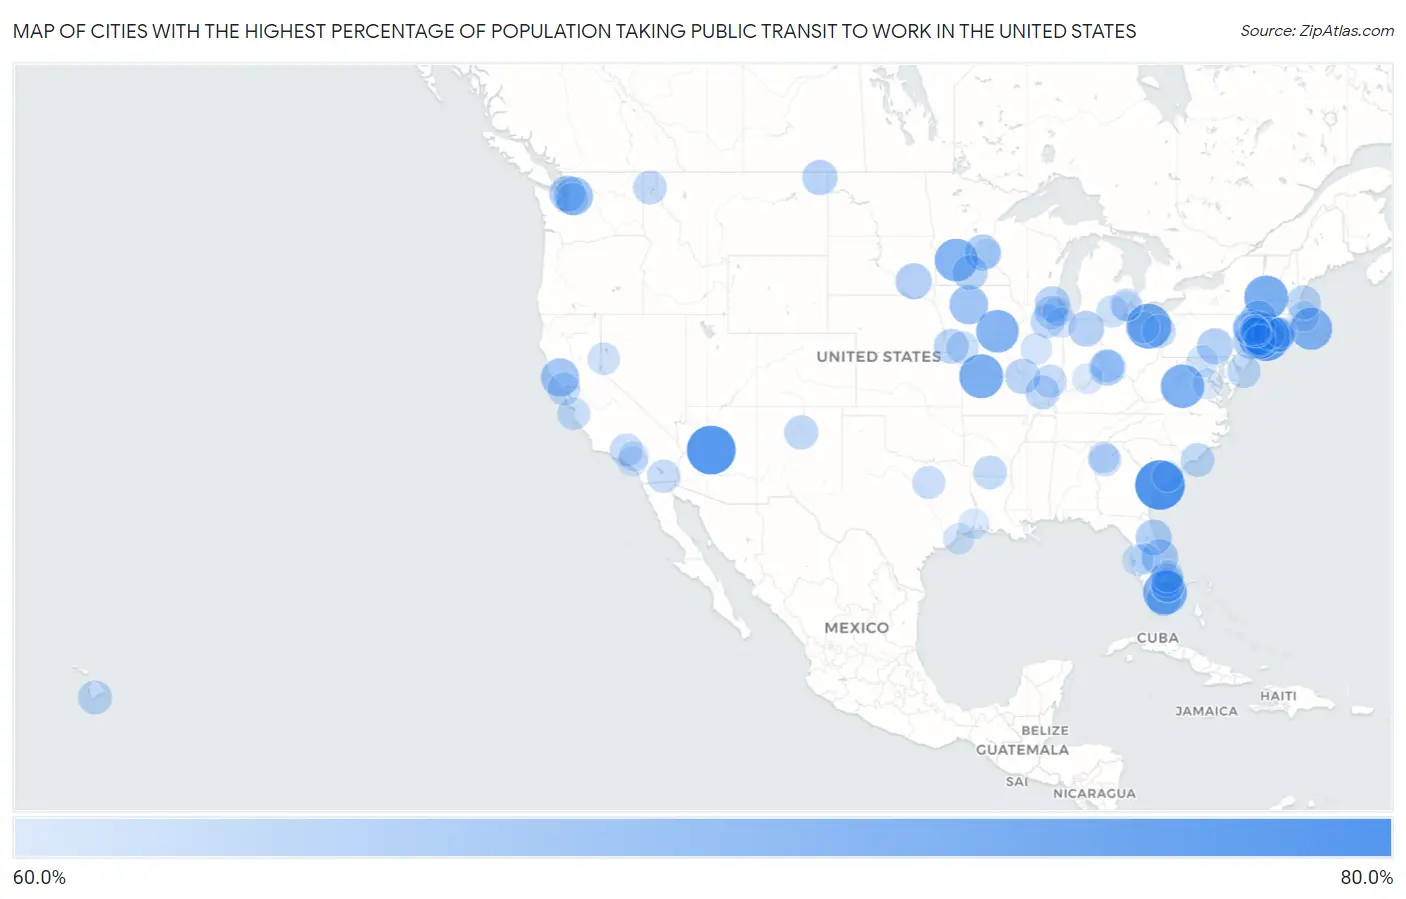
Map of Cities with the Highest Percentage of Population Taking Public Transit to Work in the United States
0.0%
80.0%
Cities with the Highest Percentage of Population Taking Public Transit to Work in the United States
| City | % Public Transit | vs State | vs National | |
| 1. | Beaufort | 79.2% | 40.3%(+38.9)#1 | 38.5%(+40.7)#1 |
| 2. | Dewey Humboldt | 78.5% | 37.1%(+41.4)#1 | 38.5%(+40.0)#2 |
| 3. | North Great River | 77.0% | 39.6%(+37.4)#1 | 38.5%(+38.5)#3 |
| 4. | Solon | 75.1% | 36.7%(+38.4)#1 | 38.5%(+36.6)#4 |
| 5. | Sedalia | 74.2% | 35.4%(+38.8)#1 | 38.5%(+35.7)#5 |
| 6. | Bennington | 74.2% | 32.6%(+41.6)#1 | 38.5%(+35.7)#6 |
| 7. | Miami Lakes | 74.0% | 41.3%(+32.7)#1 | 38.5%(+35.5)#7 |
| 8. | Staunton | 73.6% | 39.9%(+33.7)#1 | 38.5%(+35.1)#8 |
| 9. | Roslyn | 73.3% | 39.6%(+33.7)#2 | 38.5%(+34.8)#9 |
| 10. | Olivia | 73.1% | 35.8%(+37.3)#1 | 38.5%(+34.6)#10 |
| 11. | Packwood | 72.9% | 30.7%(+42.2)#1 | 38.5%(+34.4)#11 |
| 12. | Nantucket | 72.5% | 35.9%(+36.6)#1 | 38.5%(+34.0)#12 |
| 13. | Setauket | 70.2% | 39.6%(+30.6)#3 | 38.5%(+31.7)#13 |
| 14. | Fort Dodge | 69.6% | 30.7%(+38.9)#2 | 38.5%(+31.1)#14 |
| 15. | North Lakes | 69.4% | 37.6%(+31.8)#1 | 38.5%(+30.9)#15 |
| 16. | Woods Creek | 69.4% | 35.2%(+34.2)#1 | 38.5%(+30.9)#16 |
| 17. | Healdsburg | 69.1% | 38.0%(+31.1)#1 | 38.5%(+30.6)#17 |
| 18. | White | 68.4% | 31.6%(+36.8)#1 | 38.5%(+29.9)#18 |
| 19. | Melbourne Village | 67.6% | 41.3%(+26.3)#2 | 38.5%(+29.1)#19 |
| 20. | Walton Park | 67.5% | 39.6%(+27.9)#4 | 38.5%(+29.0)#20 |
| 21. | Millbrook | 67.5% | 39.6%(+27.9)#5 | 38.5%(+29.0)#21 |
| 22. | Silverton | 67.4% | 36.7%(+30.7)#2 | 38.5%(+28.9)#22 |
| 23. | Sewaren | 67.4% | 40.9%(+26.5)#1 | 38.5%(+28.9)#23 |
| 24. | Mitchell | 67.3% | 36.3%(+31.0)#1 | 38.5%(+28.8)#24 |
| 25. | Clinton | 67.3% | 35.2%(+32.1)#2 | 38.5%(+28.8)#25 |
| 26. | Ormond Beach | 67.2% | 41.3%(+25.9)#3 | 38.5%(+28.7)#26 |
| 27. | Berwick Borough | 67.2% | 37.1%(+30.1)#1 | 38.5%(+28.7)#27 |
| 28. | Lexington | 67.2% | 35.8%(+31.4)#2 | 38.5%(+28.7)#28 |
| 29. | Colonial Park | 67.1% | 37.1%(+30.0)#2 | 38.5%(+28.6)#29 |
| 30. | Warsaw | 66.9% | 36.2%(+30.7)#1 | 38.5%(+28.4)#30 |
| 31. | Shinnecock Hills | 66.5% | 39.6%(+26.9)#6 | 38.5%(+28.0)#31 |
| 32. | Plentywood | 66.5% | 39.4%(+27.1)#1 | 38.5%(+28.0)#32 |
| 33. | Skyline | 66.5% | 35.8%(+30.7)#3 | 38.5%(+28.0)#33 |
| 34. | Twin Lakes | 66.3% | 33.2%(+33.1)#1 | 38.5%(+27.8)#34 |
| 35. | Lido Beach | 66.3% | 39.6%(+26.7)#7 | 38.5%(+27.8)#35 |
| 36. | Sycamore Hills | 66.3% | 35.4%(+30.9)#2 | 38.5%(+27.8)#36 |
| 37. | Fairfax | 66.2% | 35.4%(+30.8)#3 | 38.5%(+27.7)#37 |
| 38. | Naranja | 66.1% | 41.3%(+24.8)#4 | 38.5%(+27.6)#38 |
| 39. | Rockport | 65.7% | 35.9%(+29.8)#2 | 38.5%(+27.2)#39 |
| 40. | Eldorado At Santa Fe | 65.6% | 42.8%(+22.8)#1 | 38.5%(+27.1)#40 |
| 41. | Mohnton Borough | 65.5% | 37.1%(+28.4)#3 | 38.5%(+27.0)#41 |
| 42. | Naalehu | 65.5% | 42.7%(+22.8)#1 | 38.5%(+27.0)#42 |
| 43. | Johnston City | 65.4% | 36.8%(+28.6)#1 | 38.5%(+26.9)#43 |
| 44. | Boca Raton | 65.3% | 41.3%(+24.0)#5 | 38.5%(+26.8)#44 |
| 45. | Royal Palm Beach | 65.3% | 41.3%(+24.0)#6 | 38.5%(+26.8)#45 |
| 46. | Sandwich | 65.3% | 36.8%(+28.5)#2 | 38.5%(+26.8)#46 |
| 47. | Southport | 65.3% | 37.1%(+28.2)#1 | 38.5%(+26.8)#47 |
| 48. | Ponderay | 65.3% | 44.4%(+20.9)#1 | 38.5%(+26.8)#48 |
| 49. | El Dorado | 65.2% | 39.3%(+25.9)#1 | 38.5%(+26.7)#49 |
| 50. | Carpentersville | 65.1% | 36.8%(+28.3)#3 | 38.5%(+26.6)#50 |
| 51. | Warwick | 65.1% | 39.6%(+25.5)#8 | 38.5%(+26.6)#51 |
| 52. | North Sea | 65.1% | 39.6%(+25.5)#9 | 38.5%(+26.6)#52 |
| 53. | Wildwood | 65.0% | 40.9%(+24.1)#2 | 38.5%(+26.5)#53 |
| 54. | Austintown | 64.9% | 36.7%(+28.2)#3 | 38.5%(+26.4)#54 |
| 55. | Brawley | 64.9% | 38.0%(+26.9)#2 | 38.5%(+26.4)#55 |
| 56. | Fairfield | 64.8% | 36.8%(+28.0)#4 | 38.5%(+26.3)#56 |
| 57. | Hewlett Harbor | 64.7% | 39.6%(+25.1)#10 | 38.5%(+26.2)#57 |
| 58. | Collegeville Borough | 64.6% | 37.1%(+27.5)#4 | 38.5%(+26.1)#58 |
| 59. | Woodacre | 64.6% | 38.0%(+26.6)#3 | 38.5%(+26.1)#59 |
| 60. | Duncanville | 64.5% | 38.9%(+25.6)#1 | 38.5%(+26.0)#60 |
| 61. | Pacific Grove | 64.5% | 38.0%(+26.5)#4 | 38.5%(+26.0)#61 |
| 62. | Acton | 64.5% | 38.0%(+26.5)#5 | 38.5%(+26.0)#62 |
| 63. | Kenwood | 64.4% | 36.7%(+27.7)#4 | 38.5%(+25.9)#63 |
| 64. | Heritage Hills | 64.4% | 39.6%(+24.8)#11 | 38.5%(+25.9)#64 |
| 65. | Coconut Creek | 64.3% | 41.3%(+23.0)#7 | 38.5%(+25.8)#65 |
| 66. | Hazel Park | 64.3% | 34.1%(+30.2)#1 | 38.5%(+25.8)#66 |
| 67. | Fair Oaks | 64.2% | 37.6%(+26.6)#1 | 38.5%(+25.7)#67 |
| 68. | Duvall | 64.2% | 35.2%(+29.0)#3 | 38.5%(+25.7)#68 |
| 69. | Belle Terre | 64.2% | 39.6%(+24.6)#12 | 38.5%(+25.7)#69 |
| 70. | Sun Valley | 64.1% | 39.1%(+25.0)#1 | 38.5%(+25.6)#70 |
| 71. | Stanberry | 64.1% | 35.4%(+28.7)#4 | 38.5%(+25.6)#71 |
| 72. | Jupiter | 64.0% | 41.3%(+22.7)#8 | 38.5%(+25.5)#72 |
| 73. | Latrobe Borough | 64.0% | 37.1%(+26.9)#5 | 38.5%(+25.5)#73 |
| 74. | Manchester | 63.9% | 34.1%(+29.8)#2 | 38.5%(+25.4)#74 |
| 75. | Strongsville | 63.5% | 36.7%(+26.8)#5 | 38.5%(+25.0)#75 |
| 76. | Islamorada | 63.5% | 41.3%(+22.2)#9 | 38.5%(+25.0)#76 |
| 77. | West Nyack | 63.5% | 39.6%(+23.9)#13 | 38.5%(+25.0)#77 |
| 78. | Keedysville | 63.5% | 40.9%(+22.6)#1 | 38.5%(+25.0)#78 |
| 79. | Brandon | 63.4% | 41.3%(+22.1)#10 | 38.5%(+24.9)#79 |
| 80. | Lincoln | 63.4% | 36.8%(+26.6)#5 | 38.5%(+24.9)#80 |
| 81. | Acworth | 63.3% | 37.6%(+25.7)#2 | 38.5%(+24.8)#81 |
| 82. | Lincolnville | 63.2% | 40.3%(+22.9)#2 | 38.5%(+24.7)#82 |
| 83. | Galveston | 63.1% | 38.9%(+24.2)#2 | 38.5%(+24.6)#83 |
| 84. | Winter Haven | 63.1% | 41.3%(+21.8)#11 | 38.5%(+24.6)#84 |
| 85. | The Pinehills | 63.1% | 35.9%(+27.2)#3 | 38.5%(+24.6)#85 |
| 86. | Henryville | 62.8% | 36.2%(+26.6)#2 | 38.5%(+24.3)#86 |
| 87. | Passapatanzy | 62.8% | 39.9%(+22.9)#2 | 38.5%(+24.3)#87 |
| 88. | Ingram Borough | 62.7% | 37.1%(+25.6)#6 | 38.5%(+24.2)#88 |
| 89. | Springs | 62.6% | 39.6%(+23.0)#14 | 38.5%(+24.1)#89 |
| 90. | East Hazel Crest | 62.6% | 36.8%(+25.8)#6 | 38.5%(+24.1)#90 |
| 91. | Yorba Linda | 62.5% | 38.0%(+24.5)#6 | 38.5%(+24.0)#91 |
| 92. | Orange | 62.5% | 38.9%(+23.6)#3 | 38.5%(+24.0)#92 |
| 93. | San Antonio Heights | 62.5% | 38.0%(+24.5)#7 | 38.5%(+24.0)#93 |
| 94. | Spring Grove Borough | 62.4% | 37.1%(+25.3)#7 | 38.5%(+23.9)#94 |
| 95. | Bannockburn | 62.4% | 36.8%(+25.6)#7 | 38.5%(+23.9)#95 |
| 96. | Highland Park | 62.3% | 34.1%(+28.2)#3 | 38.5%(+23.8)#96 |
| 97. | Thiells | 62.3% | 39.6%(+22.7)#15 | 38.5%(+23.8)#97 |
| 98. | Grant | 62.3% | 35.8%(+26.5)#4 | 38.5%(+23.8)#98 |
| 99. | North Lynbrook | 62.3% | 39.6%(+22.7)#16 | 38.5%(+23.8)#99 |
| 100. | Grand View On Hudson | 62.3% | 39.6%(+22.7)#17 | 38.5%(+23.8)#100 |
Common Questions
What are the Top 10 Cities with the Highest Percentage of Population Taking Public Transit to Work in the United States?
Top 10 Cities with the Highest Percentage of Population Taking Public Transit to Work in the United States are:
#1
79.2%
#2
78.5%
#3
77.0%
#4
75.1%
#5
74.2%
#6
74.2%
#7
74.0%
#8
73.6%
#9
73.3%
#10
73.1%
What city has the Highest Percentage of Population Taking Public Transit to Work in the United States?
Beaufort has the Highest Percentage of Population Taking Public Transit to Work in the United States with 79.2%.
What is the Percentage of Population Taking Public Transit to Work in the United States?
Percentage of Population Taking Public Transit to Work in the United States is 38.5%.