Cities with the Highest Percentage of Population Taking Public Transit to Work in Virginia
RELATED REPORTS & OPTIONS
Public Transit
Virginia
Compare Cities
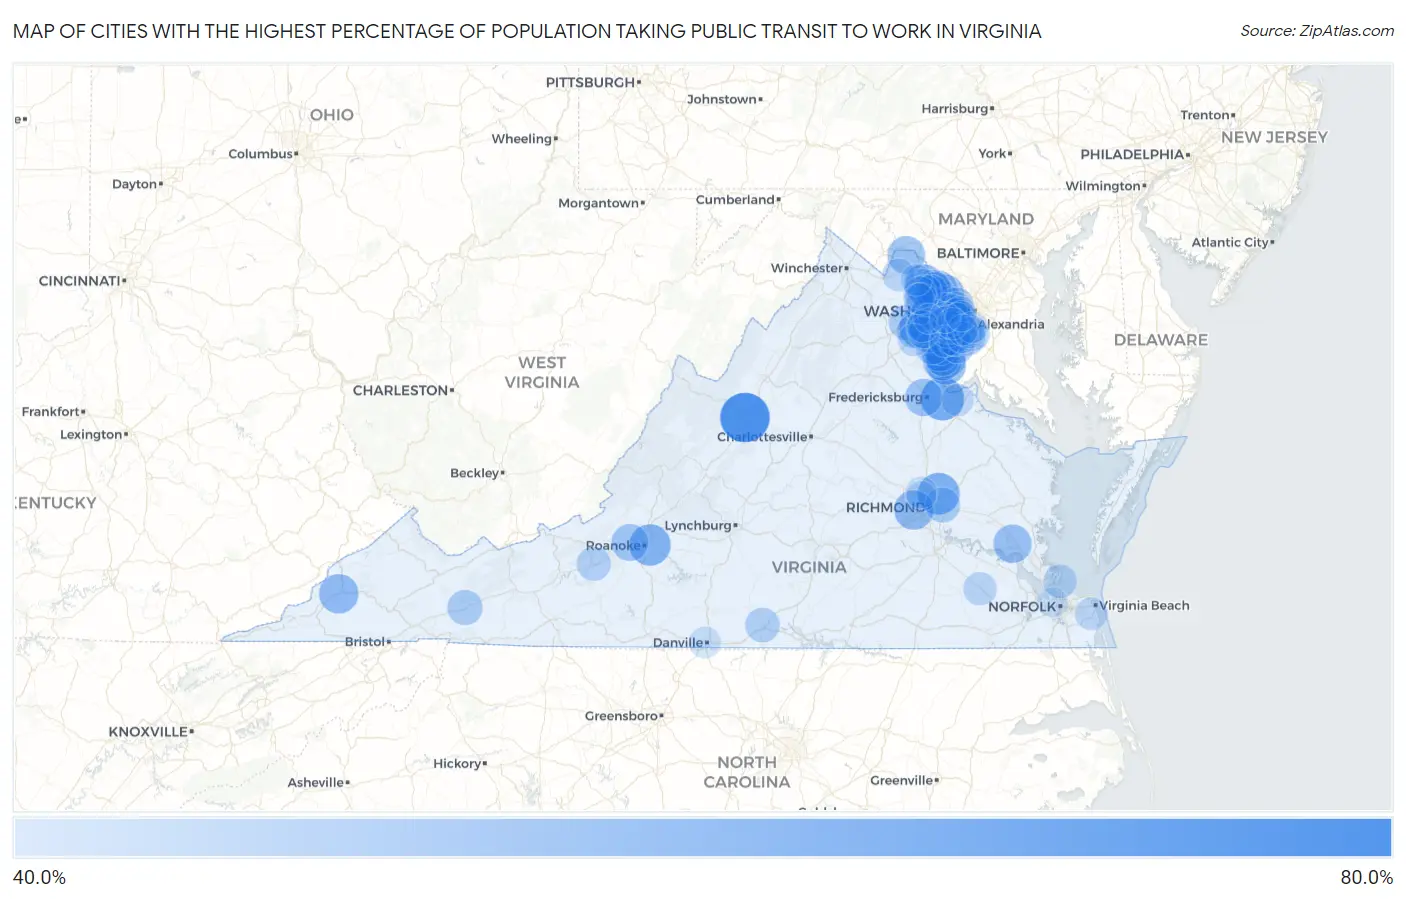
Map of Cities with the Highest Percentage of Population Taking Public Transit to Work in Virginia
0.0%
80.0%
Cities with the Highest Percentage of Population Taking Public Transit to Work in Virginia
| City | % Public Transit | vs State | vs National | |
| 1. | Staunton | 73.6% | 39.9%(+33.7)#1 | 38.5%(+35.1)#8 |
| 2. | Passapatanzy | 62.8% | 39.9%(+22.9)#2 | 38.5%(+24.3)#87 |
| 3. | Mechanicsville | 60.4% | 39.9%(+20.5)#3 | 38.5%(+21.9)#153 |
| 4. | Bull Run | 59.7% | 39.9%(+19.8)#4 | 38.5%(+21.2)#174 |
| 5. | Vinton | 59.7% | 39.9%(+19.8)#5 | 38.5%(+21.2)#176 |
| 6. | Hutchison | 58.3% | 39.9%(+18.4)#6 | 38.5%(+19.8)#229 |
| 7. | Fairfax Station | 57.5% | 39.9%(+17.6)#7 | 38.5%(+19.0)#280 |
| 8. | Franklin Farm | 56.4% | 39.9%(+16.5)#8 | 38.5%(+17.9)#345 |
| 9. | Bon Air | 56.4% | 39.9%(+16.5)#9 | 38.5%(+17.9)#346 |
| 10. | Quantico | 56.3% | 39.9%(+16.4)#10 | 38.5%(+17.8)#363 |
| 11. | Norton | 56.2% | 39.9%(+16.3)#11 | 38.5%(+17.7)#370 |
| 12. | Cherry Hill | 55.7% | 39.9%(+15.8)#12 | 38.5%(+17.2)#397 |
| 13. | Lansdowne | 55.6% | 39.9%(+15.7)#13 | 38.5%(+17.1)#401 |
| 14. | Navy | 55.4% | 39.9%(+15.5)#14 | 38.5%(+16.9)#420 |
| 15. | Crosspointe | 55.3% | 39.9%(+15.4)#15 | 38.5%(+16.8)#427 |
| 16. | Triangle | 54.9% | 39.9%(+15.0)#16 | 38.5%(+16.4)#457 |
| 17. | Great Falls | 54.6% | 39.9%(+14.7)#17 | 38.5%(+16.1)#469 |
| 18. | Lowes Island | 54.3% | 39.9%(+14.4)#18 | 38.5%(+15.8)#500 |
| 19. | Mantua | 54.3% | 39.9%(+14.4)#19 | 38.5%(+15.8)#501 |
| 20. | Williamsburg | 54.2% | 39.9%(+14.3)#20 | 38.5%(+15.7)#506 |
| 21. | Lovettsville | 53.6% | 39.9%(+13.7)#21 | 38.5%(+15.1)#551 |
| 22. | Montclair | 53.3% | 39.9%(+13.4)#22 | 38.5%(+14.8)#577 |
| 23. | Dranesville | 53.3% | 39.9%(+13.4)#23 | 38.5%(+14.8)#580 |
| 24. | Union Mill | 53.1% | 39.9%(+13.2)#24 | 38.5%(+14.6)#605 |
| 25. | Fredericksburg | 53.0% | 39.9%(+13.1)#25 | 38.5%(+14.5)#609 |
| 26. | Salem | 52.2% | 39.9%(+12.3)#26 | 38.5%(+13.7)#667 |
| 27. | Yorkshire | 51.2% | 39.9%(+11.3)#27 | 38.5%(+12.7)#758 |
| 28. | One Loudoun | 51.2% | 39.9%(+11.3)#28 | 38.5%(+12.7)#762 |
| 29. | Mount Vernon | 50.2% | 39.9%(+10.3)#29 | 38.5%(+11.7)#868 |
| 30. | Braddock | 49.9% | 39.9%(+10.0)#30 | 38.5%(+11.4)#904 |
| 31. | George Mason | 49.7% | 39.9%(+9.80)#31 | 38.5%(+11.2)#918 |
| 32. | Wolf Trap | 49.6% | 39.9%(+9.70)#32 | 38.5%(+11.1)#934 |
| 33. | Dale City | 49.5% | 39.9%(+9.60)#33 | 38.5%(+11.0)#948 |
| 34. | Buckhall | 49.5% | 39.9%(+9.60)#34 | 38.5%(+11.0)#953 |
| 35. | Countryside | 49.5% | 39.9%(+9.60)#35 | 38.5%(+11.0)#959 |
| 36. | Belmont | 49.4% | 39.9%(+9.50)#36 | 38.5%(+10.9)#975 |
| 37. | Floris | 49.4% | 39.9%(+9.50)#37 | 38.5%(+10.9)#978 |
| 38. | Marion | 49.4% | 39.9%(+9.50)#38 | 38.5%(+10.9)#980 |
| 39. | Highland Springs | 49.2% | 39.9%(+9.30)#39 | 38.5%(+10.7)#1,010 |
| 40. | Newington | 49.2% | 39.9%(+9.30)#40 | 38.5%(+10.7)#1,012 |
| 41. | Haymarket | 49.2% | 39.9%(+9.30)#41 | 38.5%(+10.7)#1,017 |
| 42. | Mclean | 49.0% | 39.9%(+9.10)#42 | 38.5%(+10.5)#1,036 |
| 43. | South Boston | 48.3% | 39.9%(+8.40)#43 | 38.5%(+9.80)#1,142 |
| 44. | Burke Centre | 48.2% | 39.9%(+8.30)#44 | 38.5%(+9.70)#1,157 |
| 45. | Chantilly | 47.9% | 39.9%(+8.00)#45 | 38.5%(+9.40)#1,190 |
| 46. | Fort Hunt | 47.8% | 39.9%(+7.90)#46 | 38.5%(+9.30)#1,204 |
| 47. | Dumfries | 47.7% | 39.9%(+7.80)#47 | 38.5%(+9.20)#1,219 |
| 48. | Linton Hall | 47.6% | 39.9%(+7.70)#48 | 38.5%(+9.10)#1,225 |
| 49. | Christiansburg | 47.5% | 39.9%(+7.60)#49 | 38.5%(+9.00)#1,251 |
| 50. | Vienna | 47.5% | 39.9%(+7.60)#50 | 38.5%(+9.00)#1,254 |
| 51. | Mason Neck | 47.5% | 39.9%(+7.60)#51 | 38.5%(+9.00)#1,264 |
| 52. | Loch Lomond | 47.2% | 39.9%(+7.30)#52 | 38.5%(+8.70)#1,318 |
| 53. | Independent Hill | 47.1% | 39.9%(+7.20)#53 | 38.5%(+8.60)#1,330 |
| 54. | Oakton | 47.0% | 39.9%(+7.10)#54 | 38.5%(+8.50)#1,342 |
| 55. | Dunn Loring | 46.8% | 39.9%(+6.90)#55 | 38.5%(+8.30)#1,375 |
| 56. | Difficult Run | 46.6% | 39.9%(+6.70)#56 | 38.5%(+8.10)#1,401 |
| 57. | Pimmit Hills | 46.5% | 39.9%(+6.60)#57 | 38.5%(+8.00)#1,425 |
| 58. | Hampton | 46.4% | 39.9%(+6.50)#58 | 38.5%(+7.90)#1,432 |
| 59. | West Falls Church | 46.4% | 39.9%(+6.50)#59 | 38.5%(+7.90)#1,437 |
| 60. | South Riding | 46.2% | 39.9%(+6.30)#60 | 38.5%(+7.70)#1,466 |
| 61. | Laurel Hill | 46.2% | 39.9%(+6.30)#61 | 38.5%(+7.70)#1,476 |
| 62. | Wakefield | 46.2% | 39.9%(+6.30)#62 | 38.5%(+7.70)#1,481 |
| 63. | Burke | 46.1% | 39.9%(+6.20)#63 | 38.5%(+7.60)#1,486 |
| 64. | South Run | 46.1% | 39.9%(+6.20)#64 | 38.5%(+7.60)#1,493 |
| 65. | Cascades | 46.0% | 39.9%(+6.10)#65 | 38.5%(+7.50)#1,503 |
| 66. | Fair Lakes | 45.6% | 39.9%(+5.70)#66 | 38.5%(+7.10)#1,555 |
| 67. | Purcellville | 45.4% | 39.9%(+5.50)#67 | 38.5%(+6.90)#1,600 |
| 68. | Dulles Town Center | 45.4% | 39.9%(+5.50)#68 | 38.5%(+6.90)#1,603 |
| 69. | Ashburn | 45.1% | 39.9%(+5.20)#69 | 38.5%(+6.60)#1,643 |
| 70. | Virginia Beach | 45.0% | 39.9%(+5.10)#70 | 38.5%(+6.50)#1,661 |
| 71. | Falls Church | 44.8% | 39.9%(+4.90)#71 | 38.5%(+6.30)#1,694 |
| 72. | King George | 44.7% | 39.9%(+4.80)#72 | 38.5%(+6.20)#1,713 |
| 73. | West Springfield | 44.6% | 39.9%(+4.70)#73 | 38.5%(+6.10)#1,723 |
| 74. | Long Branch | 44.6% | 39.9%(+4.70)#74 | 38.5%(+6.10)#1,726 |
| 75. | Lorton | 44.5% | 39.9%(+4.60)#75 | 38.5%(+6.00)#1,739 |
| 76. | Broadlands | 44.5% | 39.9%(+4.60)#76 | 38.5%(+6.00)#1,742 |
| 77. | Nokesville | 44.5% | 39.9%(+4.60)#77 | 38.5%(+6.00)#1,752 |
| 78. | Loudoun Valley Estates | 44.3% | 39.9%(+4.40)#78 | 38.5%(+5.80)#1,780 |
| 79. | Kings Park West | 44.0% | 39.9%(+4.10)#79 | 38.5%(+5.50)#1,841 |
| 80. | Manassas | 43.6% | 39.9%(+3.70)#80 | 38.5%(+5.10)#1,885 |
| 81. | Rose Hill Cdp Fairfax County | 43.6% | 39.9%(+3.70)#81 | 38.5%(+5.10)#1,888 |
| 82. | Groveton | 43.6% | 39.9%(+3.70)#82 | 38.5%(+5.10)#1,890 |
| 83. | Lake Ridge | 43.5% | 39.9%(+3.60)#83 | 38.5%(+5.00)#1,900 |
| 84. | Danville | 43.5% | 39.9%(+3.60)#84 | 38.5%(+5.00)#1,901 |
| 85. | Annandale | 43.5% | 39.9%(+3.60)#85 | 38.5%(+5.00)#1,902 |
| 86. | Leesylvania | 43.5% | 39.9%(+3.60)#86 | 38.5%(+5.00)#1,908 |
| 87. | Sudley | 43.5% | 39.9%(+3.60)#87 | 38.5%(+5.00)#1,910 |
| 88. | Laurel | 43.3% | 39.9%(+3.40)#88 | 38.5%(+4.80)#1,948 |
| 89. | Leesburg | 43.2% | 39.9%(+3.30)#89 | 38.5%(+4.70)#1,966 |
| 90. | Fort Belvoir | 43.2% | 39.9%(+3.30)#90 | 38.5%(+4.70)#1,976 |
| 91. | Hybla Valley | 43.0% | 39.9%(+3.10)#91 | 38.5%(+4.50)#2,007 |
| 92. | Belle Haven | 42.9% | 39.9%(+3.00)#92 | 38.5%(+4.40)#2,031 |
| 93. | Kings Park | 42.9% | 39.9%(+3.00)#93 | 38.5%(+4.40)#2,034 |
| 94. | Kingstowne | 42.5% | 39.9%(+2.60)#94 | 38.5%(+4.00)#2,112 |
| 95. | Brambleton | 42.2% | 39.9%(+2.30)#95 | 38.5%(+3.70)#2,162 |
| 96. | Fairfax | 42.1% | 39.9%(+2.20)#96 | 38.5%(+3.60)#2,178 |
| 97. | Lake Barcroft | 41.6% | 39.9%(+1.70)#97 | 38.5%(+3.10)#2,251 |
| 98. | Dumbarton | 41.4% | 39.9%(+1.50)#98 | 38.5%(+2.90)#2,286 |
| 99. | Portsmouth | 41.1% | 39.9%(+1.20)#99 | 38.5%(+2.60)#2,321 |
| 100. | Centreville | 41.1% | 39.9%(+1.20)#100 | 38.5%(+2.60)#2,323 |
Common Questions
What are the Top 10 Cities with the Highest Percentage of Population Taking Public Transit to Work in Virginia?
Top 10 Cities with the Highest Percentage of Population Taking Public Transit to Work in Virginia are:
#1
73.6%
#2
62.8%
#3
60.4%
#4
59.7%
#5
59.7%
#6
57.5%
#7
56.4%
#8
56.4%
#9
56.3%
#10
56.2%
What city has the Highest Percentage of Population Taking Public Transit to Work in Virginia?
Staunton has the Highest Percentage of Population Taking Public Transit to Work in Virginia with 73.6%.
What is the Percentage of Population Taking Public Transit to Work in the State of Virginia?
Percentage of Population Taking Public Transit to Work in Virginia is 39.9%.
What is the Percentage of Population Taking Public Transit to Work in the United States?
Percentage of Population Taking Public Transit to Work in the United States is 38.5%.