Cities with the Highest Percentage of Population Taking Public Transit to Work in South Carolina
RELATED REPORTS & OPTIONS
Public Transit
South Carolina
Compare Cities
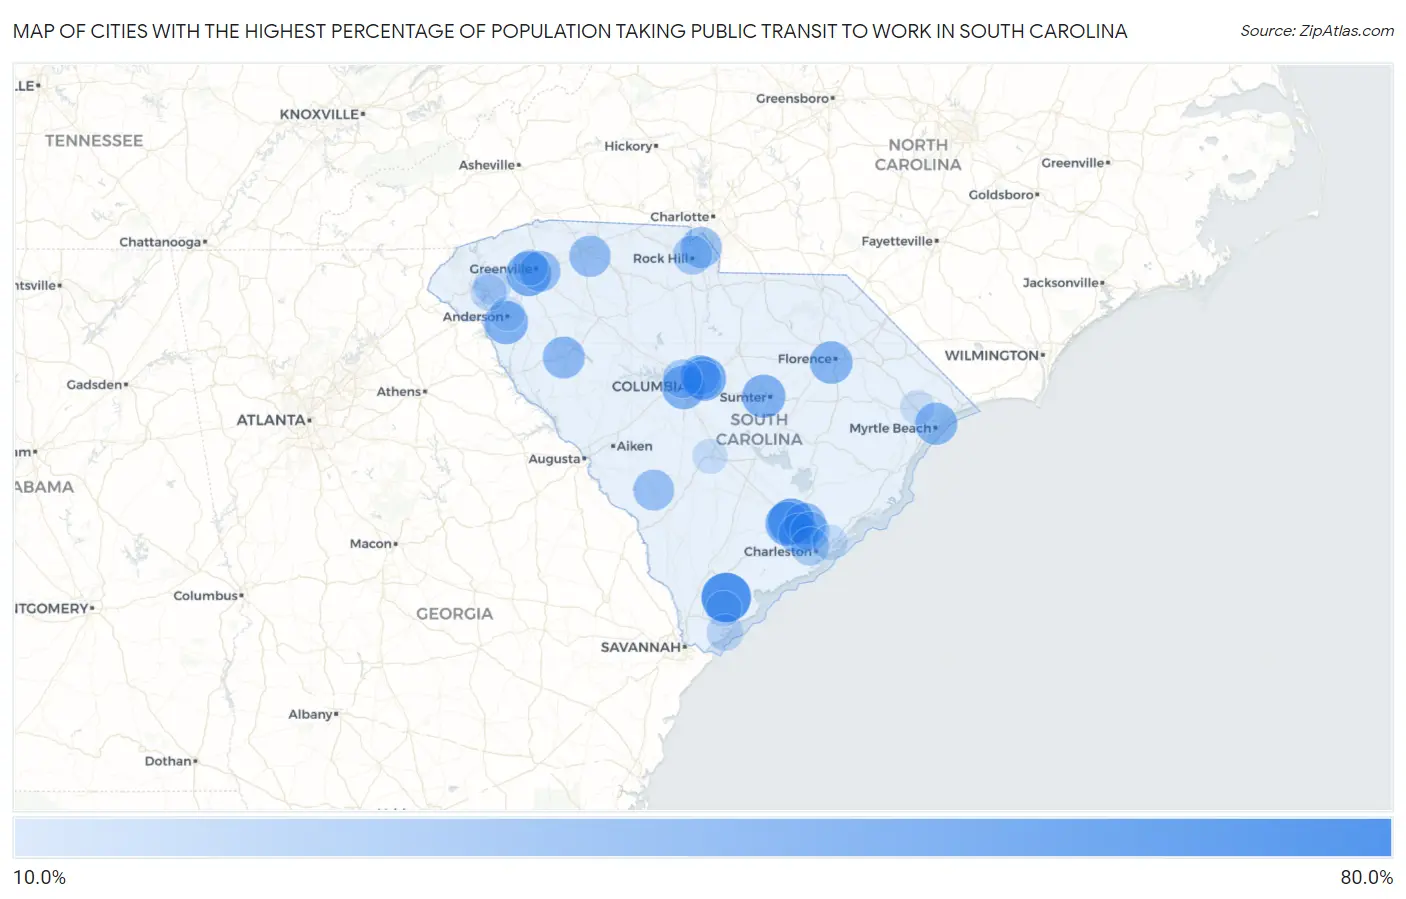
Map of Cities with the Highest Percentage of Population Taking Public Transit to Work in South Carolina
0.0%
80.0%
Cities with the Highest Percentage of Population Taking Public Transit to Work in South Carolina
| City | % Public Transit | vs State | vs National | |
| 1. | Beaufort | 79.2% | 40.3%(+38.9)#1 | 38.5%(+40.7)#1 |
| 2. | Lincolnville | 63.2% | 40.3%(+22.9)#2 | 38.5%(+24.7)#82 |
| 3. | Welcome | 59.3% | 40.3%(+19.0)#3 | 38.5%(+20.8)#191 |
| 4. | Woodfield | 58.7% | 40.3%(+18.4)#4 | 38.5%(+20.2)#213 |
| 5. | Daufuskie Island | 57.5% | 40.3%(+17.2)#5 | 38.5%(+19.0)#285 |
| 6. | Summerville | 56.6% | 40.3%(+16.3)#6 | 38.5%(+18.1)#329 |
| 7. | West Columbia | 54.5% | 40.3%(+14.2)#7 | 38.5%(+16.0)#475 |
| 8. | Sumter | 54.0% | 40.3%(+13.7)#8 | 38.5%(+15.5)#521 |
| 9. | Homeland Park | 54.0% | 40.3%(+13.7)#9 | 38.5%(+15.5)#522 |
| 10. | Florence | 51.0% | 40.3%(+10.7)#10 | 38.5%(+12.5)#775 |
| 11. | Myrtle Beach | 48.7% | 40.3%(+8.40)#11 | 38.5%(+10.2)#1,074 |
| 12. | Greenwood | 47.5% | 40.3%(+7.20)#12 | 38.5%(+9.00)#1,252 |
| 13. | Goose Creek | 47.4% | 40.3%(+7.10)#13 | 38.5%(+8.90)#1,268 |
| 14. | Spartanburg | 45.3% | 40.3%(+5.00)#14 | 38.5%(+6.80)#1,608 |
| 15. | Fort Mill | 44.3% | 40.3%(+4.00)#15 | 38.5%(+5.80)#1,776 |
| 16. | Greenville | 44.0% | 40.3%(+3.70)#16 | 38.5%(+5.50)#1,835 |
| 17. | Barnwell | 43.4% | 40.3%(+3.10)#17 | 38.5%(+4.90)#1,931 |
| 18. | North Charleston | 42.7% | 40.3%(+2.40)#18 | 38.5%(+4.20)#2,065 |
| 19. | Dentsville | 39.6% | 40.3%(-0.700)#19 | 38.5%(+1.10)#2,611 |
| 20. | Columbia | 37.4% | 40.3%(-2.90)#20 | 38.5%(-1.10)#2,945 |
| 21. | Rock Hill | 36.6% | 40.3%(-3.70)#21 | 38.5%(-1.90)#3,075 |
| 22. | Hanahan | 36.6% | 40.3%(-3.70)#22 | 38.5%(-1.90)#3,082 |
| 23. | St Andrews | 35.7% | 40.3%(-4.60)#23 | 38.5%(-2.80)#3,211 |
| 24. | Charleston | 34.2% | 40.3%(-6.10)#24 | 38.5%(-4.30)#3,433 |
| 25. | Central | 26.9% | 40.3%(-13.4)#25 | 38.5%(-11.6)#4,132 |
| 26. | Hilton Head Island | 26.8% | 40.3%(-13.5)#26 | 38.5%(-11.7)#4,138 |
| 27. | Clemson | 25.5% | 40.3%(-14.8)#27 | 38.5%(-13.0)#4,222 |
| 28. | Parker | 25.2% | 40.3%(-15.1)#28 | 38.5%(-13.3)#4,232 |
| 29. | Port Royal | 23.4% | 40.3%(-16.9)#29 | 38.5%(-15.1)#4,347 |
| 30. | Mount Pleasant | 22.5% | 40.3%(-17.8)#30 | 38.5%(-16.0)#4,392 |
| 31. | Orangeburg | 21.4% | 40.3%(-18.9)#31 | 38.5%(-17.1)#4,441 |
| 32. | Conway | 20.9% | 40.3%(-19.4)#32 | 38.5%(-17.6)#4,454 |
| 33. | Anderson | 18.8% | 40.3%(-21.5)#33 | 38.5%(-19.7)#4,526 |
Common Questions
What are the Top 10 Cities with the Highest Percentage of Population Taking Public Transit to Work in South Carolina?
Top 10 Cities with the Highest Percentage of Population Taking Public Transit to Work in South Carolina are:
#1
79.2%
#2
63.2%
#3
59.3%
#4
58.7%
#5
56.6%
#6
54.5%
#7
54.0%
#8
54.0%
#9
51.0%
#10
48.7%
What city has the Highest Percentage of Population Taking Public Transit to Work in South Carolina?
Beaufort has the Highest Percentage of Population Taking Public Transit to Work in South Carolina with 79.2%.
What is the Percentage of Population Taking Public Transit to Work in the State of South Carolina?
Percentage of Population Taking Public Transit to Work in South Carolina is 40.3%.
What is the Percentage of Population Taking Public Transit to Work in the United States?
Percentage of Population Taking Public Transit to Work in the United States is 38.5%.