Cities with the Highest Percentage of Households Heated without Fuel in Maryland
RELATED REPORTS & OPTIONS
Fuel-less Heating
Maryland
Compare Cities
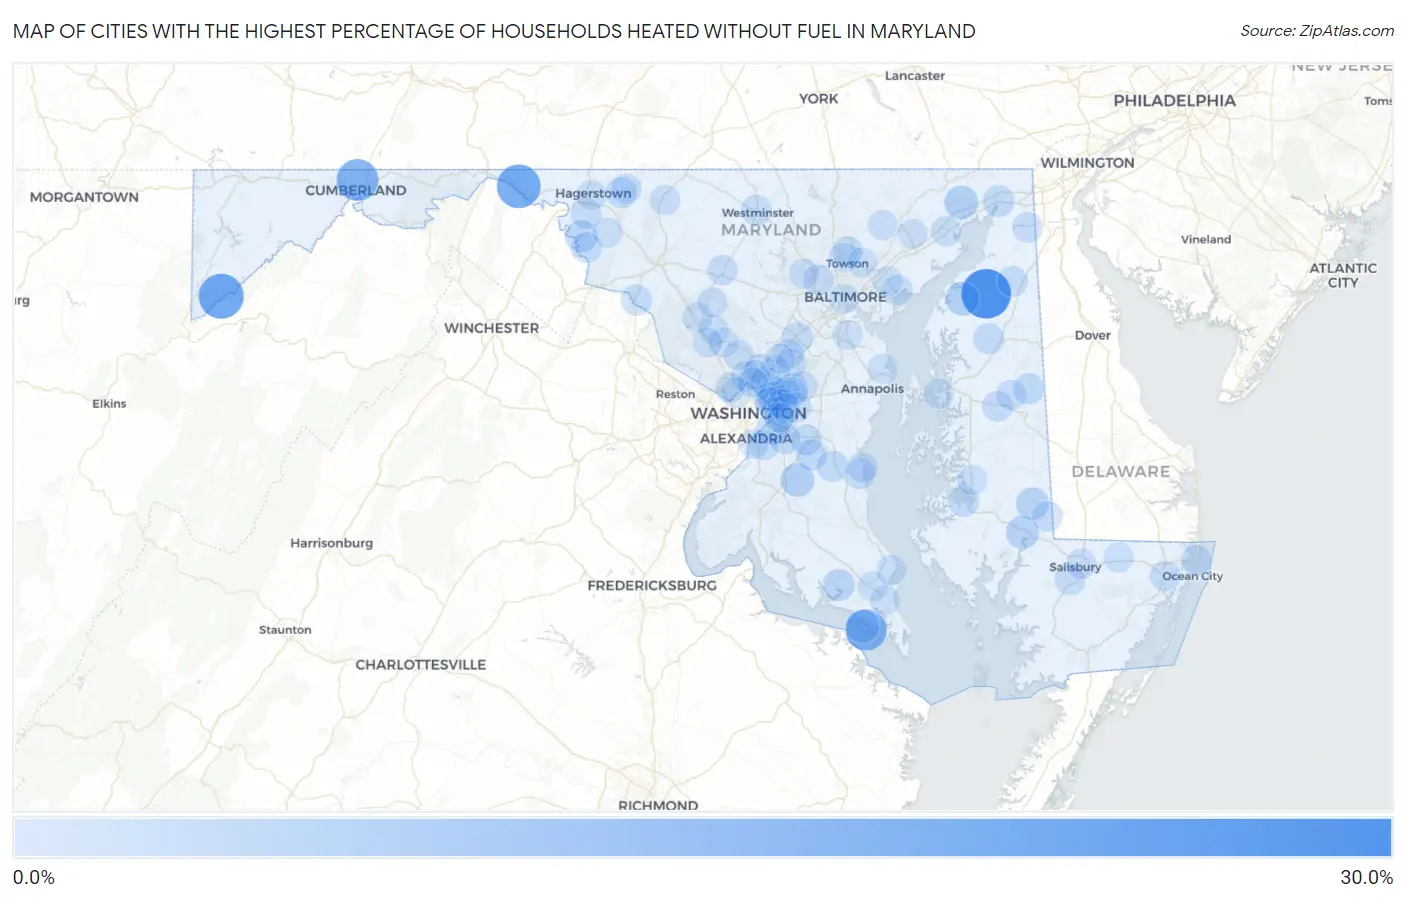
Map of Cities with the Highest Percentage of Households Heated without Fuel in Maryland
0.0%
30.0%
Cities with the Highest Percentage of Households Heated without Fuel in Maryland
| City | Fuel-less Heating | vs State | vs National | |
| 1. | Kennedyville | 26.4% | 0.60%(+25.8)#1 | 1.2%(+25.2)#485 |
| 2. | Gorman | 20.2% | 0.60%(+19.6)#2 | 1.2%(+19.0)#511 |
| 3. | Pecktonville | 18.4% | 0.60%(+17.8)#3 | 1.2%(+17.2)#521 |
| 4. | Bowmans Addition | 15.9% | 0.60%(+15.3)#4 | 1.2%(+14.7)#544 |
| 5. | Piney Point | 14.9% | 0.60%(+14.3)#5 | 1.2%(+13.7)#551 |
| 6. | Cedarville | 5.3% | 0.60%(+4.70)#6 | 1.2%(+4.10)#991 |
| 7. | Port Deposit | 5.3% | 0.60%(+4.70)#7 | 1.2%(+4.10)#994 |
| 8. | Butlertown | 5.3% | 0.60%(+4.70)#8 | 1.2%(+4.10)#995 |
| 9. | Tall Timbers | 5.0% | 0.60%(+4.40)#9 | 1.2%(+3.80)#1,053 |
| 10. | Vienna | 4.6% | 0.60%(+4.00)#10 | 1.2%(+3.40)#1,131 |
| 11. | Eldorado | 4.2% | 0.60%(+3.60)#11 | 1.2%(+3.00)#1,249 |
| 12. | Mercersville | 3.6% | 0.60%(+3.00)#12 | 1.2%(+2.40)#1,411 |
| 13. | Leonardtown | 3.3% | 0.60%(+2.70)#13 | 1.2%(+2.10)#1,491 |
| 14. | Silver Hill | 2.8% | 0.60%(+2.20)#14 | 1.2%(+1.60)#1,721 |
| 15. | North East | 2.6% | 0.60%(+2.00)#15 | 1.2%(+1.40)#1,854 |
| 16. | Seabrook | 2.5% | 0.60%(+1.90)#16 | 1.2%(+1.30)#1,911 |
| 17. | Bladensburg | 2.4% | 0.60%(+1.80)#17 | 1.2%(+1.20)#2,002 |
| 18. | Croom | 2.4% | 0.60%(+1.80)#18 | 1.2%(+1.20)#2,021 |
| 19. | Greensboro | 2.4% | 0.60%(+1.80)#19 | 1.2%(+1.20)#2,022 |
| 20. | Dunkirk | 2.4% | 0.60%(+1.80)#20 | 1.2%(+1.20)#2,026 |
| 21. | Queensland | 2.4% | 0.60%(+1.80)#21 | 1.2%(+1.20)#2,028 |
| 22. | Cavetown | 2.3% | 0.60%(+1.70)#22 | 1.2%(+1.10)#2,142 |
| 23. | Savage | 2.2% | 0.60%(+1.60)#23 | 1.2%(+1.00)#2,191 |
| 24. | Adelphi | 2.1% | 0.60%(+1.50)#24 | 1.2%(+0.900)#2,299 |
| 25. | Sharpsburg | 2.1% | 0.60%(+1.50)#25 | 1.2%(+0.900)#2,384 |
| 26. | Edmonston | 2.0% | 0.60%(+1.40)#26 | 1.2%(+0.800)#2,485 |
| 27. | Church Hill | 2.0% | 0.60%(+1.40)#27 | 1.2%(+0.800)#2,498 |
| 28. | Algonquin | 2.0% | 0.60%(+1.40)#28 | 1.2%(+0.800)#2,499 |
| 29. | Riverdale Park | 1.9% | 0.60%(+1.30)#29 | 1.2%(+0.700)#2,576 |
| 30. | Andrews Afb | 1.9% | 0.60%(+1.30)#30 | 1.2%(+0.700)#2,607 |
| 31. | Point Of Rocks | 1.9% | 0.60%(+1.30)#31 | 1.2%(+0.700)#2,615 |
| 32. | St James | 1.8% | 0.60%(+1.20)#32 | 1.2%(+0.600)#2,749 |
| 33. | Chesapeake Beach | 1.7% | 0.60%(+1.10)#33 | 1.2%(+0.500)#2,913 |
| 34. | Brentwood | 1.7% | 0.60%(+1.10)#34 | 1.2%(+0.500)#2,932 |
| 35. | Callaway | 1.7% | 0.60%(+1.10)#35 | 1.2%(+0.500)#2,965 |
| 36. | Galena | 1.7% | 0.60%(+1.10)#36 | 1.2%(+0.500)#2,979 |
| 37. | Westminster | 1.6% | 0.60%(+1.000)#37 | 1.2%(+0.400)#3,044 |
| 38. | Forest Glen | 1.6% | 0.60%(+1.000)#38 | 1.2%(+0.400)#3,079 |
| 39. | Hillsboro | 1.6% | 0.60%(+1.000)#39 | 1.2%(+0.400)#3,204 |
| 40. | Lochearn | 1.5% | 0.60%(+0.900)#40 | 1.2%(+0.300)#3,234 |
| 41. | Oxon Hill | 1.5% | 0.60%(+0.900)#41 | 1.2%(+0.300)#3,248 |
| 42. | Mount Airy | 1.5% | 0.60%(+0.900)#42 | 1.2%(+0.300)#3,264 |
| 43. | Wildewood | 1.5% | 0.60%(+0.900)#43 | 1.2%(+0.300)#3,270 |
| 44. | Ocean City | 1.5% | 0.60%(+0.900)#44 | 1.2%(+0.300)#3,279 |
| 45. | Fruitland | 1.5% | 0.60%(+0.900)#45 | 1.2%(+0.300)#3,288 |
| 46. | Friendship Heights Village | 1.5% | 0.60%(+0.900)#46 | 1.2%(+0.300)#3,303 |
| 47. | Berlin | 1.4% | 0.60%(+0.800)#47 | 1.2%(+0.200)#3,520 |
| 48. | Chesapeake City | 1.4% | 0.60%(+0.800)#48 | 1.2%(+0.200)#3,612 |
| 49. | Glenn Dale | 1.3% | 0.60%(+0.700)#49 | 1.2%(+0.100)#3,695 |
| 50. | New Carrollton | 1.3% | 0.60%(+0.700)#50 | 1.2%(+0.100)#3,701 |
| 51. | Bowleys Quarters | 1.3% | 0.60%(+0.700)#51 | 1.2%(+0.100)#3,732 |
| 52. | Thurmont | 1.3% | 0.60%(+0.700)#52 | 1.2%(+0.100)#3,735 |
| 53. | Colmar Manor | 1.3% | 0.60%(+0.700)#53 | 1.2%(+0.100)#3,826 |
| 54. | Sharptown | 1.3% | 0.60%(+0.700)#54 | 1.2%(+0.100)#3,851 |
| 55. | Randallstown | 1.2% | 0.60%(+0.600)#55 | 1.2%(=0.000)#3,924 |
| 56. | Montgomery Village | 1.2% | 0.60%(+0.600)#56 | 1.2%(=0.000)#3,925 |
| 57. | Salisbury | 1.2% | 0.60%(+0.600)#57 | 1.2%(=0.000)#3,929 |
| 58. | South Laurel | 1.2% | 0.60%(+0.600)#58 | 1.2%(=0.000)#3,931 |
| 59. | Lake Arbor | 1.2% | 0.60%(+0.600)#59 | 1.2%(=0.000)#3,961 |
| 60. | Smithsburg | 1.2% | 0.60%(+0.600)#60 | 1.2%(=0.000)#4,047 |
| 61. | North Beach | 1.2% | 0.60%(+0.600)#61 | 1.2%(=0.000)#4,054 |
| 62. | Ridgely | 1.2% | 0.60%(+0.600)#62 | 1.2%(=0.000)#4,096 |
| 63. | Fairmount Heights | 1.2% | 0.60%(+0.600)#63 | 1.2%(=0.000)#4,106 |
| 64. | Aspen Hill | 1.1% | 0.60%(+0.500)#64 | 1.2%(-0.100)#4,201 |
| 65. | Clarksburg | 1.1% | 0.60%(+0.500)#65 | 1.2%(-0.100)#4,226 |
| 66. | Aberdeen | 1.1% | 0.60%(+0.500)#66 | 1.2%(-0.100)#4,252 |
| 67. | White Oak | 1.1% | 0.60%(+0.500)#67 | 1.2%(-0.100)#4,255 |
| 68. | Timonium | 1.1% | 0.60%(+0.500)#68 | 1.2%(-0.100)#4,277 |
| 69. | Walker Mill | 1.1% | 0.60%(+0.500)#69 | 1.2%(-0.100)#4,284 |
| 70. | Laurel | 1.0% | 0.60%(+0.400)#70 | 1.2%(-0.200)#4,550 |
| 71. | Beltsville | 1.0% | 0.60%(+0.400)#71 | 1.2%(-0.200)#4,574 |
| 72. | Summerfield | 1.0% | 0.60%(+0.400)#72 | 1.2%(-0.200)#4,587 |
| 73. | Chesapeake Ranch Estates | 1.0% | 0.60%(+0.400)#73 | 1.2%(-0.200)#4,633 |
| 74. | Fallston | 1.0% | 0.60%(+0.400)#74 | 1.2%(-0.200)#4,634 |
| 75. | Cape St Claire | 1.0% | 0.60%(+0.400)#75 | 1.2%(-0.200)#4,646 |
| 76. | Four Corners | 1.0% | 0.60%(+0.400)#76 | 1.2%(-0.200)#4,659 |
| 77. | Lutherville | 1.0% | 0.60%(+0.400)#77 | 1.2%(-0.200)#4,675 |
| 78. | Boonsboro | 1.0% | 0.60%(+0.400)#78 | 1.2%(-0.200)#4,717 |
| 79. | Konterra | 1.0% | 0.60%(+0.400)#79 | 1.2%(-0.200)#4,732 |
| 80. | Romancoke | 1.0% | 0.60%(+0.400)#80 | 1.2%(-0.200)#4,788 |
| 81. | Baltimore | 0.90% | 0.60%(+0.300)#81 | 1.2%(-0.300)#4,908 |
| 82. | Silver Spring | 0.90% | 0.60%(+0.300)#82 | 1.2%(-0.300)#4,933 |
| 83. | Bethesda | 0.90% | 0.60%(+0.300)#83 | 1.2%(-0.300)#4,939 |
| 84. | Middle River | 0.90% | 0.60%(+0.300)#84 | 1.2%(-0.300)#4,969 |
| 85. | Carney | 0.90% | 0.60%(+0.300)#85 | 1.2%(-0.300)#4,973 |
| 86. | Landover | 0.90% | 0.60%(+0.300)#86 | 1.2%(-0.300)#4,990 |
| 87. | Redland | 0.90% | 0.60%(+0.300)#87 | 1.2%(-0.300)#5,018 |
| 88. | California | 0.90% | 0.60%(+0.300)#88 | 1.2%(-0.300)#5,040 |
| 89. | Lanham | 0.90% | 0.60%(+0.300)#89 | 1.2%(-0.300)#5,055 |
| 90. | National Harbor | 0.90% | 0.60%(+0.300)#90 | 1.2%(-0.300)#5,136 |
| 91. | Capitol Heights | 0.90% | 0.60%(+0.300)#91 | 1.2%(-0.300)#5,144 |
| 92. | Grasonville | 0.90% | 0.60%(+0.300)#92 | 1.2%(-0.300)#5,171 |
| 93. | Pittsville | 0.90% | 0.60%(+0.300)#93 | 1.2%(-0.300)#5,203 |
| 94. | Trappe | 0.90% | 0.60%(+0.300)#94 | 1.2%(-0.300)#5,254 |
| 95. | Glen Burnie | 0.80% | 0.60%(+0.200)#95 | 1.2%(-0.400)#5,357 |
| 96. | Gaithersburg | 0.80% | 0.60%(+0.200)#96 | 1.2%(-0.400)#5,361 |
| 97. | Bel Air South | 0.80% | 0.60%(+0.200)#97 | 1.2%(-0.400)#5,373 |
| 98. | Hagerstown | 0.80% | 0.60%(+0.200)#98 | 1.2%(-0.400)#5,385 |
| 99. | Damascus | 0.80% | 0.60%(+0.200)#99 | 1.2%(-0.400)#5,450 |
| 100. | Lexington Park | 0.80% | 0.60%(+0.200)#100 | 1.2%(-0.400)#5,480 |
Common Questions
What are the Top 10 Cities with the Highest Percentage of Households Heated without Fuel in Maryland?
Top 10 Cities with the Highest Percentage of Households Heated without Fuel in Maryland are:
#1
26.4%
#2
20.2%
#3
18.4%
#4
15.9%
#5
14.9%
#6
5.3%
#7
5.3%
#8
5.3%
#9
5.0%
#10
4.6%
What city has the Highest Percentage of Households Heated without Fuel in Maryland?
Kennedyville has the Highest Percentage of Households Heated without Fuel in Maryland with 26.4%.
What is the Percentage of Households Heated without Fuel in the State of Maryland?
Percentage of Households Heated without Fuel in Maryland is 0.60%.
What is the Percentage of Households Heated without Fuel in the United States?
Percentage of Households Heated without Fuel in the United States is 1.2%.