Cities with the Highest Percentage of Households Heated without Fuel in South Carolina
RELATED REPORTS & OPTIONS
Fuel-less Heating
South Carolina
Compare Cities
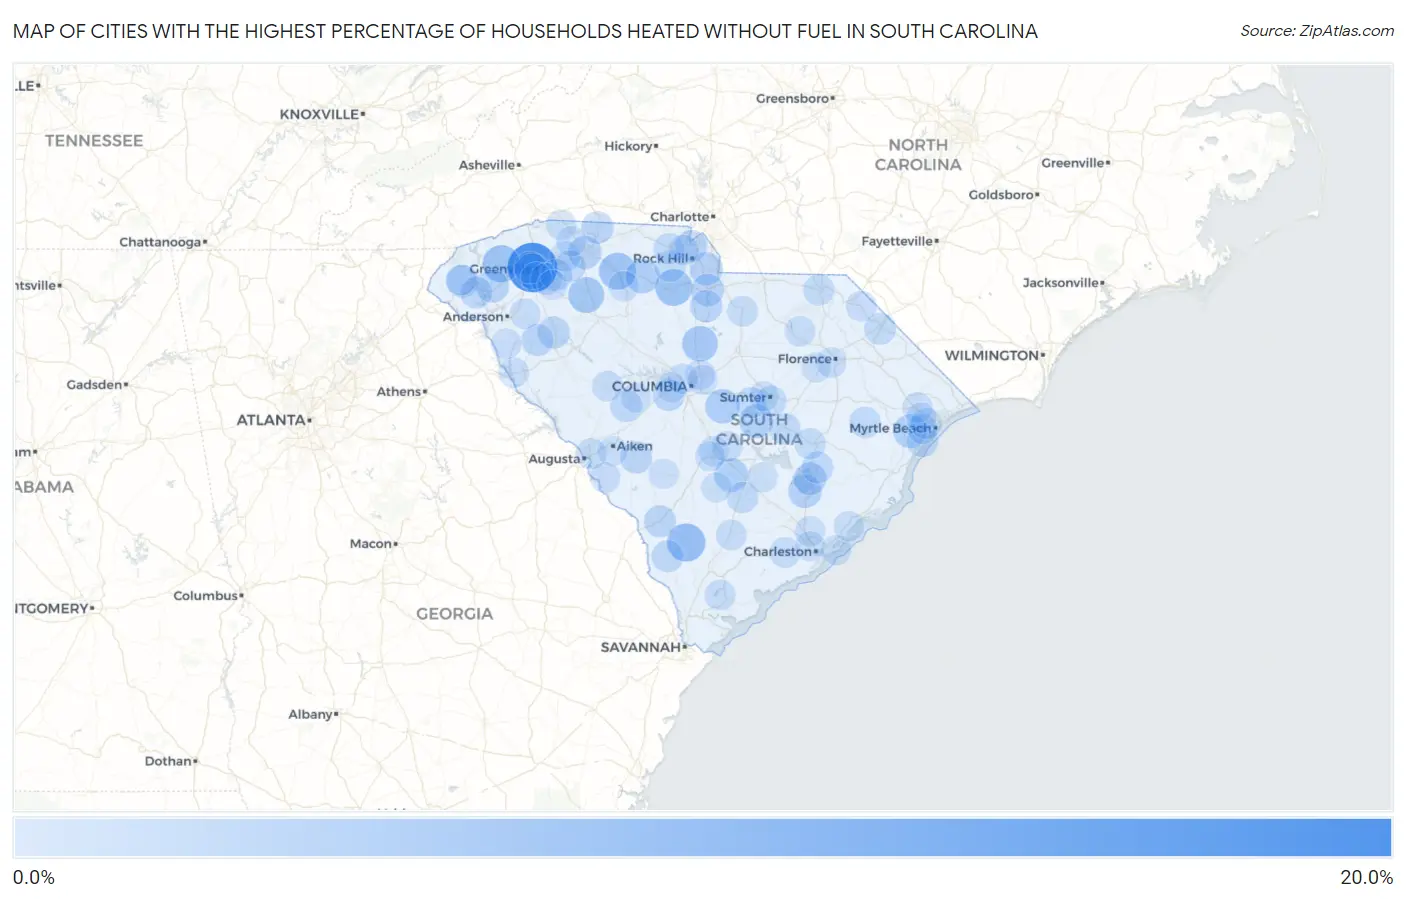
Map of Cities with the Highest Percentage of Households Heated without Fuel in South Carolina
0.0%
20.0%
Cities with the Highest Percentage of Households Heated without Fuel in South Carolina
| City | Fuel-less Heating | vs State | vs National | |
| 1. | City View | 18.7% | 0.60%(+18.1)#1 | 1.2%(+17.5)#518 |
| 2. | Varnville | 7.8% | 0.60%(+7.20)#2 | 1.2%(+6.60)#738 |
| 3. | Pickens | 7.0% | 0.60%(+6.40)#3 | 1.2%(+5.80)#787 |
| 4. | Jonesville | 6.7% | 0.60%(+6.10)#4 | 1.2%(+5.50)#817 |
| 5. | Eureka Mill | 6.6% | 0.60%(+6.00)#5 | 1.2%(+5.40)#826 |
| 6. | Enoree | 5.7% | 0.60%(+5.10)#6 | 1.2%(+4.50)#941 |
| 7. | Judson | 5.5% | 0.60%(+4.90)#7 | 1.2%(+4.30)#961 |
| 8. | Ridgeway | 5.5% | 0.60%(+4.90)#8 | 1.2%(+4.30)#968 |
| 9. | Whitney | 4.8% | 0.60%(+4.20)#9 | 1.2%(+3.60)#1,083 |
| 10. | Homewood | 4.6% | 0.60%(+4.00)#10 | 1.2%(+3.40)#1,125 |
| 11. | Gadsden | 4.5% | 0.60%(+3.90)#11 | 1.2%(+3.30)#1,155 |
| 12. | Lockhart | 4.1% | 0.60%(+3.50)#12 | 1.2%(+2.90)#1,264 |
| 13. | Pinewood | 3.9% | 0.60%(+3.30)#13 | 1.2%(+2.70)#1,304 |
| 14. | Bucksport | 3.8% | 0.60%(+3.20)#14 | 1.2%(+2.60)#1,338 |
| 15. | Bowman | 3.8% | 0.60%(+3.20)#15 | 1.2%(+2.60)#1,342 |
| 16. | Pinopolis | 3.5% | 0.60%(+2.90)#16 | 1.2%(+2.30)#1,436 |
| 17. | Saxon | 3.4% | 0.60%(+2.80)#17 | 1.2%(+2.20)#1,458 |
| 18. | Catawba | 3.3% | 0.60%(+2.70)#18 | 1.2%(+2.10)#1,502 |
| 19. | White Knoll | 3.2% | 0.60%(+2.60)#19 | 1.2%(+2.00)#1,533 |
| 20. | Central | 3.0% | 0.60%(+2.40)#20 | 1.2%(+1.80)#1,623 |
| 21. | Bonneau Beach | 2.9% | 0.60%(+2.30)#21 | 1.2%(+1.70)#1,683 |
| 22. | Fort Lawn | 2.9% | 0.60%(+2.30)#22 | 1.2%(+1.70)#1,684 |
| 23. | West Union | 2.7% | 0.60%(+2.10)#23 | 1.2%(+1.50)#1,814 |
| 24. | Cateechee | 2.6% | 0.60%(+2.00)#24 | 1.2%(+1.40)#1,880 |
| 25. | Ware Shoals | 2.5% | 0.60%(+1.90)#25 | 1.2%(+1.30)#1,954 |
| 26. | Great Falls | 2.5% | 0.60%(+1.90)#26 | 1.2%(+1.30)#1,956 |
| 27. | Due West | 2.5% | 0.60%(+1.90)#27 | 1.2%(+1.30)#1,964 |
| 28. | Allendale | 2.4% | 0.60%(+1.80)#28 | 1.2%(+1.20)#2,025 |
| 29. | Chesnee | 2.4% | 0.60%(+1.80)#29 | 1.2%(+1.20)#2,057 |
| 30. | Windsor | 2.4% | 0.60%(+1.80)#30 | 1.2%(+1.20)#2,067 |
| 31. | Red Bank | 2.3% | 0.60%(+1.70)#31 | 1.2%(+1.10)#2,092 |
| 32. | India Hook | 2.3% | 0.60%(+1.70)#32 | 1.2%(+1.10)#2,100 |
| 33. | Estill | 2.2% | 0.60%(+1.60)#33 | 1.2%(+1.00)#2,219 |
| 34. | Utica | 2.2% | 0.60%(+1.60)#34 | 1.2%(+1.00)#2,225 |
| 35. | Parker | 2.1% | 0.60%(+1.50)#35 | 1.2%(+0.900)#2,306 |
| 36. | St Stephen | 2.1% | 0.60%(+1.50)#36 | 1.2%(+0.900)#2,369 |
| 37. | Five Forks | 2.0% | 0.60%(+1.40)#37 | 1.2%(+0.800)#2,423 |
| 38. | Garden City | 2.0% | 0.60%(+1.40)#38 | 1.2%(+0.800)#2,432 |
| 39. | Monetta | 2.0% | 0.60%(+1.40)#39 | 1.2%(+0.800)#2,529 |
| 40. | Mauldin | 1.9% | 0.60%(+1.30)#40 | 1.2%(+0.700)#2,548 |
| 41. | Dillon | 1.9% | 0.60%(+1.30)#41 | 1.2%(+0.700)#2,583 |
| 42. | Manning | 1.8% | 0.60%(+1.20)#42 | 1.2%(+0.600)#2,751 |
| 43. | Reidville | 1.8% | 0.60%(+1.20)#43 | 1.2%(+0.600)#2,794 |
| 44. | Stuckey | 1.8% | 0.60%(+1.20)#44 | 1.2%(+0.600)#2,854 |
| 45. | St George | 1.7% | 0.60%(+1.10)#45 | 1.2%(+0.500)#2,951 |
| 46. | Cheraw | 1.6% | 0.60%(+1.000)#46 | 1.2%(+0.400)#3,088 |
| 47. | Ben Avon | 1.6% | 0.60%(+1.000)#47 | 1.2%(+0.400)#3,121 |
| 48. | Wedgefield | 1.6% | 0.60%(+1.000)#48 | 1.2%(+0.400)#3,123 |
| 49. | Greeleyville | 1.6% | 0.60%(+1.000)#49 | 1.2%(+0.400)#3,187 |
| 50. | Mcconnells | 1.6% | 0.60%(+1.000)#50 | 1.2%(+0.400)#3,196 |
| 51. | Clearwater | 1.5% | 0.60%(+0.900)#51 | 1.2%(+0.300)#3,312 |
| 52. | York | 1.4% | 0.60%(+0.800)#52 | 1.2%(+0.200)#3,488 |
| 53. | South Sumter | 1.4% | 0.60%(+0.800)#53 | 1.2%(+0.200)#3,577 |
| 54. | Ravenel | 1.3% | 0.60%(+0.700)#54 | 1.2%(+0.100)#3,797 |
| 55. | Kershaw | 1.3% | 0.60%(+0.700)#55 | 1.2%(+0.100)#3,800 |
| 56. | Forestbrook | 1.2% | 0.60%(+0.600)#56 | 1.2%(=0.000)#3,996 |
| 57. | Laurel Bay | 1.2% | 0.60%(+0.600)#57 | 1.2%(=0.000)#4,020 |
| 58. | Gantt | 1.1% | 0.60%(+0.500)#58 | 1.2%(-0.100)#4,264 |
| 59. | Walterboro | 1.1% | 0.60%(+0.500)#59 | 1.2%(-0.100)#4,314 |
| 60. | Belton | 1.1% | 0.60%(+0.500)#60 | 1.2%(-0.100)#4,343 |
| 61. | North Hartsville | 1.1% | 0.60%(+0.500)#61 | 1.2%(-0.100)#4,362 |
| 62. | Saluda | 1.1% | 0.60%(+0.500)#62 | 1.2%(-0.100)#4,366 |
| 63. | Cameron | 1.1% | 0.60%(+0.500)#63 | 1.2%(-0.100)#4,477 |
| 64. | Walhalla | 1.0% | 0.60%(+0.400)#64 | 1.2%(-0.200)#4,709 |
| 65. | Duncan | 1.0% | 0.60%(+0.400)#65 | 1.2%(-0.200)#4,711 |
| 66. | Socastee | 0.90% | 0.60%(+0.300)#66 | 1.2%(-0.300)#4,989 |
| 67. | St Andrews | 0.90% | 0.60%(+0.300)#67 | 1.2%(-0.300)#4,999 |
| 68. | Union | 0.90% | 0.60%(+0.300)#68 | 1.2%(-0.300)#5,083 |
| 69. | Batesburg Leesville | 0.90% | 0.60%(+0.300)#69 | 1.2%(-0.300)#5,119 |
| 70. | East Camden | 0.90% | 0.60%(+0.300)#70 | 1.2%(-0.300)#5,161 |
| 71. | Calhoun Falls | 0.90% | 0.60%(+0.300)#71 | 1.2%(-0.300)#5,209 |
| 72. | Iva | 0.90% | 0.60%(+0.300)#72 | 1.2%(-0.300)#5,252 |
| 73. | Fripp Island | 0.90% | 0.60%(+0.300)#73 | 1.2%(-0.300)#5,272 |
| 74. | Clio | 0.90% | 0.60%(+0.300)#74 | 1.2%(-0.300)#5,280 |
| 75. | Florence | 0.80% | 0.60%(+0.200)#75 | 1.2%(-0.400)#5,387 |
| 76. | Carolina Forest | 0.80% | 0.60%(+0.200)#76 | 1.2%(-0.400)#5,419 |
| 77. | Hanahan | 0.80% | 0.60%(+0.200)#77 | 1.2%(-0.400)#5,436 |
| 78. | Dentsville | 0.80% | 0.60%(+0.200)#78 | 1.2%(-0.400)#5,456 |
| 79. | Isle Of Palms | 0.80% | 0.60%(+0.200)#79 | 1.2%(-0.400)#5,607 |
| 80. | Newport | 0.80% | 0.60%(+0.200)#80 | 1.2%(-0.400)#5,609 |
| 81. | Brookdale | 0.80% | 0.60%(+0.200)#81 | 1.2%(-0.400)#5,612 |
| 82. | Capitol View | 0.80% | 0.60%(+0.200)#82 | 1.2%(-0.400)#5,618 |
| 83. | Arkwright | 0.80% | 0.60%(+0.200)#83 | 1.2%(-0.400)#5,651 |
| 84. | Landrum | 0.80% | 0.60%(+0.200)#84 | 1.2%(-0.400)#5,658 |
| 85. | Jackson | 0.80% | 0.60%(+0.200)#85 | 1.2%(-0.400)#5,689 |
| 86. | Awendaw | 0.80% | 0.60%(+0.200)#86 | 1.2%(-0.400)#5,713 |
| 87. | Aiken | 0.70% | 0.60%(+0.100)#87 | 1.2%(-0.500)#5,949 |
| 88. | Conway | 0.70% | 0.60%(+0.100)#88 | 1.2%(-0.500)#5,984 |
| 89. | Inman | 0.70% | 0.60%(+0.100)#89 | 1.2%(-0.500)#6,223 |
| 90. | Timmonsville | 0.70% | 0.60%(+0.100)#90 | 1.2%(-0.500)#6,258 |
| 91. | Blackville | 0.70% | 0.60%(+0.100)#91 | 1.2%(-0.500)#6,268 |
| 92. | Holly Hill | 0.70% | 0.60%(+0.100)#92 | 1.2%(-0.500)#6,312 |
| 93. | Branchville | 0.70% | 0.60%(+0.100)#93 | 1.2%(-0.500)#6,319 |
| 94. | Charleston | 0.60% | 0.60%(=0.000)#94 | 1.2%(-0.600)#6,455 |
| 95. | Columbia | 0.60% | 0.60%(=0.000)#95 | 1.2%(-0.600)#6,461 |
| 96. | Sumter | 0.60% | 0.60%(=0.000)#96 | 1.2%(-0.600)#6,513 |
| 97. | Simpsonville | 0.60% | 0.60%(=0.000)#97 | 1.2%(-0.600)#6,567 |
| 98. | Lexington | 0.60% | 0.60%(=0.000)#98 | 1.2%(-0.600)#6,572 |
| 99. | Red Hill | 0.60% | 0.60%(=0.000)#99 | 1.2%(-0.600)#6,632 |
| 100. | Orangeburg | 0.60% | 0.60%(=0.000)#100 | 1.2%(-0.600)#6,662 |
Common Questions
What are the Top 10 Cities with the Highest Percentage of Households Heated without Fuel in South Carolina?
Top 10 Cities with the Highest Percentage of Households Heated without Fuel in South Carolina are:
#1
18.7%
#2
7.8%
#3
7.0%
#4
6.7%
#5
6.6%
#6
5.7%
#7
5.5%
#8
5.5%
#9
4.5%
#10
4.1%
What city has the Highest Percentage of Households Heated without Fuel in South Carolina?
City View has the Highest Percentage of Households Heated without Fuel in South Carolina with 18.7%.
What is the Percentage of Households Heated without Fuel in the State of South Carolina?
Percentage of Households Heated without Fuel in South Carolina is 0.60%.
What is the Percentage of Households Heated without Fuel in the United States?
Percentage of Households Heated without Fuel in the United States is 1.2%.