Cities with the Highest Percentage of Households Heated without Fuel in New York
RELATED REPORTS & OPTIONS
Fuel-less Heating
New York
Compare Cities
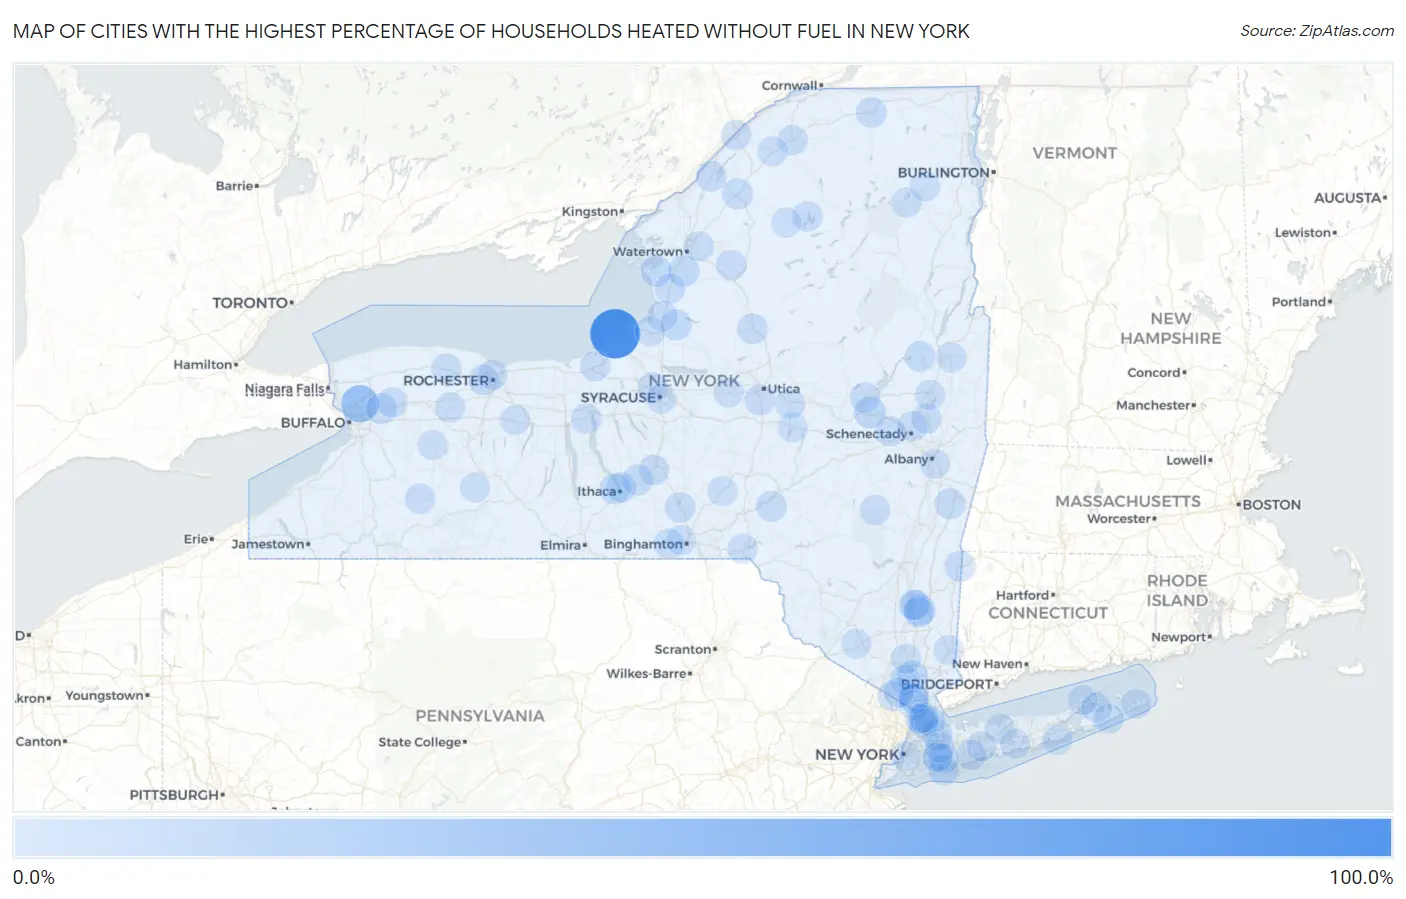
Map of Cities with the Highest Percentage of Households Heated without Fuel in New York
0.0%
100.0%
Cities with the Highest Percentage of Households Heated without Fuel in New York
| City | Fuel-less Heating | vs State | vs National | |
| 1. | Suny Oswego | 100.0% | 1.5%(+98.5)#1 | 1.2%(+98.8)#1 |
| 2. | University At Buffalo | 37.0% | 1.5%(+35.5)#2 | 1.2%(+35.8)#457 |
| 3. | Tribes Hill | 9.9% | 1.5%(+8.40)#3 | 1.2%(+8.70)#648 |
| 4. | Rodman | 7.4% | 1.5%(+5.90)#4 | 1.2%(+6.20)#765 |
| 5. | Henderson | 7.0% | 1.5%(+5.50)#5 | 1.2%(+5.80)#793 |
| 6. | Northwest Ithaca | 6.9% | 1.5%(+5.40)#6 | 1.2%(+5.70)#800 |
| 7. | Titusville | 6.1% | 1.5%(+4.60)#7 | 1.2%(+4.90)#889 |
| 8. | Crugers | 5.7% | 1.5%(+4.20)#8 | 1.2%(+4.50)#939 |
| 9. | Altmar | 5.5% | 1.5%(+4.00)#9 | 1.2%(+4.30)#966 |
| 10. | Millerton | 5.3% | 1.5%(+3.80)#10 | 1.2%(+4.10)#990 |
| 11. | Gouverneur | 5.2% | 1.5%(+3.70)#11 | 1.2%(+4.00)#1,006 |
| 12. | Chatham | 5.0% | 1.5%(+3.50)#12 | 1.2%(+3.80)#1,045 |
| 13. | Freeville | 4.8% | 1.5%(+3.30)#13 | 1.2%(+3.60)#1,089 |
| 14. | Clarence | 4.7% | 1.5%(+3.20)#14 | 1.2%(+3.50)#1,103 |
| 15. | Franklin | 4.6% | 1.5%(+3.10)#15 | 1.2%(+3.40)#1,132 |
| 16. | Hammond | 4.5% | 1.5%(+3.00)#16 | 1.2%(+3.30)#1,161 |
| 17. | Chadwicks | 4.4% | 1.5%(+2.90)#17 | 1.2%(+3.20)#1,188 |
| 18. | Nyack | 4.3% | 1.5%(+2.80)#18 | 1.2%(+3.10)#1,206 |
| 19. | Munsons Corners | 4.3% | 1.5%(+2.80)#19 | 1.2%(+3.10)#1,210 |
| 20. | Boonville | 4.3% | 1.5%(+2.80)#20 | 1.2%(+3.10)#1,213 |
| 21. | Hadley | 4.2% | 1.5%(+2.70)#21 | 1.2%(+3.00)#1,243 |
| 22. | Whitney Point | 3.9% | 1.5%(+2.40)#22 | 1.2%(+2.70)#1,301 |
| 23. | Manorhaven | 3.8% | 1.5%(+2.30)#23 | 1.2%(+2.60)#1,320 |
| 24. | Malone | 3.8% | 1.5%(+2.30)#24 | 1.2%(+2.60)#1,321 |
| 25. | Gates | 3.8% | 1.5%(+2.30)#25 | 1.2%(+2.60)#1,323 |
| 26. | Pulaski | 3.7% | 1.5%(+2.20)#26 | 1.2%(+2.50)#1,365 |
| 27. | Castorland | 3.6% | 1.5%(+2.10)#27 | 1.2%(+2.40)#1,408 |
| 28. | Fort Covington | 3.5% | 1.5%(+2.00)#28 | 1.2%(+2.30)#1,434 |
| 29. | Windham | 3.5% | 1.5%(+2.00)#29 | 1.2%(+2.30)#1,445 |
| 30. | East Glenville | 3.2% | 1.5%(+1.70)#30 | 1.2%(+2.00)#1,529 |
| 31. | Ogdensburg | 3.1% | 1.5%(+1.60)#31 | 1.2%(+1.90)#1,568 |
| 32. | Cranberry Lake | 3.1% | 1.5%(+1.60)#32 | 1.2%(+1.90)#1,603 |
| 33. | Elmont | 3.0% | 1.5%(+1.50)#33 | 1.2%(+1.80)#1,609 |
| 34. | Liverpool | 3.0% | 1.5%(+1.50)#34 | 1.2%(+1.80)#1,636 |
| 35. | Rushford | 2.9% | 1.5%(+1.40)#35 | 1.2%(+1.70)#1,693 |
| 36. | Seneca Falls | 2.8% | 1.5%(+1.30)#36 | 1.2%(+1.60)#1,718 |
| 37. | Le Roy | 2.8% | 1.5%(+1.30)#37 | 1.2%(+1.60)#1,725 |
| 38. | Mariaville Lake | 2.8% | 1.5%(+1.30)#38 | 1.2%(+1.60)#1,754 |
| 39. | New York | 2.7% | 1.5%(+1.20)#39 | 1.2%(+1.50)#1,761 |
| 40. | Gloversville | 2.7% | 1.5%(+1.20)#40 | 1.2%(+1.50)#1,772 |
| 41. | Arlington | 2.7% | 1.5%(+1.20)#41 | 1.2%(+1.50)#1,790 |
| 42. | Airmont | 2.6% | 1.5%(+1.10)#42 | 1.2%(+1.40)#1,842 |
| 43. | Island Park | 2.6% | 1.5%(+1.10)#43 | 1.2%(+1.40)#1,849 |
| 44. | Red Oaks Mill | 2.6% | 1.5%(+1.10)#44 | 1.2%(+1.40)#1,852 |
| 45. | North Haven | 2.6% | 1.5%(+1.10)#45 | 1.2%(+1.40)#1,883 |
| 46. | Red Creek | 2.6% | 1.5%(+1.10)#46 | 1.2%(+1.40)#1,885 |
| 47. | Poughkeepsie | 2.5% | 1.5%(+1.00)#47 | 1.2%(+1.30)#1,907 |
| 48. | North Amityville | 2.5% | 1.5%(+1.00)#48 | 1.2%(+1.30)#1,909 |
| 49. | West Haverstraw | 2.5% | 1.5%(+1.00)#49 | 1.2%(+1.30)#1,922 |
| 50. | Potsdam | 2.5% | 1.5%(+1.00)#50 | 1.2%(+1.30)#1,927 |
| 51. | Endicott | 2.3% | 1.5%(+0.800)#51 | 1.2%(+1.10)#2,090 |
| 52. | Black River | 2.3% | 1.5%(+0.800)#52 | 1.2%(+1.10)#2,129 |
| 53. | East Hampton | 2.3% | 1.5%(+0.800)#53 | 1.2%(+1.10)#2,136 |
| 54. | Pierrepont Manor | 2.3% | 1.5%(+0.800)#54 | 1.2%(+1.10)#2,167 |
| 55. | Bronxville | 2.2% | 1.5%(+0.700)#55 | 1.2%(+1.00)#2,194 |
| 56. | Country Knolls | 2.2% | 1.5%(+0.700)#56 | 1.2%(+1.00)#2,196 |
| 57. | Cayuga Heights | 2.2% | 1.5%(+0.700)#57 | 1.2%(+1.00)#2,202 |
| 58. | Akron | 2.2% | 1.5%(+0.700)#58 | 1.2%(+1.00)#2,209 |
| 59. | Holley | 2.2% | 1.5%(+0.700)#59 | 1.2%(+1.00)#2,223 |
| 60. | St James | 2.0% | 1.5%(+0.500)#60 | 1.2%(+0.800)#2,426 |
| 61. | Canton | 2.0% | 1.5%(+0.500)#61 | 1.2%(+0.800)#2,442 |
| 62. | Lakeview | 2.0% | 1.5%(+0.500)#62 | 1.2%(+0.800)#2,448 |
| 63. | Radisson | 1.9% | 1.5%(+0.400)#63 | 1.2%(+0.700)#2,577 |
| 64. | Southold | 1.9% | 1.5%(+0.400)#64 | 1.2%(+0.700)#2,584 |
| 65. | Hampton Manor | 1.9% | 1.5%(+0.400)#65 | 1.2%(+0.700)#2,593 |
| 66. | Piermont | 1.9% | 1.5%(+0.400)#66 | 1.2%(+0.700)#2,613 |
| 67. | Oxford | 1.9% | 1.5%(+0.400)#67 | 1.2%(+0.700)#2,635 |
| 68. | Vernon | 1.9% | 1.5%(+0.400)#68 | 1.2%(+0.700)#2,639 |
| 69. | New Rochelle | 1.8% | 1.5%(+0.300)#69 | 1.2%(+0.600)#2,687 |
| 70. | Carmel | 1.8% | 1.5%(+0.300)#70 | 1.2%(+0.600)#2,729 |
| 71. | Sparrow Bush | 1.8% | 1.5%(+0.300)#71 | 1.2%(+0.600)#2,802 |
| 72. | Richfield Springs | 1.8% | 1.5%(+0.300)#72 | 1.2%(+0.600)#2,804 |
| 73. | Star Lake | 1.8% | 1.5%(+0.300)#73 | 1.2%(+0.600)#2,831 |
| 74. | Canaseraga | 1.8% | 1.5%(+0.300)#74 | 1.2%(+0.600)#2,837 |
| 75. | North Patchogue | 1.7% | 1.5%(+0.200)#75 | 1.2%(+0.500)#2,905 |
| 76. | Hudson Falls | 1.7% | 1.5%(+0.200)#76 | 1.2%(+0.500)#2,907 |
| 77. | South Nyack | 1.7% | 1.5%(+0.200)#77 | 1.2%(+0.500)#2,938 |
| 78. | Westhampton Beach | 1.7% | 1.5%(+0.200)#78 | 1.2%(+0.500)#2,943 |
| 79. | Mount Vernon | 1.6% | 1.5%(+0.100)#79 | 1.2%(+0.400)#3,017 |
| 80. | Spring Valley | 1.6% | 1.5%(+0.100)#80 | 1.2%(+0.400)#3,027 |
| 81. | Middletown | 1.6% | 1.5%(+0.100)#81 | 1.2%(+0.400)#3,029 |
| 82. | Montauk | 1.6% | 1.5%(+0.100)#82 | 1.2%(+0.400)#3,093 |
| 83. | Manhasset Hills | 1.6% | 1.5%(+0.100)#83 | 1.2%(+0.400)#3,100 |
| 84. | Mohawk | 1.6% | 1.5%(+0.100)#84 | 1.2%(+0.400)#3,113 |
| 85. | Brewster | 1.6% | 1.5%(+0.100)#85 | 1.2%(+0.400)#3,114 |
| 86. | Deposit | 1.6% | 1.5%(+0.100)#86 | 1.2%(+0.400)#3,141 |
| 87. | Yonkers | 1.5% | 1.5%(=0.000)#87 | 1.2%(+0.300)#3,212 |
| 88. | Saratoga Springs | 1.5% | 1.5%(=0.000)#88 | 1.2%(+0.300)#3,232 |
| 89. | Deer Park | 1.5% | 1.5%(=0.000)#89 | 1.2%(+0.300)#3,233 |
| 90. | North Valley Stream | 1.5% | 1.5%(=0.000)#90 | 1.2%(+0.300)#3,247 |
| 91. | Warsaw | 1.5% | 1.5%(=0.000)#91 | 1.2%(+0.300)#3,323 |
| 92. | Fort Montgomery | 1.5% | 1.5%(=0.000)#92 | 1.2%(+0.300)#3,331 |
| 93. | Lake Placid | 1.5% | 1.5%(=0.000)#93 | 1.2%(+0.300)#3,339 |
| 94. | Bloomfield | 1.5% | 1.5%(=0.000)#94 | 1.2%(+0.300)#3,361 |
| 95. | Rochester | 1.4% | 1.5%(-0.100)#95 | 1.2%(+0.200)#3,418 |
| 96. | Johnson City | 1.4% | 1.5%(-0.100)#96 | 1.2%(+0.200)#3,462 |
| 97. | Tuckahoe | 1.4% | 1.5%(-0.100)#97 | 1.2%(+0.200)#3,502 |
| 98. | Mexico | 1.4% | 1.5%(-0.100)#98 | 1.2%(+0.200)#3,569 |
| 99. | Wilmington | 1.4% | 1.5%(-0.100)#99 | 1.2%(+0.200)#3,607 |
| 100. | Syracuse | 1.3% | 1.5%(-0.200)#100 | 1.2%(+0.100)#3,647 |
Common Questions
What are the Top 10 Cities with the Highest Percentage of Households Heated without Fuel in New York?
Top 10 Cities with the Highest Percentage of Households Heated without Fuel in New York are:
#1
100.0%
#2
37.0%
#3
9.9%
#4
7.4%
#5
7.0%
#6
6.9%
#7
6.1%
#8
5.7%
#9
5.5%
#10
5.3%
What city has the Highest Percentage of Households Heated without Fuel in New York?
SUNY Oswego has the Highest Percentage of Households Heated without Fuel in New York with 100.0%.
What is the Percentage of Households Heated without Fuel in the State of New York?
Percentage of Households Heated without Fuel in New York is 1.5%.
What is the Percentage of Households Heated without Fuel in the United States?
Percentage of Households Heated without Fuel in the United States is 1.2%.