El Monte, CA Map & Demographics
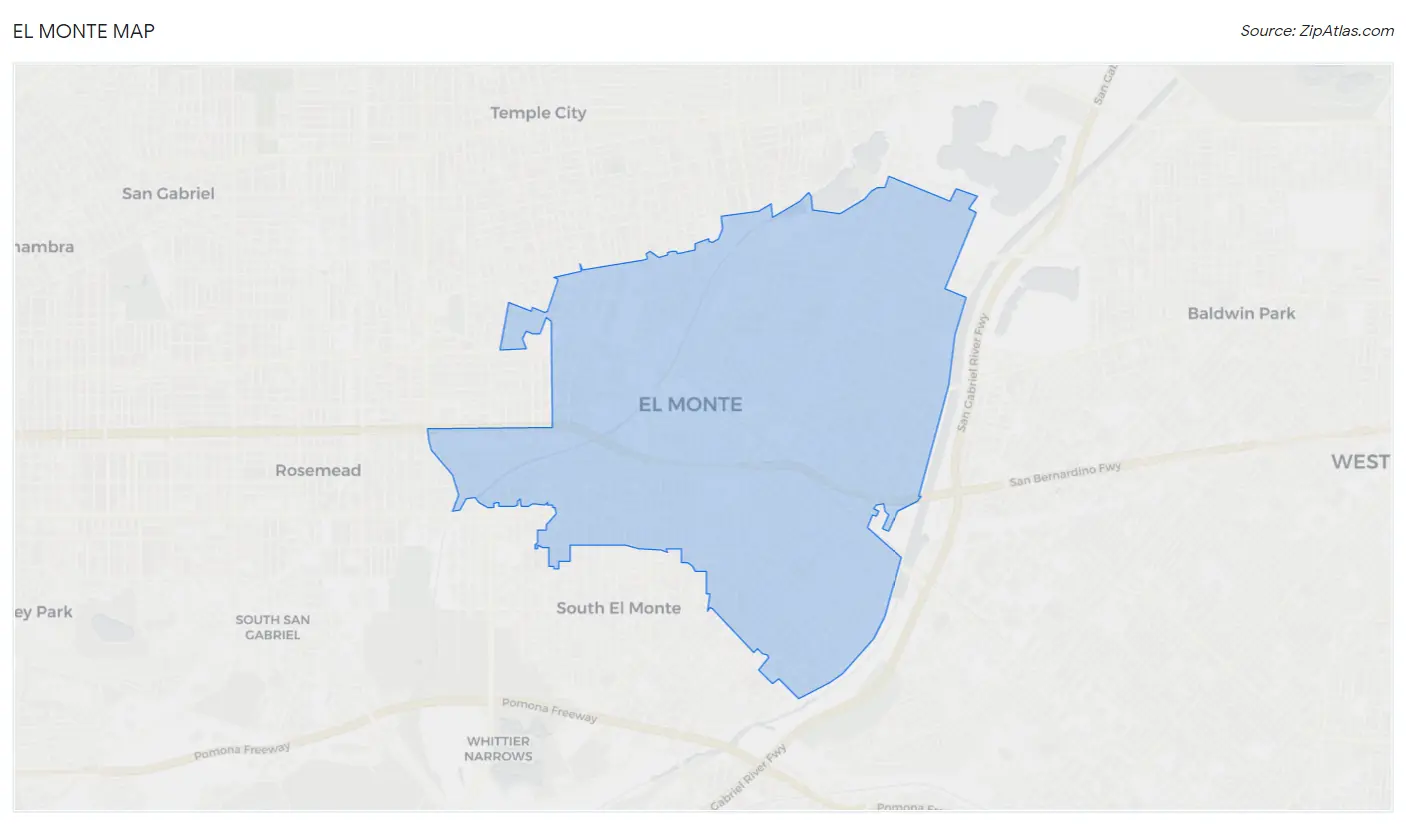
El Monte Map
El Monte Overview
$22,865
PER CAPITA INCOME
$64,560
AVG FAMILY INCOME
$59,929
AVG HOUSEHOLD INCOME
18.2%
WAGE / INCOME GAP [ % ]
81.8¢/ $1
WAGE / INCOME GAP [ $ ]
$10,171
FAMILY INCOME DEFICIT
0.44
INEQUALITY / GINI INDEX
108,682
TOTAL POPULATION
54,901
MALE POPULATION
53,781
FEMALE POPULATION
102.08
MALES / 100 FEMALES
97.96
FEMALES / 100 MALES
37.4
MEDIAN AGE
4.0
AVG FAMILY SIZE
3.6
AVG HOUSEHOLD SIZE
53,662
LABOR FORCE [ PEOPLE ]
61.4%
PERCENT IN LABOR FORCE
7.0%
UNEMPLOYMENT RATE
Income in El Monte
Income Overview in El Monte
Per Capita Income in El Monte is $22,865, while median incomes of families and households are $64,560 and $59,929 respectively.
| Characteristic | Number | Measure |
| Per Capita Income | 108,682 | $22,865 |
| Median Family Income | 23,753 | $64,560 |
| Mean Family Income | 23,753 | $83,563 |
| Median Household Income | 29,660 | $59,929 |
| Mean Household Income | 29,660 | $79,013 |
| Income Deficit | 23,753 | $10,171 |
| Wage / Income Gap (%) | 108,682 | 18.21% |
| Wage / Income Gap ($) | 108,682 | 81.79¢ per $1 |
| Gini / Inequality Index | 108,682 | 0.44 |
Earnings by Sex in El Monte
Average Earnings in El Monte are $30,200, $33,136 for men and $27,103 for women, a difference of 18.2%.
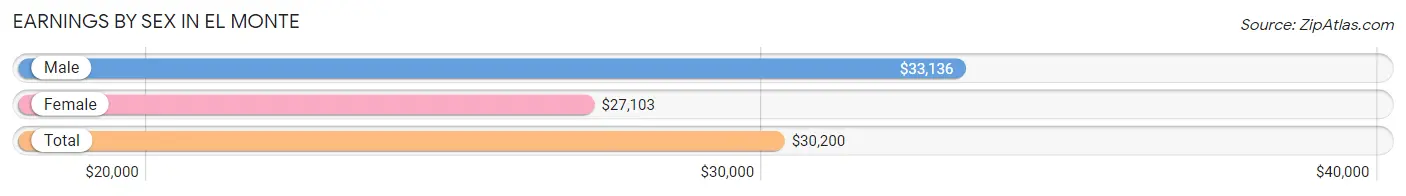
| Sex | Number | Average Earnings |
| Male | 30,629 (56.2%) | $33,136 |
| Female | 23,872 (43.8%) | $27,103 |
| Total | 54,501 (100.0%) | $30,200 |
Earnings by Sex by Income Bracket in El Monte
The most common earnings brackets in El Monte are $25,000 to $29,999 for men (3,077 | 10.1%) and $25,000 to $29,999 for women (2,304 | 9.7%).
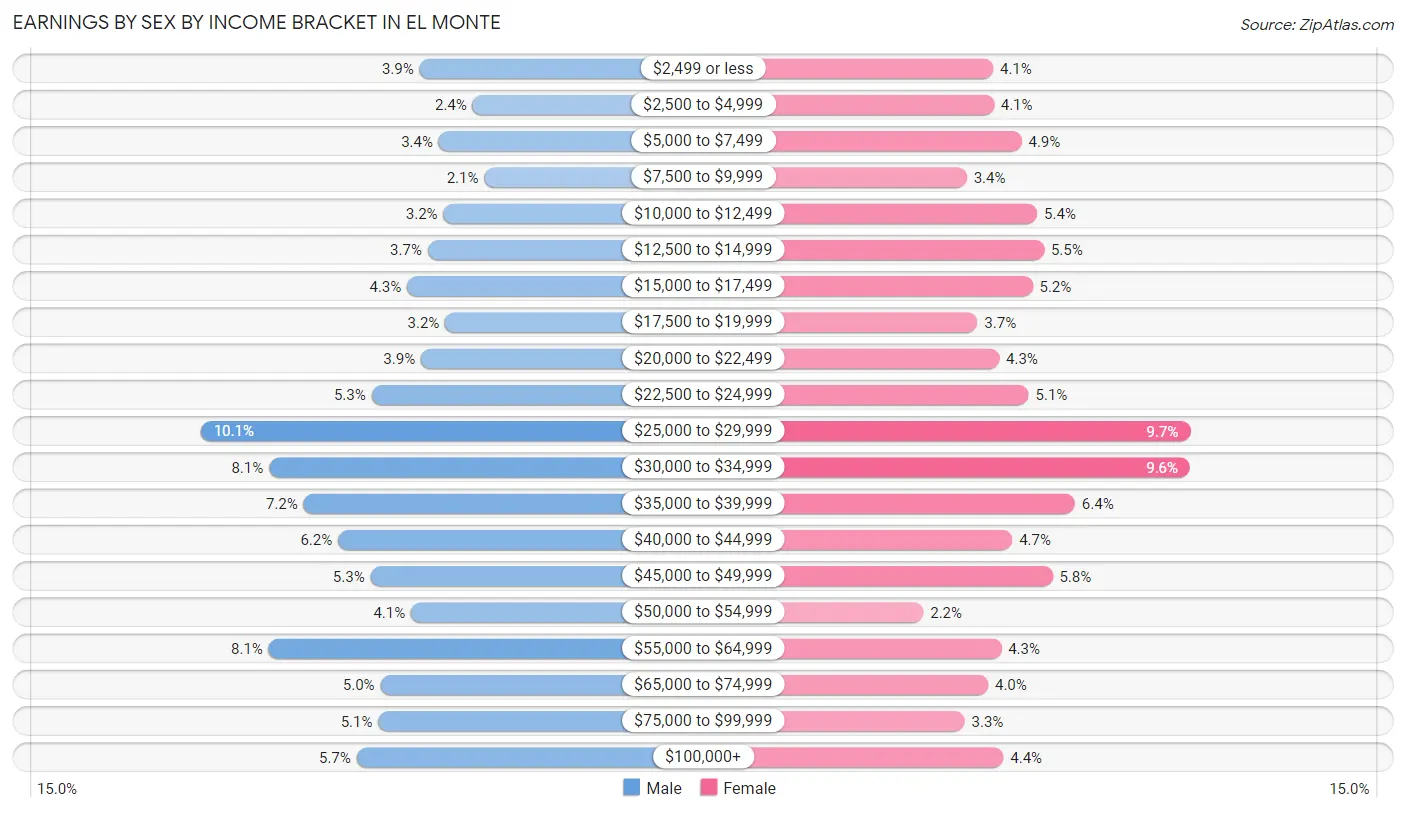
| Income | Male | Female |
| $2,499 or less | 1,194 (3.9%) | 981 (4.1%) |
| $2,500 to $4,999 | 737 (2.4%) | 986 (4.1%) |
| $5,000 to $7,499 | 1,029 (3.4%) | 1,171 (4.9%) |
| $7,500 to $9,999 | 638 (2.1%) | 804 (3.4%) |
| $10,000 to $12,499 | 990 (3.2%) | 1,278 (5.3%) |
| $12,500 to $14,999 | 1,124 (3.7%) | 1,323 (5.5%) |
| $15,000 to $17,499 | 1,301 (4.3%) | 1,247 (5.2%) |
| $17,500 to $19,999 | 975 (3.2%) | 877 (3.7%) |
| $20,000 to $22,499 | 1,182 (3.9%) | 1,021 (4.3%) |
| $22,500 to $24,999 | 1,607 (5.2%) | 1,221 (5.1%) |
| $25,000 to $29,999 | 3,077 (10.1%) | 2,304 (9.7%) |
| $30,000 to $34,999 | 2,490 (8.1%) | 2,302 (9.6%) |
| $35,000 to $39,999 | 2,194 (7.2%) | 1,530 (6.4%) |
| $40,000 to $44,999 | 1,895 (6.2%) | 1,111 (4.6%) |
| $45,000 to $49,999 | 1,617 (5.3%) | 1,379 (5.8%) |
| $50,000 to $54,999 | 1,269 (4.1%) | 514 (2.1%) |
| $55,000 to $64,999 | 2,492 (8.1%) | 1,035 (4.3%) |
| $65,000 to $74,999 | 1,532 (5.0%) | 947 (4.0%) |
| $75,000 to $99,999 | 1,550 (5.1%) | 791 (3.3%) |
| $100,000+ | 1,736 (5.7%) | 1,050 (4.4%) |
| Total | 30,629 (100.0%) | 23,872 (100.0%) |
Earnings by Sex by Educational Attainment in El Monte
Average earnings in El Monte are $35,971 for men and $29,252 for women, a difference of 18.7%. Men with an educational attainment of graduate degree enjoy the highest average annual earnings of $69,077, while those with less than high school education earn the least with $30,620. Women with an educational attainment of graduate degree earn the most with the average annual earnings of $65,227, while those with less than high school education have the smallest earnings of $22,392.
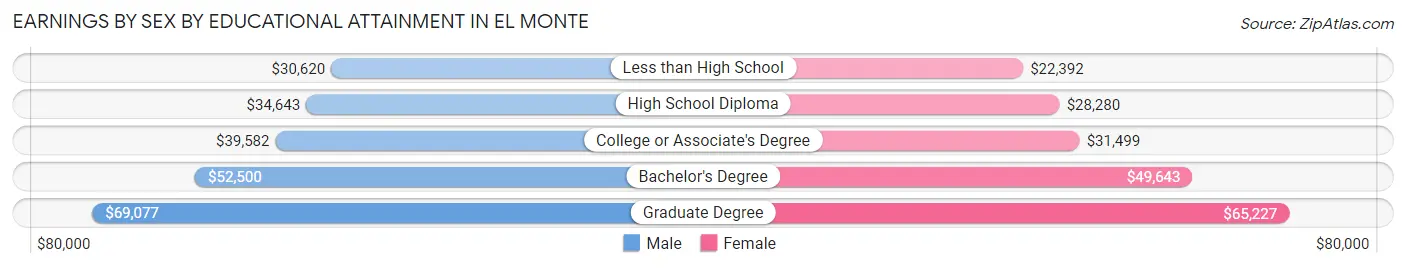
| Educational Attainment | Male Income | Female Income |
| Less than High School | $30,620 | $22,392 |
| High School Diploma | $34,643 | $28,280 |
| College or Associate's Degree | $39,582 | $31,499 |
| Bachelor's Degree | $52,500 | $49,643 |
| Graduate Degree | $69,077 | $65,227 |
| Total | $35,971 | $29,252 |
Family Income in El Monte
Family Income Brackets in El Monte
According to the El Monte family income data, there are 4,869 families falling into the $50,000 to $74,999 income range, which is the most common income bracket and makes up 20.5% of all families. Conversely, the $10,000 to $14,999 income bracket is the least frequent group with only 523 families (2.2%) belonging to this category.
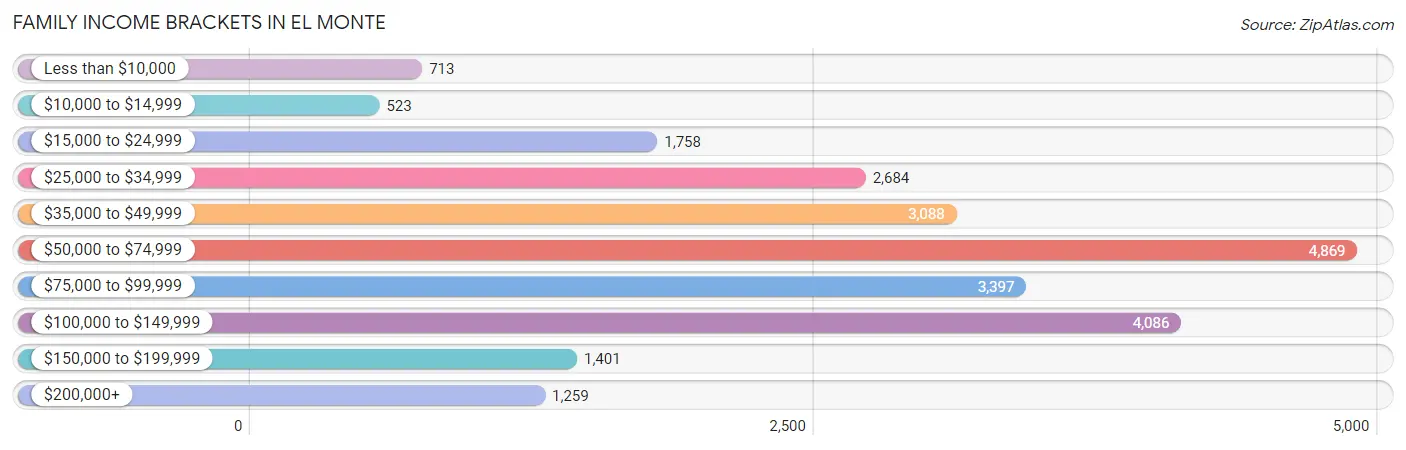
| Income Bracket | # Families | % Families |
| Less than $10,000 | 713 | 3.0% |
| $10,000 to $14,999 | 523 | 2.2% |
| $15,000 to $24,999 | 1,758 | 7.4% |
| $25,000 to $34,999 | 2,684 | 11.3% |
| $35,000 to $49,999 | 3,088 | 13.0% |
| $50,000 to $74,999 | 4,869 | 20.5% |
| $75,000 to $99,999 | 3,397 | 14.3% |
| $100,000 to $149,999 | 4,086 | 17.2% |
| $150,000 to $199,999 | 1,401 | 5.9% |
| $200,000+ | 1,259 | 5.3% |
Family Income by Famaliy Size in El Monte
7+ person families (1,245 | 5.2%) account for the highest median family income in El Monte with $121,275 per family, while 2-person families (6,294 | 26.5%) have the highest median income of $23,962 per family member.
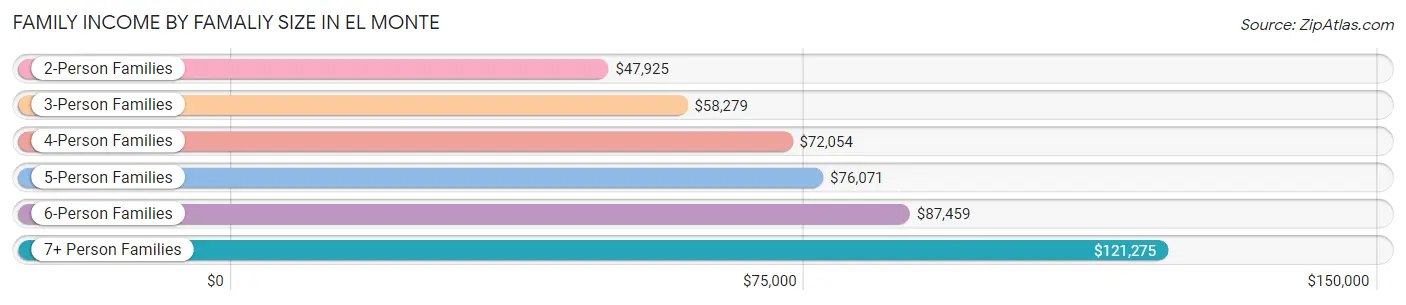
| Income Bracket | # Families | Median Income |
| 2-Person Families | 6,294 (26.5%) | $47,925 |
| 3-Person Families | 5,981 (25.2%) | $58,279 |
| 4-Person Families | 5,138 (21.6%) | $72,054 |
| 5-Person Families | 3,450 (14.5%) | $76,071 |
| 6-Person Families | 1,645 (6.9%) | $87,459 |
| 7+ Person Families | 1,245 (5.2%) | $121,275 |
| Total | 23,753 (100.0%) | $64,560 |
Family Income by Number of Earners in El Monte
The median family income in El Monte is $64,560, with families comprising 3+ earners (5,536) having the highest median family income of $111,326, while families with no earners (2,350) have the lowest median family income of $22,483, accounting for 23.3% and 9.9% of families, respectively.
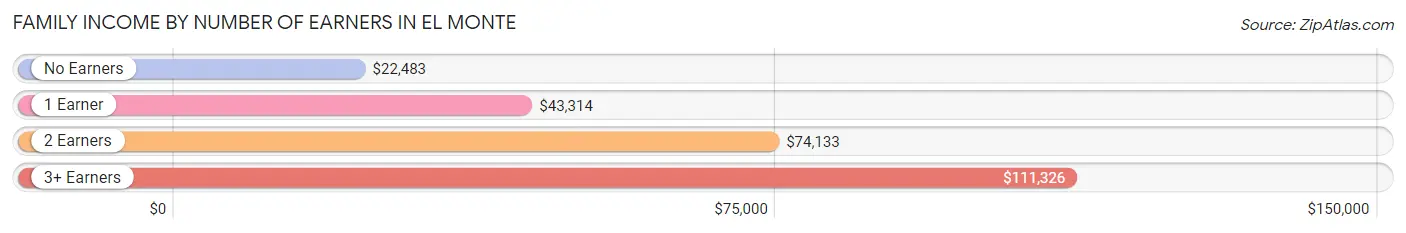
| Number of Earners | # Families | Median Income |
| No Earners | 2,350 (9.9%) | $22,483 |
| 1 Earner | 7,464 (31.4%) | $43,314 |
| 2 Earners | 8,403 (35.4%) | $74,133 |
| 3+ Earners | 5,536 (23.3%) | $111,326 |
| Total | 23,753 (100.0%) | $64,560 |
Household Income in El Monte
Household Income Brackets in El Monte
With 5,754 households falling in the category, the $50,000 to $74,999 income range is the most frequent in El Monte, accounting for 19.4% of all households. In contrast, only 1,157 households (3.9%) fall into the less than $10,000 income bracket, making it the least populous group.
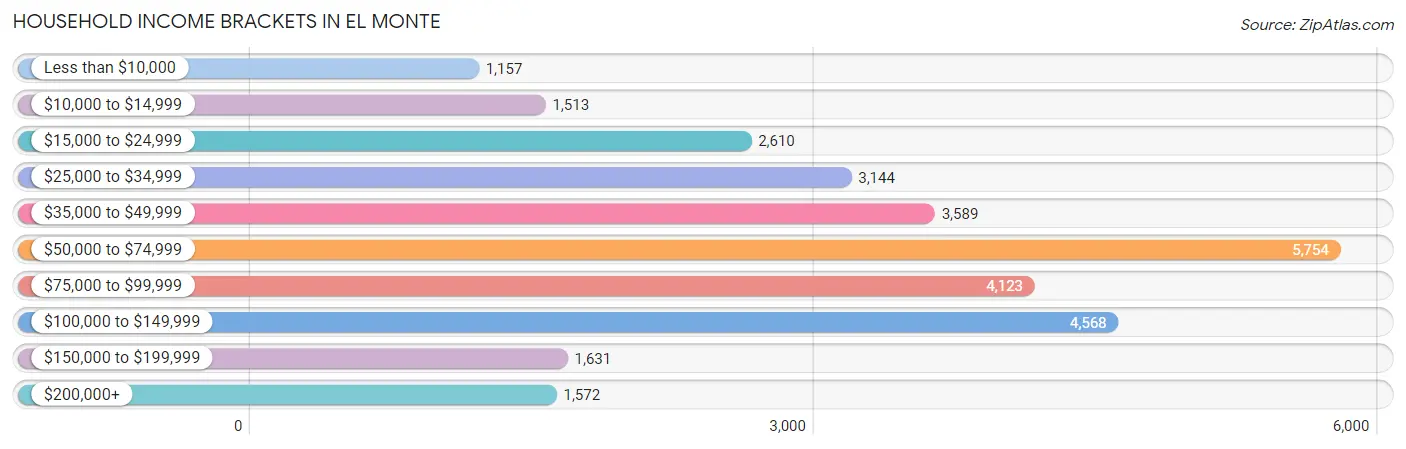
| Income Bracket | # Households | % Households |
| Less than $10,000 | 1,157 | 3.9% |
| $10,000 to $14,999 | 1,513 | 5.1% |
| $15,000 to $24,999 | 2,610 | 8.8% |
| $25,000 to $34,999 | 3,144 | 10.6% |
| $35,000 to $49,999 | 3,589 | 12.1% |
| $50,000 to $74,999 | 5,754 | 19.4% |
| $75,000 to $99,999 | 4,123 | 13.9% |
| $100,000 to $149,999 | 4,568 | 15.4% |
| $150,000 to $199,999 | 1,631 | 5.5% |
| $200,000+ | 1,572 | 5.3% |
Household Income by Householder Age in El Monte
The median household income in El Monte is $59,929, with the highest median household income of $69,754 found in the 45 to 64 years age bracket for the primary householder. A total of 12,529 households (42.2%) fall into this category. Meanwhile, the 65+ years age bracket for the primary householder has the lowest median household income of $37,776, with 6,834 households (23.0%) in this group.
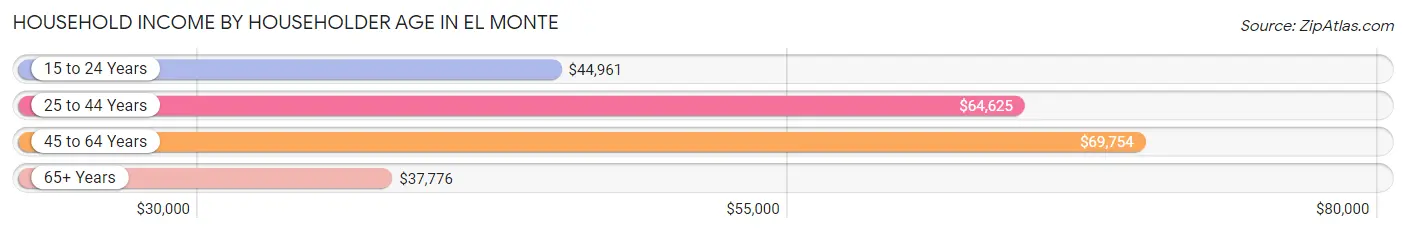
| Income Bracket | # Households | Median Income |
| 15 to 24 Years | 944 (3.2%) | $44,961 |
| 25 to 44 Years | 9,353 (31.5%) | $64,625 |
| 45 to 64 Years | 12,529 (42.2%) | $69,754 |
| 65+ Years | 6,834 (23.0%) | $37,776 |
| Total | 29,660 (100.0%) | $59,929 |
Poverty in El Monte
Income Below Poverty by Sex and Age in El Monte
With 15.8% poverty level for males and 18.1% for females among the residents of El Monte, 15 year old males and 12 to 14 year old females are the most vulnerable to poverty, with 240 males (33.8%) and 601 females (28.7%) in their respective age groups living below the poverty level.
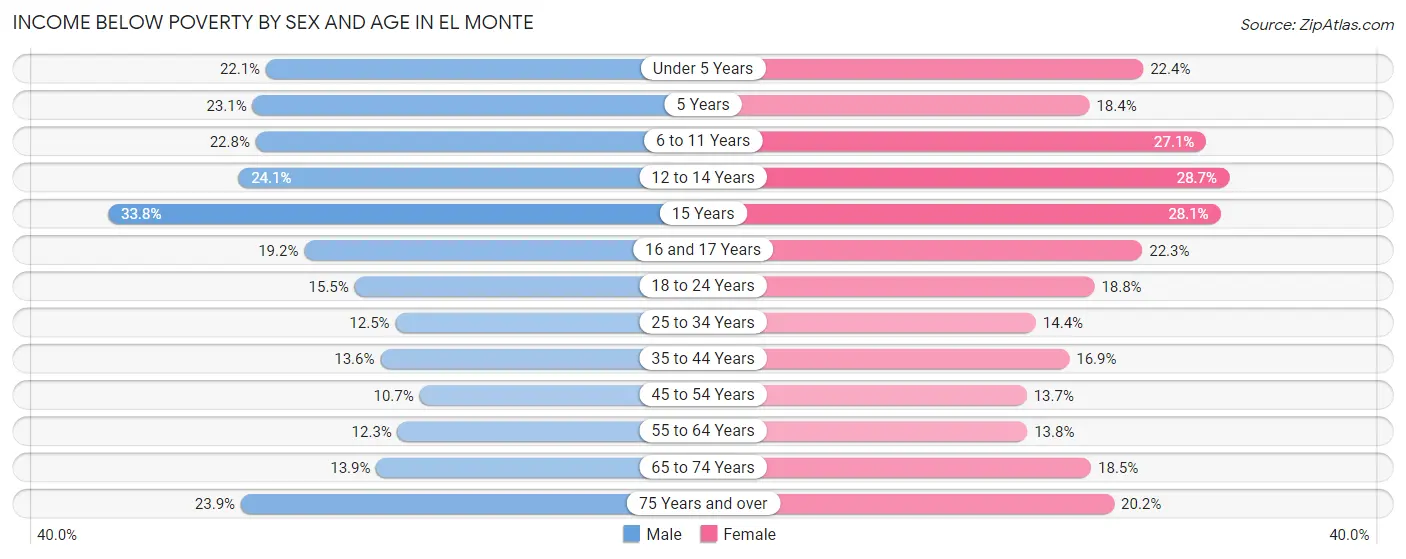
| Age Bracket | Male | Female |
| Under 5 Years | 786 (22.1%) | 610 (22.4%) |
| 5 Years | 135 (23.1%) | 126 (18.4%) |
| 6 to 11 Years | 856 (22.8%) | 1,044 (27.1%) |
| 12 to 14 Years | 496 (24.1%) | 601 (28.7%) |
| 15 Years | 240 (33.8%) | 242 (28.1%) |
| 16 and 17 Years | 315 (19.2%) | 303 (22.3%) |
| 18 to 24 Years | 883 (15.5%) | 1,015 (18.8%) |
| 25 to 34 Years | 971 (12.5%) | 1,051 (14.4%) |
| 35 to 44 Years | 1,059 (13.6%) | 1,153 (16.9%) |
| 45 to 54 Years | 770 (10.7%) | 1,047 (13.7%) |
| 55 to 64 Years | 822 (12.3%) | 831 (13.8%) |
| 65 to 74 Years | 578 (13.9%) | 881 (18.5%) |
| 75 Years and over | 640 (23.9%) | 733 (20.2%) |
| Total | 8,551 (15.8%) | 9,637 (18.1%) |
Income Above Poverty by Sex and Age in El Monte
According to the poverty statistics in El Monte, males aged 45 to 54 years and females aged 45 to 54 years are the age groups that are most secure financially, with 89.3% of males and 86.3% of females in these age groups living above the poverty line.
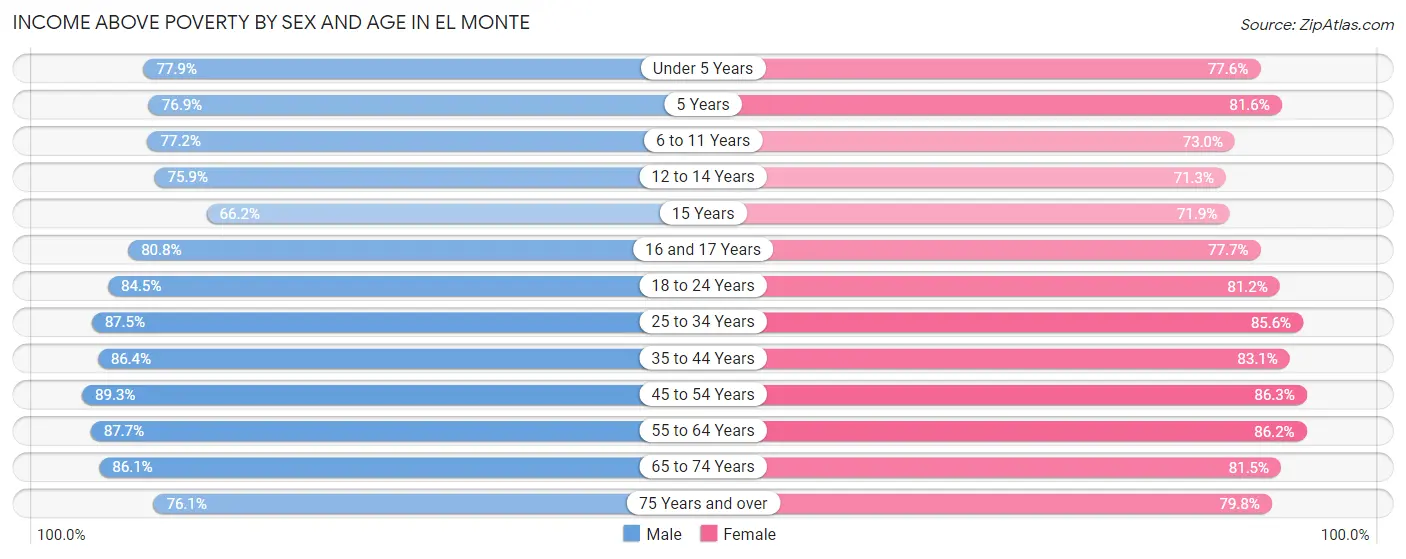
| Age Bracket | Male | Female |
| Under 5 Years | 2,774 (77.9%) | 2,116 (77.6%) |
| 5 Years | 450 (76.9%) | 559 (81.6%) |
| 6 to 11 Years | 2,892 (77.2%) | 2,815 (73.0%) |
| 12 to 14 Years | 1,559 (75.9%) | 1,491 (71.3%) |
| 15 Years | 470 (66.2%) | 619 (71.9%) |
| 16 and 17 Years | 1,322 (80.8%) | 1,055 (77.7%) |
| 18 to 24 Years | 4,815 (84.5%) | 4,396 (81.2%) |
| 25 to 34 Years | 6,814 (87.5%) | 6,244 (85.6%) |
| 35 to 44 Years | 6,736 (86.4%) | 5,675 (83.1%) |
| 45 to 54 Years | 6,437 (89.3%) | 6,580 (86.3%) |
| 55 to 64 Years | 5,861 (87.7%) | 5,206 (86.2%) |
| 65 to 74 Years | 3,584 (86.1%) | 3,879 (81.5%) |
| 75 Years and over | 2,033 (76.1%) | 2,893 (79.8%) |
| Total | 45,747 (84.3%) | 43,528 (81.9%) |
Income Below Poverty Among Married-Couple Families in El Monte
The poverty statistics for married-couple families in El Monte show that 8.9% or 1,223 of the total 13,736 families live below the poverty line. Families with 5 or more children have the highest poverty rate of 43.0%, comprising of 52 families. On the other hand, families with no children have the lowest poverty rate of 7.4%, which includes 558 families.
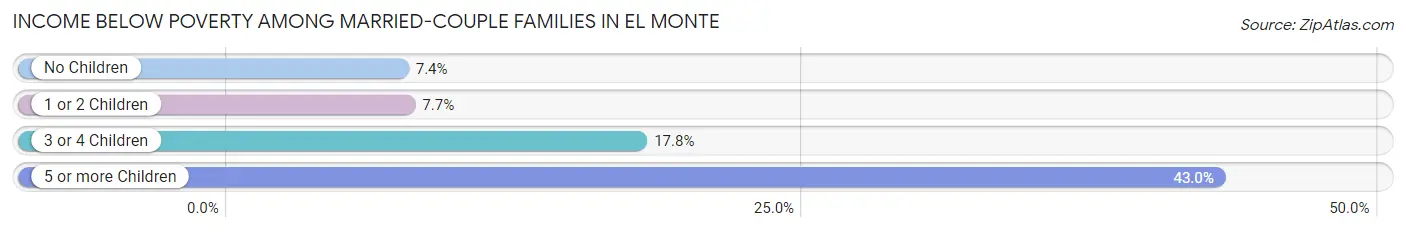
| Children | Above Poverty | Below Poverty |
| No Children | 6,952 (92.6%) | 558 (7.4%) |
| 1 or 2 Children | 4,338 (92.3%) | 363 (7.7%) |
| 3 or 4 Children | 1,154 (82.2%) | 250 (17.8%) |
| 5 or more Children | 69 (57.0%) | 52 (43.0%) |
| Total | 12,513 (91.1%) | 1,223 (8.9%) |
Income Below Poverty Among Single-Parent Households in El Monte
According to the poverty data in El Monte, 15.7% or 663 single-father households and 20.4% or 1,180 single-mother households are living below the poverty line. Among single-father households, those with 3 or 4 children have the highest poverty rate, with 162 households (39.6%) experiencing poverty. Likewise, among single-mother households, those with 5 or more children have the highest poverty rate, with 58 households (100.0%) falling below the poverty line.
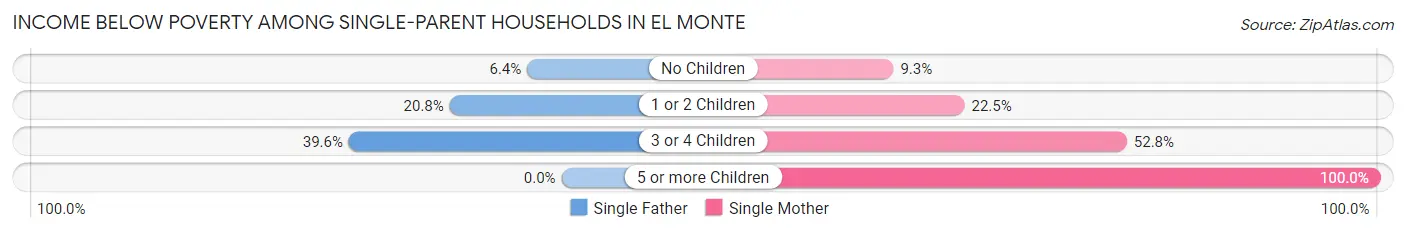
| Children | Single Father | Single Mother |
| No Children | 130 (6.4%) | 261 (9.3%) |
| 1 or 2 Children | 371 (20.8%) | 506 (22.5%) |
| 3 or 4 Children | 162 (39.6%) | 355 (52.7%) |
| 5 or more Children | 0 (0.0%) | 58 (100.0%) |
| Total | 663 (15.7%) | 1,180 (20.4%) |
Income Below Poverty Among Married-Couple vs Single-Parent Households in El Monte
The poverty data for El Monte shows that 1,223 of the married-couple family households (8.9%) and 1,843 of the single-parent households (18.4%) are living below the poverty level. Within the married-couple family households, those with 5 or more children have the highest poverty rate, with 52 households (43.0%) falling below the poverty line. Among the single-parent households, those with 5 or more children have the highest poverty rate, with 58 household (100.0%) living below poverty.
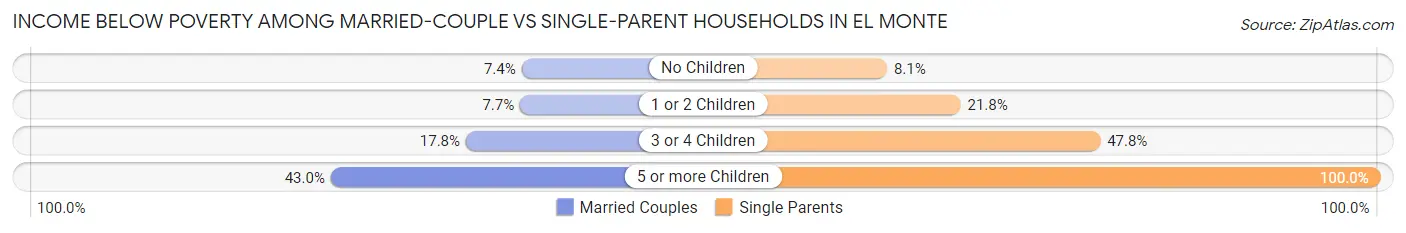
| Children | Married-Couple Families | Single-Parent Households |
| No Children | 558 (7.4%) | 391 (8.1%) |
| 1 or 2 Children | 363 (7.7%) | 877 (21.8%) |
| 3 or 4 Children | 250 (17.8%) | 517 (47.8%) |
| 5 or more Children | 52 (43.0%) | 58 (100.0%) |
| Total | 1,223 (8.9%) | 1,843 (18.4%) |
Race in El Monte
The most populous races in El Monte are Hispanic or Latino (71,088 | 65.4%), Asian (31,920 | 29.4%), and Some other Race (31,253 | 28.8%).
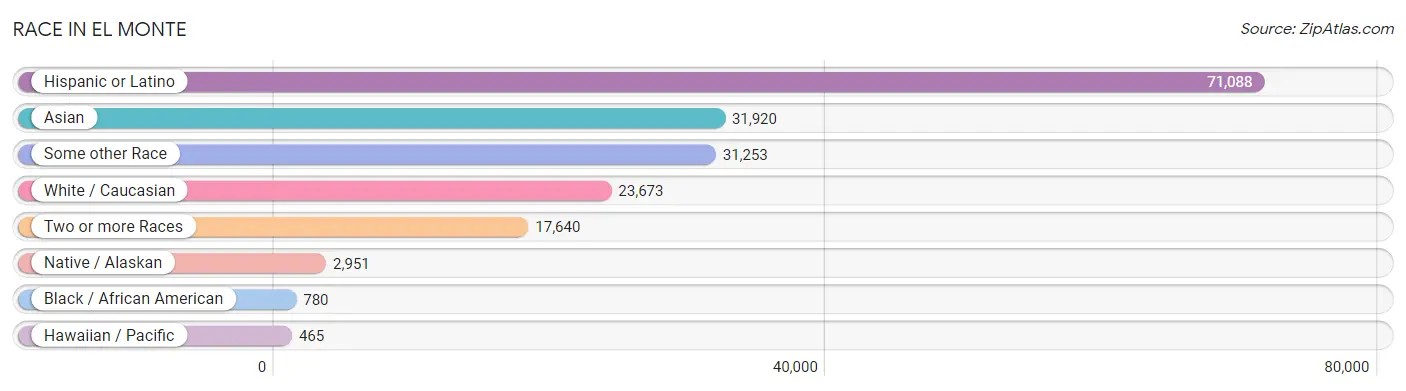
| Race | # Population | % Population |
| Asian | 31,920 | 29.4% |
| Black / African American | 780 | 0.7% |
| Hawaiian / Pacific | 465 | 0.4% |
| Hispanic or Latino | 71,088 | 65.4% |
| Native / Alaskan | 2,951 | 2.7% |
| White / Caucasian | 23,673 | 21.8% |
| Two or more Races | 17,640 | 16.2% |
| Some other Race | 31,253 | 28.8% |
| Total | 108,682 | 100.0% |
Ancestry in El Monte
The most populous ancestries reported in El Monte are Mexican (63,503 | 58.4%), Indian (Asian) (19,033 | 17.5%), Sri Lankan (11,223 | 10.3%), Central American (5,454 | 5.0%), and Salvadoran (2,694 | 2.5%), together accounting for 93.8% of all El Monte residents.
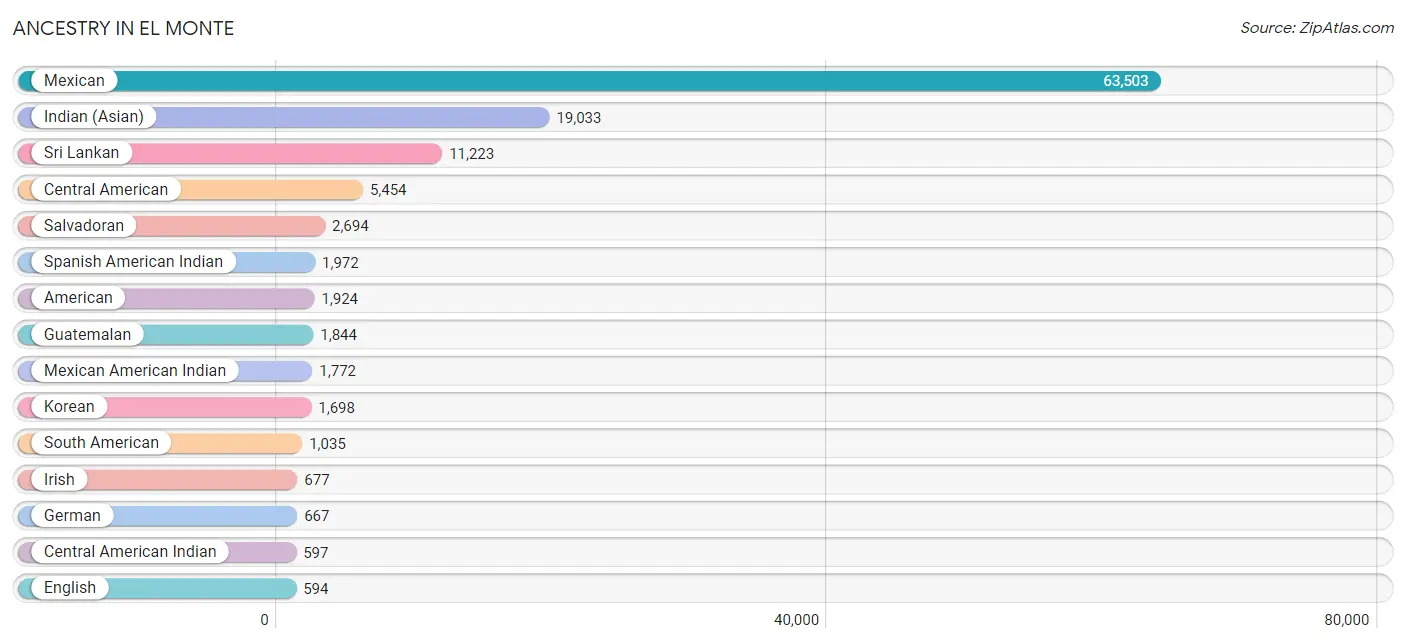
| Ancestry | # Population | % Population |
| African | 34 | 0.0% |
| American | 1,924 | 1.8% |
| Apache | 40 | 0.0% |
| Arab | 29 | 0.0% |
| Arapaho | 14 | 0.0% |
| Argentinean | 302 | 0.3% |
| Armenian | 15 | 0.0% |
| Australian | 32 | 0.0% |
| Basque | 38 | 0.0% |
| Belgian | 28 | 0.0% |
| Belizean | 14 | 0.0% |
| Bhutanese | 245 | 0.2% |
| Blackfeet | 7 | 0.0% |
| Bolivian | 25 | 0.0% |
| Brazilian | 29 | 0.0% |
| British | 18 | 0.0% |
| Burmese | 386 | 0.4% |
| Cajun | 11 | 0.0% |
| Central American | 5,454 | 5.0% |
| Central American Indian | 597 | 0.5% |
| Cherokee | 163 | 0.2% |
| Chilean | 64 | 0.1% |
| Chippewa | 8 | 0.0% |
| Choctaw | 61 | 0.1% |
| Colombian | 215 | 0.2% |
| Costa Rican | 32 | 0.0% |
| Cuban | 367 | 0.3% |
| Czech | 60 | 0.1% |
| Czechoslovakian | 4 | 0.0% |
| Danish | 96 | 0.1% |
| Dominican | 25 | 0.0% |
| Dutch | 81 | 0.1% |
| Egyptian | 5 | 0.0% |
| English | 594 | 0.5% |
| European | 276 | 0.3% |
| Filipino | 284 | 0.3% |
| French | 169 | 0.2% |
| French Canadian | 47 | 0.0% |
| German | 667 | 0.6% |
| Greek | 13 | 0.0% |
| Guamanian / Chamorro | 29 | 0.0% |
| Guatemalan | 1,844 | 1.7% |
| Honduran | 550 | 0.5% |
| Hungarian | 5 | 0.0% |
| Indian (Asian) | 19,033 | 17.5% |
| Indonesian | 302 | 0.3% |
| Inupiat | 29 | 0.0% |
| Irish | 677 | 0.6% |
| Iroquois | 39 | 0.0% |
| Italian | 488 | 0.4% |
| Japanese | 404 | 0.4% |
| Korean | 1,698 | 1.6% |
| Laotian | 196 | 0.2% |
| Latvian | 21 | 0.0% |
| Lebanese | 10 | 0.0% |
| Lithuanian | 4 | 0.0% |
| Malaysian | 10 | 0.0% |
| Mexican | 63,503 | 58.4% |
| Mexican American Indian | 1,772 | 1.6% |
| Mongolian | 24 | 0.0% |
| Native Hawaiian | 50 | 0.1% |
| Navajo | 162 | 0.2% |
| Nicaraguan | 321 | 0.3% |
| Nigerian | 14 | 0.0% |
| Northern European | 18 | 0.0% |
| Norwegian | 77 | 0.1% |
| Ottawa | 15 | 0.0% |
| Pakistani | 81 | 0.1% |
| Palestinian | 10 | 0.0% |
| Peruvian | 418 | 0.4% |
| Polish | 94 | 0.1% |
| Portuguese | 34 | 0.0% |
| Puerto Rican | 126 | 0.1% |
| Russian | 30 | 0.0% |
| Salvadoran | 2,694 | 2.5% |
| Samoan | 63 | 0.1% |
| Scandinavian | 81 | 0.1% |
| Scotch-Irish | 31 | 0.0% |
| Scottish | 60 | 0.1% |
| Sioux | 81 | 0.1% |
| South American | 1,035 | 0.9% |
| South American Indian | 9 | 0.0% |
| Spaniard | 27 | 0.0% |
| Spanish | 125 | 0.1% |
| Spanish American Indian | 1,972 | 1.8% |
| Sri Lankan | 11,223 | 10.3% |
| Subsaharan African | 48 | 0.0% |
| Swedish | 18 | 0.0% |
| Swiss | 2 | 0.0% |
| Thai | 118 | 0.1% |
| Tongan | 11 | 0.0% |
| Ukrainian | 46 | 0.0% |
| Venezuelan | 11 | 0.0% |
| Welsh | 11 | 0.0% | View All 94 Rows |
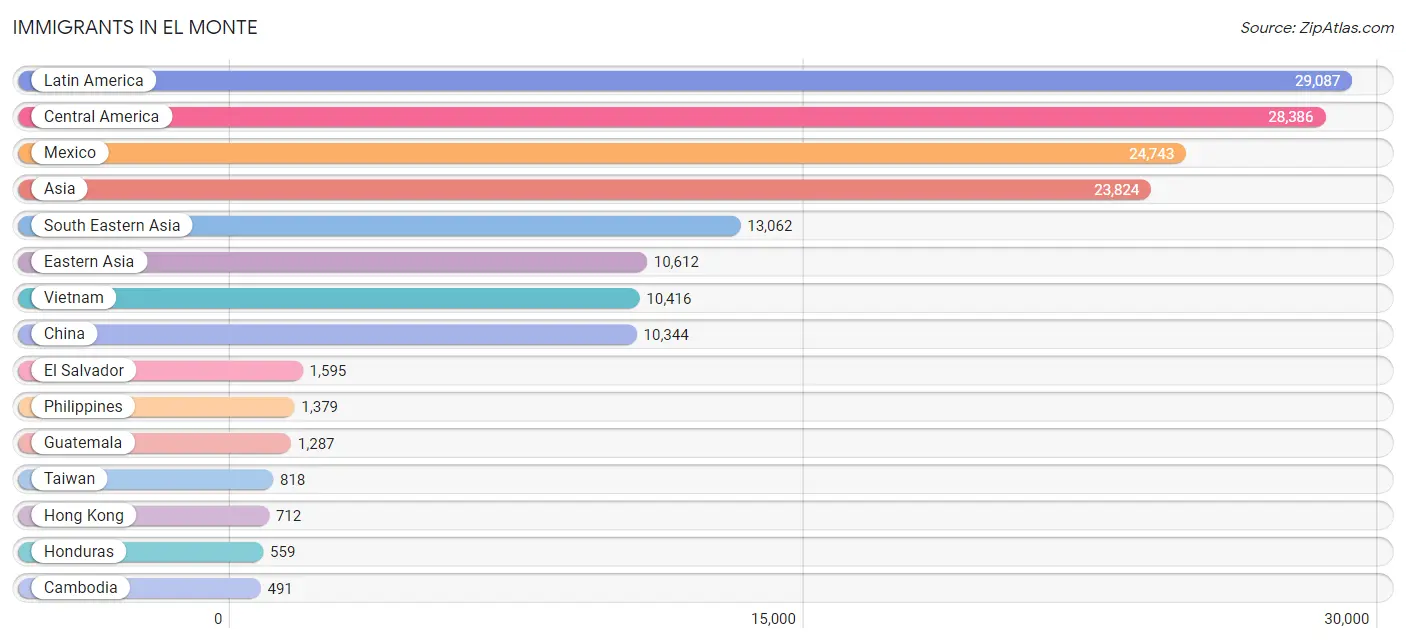
Immigrants in El Monte
The most numerous immigrant groups reported in El Monte came from Latin America (29,087 | 26.8%), Central America (28,386 | 26.1%), Mexico (24,743 | 22.8%), Asia (23,824 | 21.9%), and South Eastern Asia (13,062 | 12.0%), together accounting for 109.6% of all El Monte residents.
| Immigration Origin | # Population | % Population |
| Africa | 27 | 0.0% |
| Argentina | 50 | 0.1% |
| Asia | 23,824 | 21.9% |
| Australia | 21 | 0.0% |
| Belgium | 18 | 0.0% |
| Belize | 14 | 0.0% |
| Bolivia | 20 | 0.0% |
| Brazil | 27 | 0.0% |
| Bulgaria | 13 | 0.0% |
| Cambodia | 491 | 0.4% |
| Canada | 43 | 0.0% |
| Caribbean | 235 | 0.2% |
| Central America | 28,386 | 26.1% |
| Chile | 16 | 0.0% |
| China | 10,344 | 9.5% |
| Colombia | 146 | 0.1% |
| Cuba | 235 | 0.2% |
| Czechoslovakia | 4 | 0.0% |
| Denmark | 7 | 0.0% |
| Eastern Asia | 10,612 | 9.8% |
| Eastern Europe | 47 | 0.0% |
| Egypt | 5 | 0.0% |
| El Salvador | 1,595 | 1.5% |
| Europe | 179 | 0.2% |
| Fiji | 238 | 0.2% |
| France | 6 | 0.0% |
| Germany | 2 | 0.0% |
| Guatemala | 1,287 | 1.2% |
| Honduras | 559 | 0.5% |
| Hong Kong | 712 | 0.7% |
| India | 61 | 0.1% |
| Indonesia | 245 | 0.2% |
| Iran | 11 | 0.0% |
| Italy | 18 | 0.0% |
| Japan | 38 | 0.0% |
| Korea | 230 | 0.2% |
| Laos | 22 | 0.0% |
| Latin America | 29,087 | 26.8% |
| Lebanon | 14 | 0.0% |
| Malaysia | 70 | 0.1% |
| Mexico | 24,743 | 22.8% |
| Nepal | 52 | 0.1% |
| Netherlands | 41 | 0.0% |
| Nicaragua | 171 | 0.2% |
| Nigeria | 14 | 0.0% |
| Northern Africa | 8 | 0.0% |
| Northern Europe | 26 | 0.0% |
| Oceania | 318 | 0.3% |
| Pakistan | 12 | 0.0% |
| Peru | 178 | 0.2% |
| Philippines | 1,379 | 1.3% |
| Poland | 6 | 0.0% |
| Russia | 9 | 0.0% |
| South America | 466 | 0.4% |
| South Central Asia | 136 | 0.1% |
| South Eastern Asia | 13,062 | 12.0% |
| Southern Europe | 26 | 0.0% |
| Spain | 8 | 0.0% |
| Switzerland | 2 | 0.0% |
| Taiwan | 818 | 0.7% |
| Thailand | 114 | 0.1% |
| Ukraine | 7 | 0.0% |
| Venezuela | 29 | 0.0% |
| Vietnam | 10,416 | 9.6% |
| Western Africa | 14 | 0.0% |
| Western Asia | 14 | 0.0% |
| Western Europe | 80 | 0.1% | View All 67 Rows |
Sex and Age in El Monte
Sex and Age in El Monte
The most populous age groups in El Monte are 20 to 24 Years (4,114 | 7.5%) for men and 50 to 54 Years (4,217 | 7.8%) for women.
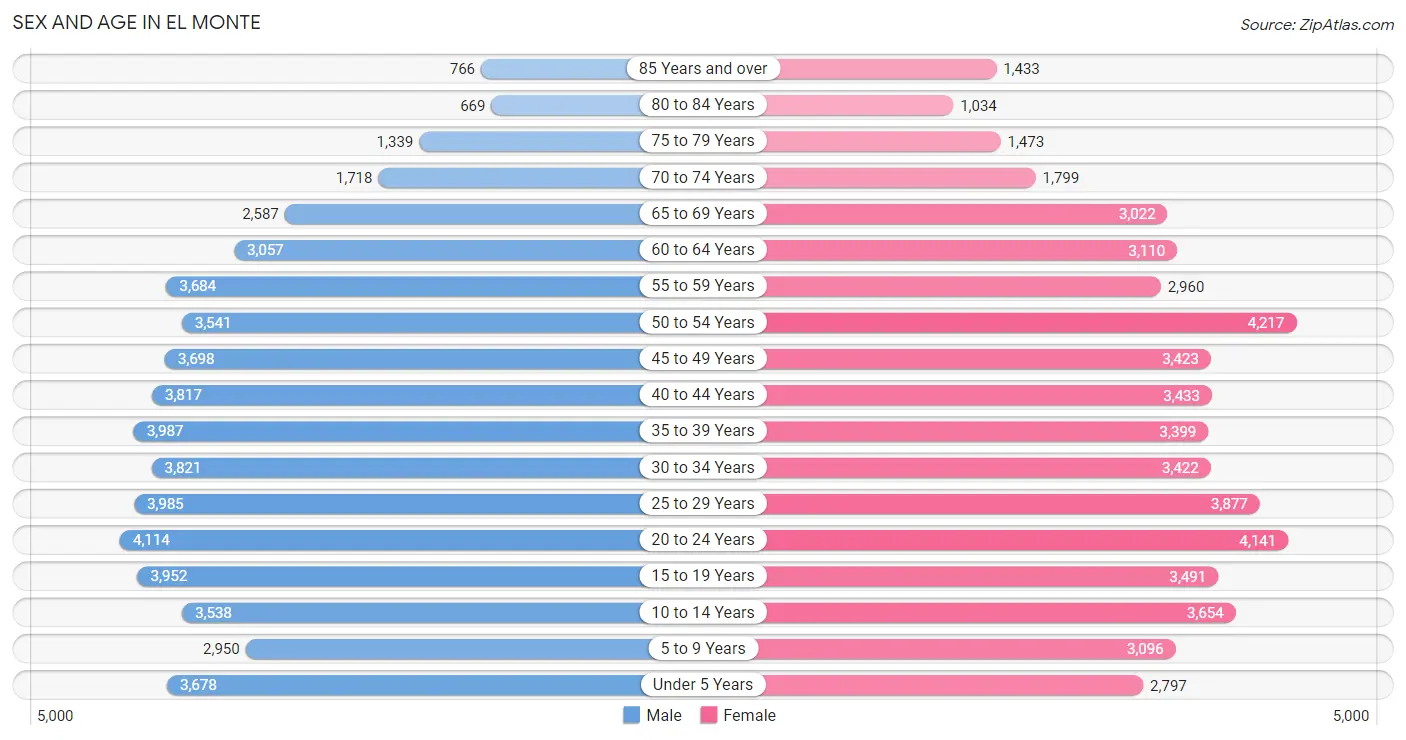
| Age Bracket | Male | Female |
| Under 5 Years | 3,678 (6.7%) | 2,797 (5.2%) |
| 5 to 9 Years | 2,950 (5.4%) | 3,096 (5.8%) |
| 10 to 14 Years | 3,538 (6.4%) | 3,654 (6.8%) |
| 15 to 19 Years | 3,952 (7.2%) | 3,491 (6.5%) |
| 20 to 24 Years | 4,114 (7.5%) | 4,141 (7.7%) |
| 25 to 29 Years | 3,985 (7.3%) | 3,877 (7.2%) |
| 30 to 34 Years | 3,821 (7.0%) | 3,422 (6.4%) |
| 35 to 39 Years | 3,987 (7.3%) | 3,399 (6.3%) |
| 40 to 44 Years | 3,817 (7.0%) | 3,433 (6.4%) |
| 45 to 49 Years | 3,698 (6.7%) | 3,423 (6.4%) |
| 50 to 54 Years | 3,541 (6.5%) | 4,217 (7.8%) |
| 55 to 59 Years | 3,684 (6.7%) | 2,960 (5.5%) |
| 60 to 64 Years | 3,057 (5.6%) | 3,110 (5.8%) |
| 65 to 69 Years | 2,587 (4.7%) | 3,022 (5.6%) |
| 70 to 74 Years | 1,718 (3.1%) | 1,799 (3.4%) |
| 75 to 79 Years | 1,339 (2.4%) | 1,473 (2.7%) |
| 80 to 84 Years | 669 (1.2%) | 1,034 (1.9%) |
| 85 Years and over | 766 (1.4%) | 1,433 (2.7%) |
| Total | 54,901 (100.0%) | 53,781 (100.0%) |
Families and Households in El Monte
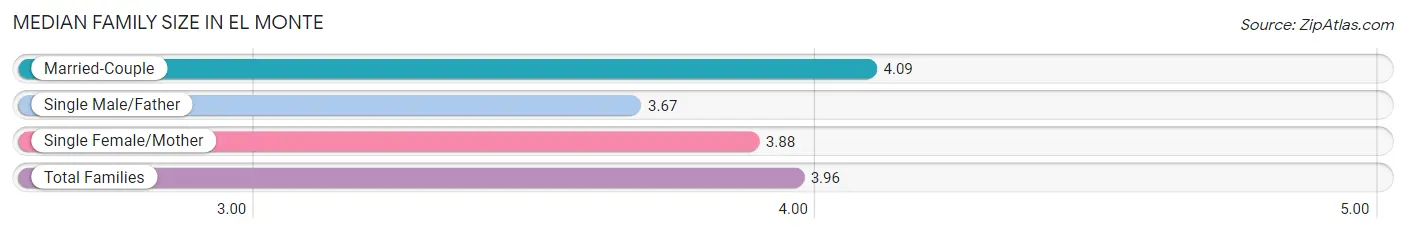
Median Family Size in El Monte
The median family size in El Monte is 3.96 persons per family, with married-couple families (13,736 | 57.8%) accounting for the largest median family size of 4.09 persons per family. On the other hand, single male/father families (4,221 | 17.8%) represent the smallest median family size with 3.67 persons per family.
| Family Type | # Families | Family Size |
| Married-Couple | 13,736 (57.8%) | 4.09 |
| Single Male/Father | 4,221 (17.8%) | 3.67 |
| Single Female/Mother | 5,796 (24.4%) | 3.88 |
| Total Families | 23,753 (100.0%) | 3.96 |
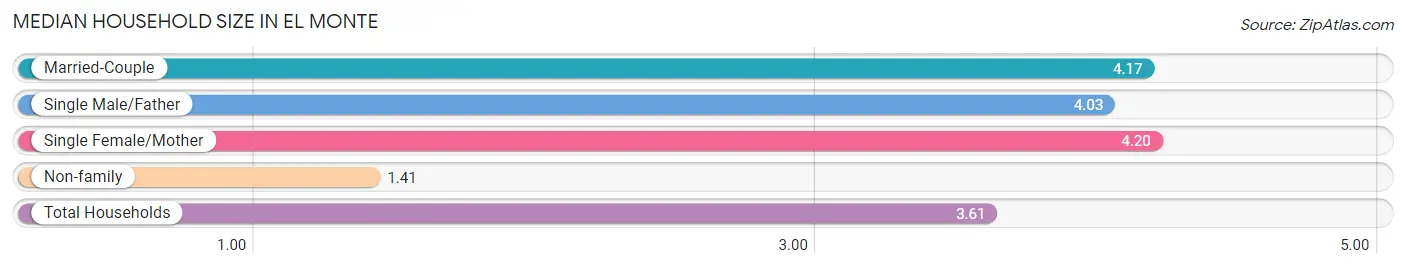
Median Household Size in El Monte
The median household size in El Monte is 3.61 persons per household, with single female/mother households (5,796 | 19.5%) accounting for the largest median household size of 4.2 persons per household. non-family households (5,907 | 19.9%) represent the smallest median household size with 1.41 persons per household.
| Household Type | # Households | Household Size |
| Married-Couple | 13,736 (46.3%) | 4.17 |
| Single Male/Father | 4,221 (14.2%) | 4.03 |
| Single Female/Mother | 5,796 (19.5%) | 4.20 |
| Non-family | 5,907 (19.9%) | 1.41 |
| Total Households | 29,660 (100.0%) | 3.61 |
Household Size by Marriage Status in El Monte
Out of a total of 29,660 households in El Monte, 23,753 (80.1%) are family households, while 5,907 (19.9%) are nonfamily households. The most numerous type of family households are 3-person households, comprising 5,583, and the most common type of nonfamily households are 1-person households, comprising 4,390.
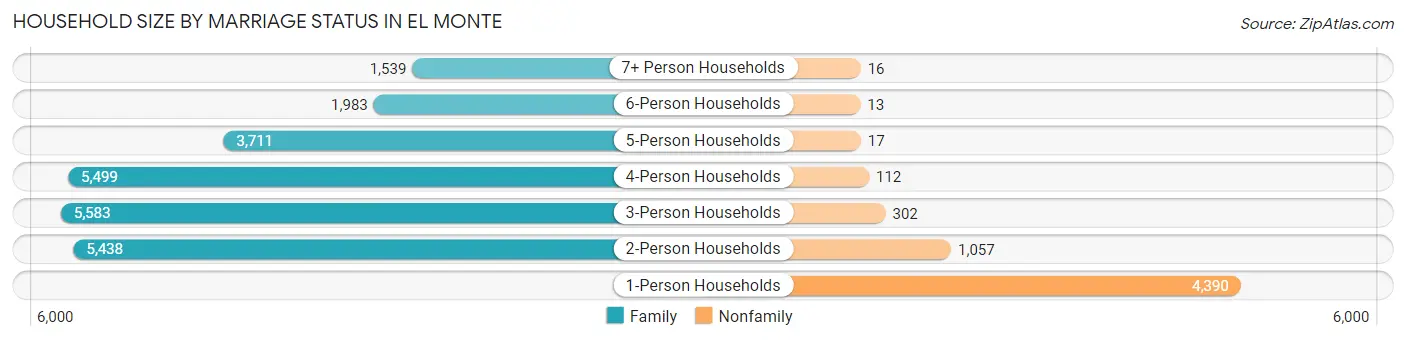
| Household Size | Family Households | Nonfamily Households |
| 1-Person Households | - | 4,390 (14.8%) |
| 2-Person Households | 5,438 (18.3%) | 1,057 (3.6%) |
| 3-Person Households | 5,583 (18.8%) | 302 (1.0%) |
| 4-Person Households | 5,499 (18.5%) | 112 (0.4%) |
| 5-Person Households | 3,711 (12.5%) | 17 (0.1%) |
| 6-Person Households | 1,983 (6.7%) | 13 (0.0%) |
| 7+ Person Households | 1,539 (5.2%) | 16 (0.1%) |
| Total | 23,753 (80.1%) | 5,907 (19.9%) |
Female Fertility in El Monte
Fertility by Age in El Monte
Average fertility rate in El Monte is 36.0 births per 1,000 women. Women in the age bracket of 20 to 34 years have the highest fertility rate with 60.0 births per 1,000 women. Women in the age bracket of 20 to 34 years acount for 72.2% of all women with births.
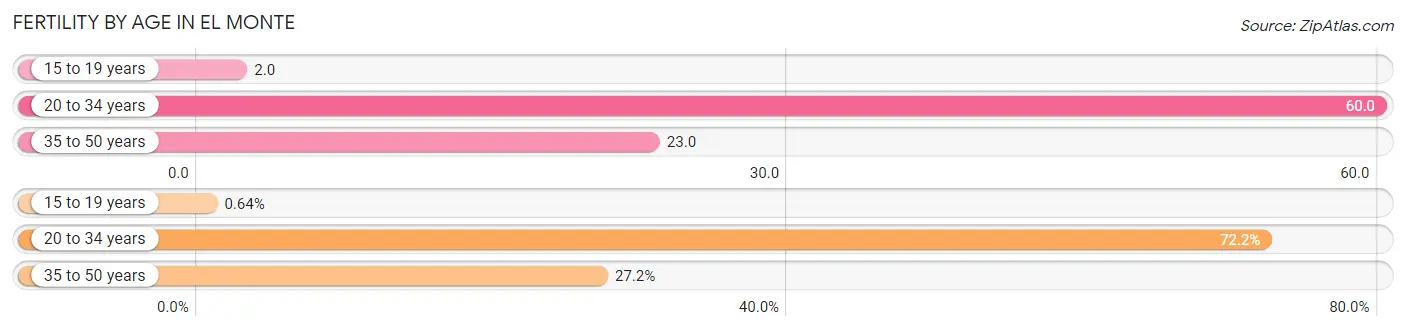
| Age Bracket | Women with Births | Births / 1,000 Women |
| 15 to 19 years | 6 (0.6%) | 2.0 |
| 20 to 34 years | 681 (72.2%) | 60.0 |
| 35 to 50 years | 256 (27.2%) | 23.0 |
| Total | 943 (100.0%) | 36.0 |
Fertility by Age by Marriage Status in El Monte
53.9% of women with births (943) in El Monte are married. The highest percentage of unmarried women with births falls into 15 to 19 years age bracket with 100.0% of them unmarried at the time of birth, while the lowest percentage of unmarried women with births belong to 35 to 50 years age bracket with 19.9% of them unmarried.
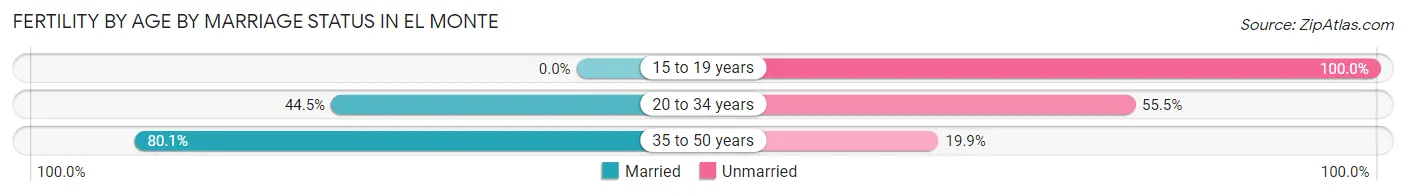
| Age Bracket | Married | Unmarried |
| 15 to 19 years | 0 (0.0%) | 6 (100.0%) |
| 20 to 34 years | 303 (44.5%) | 378 (55.5%) |
| 35 to 50 years | 205 (80.1%) | 51 (19.9%) |
| Total | 508 (53.9%) | 435 (46.1%) |
Fertility by Education in El Monte
Average fertility rate in El Monte is 36.0 births per 1,000 women. Women with the education attainment of graduate degree have the highest fertility rate of 77.0 births per 1,000 women, while women with the education attainment of bachelor's degree have the lowest fertility at 21.0 births per 1,000 women. Women with the education attainment of high school diploma represent 34.9% of all women with births.
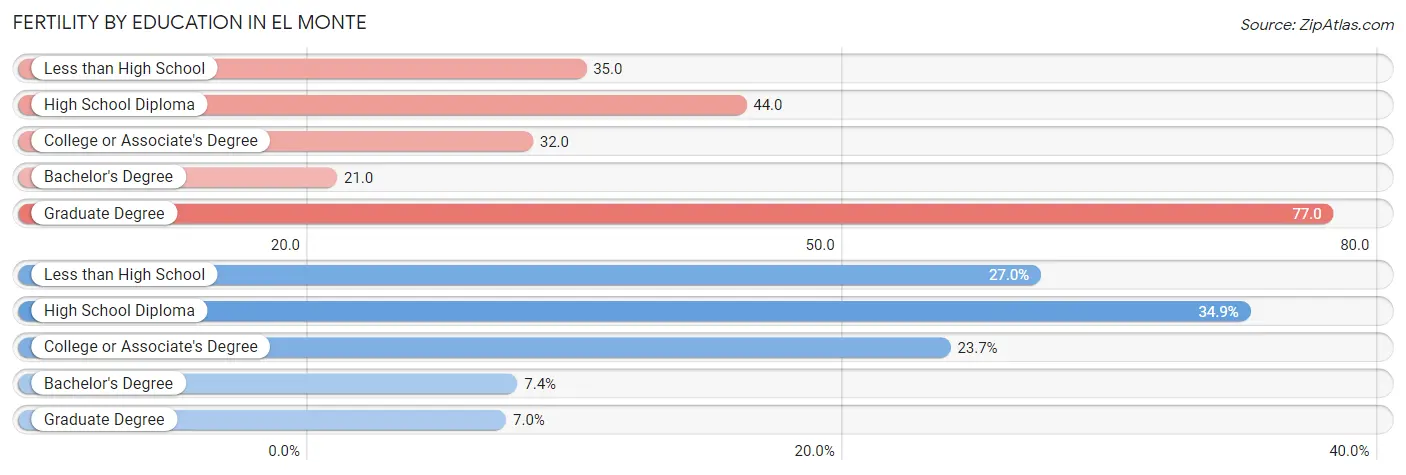
| Educational Attainment | Women with Births | Births / 1,000 Women |
| Less than High School | 255 (27.0%) | 35.0 |
| High School Diploma | 329 (34.9%) | 44.0 |
| College or Associate's Degree | 223 (23.6%) | 32.0 |
| Bachelor's Degree | 70 (7.4%) | 21.0 |
| Graduate Degree | 66 (7.0%) | 77.0 |
| Total | 943 (100.0%) | 36.0 |
Fertility by Education by Marriage Status in El Monte
46.1% of women with births in El Monte are unmarried. Women with the educational attainment of graduate degree are most likely to be married with 100.0% of them married at childbirth, while women with the educational attainment of less than high school are least likely to be married with 67.4% of them unmarried at childbirth.
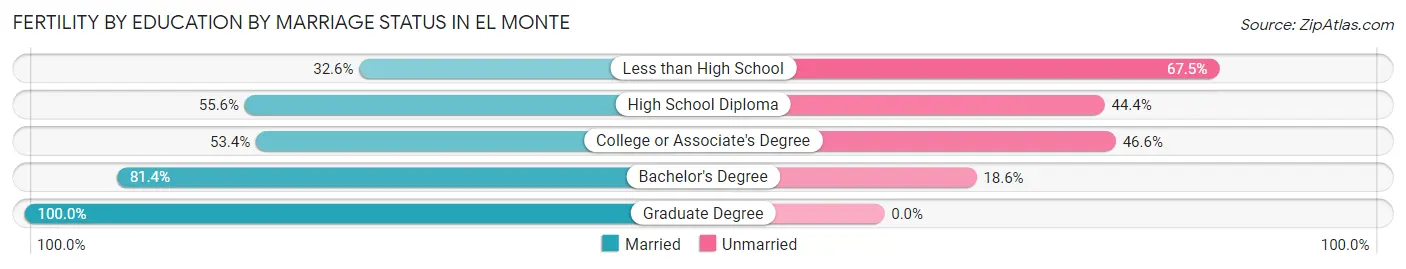
| Educational Attainment | Married | Unmarried |
| Less than High School | 83 (32.6%) | 172 (67.4%) |
| High School Diploma | 183 (55.6%) | 146 (44.4%) |
| College or Associate's Degree | 119 (53.4%) | 104 (46.6%) |
| Bachelor's Degree | 57 (81.4%) | 13 (18.6%) |
| Graduate Degree | 66 (100.0%) | 0 (0.0%) |
| Total | 508 (53.9%) | 435 (46.1%) |
Employment Characteristics in El Monte
Employment by Class of Employer in El Monte
Among the 48,473 employed individuals in El Monte, private company employees (36,015 | 74.3%), self-employed (not incorporated) (3,776 | 7.8%), and local government employees (2,990 | 6.2%) make up the most common classes of employment.
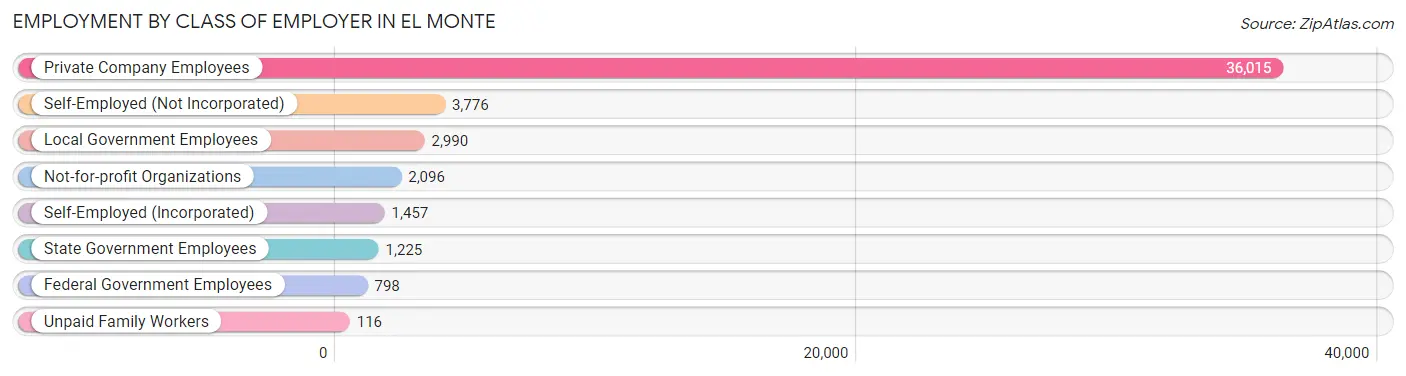
| Employer Class | # Employees | % Employees |
| Private Company Employees | 36,015 | 74.3% |
| Self-Employed (Incorporated) | 1,457 | 3.0% |
| Self-Employed (Not Incorporated) | 3,776 | 7.8% |
| Not-for-profit Organizations | 2,096 | 4.3% |
| Local Government Employees | 2,990 | 6.2% |
| State Government Employees | 1,225 | 2.5% |
| Federal Government Employees | 798 | 1.7% |
| Unpaid Family Workers | 116 | 0.2% |
| Total | 48,473 | 100.0% |
Employment Status by Age in El Monte
According to the labor force statistics for El Monte, out of the total population over 16 years of age (87,397), 61.4% or 53,662 individuals are in the labor force, with 7.0% or 3,756 of them unemployed. The age group with the highest labor force participation rate is 25 to 29 years, with 83.6% or 6,573 individuals in the labor force. Within the labor force, the 16 to 19 years age range has the highest percentage of unemployed individuals, with 18.0% or 290 of them being unemployed.
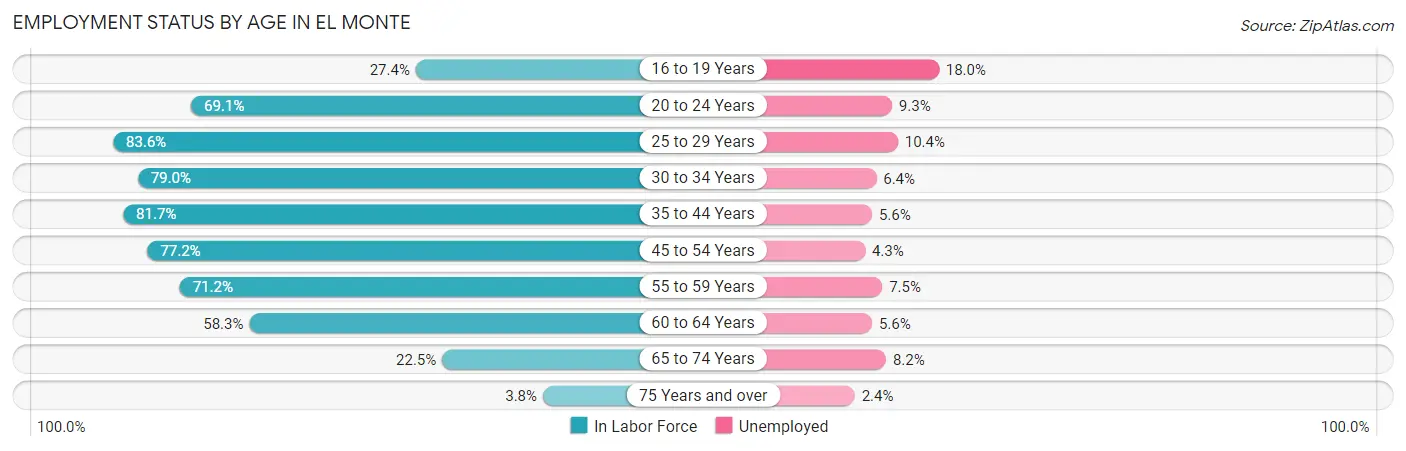
| Age Bracket | In Labor Force | Unemployed |
| 16 to 19 Years | 1,609 (27.4%) | 290 (18.0%) |
| 20 to 24 Years | 5,704 (69.1%) | 530 (9.3%) |
| 25 to 29 Years | 6,573 (83.6%) | 684 (10.4%) |
| 30 to 34 Years | 5,722 (79.0%) | 366 (6.4%) |
| 35 to 44 Years | 11,958 (81.7%) | 670 (5.6%) |
| 45 to 54 Years | 11,487 (77.2%) | 494 (4.3%) |
| 55 to 59 Years | 4,731 (71.2%) | 355 (7.5%) |
| 60 to 64 Years | 3,595 (58.3%) | 201 (5.6%) |
| 65 to 74 Years | 2,053 (22.5%) | 168 (8.2%) |
| 75 Years and over | 255 (3.8%) | 6 (2.4%) |
| Total | 53,662 (61.4%) | 3,756 (7.0%) |
Employment Status by Educational Attainment in El Monte
According to labor force statistics for El Monte, 76.7% of individuals (44,050) out of the total population between 25 and 64 years of age (57,431) are in the labor force, with 6.3% or 2,775 of them being unemployed. The group with the highest labor force participation rate are those with the educational attainment of bachelor's degree or higher, with 87.3% or 7,173 individuals in the labor force. Within the labor force, individuals with less than high school education have the highest percentage of unemployment, with 7.4% or 911 of them being unemployed.
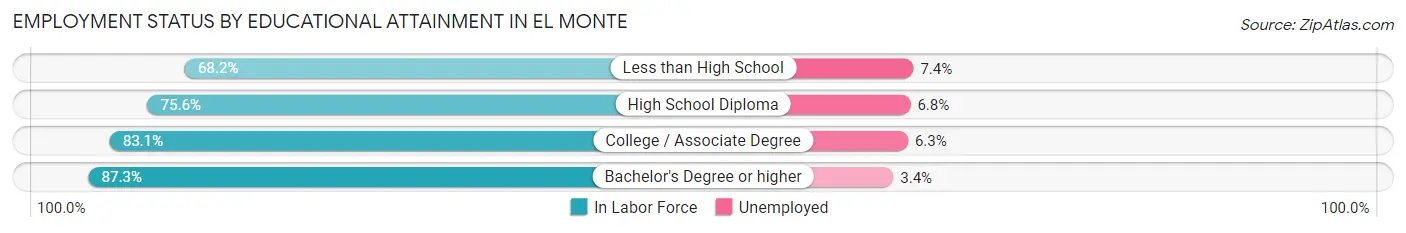
| Educational Attainment | In Labor Force | Unemployed |
| Less than High School | 12,310 (68.2%) | 1,336 (7.4%) |
| High School Diploma | 13,342 (75.6%) | 1,200 (6.8%) |
| College / Associate Degree | 11,232 (83.1%) | 852 (6.3%) |
| Bachelor's Degree or higher | 7,173 (87.3%) | 279 (3.4%) |
| Total | 44,050 (76.7%) | 3,618 (6.3%) |
Employment Occupations by Sex in El Monte
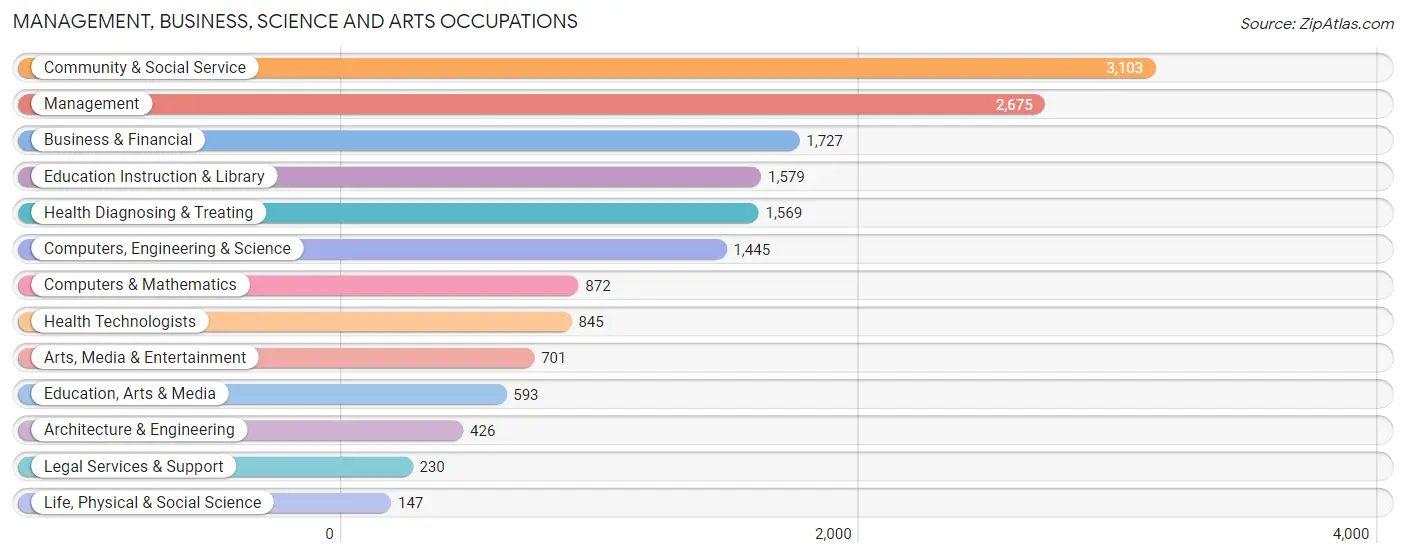
Management, Business, Science and Arts Occupations
The most common Management, Business, Science and Arts occupations in El Monte are Community & Social Service (3,103 | 6.2%), Management (2,675 | 5.4%), Business & Financial (1,727 | 3.5%), Education Instruction & Library (1,579 | 3.2%), and Health Diagnosing & Treating (1,569 | 3.2%).
Management, Business, Science and Arts Occupations by Sex
Within the Management, Business, Science and Arts occupations in El Monte, the most male-oriented occupations are Computers & Mathematics (77.7%), Architecture & Engineering (75.1%), and Computers, Engineering & Science (74.8%), while the most female-oriented occupations are Health Technologists (68.0%), Education, Arts & Media (67.8%), and Education Instruction & Library (66.0%).
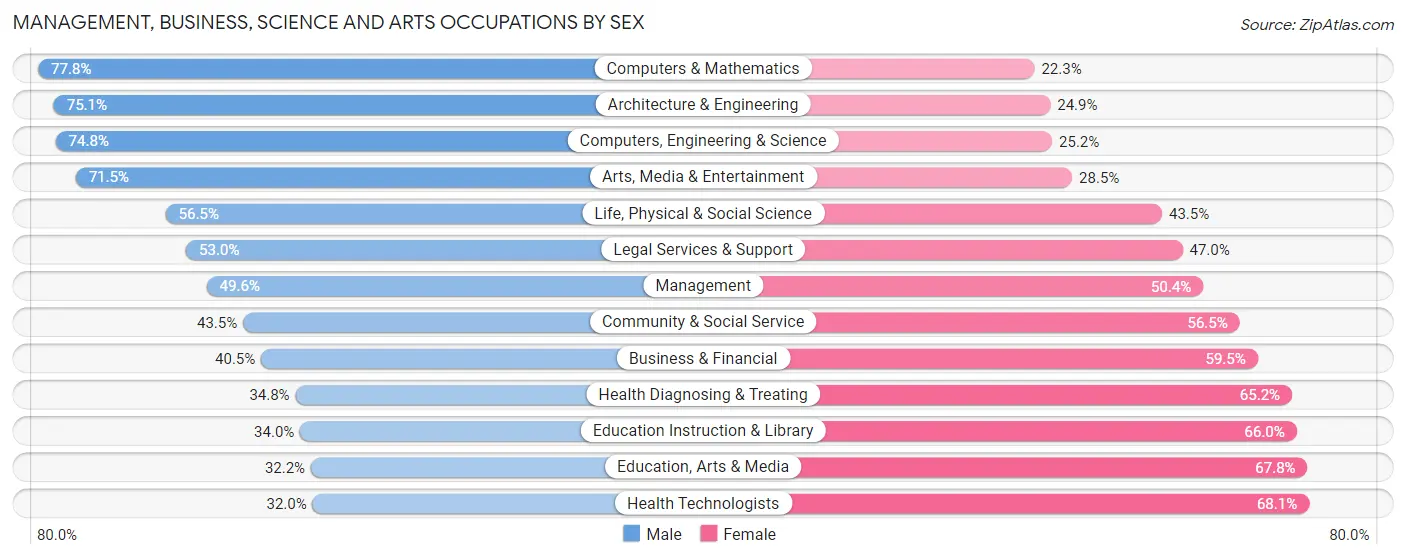
| Occupation | Male | Female |
| Management | 1,327 (49.6%) | 1,348 (50.4%) |
| Business & Financial | 700 (40.5%) | 1,027 (59.5%) |
| Computers, Engineering & Science | 1,081 (74.8%) | 364 (25.2%) |
| Computers & Mathematics | 678 (77.7%) | 194 (22.3%) |
| Architecture & Engineering | 320 (75.1%) | 106 (24.9%) |
| Life, Physical & Social Science | 83 (56.5%) | 64 (43.5%) |
| Community & Social Service | 1,351 (43.5%) | 1,752 (56.5%) |
| Education, Arts & Media | 191 (32.2%) | 402 (67.8%) |
| Legal Services & Support | 122 (53.0%) | 108 (47.0%) |
| Education Instruction & Library | 537 (34.0%) | 1,042 (66.0%) |
| Arts, Media & Entertainment | 501 (71.5%) | 200 (28.5%) |
| Health Diagnosing & Treating | 546 (34.8%) | 1,023 (65.2%) |
| Health Technologists | 270 (32.0%) | 575 (68.0%) |
| Total (Category) | 5,005 (47.6%) | 5,514 (52.4%) |
| Total (Overall) | 27,909 (56.0%) | 21,959 (44.0%) |
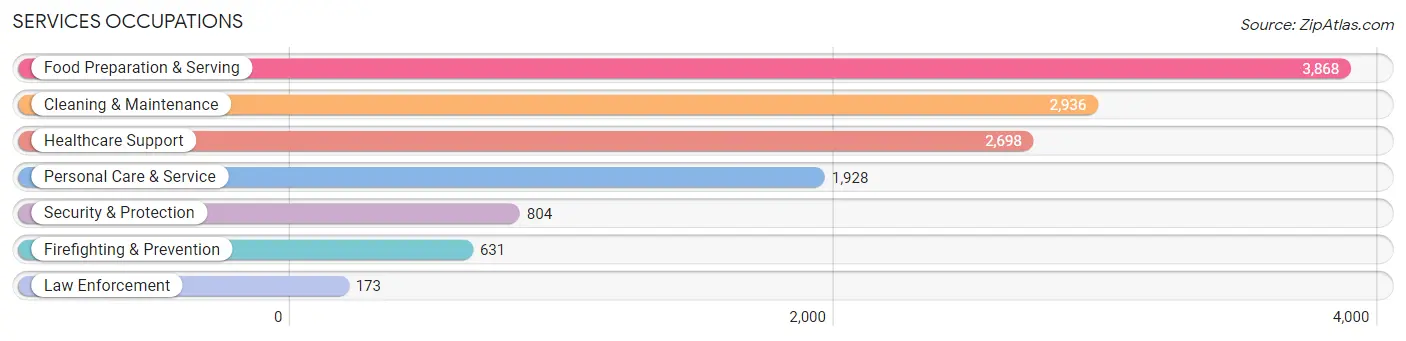
Services Occupations
The most common Services occupations in El Monte are Food Preparation & Serving (3,868 | 7.8%), Cleaning & Maintenance (2,936 | 5.9%), Healthcare Support (2,698 | 5.4%), Personal Care & Service (1,928 | 3.9%), and Security & Protection (804 | 1.6%).
Services Occupations by Sex
Within the Services occupations in El Monte, the most male-oriented occupations are Firefighting & Prevention (79.2%), Security & Protection (77.5%), and Law Enforcement (71.1%), while the most female-oriented occupations are Healthcare Support (84.5%), Personal Care & Service (74.3%), and Food Preparation & Serving (44.7%).
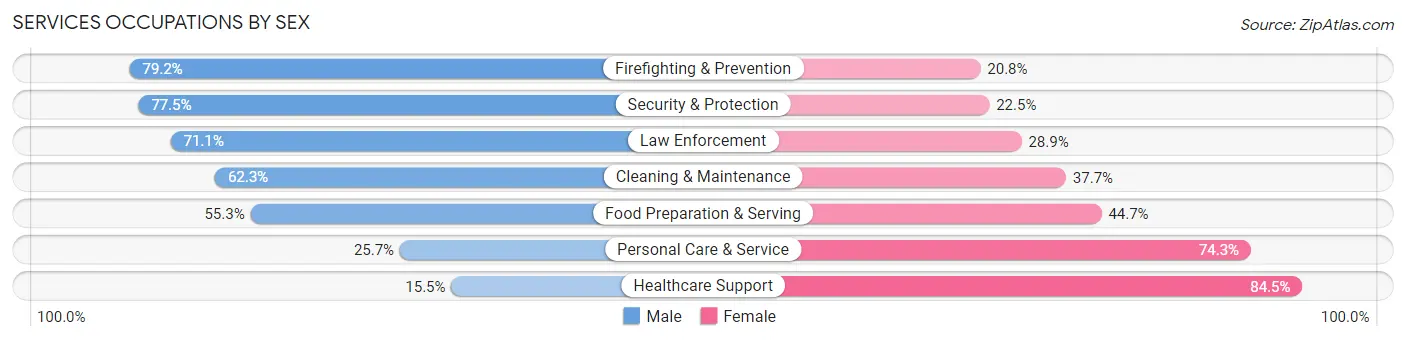
| Occupation | Male | Female |
| Healthcare Support | 418 (15.5%) | 2,280 (84.5%) |
| Security & Protection | 623 (77.5%) | 181 (22.5%) |
| Firefighting & Prevention | 500 (79.2%) | 131 (20.8%) |
| Law Enforcement | 123 (71.1%) | 50 (28.9%) |
| Food Preparation & Serving | 2,138 (55.3%) | 1,730 (44.7%) |
| Cleaning & Maintenance | 1,829 (62.3%) | 1,107 (37.7%) |
| Personal Care & Service | 495 (25.7%) | 1,433 (74.3%) |
| Total (Category) | 5,503 (45.0%) | 6,731 (55.0%) |
| Total (Overall) | 27,909 (56.0%) | 21,959 (44.0%) |
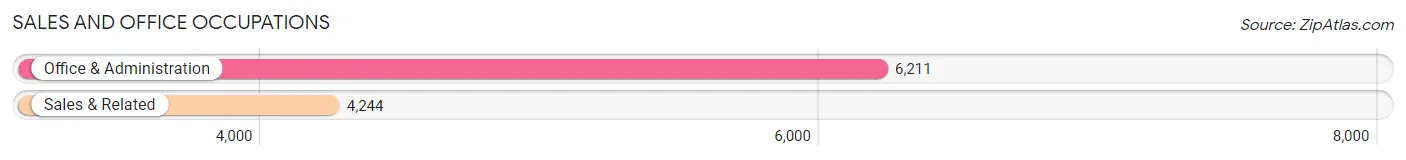
Sales and Office Occupations
The most common Sales and Office occupations in El Monte are Office & Administration (6,211 | 12.4%), and Sales & Related (4,244 | 8.5%).
Sales and Office Occupations by Sex
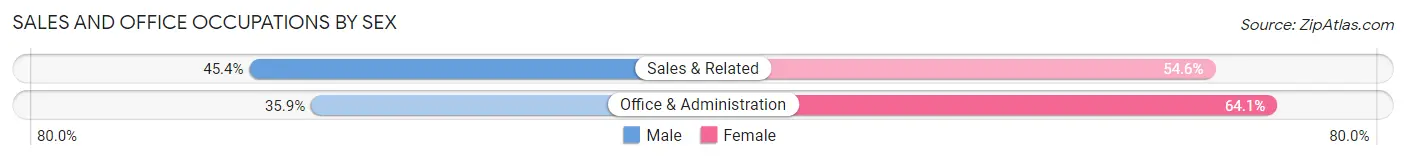
| Occupation | Male | Female |
| Sales & Related | 1,928 (45.4%) | 2,316 (54.6%) |
| Office & Administration | 2,232 (35.9%) | 3,979 (64.1%) |
| Total (Category) | 4,160 (39.8%) | 6,295 (60.2%) |
| Total (Overall) | 27,909 (56.0%) | 21,959 (44.0%) |
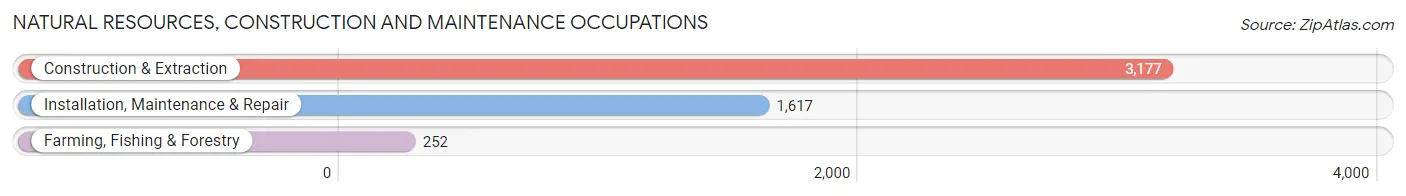
Natural Resources, Construction and Maintenance Occupations
The most common Natural Resources, Construction and Maintenance occupations in El Monte are Construction & Extraction (3,177 | 6.4%), Installation, Maintenance & Repair (1,617 | 3.2%), and Farming, Fishing & Forestry (252 | 0.5%).
Natural Resources, Construction and Maintenance Occupations by Sex
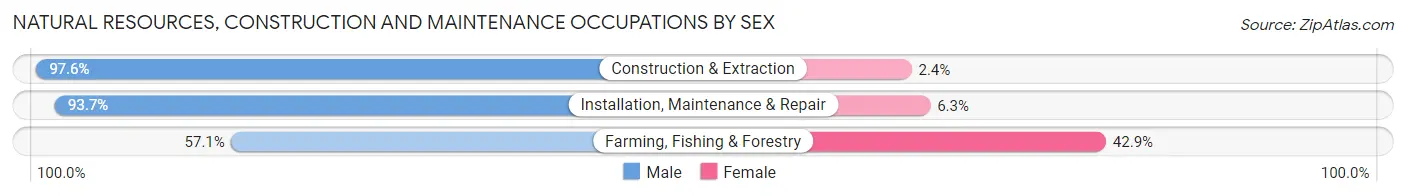
| Occupation | Male | Female |
| Farming, Fishing & Forestry | 144 (57.1%) | 108 (42.9%) |
| Construction & Extraction | 3,100 (97.6%) | 77 (2.4%) |
| Installation, Maintenance & Repair | 1,515 (93.7%) | 102 (6.3%) |
| Total (Category) | 4,759 (94.3%) | 287 (5.7%) |
| Total (Overall) | 27,909 (56.0%) | 21,959 (44.0%) |
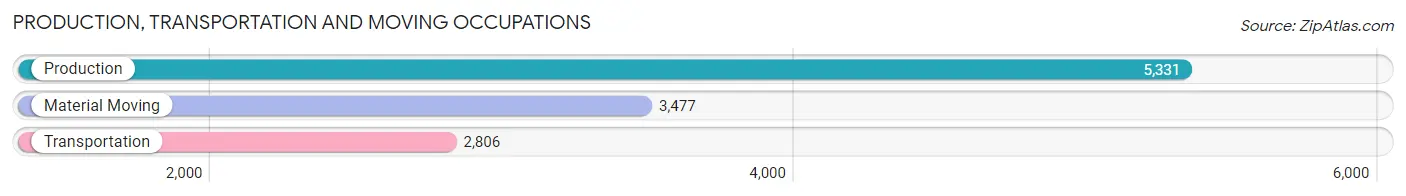
Production, Transportation and Moving Occupations
The most common Production, Transportation and Moving occupations in El Monte are Production (5,331 | 10.7%), Material Moving (3,477 | 7.0%), and Transportation (2,806 | 5.6%).
Production, Transportation and Moving Occupations by Sex
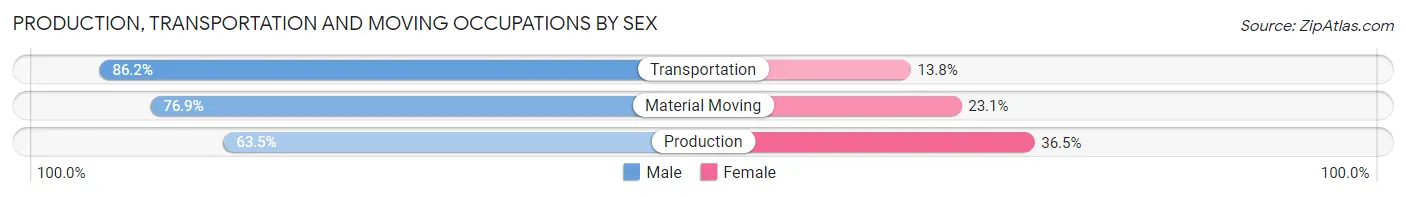
| Occupation | Male | Female |
| Production | 3,387 (63.5%) | 1,944 (36.5%) |
| Transportation | 2,420 (86.2%) | 386 (13.8%) |
| Material Moving | 2,675 (76.9%) | 802 (23.1%) |
| Total (Category) | 8,482 (73.0%) | 3,132 (27.0%) |
| Total (Overall) | 27,909 (56.0%) | 21,959 (44.0%) |
Employment Industries by Sex in El Monte
Employment Industries in El Monte
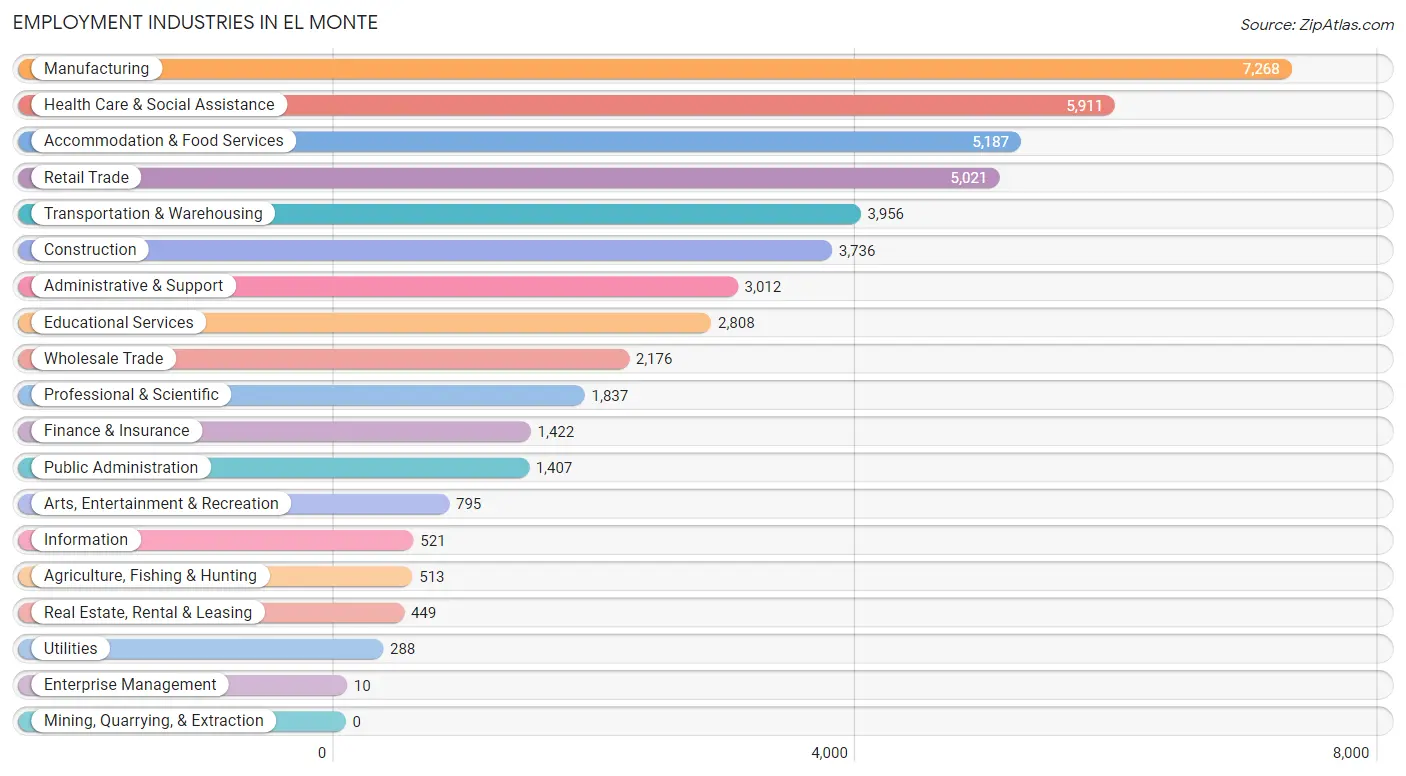
The major employment industries in El Monte include Manufacturing (7,268 | 14.6%), Health Care & Social Assistance (5,911 | 11.8%), Accommodation & Food Services (5,187 | 10.4%), Retail Trade (5,021 | 10.1%), and Transportation & Warehousing (3,956 | 7.9%).
Employment Industries by Sex in El Monte
The El Monte industries that see more men than women are Enterprise Management (100.0%), Construction (96.3%), and Agriculture, Fishing & Hunting (89.7%), whereas the industries that tend to have a higher number of women are Health Care & Social Assistance (79.5%), Finance & Insurance (62.9%), and Educational Services (59.1%).
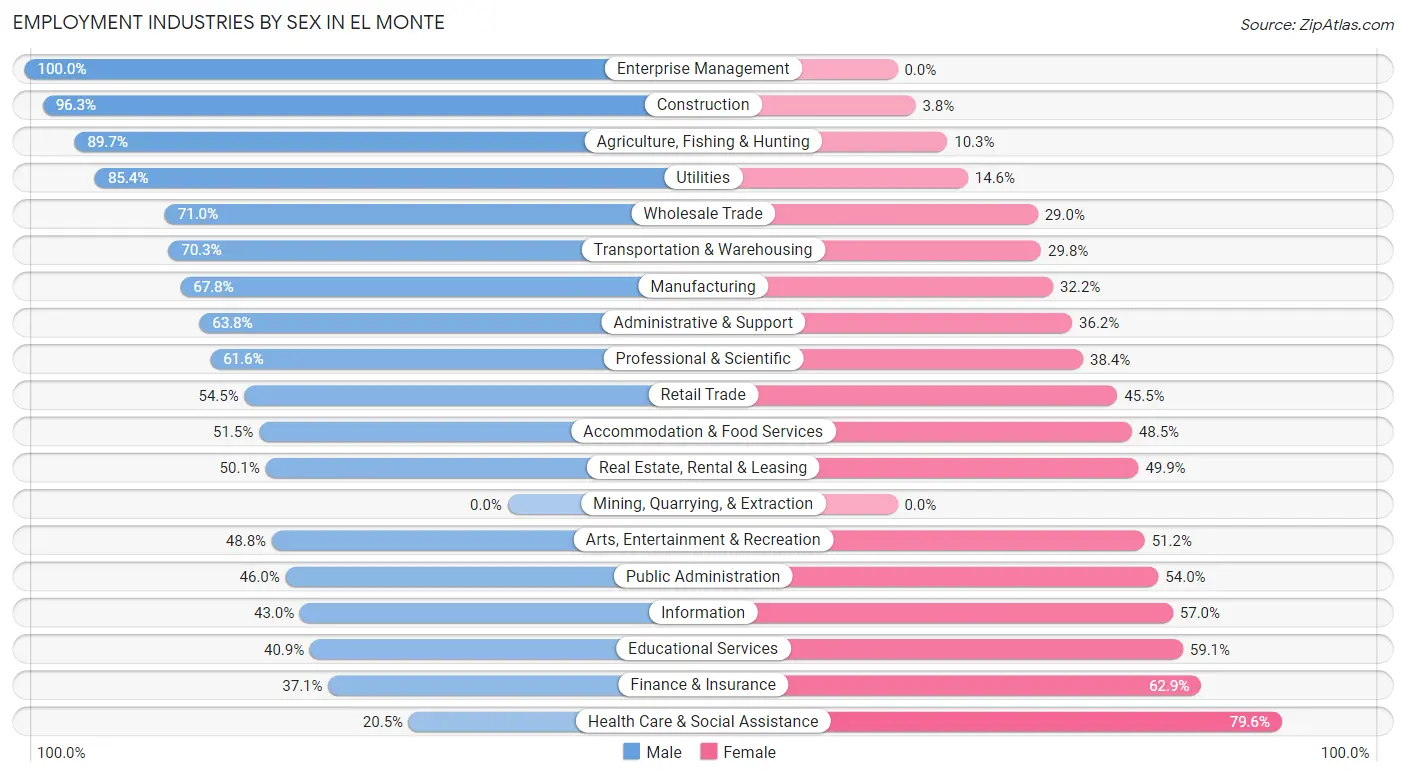
| Industry | Male | Female |
| Agriculture, Fishing & Hunting | 460 (89.7%) | 53 (10.3%) |
| Mining, Quarrying, & Extraction | 0 (0.0%) | 0 (0.0%) |
| Construction | 3,596 (96.3%) | 140 (3.7%) |
| Manufacturing | 4,925 (67.8%) | 2,343 (32.2%) |
| Wholesale Trade | 1,544 (71.0%) | 632 (29.0%) |
| Retail Trade | 2,735 (54.5%) | 2,286 (45.5%) |
| Transportation & Warehousing | 2,779 (70.3%) | 1,177 (29.7%) |
| Utilities | 246 (85.4%) | 42 (14.6%) |
| Information | 224 (43.0%) | 297 (57.0%) |
| Finance & Insurance | 528 (37.1%) | 894 (62.9%) |
| Real Estate, Rental & Leasing | 225 (50.1%) | 224 (49.9%) |
| Professional & Scientific | 1,131 (61.6%) | 706 (38.4%) |
| Enterprise Management | 10 (100.0%) | 0 (0.0%) |
| Administrative & Support | 1,923 (63.8%) | 1,089 (36.2%) |
| Educational Services | 1,149 (40.9%) | 1,659 (59.1%) |
| Health Care & Social Assistance | 1,209 (20.4%) | 4,702 (79.5%) |
| Arts, Entertainment & Recreation | 388 (48.8%) | 407 (51.2%) |
| Accommodation & Food Services | 2,669 (51.5%) | 2,518 (48.5%) |
| Public Administration | 647 (46.0%) | 760 (54.0%) |
| Total | 27,909 (56.0%) | 21,959 (44.0%) |
Education in El Monte
School Enrollment in El Monte
The most common levels of schooling among the 27,201 students in El Monte are college / undergraduate (6,926 | 25.5%), high school (6,506 | 23.9%), and middle school (5,637 | 20.7%).
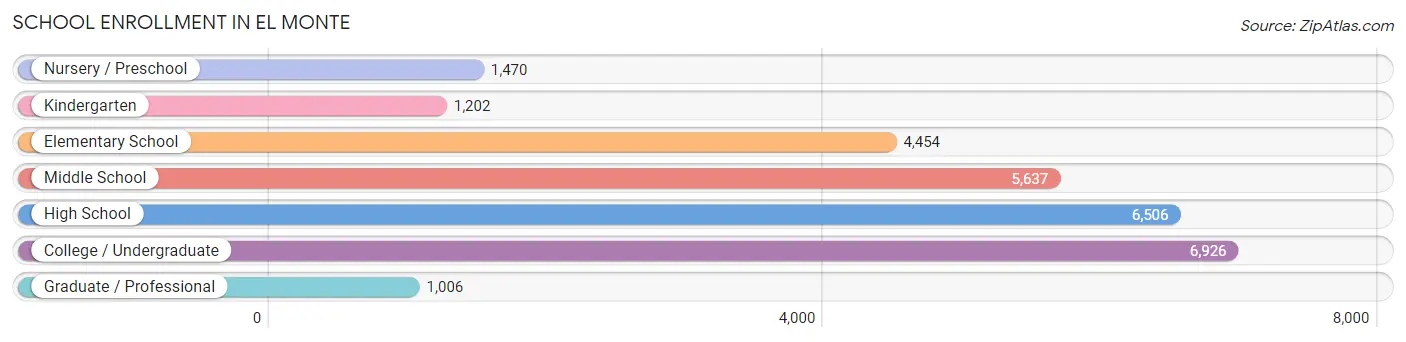
| School Level | # Students | % Students |
| Nursery / Preschool | 1,470 | 5.4% |
| Kindergarten | 1,202 | 4.4% |
| Elementary School | 4,454 | 16.4% |
| Middle School | 5,637 | 20.7% |
| High School | 6,506 | 23.9% |
| College / Undergraduate | 6,926 | 25.5% |
| Graduate / Professional | 1,006 | 3.7% |
| Total | 27,201 | 100.0% |
School Enrollment by Age by Funding Source in El Monte
Out of a total of 27,201 students who are enrolled in schools in El Monte, 2,040 (7.5%) attend a private institution, while the remaining 25,161 (92.5%) are enrolled in public schools. The age group of 3 to 4 year olds has the highest likelihood of being enrolled in private schools, with 300 (26.1% in the age bracket) enrolled. Conversely, the age group of 10 to 14 year olds has the lowest likelihood of being enrolled in a private school, with 6,997 (98.7% in the age bracket) attending a public institution.
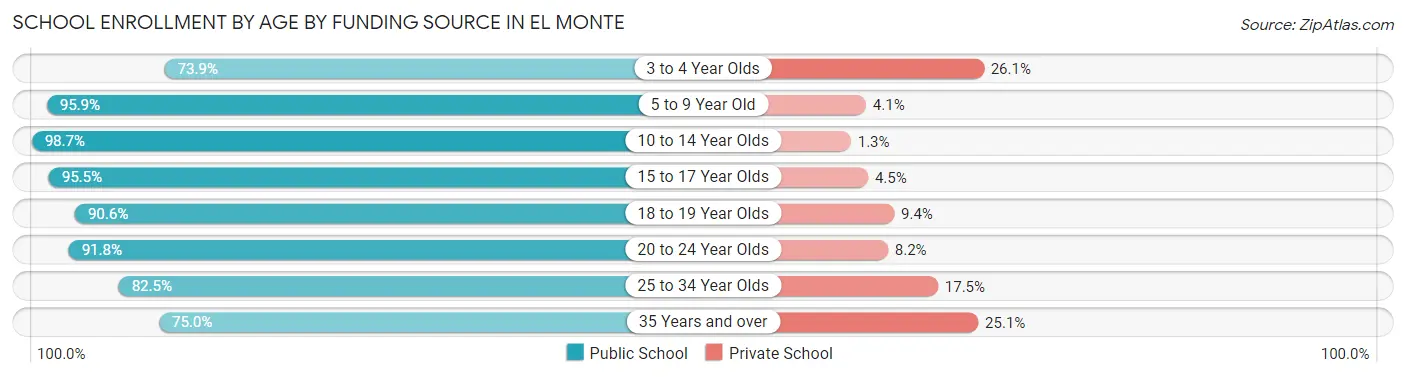
| Age Bracket | Public School | Private School |
| 3 to 4 Year Olds | 850 (73.9%) | 300 (26.1%) |
| 5 to 9 Year Old | 5,302 (95.9%) | 229 (4.1%) |
| 10 to 14 Year Olds | 6,997 (98.7%) | 94 (1.3%) |
| 15 to 17 Year Olds | 4,222 (95.5%) | 200 (4.5%) |
| 18 to 19 Year Olds | 1,804 (90.6%) | 187 (9.4%) |
| 20 to 24 Year Olds | 3,056 (91.8%) | 274 (8.2%) |
| 25 to 34 Year Olds | 1,894 (82.5%) | 403 (17.5%) |
| 35 Years and over | 1,041 (75.0%) | 348 (25.1%) |
| Total | 25,161 (92.5%) | 2,040 (7.5%) |
Educational Attainment by Field of Study in El Monte
Business (2,718 | 25.4%), science & technology (1,088 | 10.2%), social sciences (1,047 | 9.8%), engineering (759 | 7.1%), and arts & humanities (695 | 6.5%) are the most common fields of study among 10,709 individuals in El Monte who have obtained a bachelor's degree or higher.
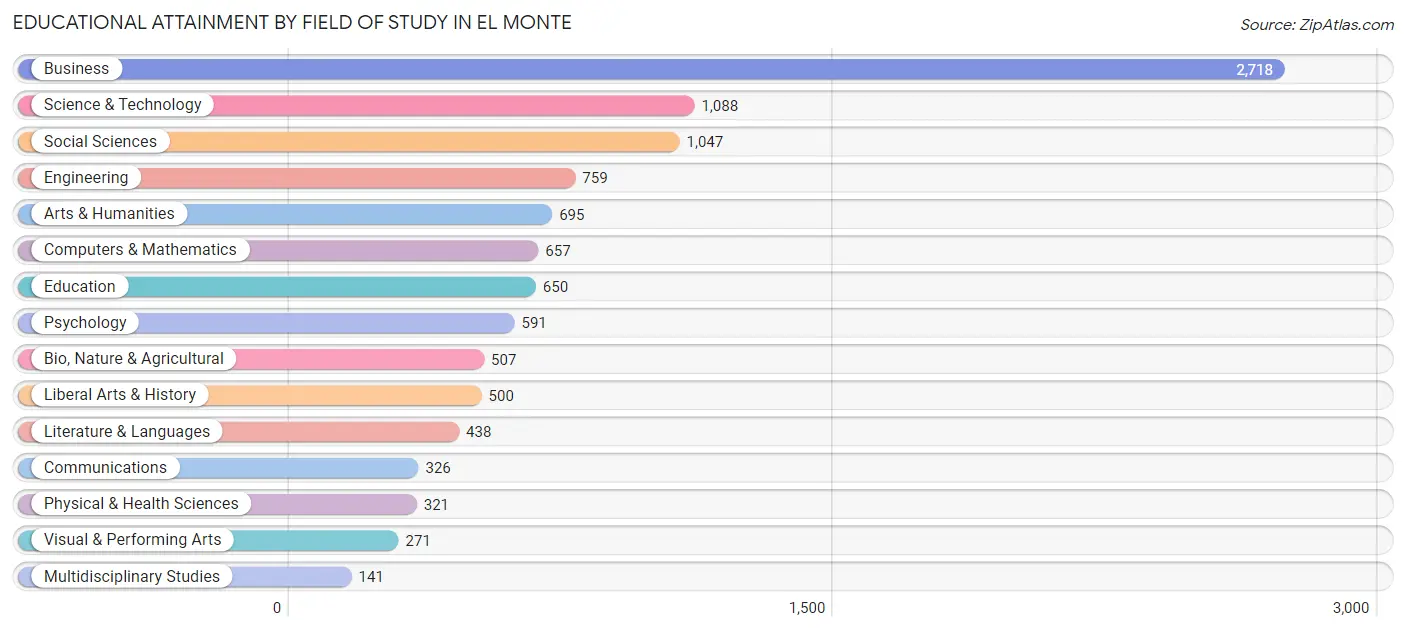
| Field of Study | # Graduates | % Graduates |
| Computers & Mathematics | 657 | 6.1% |
| Bio, Nature & Agricultural | 507 | 4.7% |
| Physical & Health Sciences | 321 | 3.0% |
| Psychology | 591 | 5.5% |
| Social Sciences | 1,047 | 9.8% |
| Engineering | 759 | 7.1% |
| Multidisciplinary Studies | 141 | 1.3% |
| Science & Technology | 1,088 | 10.2% |
| Business | 2,718 | 25.4% |
| Education | 650 | 6.1% |
| Literature & Languages | 438 | 4.1% |
| Liberal Arts & History | 500 | 4.7% |
| Visual & Performing Arts | 271 | 2.5% |
| Communications | 326 | 3.0% |
| Arts & Humanities | 695 | 6.5% |
| Total | 10,709 | 100.0% |
Transportation & Commute in El Monte
Vehicle Availability by Sex in El Monte
The most prevalent vehicle ownership categories in El Monte are males with 2 vehicles (8,563, accounting for 31.4%) and females with 2 vehicles (6,622, making up 40.8%).
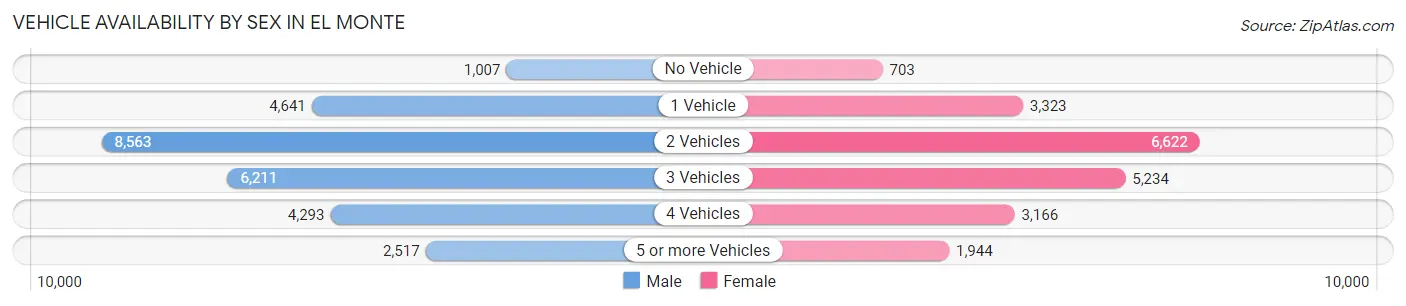
| Vehicles Available | Male | Female |
| No Vehicle | 1,007 (3.7%) | 703 (3.4%) |
| 1 Vehicle | 4,641 (17.0%) | 3,323 (15.8%) |
| 2 Vehicles | 8,563 (31.4%) | 6,622 (31.6%) |
| 3 Vehicles | 6,211 (22.8%) | 5,234 (24.9%) |
| 4 Vehicles | 4,293 (15.8%) | 3,166 (15.1%) |
| 5 or more Vehicles | 2,517 (9.2%) | 1,944 (9.3%) |
| Total | 27,232 (100.0%) | 20,992 (100.0%) |
Commute Time in El Monte
The most frequently occuring commute durations in El Monte are 30 to 34 minutes (9,516 commuters, 20.6%), 15 to 19 minutes (7,415 commuters, 16.1%), and 20 to 24 minutes (7,287 commuters, 15.8%).
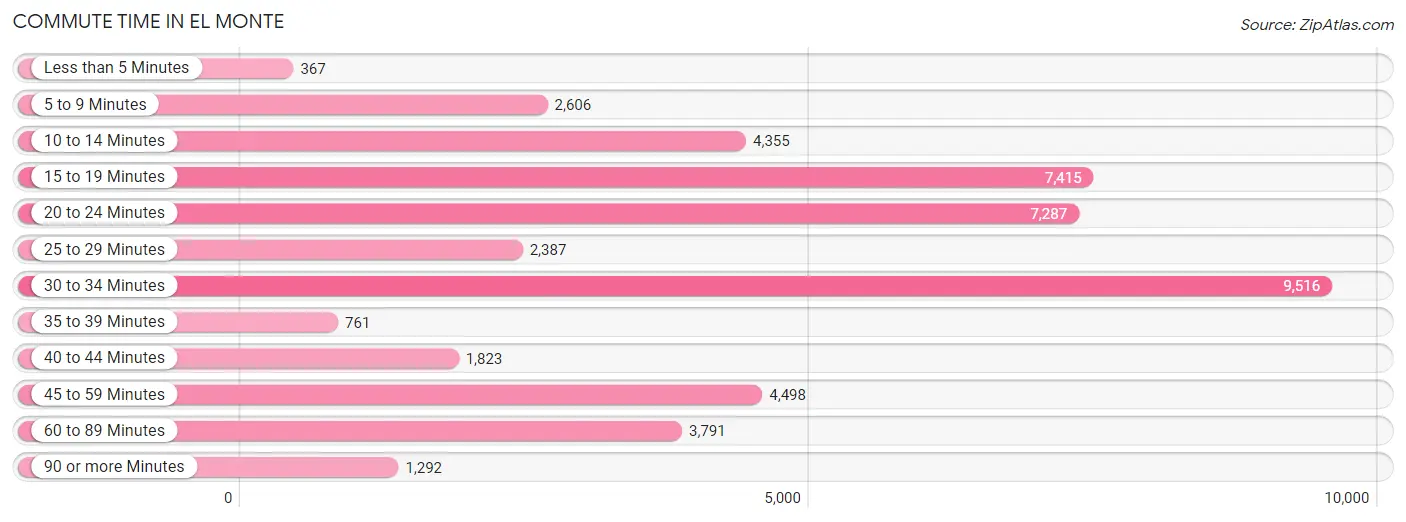
| Commute Time | # Commuters | % Commuters |
| Less than 5 Minutes | 367 | 0.8% |
| 5 to 9 Minutes | 2,606 | 5.7% |
| 10 to 14 Minutes | 4,355 | 9.5% |
| 15 to 19 Minutes | 7,415 | 16.1% |
| 20 to 24 Minutes | 7,287 | 15.8% |
| 25 to 29 Minutes | 2,387 | 5.2% |
| 30 to 34 Minutes | 9,516 | 20.6% |
| 35 to 39 Minutes | 761 | 1.7% |
| 40 to 44 Minutes | 1,823 | 4.0% |
| 45 to 59 Minutes | 4,498 | 9.8% |
| 60 to 89 Minutes | 3,791 | 8.2% |
| 90 or more Minutes | 1,292 | 2.8% |
Commute Time by Sex in El Monte
The most common commute times in El Monte are 30 to 34 minutes (5,522 commuters, 21.1%) for males and 30 to 34 minutes (3,994 commuters, 20.1%) for females.
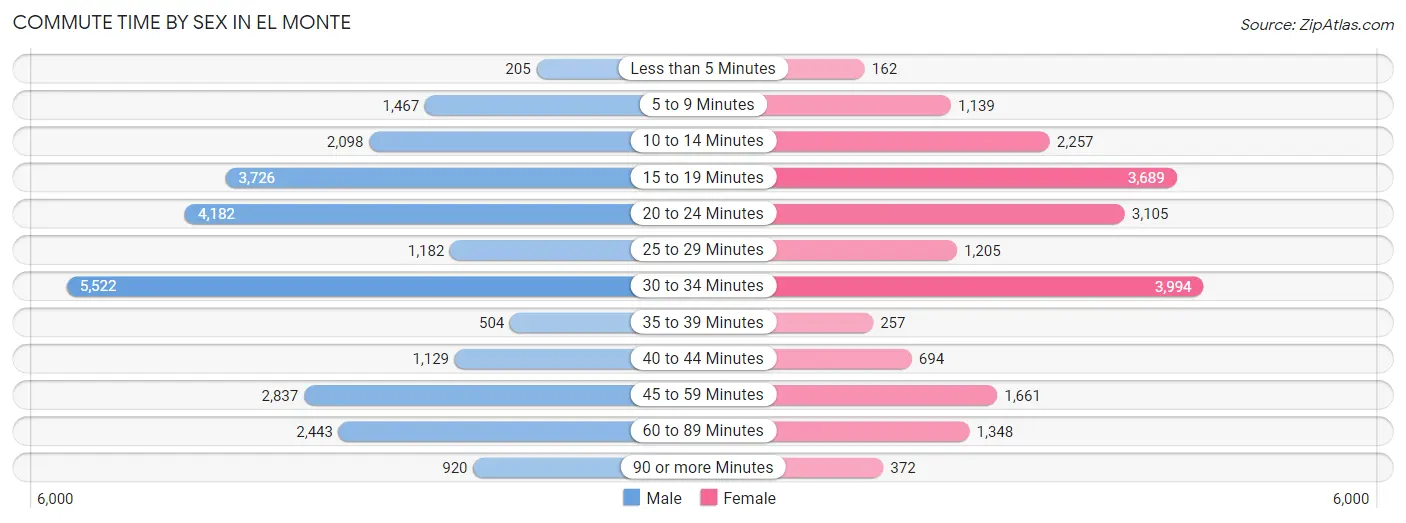
| Commute Time | Male | Female |
| Less than 5 Minutes | 205 (0.8%) | 162 (0.8%) |
| 5 to 9 Minutes | 1,467 (5.6%) | 1,139 (5.7%) |
| 10 to 14 Minutes | 2,098 (8.0%) | 2,257 (11.4%) |
| 15 to 19 Minutes | 3,726 (14.2%) | 3,689 (18.5%) |
| 20 to 24 Minutes | 4,182 (16.0%) | 3,105 (15.6%) |
| 25 to 29 Minutes | 1,182 (4.5%) | 1,205 (6.1%) |
| 30 to 34 Minutes | 5,522 (21.1%) | 3,994 (20.1%) |
| 35 to 39 Minutes | 504 (1.9%) | 257 (1.3%) |
| 40 to 44 Minutes | 1,129 (4.3%) | 694 (3.5%) |
| 45 to 59 Minutes | 2,837 (10.8%) | 1,661 (8.4%) |
| 60 to 89 Minutes | 2,443 (9.3%) | 1,348 (6.8%) |
| 90 or more Minutes | 920 (3.5%) | 372 (1.9%) |
Time of Departure to Work by Sex in El Monte
The most frequent times of departure to work in El Monte are 8:00 AM to 8:29 AM (3,203, 12.2%) for males and 7:00 AM to 7:29 AM (2,565, 12.9%) for females.
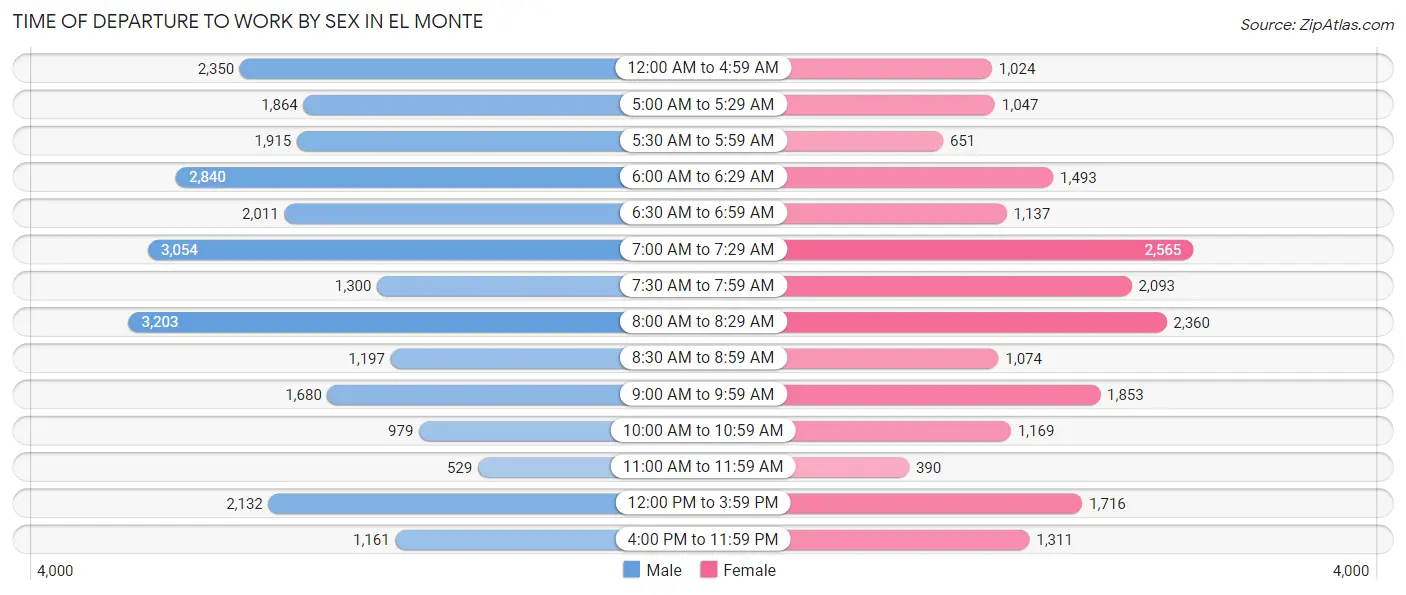
| Time of Departure | Male | Female |
| 12:00 AM to 4:59 AM | 2,350 (9.0%) | 1,024 (5.1%) |
| 5:00 AM to 5:29 AM | 1,864 (7.1%) | 1,047 (5.3%) |
| 5:30 AM to 5:59 AM | 1,915 (7.3%) | 651 (3.3%) |
| 6:00 AM to 6:29 AM | 2,840 (10.8%) | 1,493 (7.5%) |
| 6:30 AM to 6:59 AM | 2,011 (7.7%) | 1,137 (5.7%) |
| 7:00 AM to 7:29 AM | 3,054 (11.7%) | 2,565 (12.9%) |
| 7:30 AM to 7:59 AM | 1,300 (5.0%) | 2,093 (10.5%) |
| 8:00 AM to 8:29 AM | 3,203 (12.2%) | 2,360 (11.9%) |
| 8:30 AM to 8:59 AM | 1,197 (4.6%) | 1,074 (5.4%) |
| 9:00 AM to 9:59 AM | 1,680 (6.4%) | 1,853 (9.3%) |
| 10:00 AM to 10:59 AM | 979 (3.7%) | 1,169 (5.9%) |
| 11:00 AM to 11:59 AM | 529 (2.0%) | 390 (2.0%) |
| 12:00 PM to 3:59 PM | 2,132 (8.1%) | 1,716 (8.6%) |
| 4:00 PM to 11:59 PM | 1,161 (4.4%) | 1,311 (6.6%) |
| Total | 26,215 (100.0%) | 19,883 (100.0%) |
Housing Occupancy in El Monte
Occupancy by Ownership in El Monte
Of the total 29,660 dwellings in El Monte, owner-occupied units account for 11,758 (39.6%), while renter-occupied units make up 17,902 (60.4%).
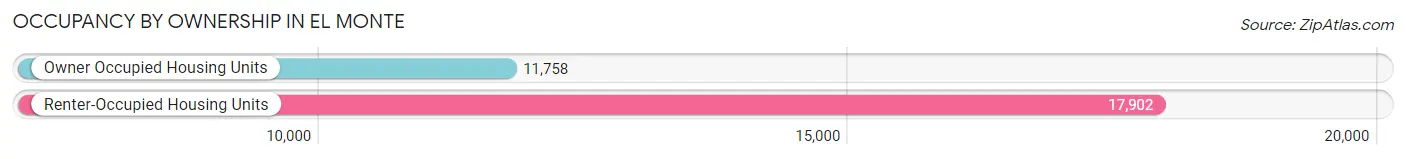
| Occupancy | # Housing Units | % Housing Units |
| Owner Occupied Housing Units | 11,758 | 39.6% |
| Renter-Occupied Housing Units | 17,902 | 60.4% |
| Total Occupied Housing Units | 29,660 | 100.0% |
Occupancy by Household Size in El Monte
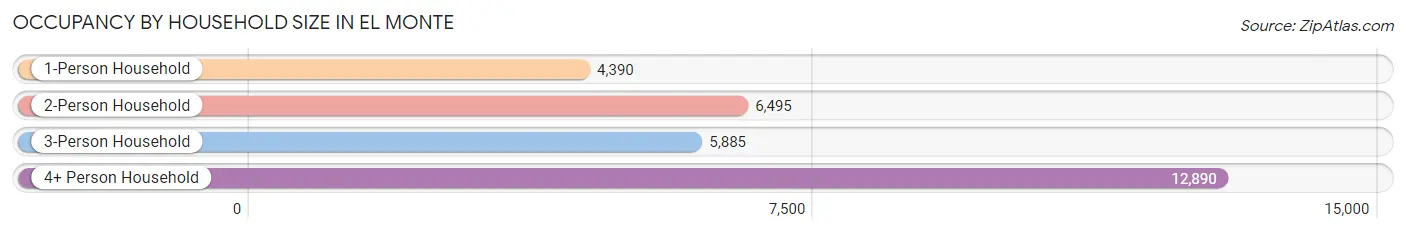
| Household Size | # Housing Units | % Housing Units |
| 1-Person Household | 4,390 | 14.8% |
| 2-Person Household | 6,495 | 21.9% |
| 3-Person Household | 5,885 | 19.8% |
| 4+ Person Household | 12,890 | 43.5% |
| Total Housing Units | 29,660 | 100.0% |
Occupancy by Ownership by Household Size in El Monte
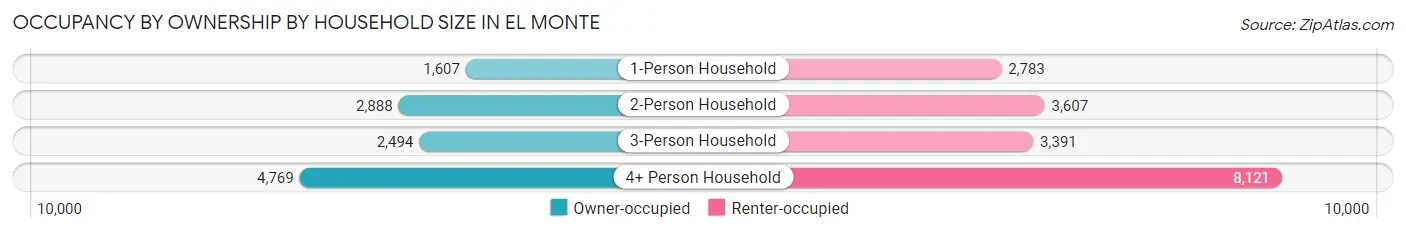
| Household Size | Owner-occupied | Renter-occupied |
| 1-Person Household | 1,607 (36.6%) | 2,783 (63.4%) |
| 2-Person Household | 2,888 (44.5%) | 3,607 (55.5%) |
| 3-Person Household | 2,494 (42.4%) | 3,391 (57.6%) |
| 4+ Person Household | 4,769 (37.0%) | 8,121 (63.0%) |
| Total Housing Units | 11,758 (39.6%) | 17,902 (60.4%) |
Occupancy by Educational Attainment in El Monte
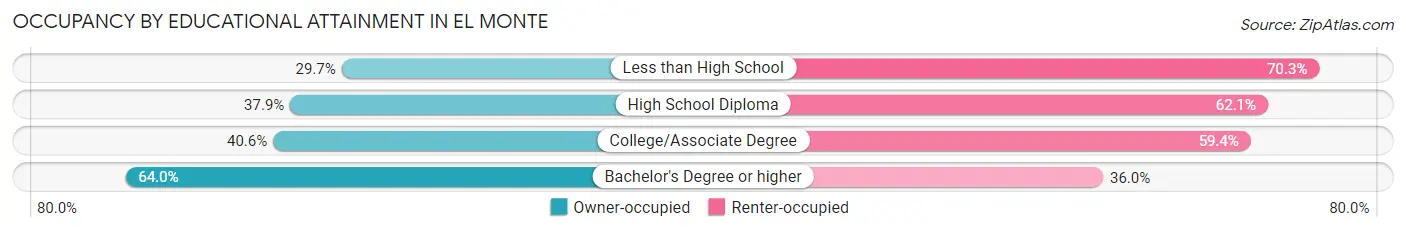
| Household Size | Owner-occupied | Renter-occupied |
| Less than High School | 3,008 (29.7%) | 7,109 (70.3%) |
| High School Diploma | 3,036 (37.9%) | 4,979 (62.1%) |
| College/Associate Degree | 2,888 (40.6%) | 4,226 (59.4%) |
| Bachelor's Degree or higher | 2,826 (64.0%) | 1,588 (36.0%) |
Occupancy by Age of Householder in El Monte
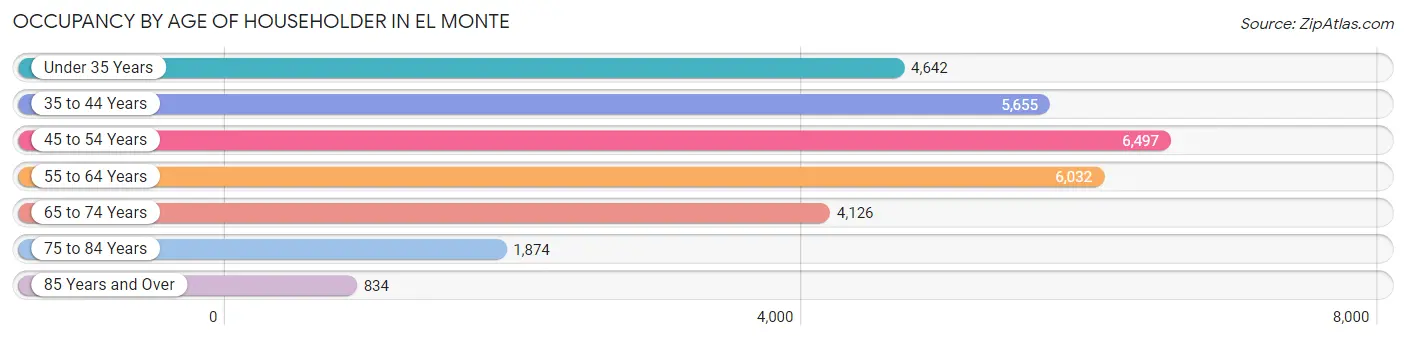
| Age Bracket | # Households | % Households |
| Under 35 Years | 4,642 | 15.7% |
| 35 to 44 Years | 5,655 | 19.1% |
| 45 to 54 Years | 6,497 | 21.9% |
| 55 to 64 Years | 6,032 | 20.3% |
| 65 to 74 Years | 4,126 | 13.9% |
| 75 to 84 Years | 1,874 | 6.3% |
| 85 Years and Over | 834 | 2.8% |
| Total | 29,660 | 100.0% |
Housing Finances in El Monte
Median Income by Occupancy in El Monte
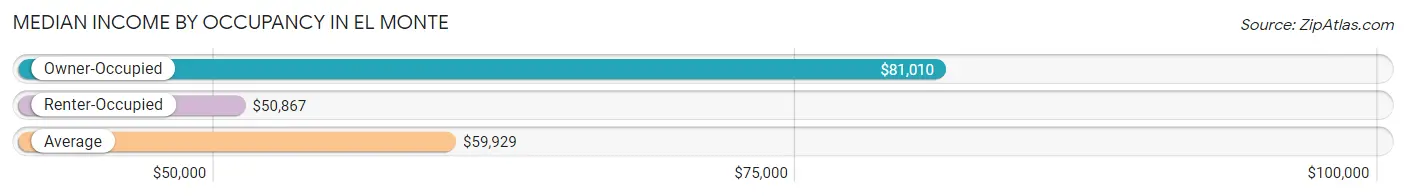
| Occupancy Type | # Households | Median Income |
| Owner-Occupied | 11,758 (39.6%) | $81,010 |
| Renter-Occupied | 17,902 (60.4%) | $50,867 |
| Average | 29,660 (100.0%) | $59,929 |
Occupancy by Householder Income Bracket in El Monte
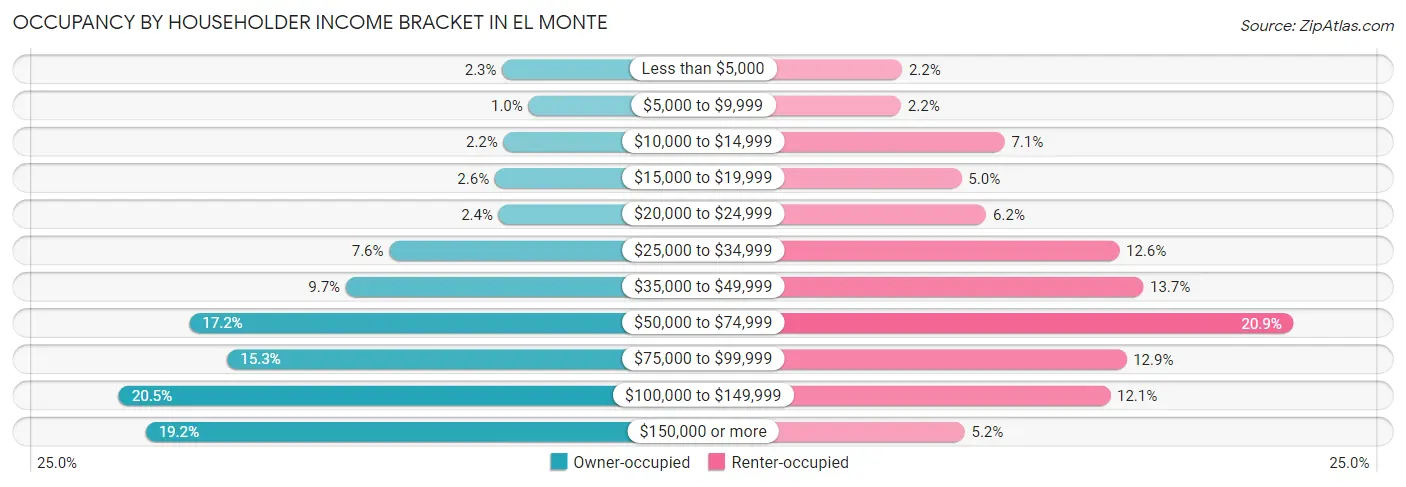
| Income Bracket | Owner-occupied | Renter-occupied |
| Less than $5,000 | 264 (2.2%) | 396 (2.2%) |
| $5,000 to $9,999 | 117 (1.0%) | 386 (2.2%) |
| $10,000 to $14,999 | 257 (2.2%) | 1,269 (7.1%) |
| $15,000 to $19,999 | 306 (2.6%) | 902 (5.0%) |
| $20,000 to $24,999 | 284 (2.4%) | 1,113 (6.2%) |
| $25,000 to $34,999 | 897 (7.6%) | 2,246 (12.6%) |
| $35,000 to $49,999 | 1,140 (9.7%) | 2,450 (13.7%) |
| $50,000 to $74,999 | 2,017 (17.2%) | 3,734 (20.9%) |
| $75,000 to $99,999 | 1,804 (15.3%) | 2,307 (12.9%) |
| $100,000 to $149,999 | 2,411 (20.5%) | 2,169 (12.1%) |
| $150,000 or more | 2,261 (19.2%) | 930 (5.2%) |
| Total | 11,758 (100.0%) | 17,902 (100.0%) |
Monthly Housing Cost Tiers in El Monte
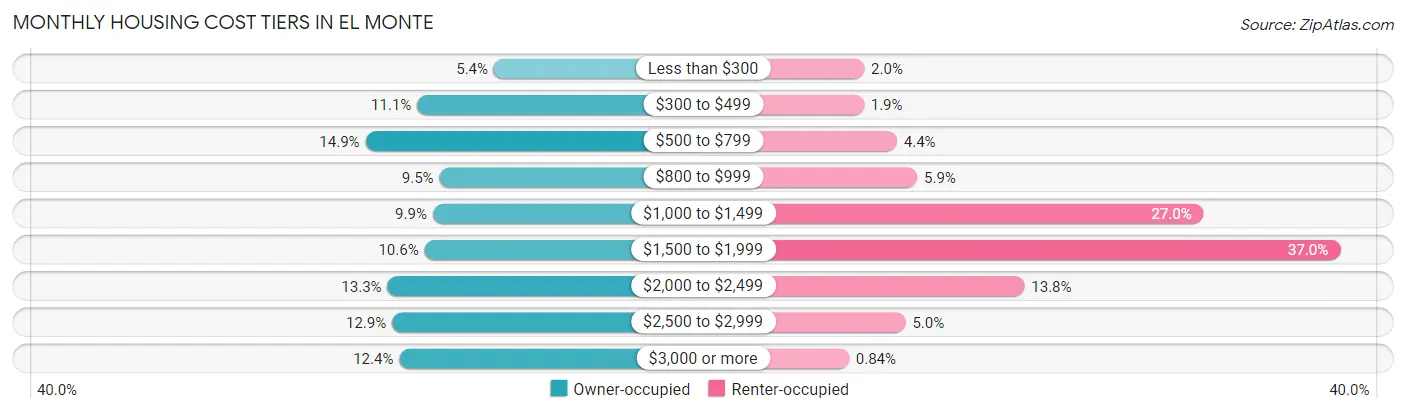
| Monthly Cost | Owner-occupied | Renter-occupied |
| Less than $300 | 640 (5.4%) | 352 (2.0%) |
| $300 to $499 | 1,304 (11.1%) | 347 (1.9%) |
| $500 to $799 | 1,752 (14.9%) | 784 (4.4%) |
| $800 to $999 | 1,111 (9.5%) | 1,050 (5.9%) |
| $1,000 to $1,499 | 1,169 (9.9%) | 4,828 (27.0%) |
| $1,500 to $1,999 | 1,240 (10.5%) | 6,628 (37.0%) |
| $2,000 to $2,499 | 1,561 (13.3%) | 2,465 (13.8%) |
| $2,500 to $2,999 | 1,522 (12.9%) | 896 (5.0%) |
| $3,000 or more | 1,459 (12.4%) | 151 (0.8%) |
| Total | 11,758 (100.0%) | 17,902 (100.0%) |
Physical Housing Characteristics in El Monte
Housing Structures in El Monte
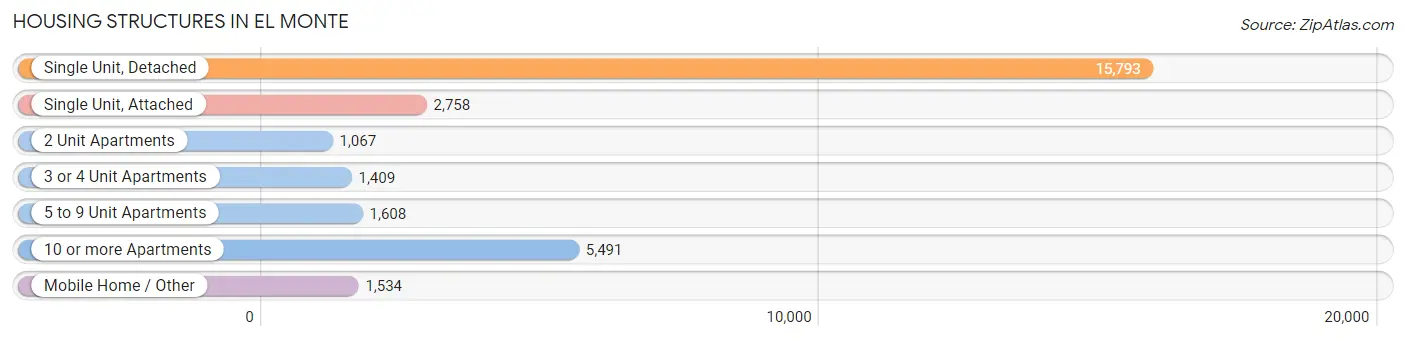
| Structure Type | # Housing Units | % Housing Units |
| Single Unit, Detached | 15,793 | 53.2% |
| Single Unit, Attached | 2,758 | 9.3% |
| 2 Unit Apartments | 1,067 | 3.6% |
| 3 or 4 Unit Apartments | 1,409 | 4.8% |
| 5 to 9 Unit Apartments | 1,608 | 5.4% |
| 10 or more Apartments | 5,491 | 18.5% |
| Mobile Home / Other | 1,534 | 5.2% |
| Total | 29,660 | 100.0% |
Housing Structures by Occupancy in El Monte
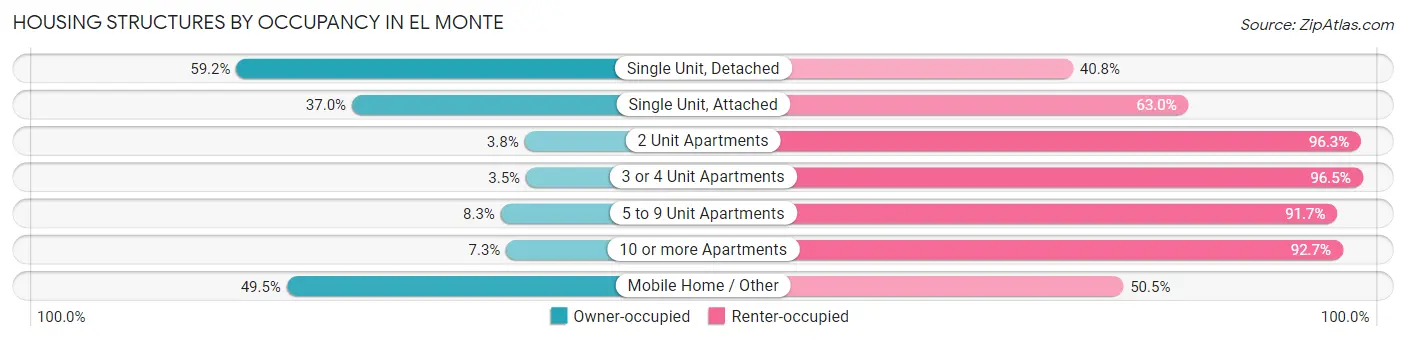
| Structure Type | Owner-occupied | Renter-occupied |
| Single Unit, Detached | 9,355 (59.2%) | 6,438 (40.8%) |
| Single Unit, Attached | 1,020 (37.0%) | 1,738 (63.0%) |
| 2 Unit Apartments | 40 (3.7%) | 1,027 (96.3%) |
| 3 or 4 Unit Apartments | 49 (3.5%) | 1,360 (96.5%) |
| 5 to 9 Unit Apartments | 134 (8.3%) | 1,474 (91.7%) |
| 10 or more Apartments | 400 (7.3%) | 5,091 (92.7%) |
| Mobile Home / Other | 760 (49.5%) | 774 (50.5%) |
| Total | 11,758 (39.6%) | 17,902 (60.4%) |
Housing Structures by Number of Rooms in El Monte
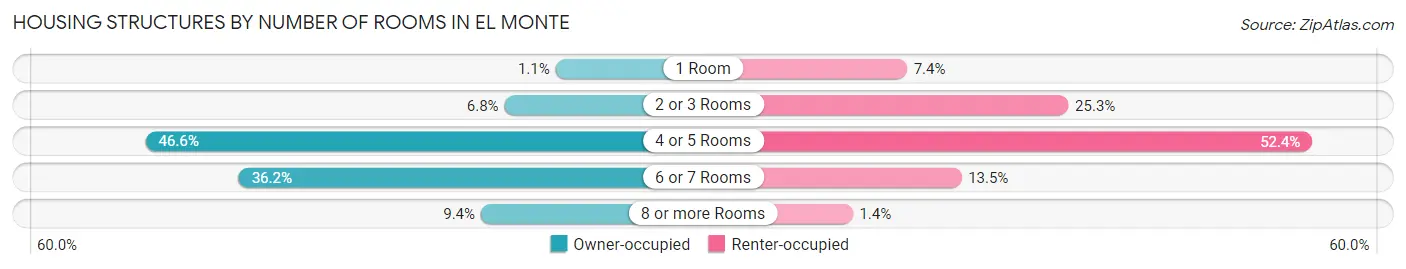
| Number of Rooms | Owner-occupied | Renter-occupied |
| 1 Room | 126 (1.1%) | 1,327 (7.4%) |
| 2 or 3 Rooms | 794 (6.8%) | 4,535 (25.3%) |
| 4 or 5 Rooms | 5,477 (46.6%) | 9,382 (52.4%) |
| 6 or 7 Rooms | 4,260 (36.2%) | 2,409 (13.5%) |
| 8 or more Rooms | 1,101 (9.4%) | 249 (1.4%) |
| Total | 11,758 (100.0%) | 17,902 (100.0%) |
Housing Structure by Heating Type in El Monte
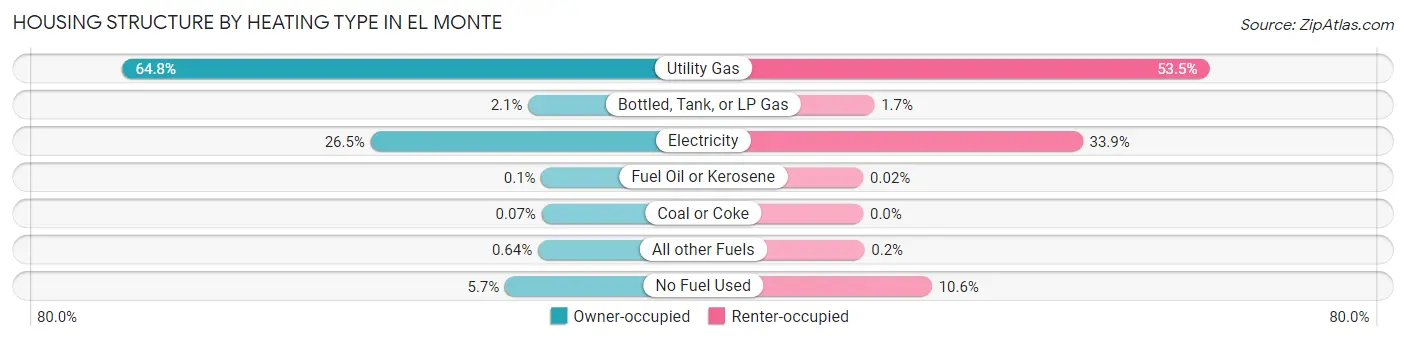
| Heating Type | Owner-occupied | Renter-occupied |
| Utility Gas | 7,624 (64.8%) | 9,579 (53.5%) |
| Bottled, Tank, or LP Gas | 250 (2.1%) | 309 (1.7%) |
| Electricity | 3,116 (26.5%) | 6,075 (33.9%) |
| Fuel Oil or Kerosene | 12 (0.1%) | 4 (0.0%) |
| Coal or Coke | 8 (0.1%) | 0 (0.0%) |
| All other Fuels | 75 (0.6%) | 36 (0.2%) |
| No Fuel Used | 673 (5.7%) | 1,899 (10.6%) |
| Total | 11,758 (100.0%) | 17,902 (100.0%) |
Household Vehicle Usage in El Monte
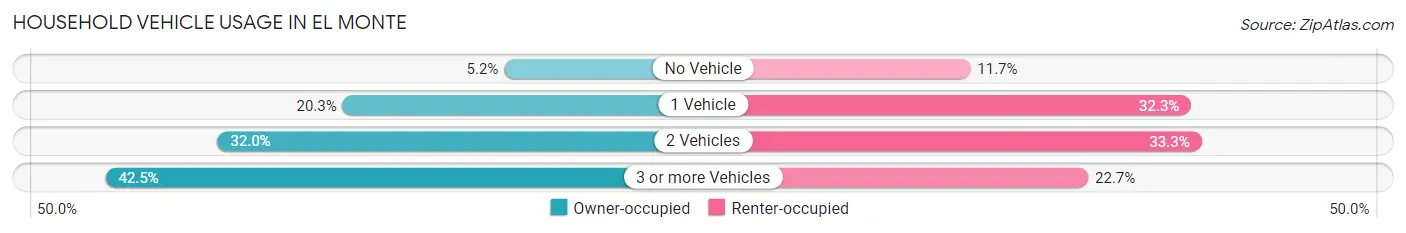
| Vehicles per Household | Owner-occupied | Renter-occupied |
| No Vehicle | 615 (5.2%) | 2,096 (11.7%) |
| 1 Vehicle | 2,389 (20.3%) | 5,786 (32.3%) |
| 2 Vehicles | 3,763 (32.0%) | 5,957 (33.3%) |
| 3 or more Vehicles | 4,991 (42.4%) | 4,063 (22.7%) |
| Total | 11,758 (100.0%) | 17,902 (100.0%) |
Real Estate & Mortgages in El Monte
Real Estate and Mortgage Overview in El Monte
| Characteristic | Without Mortgage | With Mortgage |
| Housing Units | 5,179 | 6,579 |
| Median Property Value | $580,800 | $609,000 |
| Median Household Income | $68,656 | $1,448 |
| Monthly Housing Costs | $609 | $1,459 |
| Real Estate Taxes | $3,624 | $155 |
Property Value by Mortgage Status in El Monte
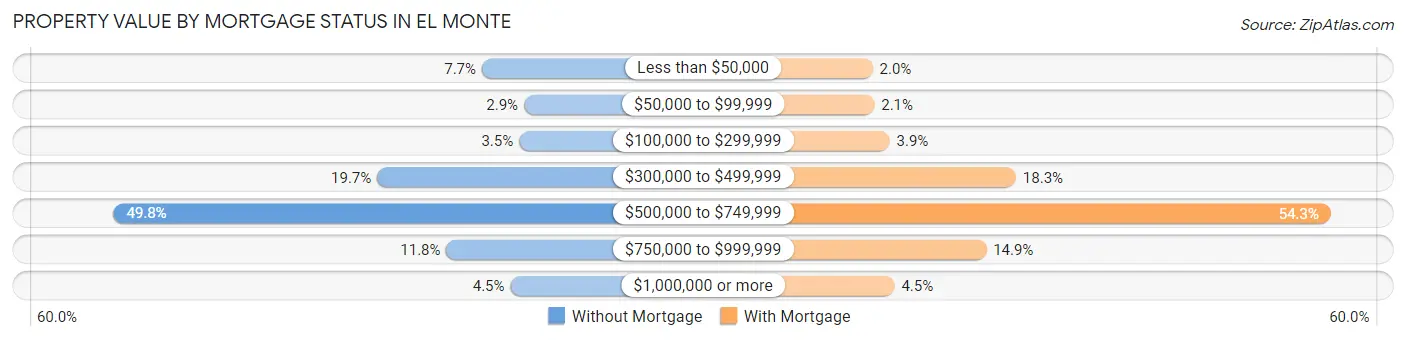
| Property Value | Without Mortgage | With Mortgage |
| Less than $50,000 | 401 (7.7%) | 128 (1.9%) |
| $50,000 to $99,999 | 152 (2.9%) | 141 (2.1%) |
| $100,000 to $299,999 | 181 (3.5%) | 256 (3.9%) |
| $300,000 to $499,999 | 1,021 (19.7%) | 1,206 (18.3%) |
| $500,000 to $749,999 | 2,581 (49.8%) | 3,573 (54.3%) |
| $750,000 to $999,999 | 611 (11.8%) | 982 (14.9%) |
| $1,000,000 or more | 232 (4.5%) | 293 (4.4%) |
| Total | 5,179 (100.0%) | 6,579 (100.0%) |
Household Income by Mortgage Status in El Monte
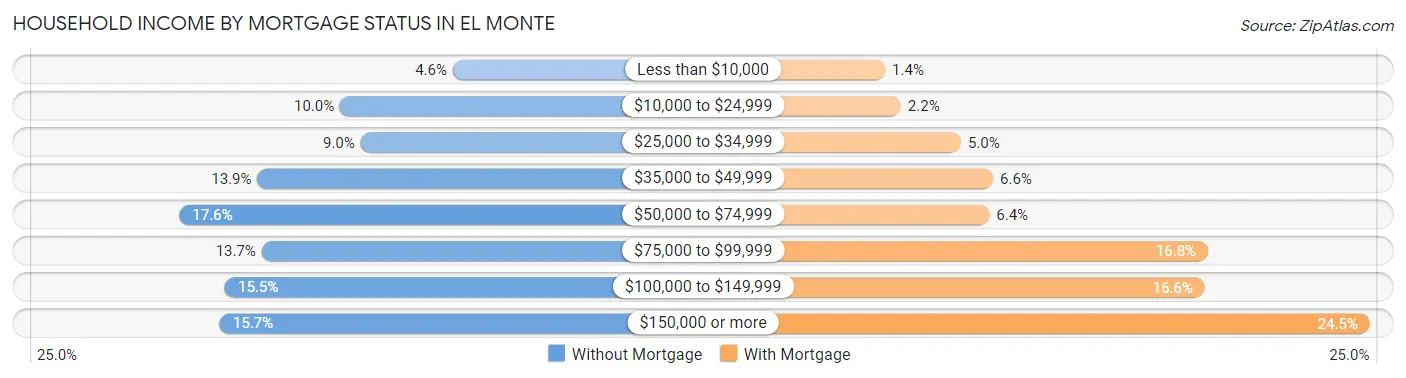
| Household Income | Without Mortgage | With Mortgage |
| Less than $10,000 | 239 (4.6%) | 93 (1.4%) |
| $10,000 to $24,999 | 517 (10.0%) | 142 (2.2%) |
| $25,000 to $34,999 | 466 (9.0%) | 330 (5.0%) |
| $35,000 to $49,999 | 721 (13.9%) | 431 (6.6%) |
| $50,000 to $74,999 | 913 (17.6%) | 419 (6.4%) |
| $75,000 to $99,999 | 710 (13.7%) | 1,104 (16.8%) |
| $100,000 to $149,999 | 800 (15.4%) | 1,094 (16.6%) |
| $150,000 or more | 813 (15.7%) | 1,611 (24.5%) |
| Total | 5,179 (100.0%) | 6,579 (100.0%) |
Property Value to Household Income Ratio in El Monte
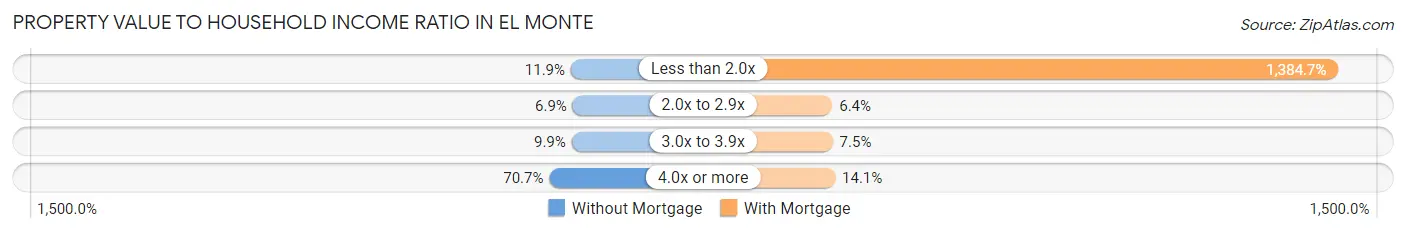
| Value-to-Income Ratio | Without Mortgage | With Mortgage |
| Less than 2.0x | 617 (11.9%) | 91,102 (1,384.7%) |
| 2.0x to 2.9x | 356 (6.9%) | 424 (6.4%) |
| 3.0x to 3.9x | 511 (9.9%) | 492 (7.5%) |
| 4.0x or more | 3,659 (70.7%) | 925 (14.1%) |
| Total | 5,179 (100.0%) | 6,579 (100.0%) |
Real Estate Taxes by Mortgage Status in El Monte
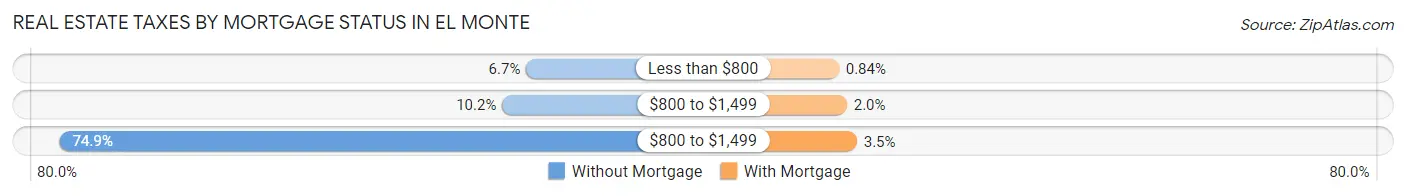
| Property Taxes | Without Mortgage | With Mortgage |
| Less than $800 | 347 (6.7%) | 55 (0.8%) |
| $800 to $1,499 | 529 (10.2%) | 132 (2.0%) |
| $800 to $1,499 | 3,879 (74.9%) | 228 (3.5%) |
| Total | 5,179 (100.0%) | 6,579 (100.0%) |
Health & Disability in El Monte
Health Insurance Coverage by Age in El Monte
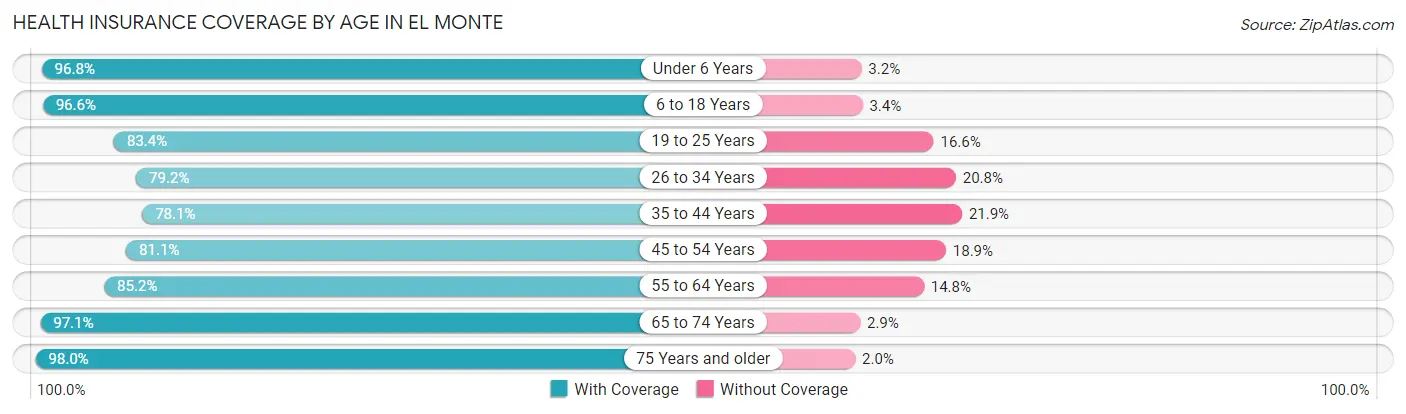
| Age Bracket | With Coverage | Without Coverage |
| Under 6 Years | 7,532 (96.8%) | 248 (3.2%) |
| 6 to 18 Years | 17,490 (96.6%) | 611 (3.4%) |
| 19 to 25 Years | 9,336 (83.4%) | 1,864 (16.6%) |
| 26 to 34 Years | 10,589 (79.2%) | 2,781 (20.8%) |
| 35 to 44 Years | 11,384 (78.1%) | 3,199 (21.9%) |
| 45 to 54 Years | 12,024 (81.1%) | 2,810 (18.9%) |
| 55 to 64 Years | 10,835 (85.2%) | 1,885 (14.8%) |
| 65 to 74 Years | 8,661 (97.1%) | 261 (2.9%) |
| 75 Years and older | 6,172 (98.0%) | 127 (2.0%) |
| Total | 94,023 (87.2%) | 13,786 (12.8%) |
Health Insurance Coverage by Citizenship Status in El Monte
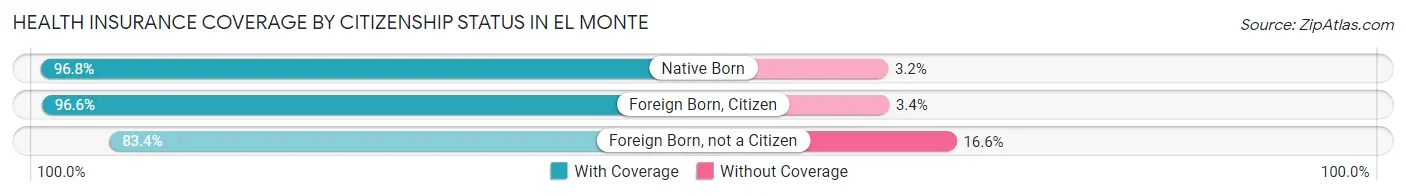
| Citizenship Status | With Coverage | Without Coverage |
| Native Born | 7,532 (96.8%) | 248 (3.2%) |
| Foreign Born, Citizen | 17,490 (96.6%) | 611 (3.4%) |
| Foreign Born, not a Citizen | 9,336 (83.4%) | 1,864 (16.6%) |
Health Insurance Coverage by Household Income in El Monte
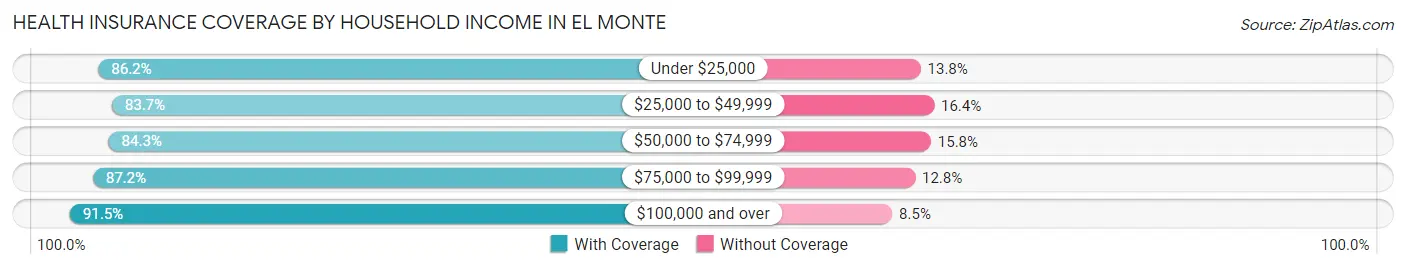
| Household Income | With Coverage | Without Coverage |
| Under $25,000 | 9,329 (86.2%) | 1,497 (13.8%) |
| $25,000 to $49,999 | 18,721 (83.7%) | 3,660 (16.4%) |
| $50,000 to $74,999 | 17,705 (84.3%) | 3,309 (15.8%) |
| $75,000 to $99,999 | 14,595 (87.2%) | 2,139 (12.8%) |
| $100,000 and over | 32,971 (91.5%) | 3,062 (8.5%) |
Public vs Private Health Insurance Coverage by Age in El Monte
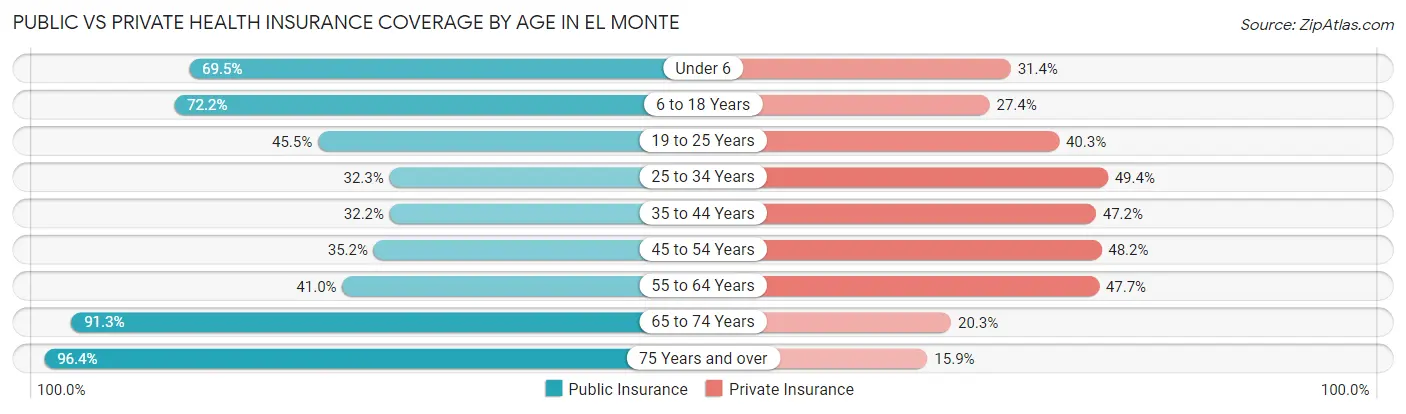
| Age Bracket | Public Insurance | Private Insurance |
| Under 6 | 5,404 (69.5%) | 2,439 (31.4%) |
| 6 to 18 Years | 13,076 (72.2%) | 4,964 (27.4%) |
| 19 to 25 Years | 5,099 (45.5%) | 4,515 (40.3%) |
| 25 to 34 Years | 4,313 (32.3%) | 6,600 (49.4%) |
| 35 to 44 Years | 4,696 (32.2%) | 6,876 (47.1%) |
| 45 to 54 Years | 5,219 (35.2%) | 7,146 (48.2%) |
| 55 to 64 Years | 5,217 (41.0%) | 6,070 (47.7%) |
| 65 to 74 Years | 8,149 (91.3%) | 1,809 (20.3%) |
| 75 Years and over | 6,070 (96.4%) | 1,001 (15.9%) |
| Total | 57,243 (53.1%) | 41,420 (38.4%) |
Disability Status by Sex by Age in El Monte
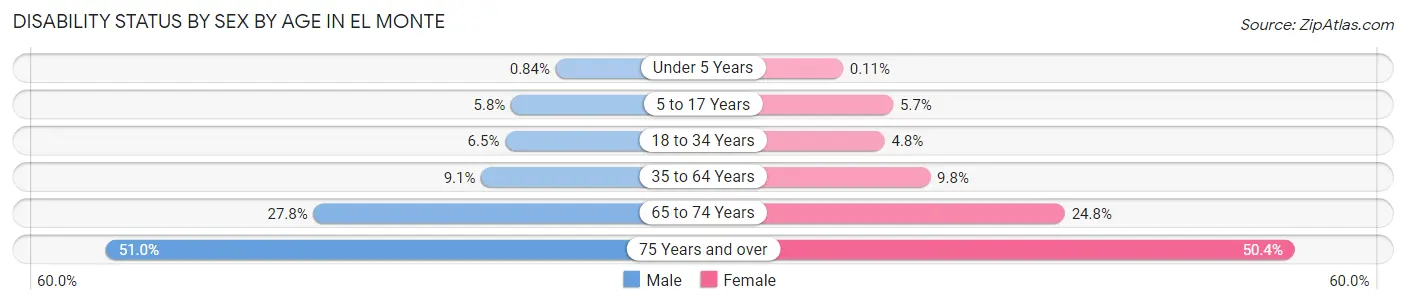
| Age Bracket | Male | Female |
| Under 5 Years | 31 (0.8%) | 3 (0.1%) |
| 5 to 17 Years | 513 (5.8%) | 512 (5.7%) |
| 18 to 34 Years | 871 (6.5%) | 605 (4.8%) |
| 35 to 64 Years | 1,979 (9.1%) | 2,016 (9.8%) |
| 65 to 74 Years | 1,158 (27.8%) | 1,182 (24.8%) |
| 75 Years and over | 1,362 (50.9%) | 1,829 (50.4%) |
Disability Class by Sex by Age in El Monte
Disability Class: Hearing Difficulty
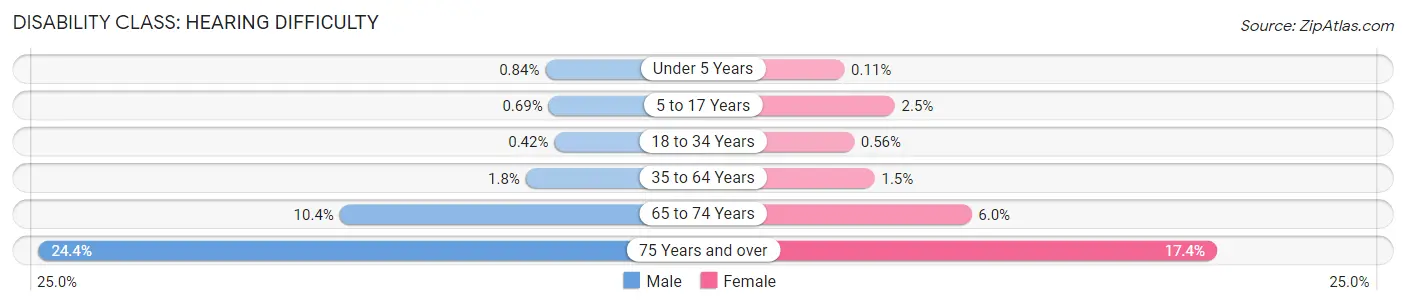
| Age Bracket | Male | Female |
| Under 5 Years | 31 (0.8%) | 3 (0.1%) |
| 5 to 17 Years | 61 (0.7%) | 220 (2.5%) |
| 18 to 34 Years | 57 (0.4%) | 71 (0.6%) |
| 35 to 64 Years | 379 (1.8%) | 311 (1.5%) |
| 65 to 74 Years | 432 (10.4%) | 286 (6.0%) |
| 75 Years and over | 651 (24.3%) | 631 (17.4%) |
Disability Class: Vision Difficulty
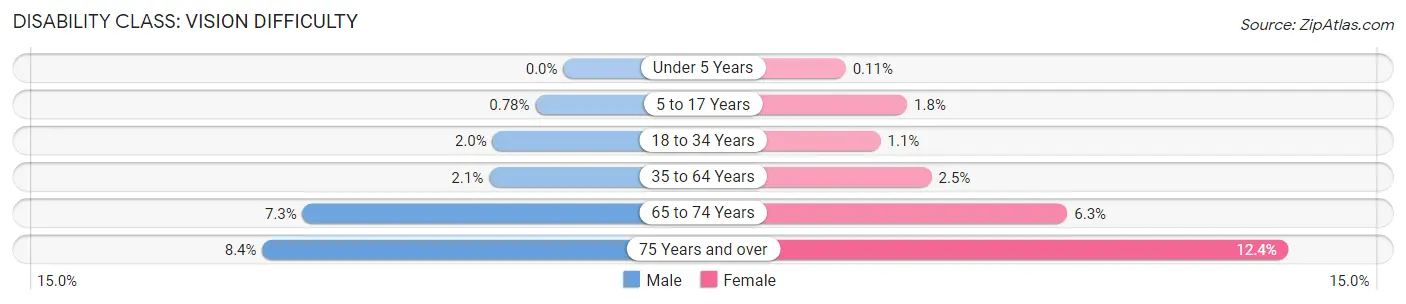
| Age Bracket | Male | Female |
| Under 5 Years | 0 (0.0%) | 3 (0.1%) |
| 5 to 17 Years | 69 (0.8%) | 163 (1.8%) |
| 18 to 34 Years | 266 (2.0%) | 137 (1.1%) |
| 35 to 64 Years | 447 (2.1%) | 513 (2.5%) |
| 65 to 74 Years | 302 (7.3%) | 299 (6.3%) |
| 75 Years and over | 224 (8.4%) | 451 (12.4%) |
Disability Class: Cognitive Difficulty
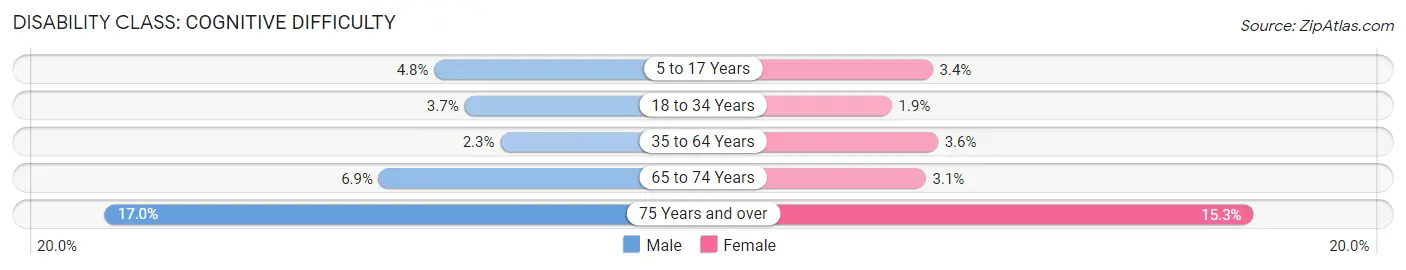
| Age Bracket | Male | Female |
| 5 to 17 Years | 423 (4.8%) | 302 (3.4%) |
| 18 to 34 Years | 495 (3.7%) | 235 (1.8%) |
| 35 to 64 Years | 507 (2.3%) | 729 (3.6%) |
| 65 to 74 Years | 285 (6.9%) | 148 (3.1%) |
| 75 Years and over | 455 (17.0%) | 554 (15.3%) |
Disability Class: Ambulatory Difficulty
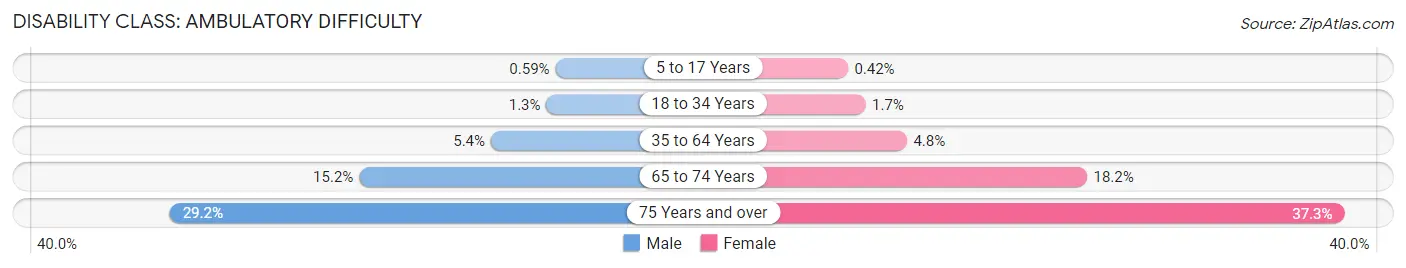
| Age Bracket | Male | Female |
| 5 to 17 Years | 52 (0.6%) | 38 (0.4%) |
| 18 to 34 Years | 170 (1.3%) | 220 (1.7%) |
| 35 to 64 Years | 1,164 (5.4%) | 983 (4.8%) |
| 65 to 74 Years | 631 (15.2%) | 865 (18.2%) |
| 75 Years and over | 781 (29.2%) | 1,353 (37.3%) |
Disability Class: Self-Care Difficulty
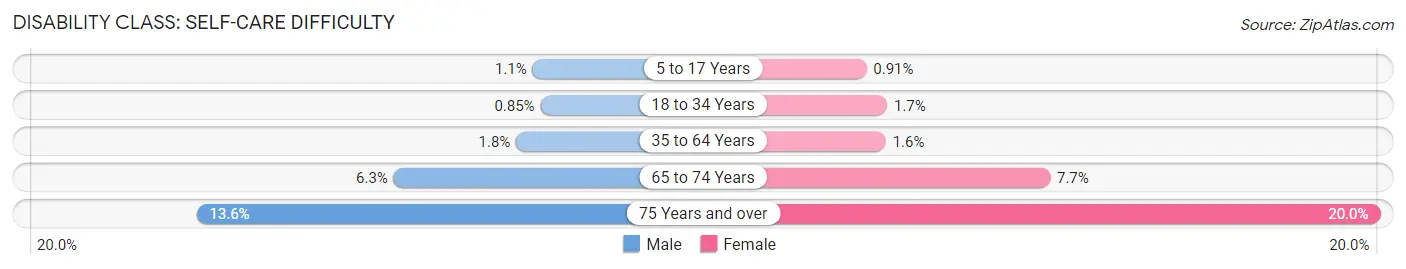
| Age Bracket | Male | Female |
| 5 to 17 Years | 101 (1.1%) | 82 (0.9%) |
| 18 to 34 Years | 115 (0.9%) | 214 (1.7%) |
| 35 to 64 Years | 378 (1.8%) | 334 (1.6%) |
| 65 to 74 Years | 262 (6.3%) | 368 (7.7%) |
| 75 Years and over | 364 (13.6%) | 725 (20.0%) |
Technology Access in El Monte
Computing Device Access in El Monte
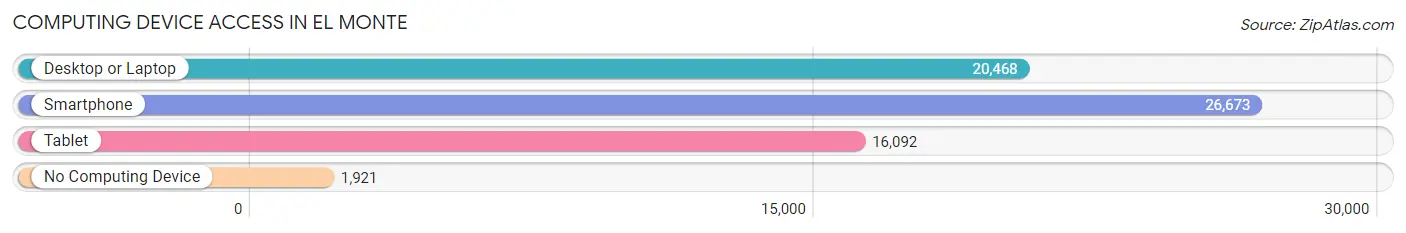
| Device Type | # Households | % Households |
| Desktop or Laptop | 20,468 | 69.0% |
| Smartphone | 26,673 | 89.9% |
| Tablet | 16,092 | 54.2% |
| No Computing Device | 1,921 | 6.5% |
| Total | 29,660 | 100.0% |
Internet Access in El Monte
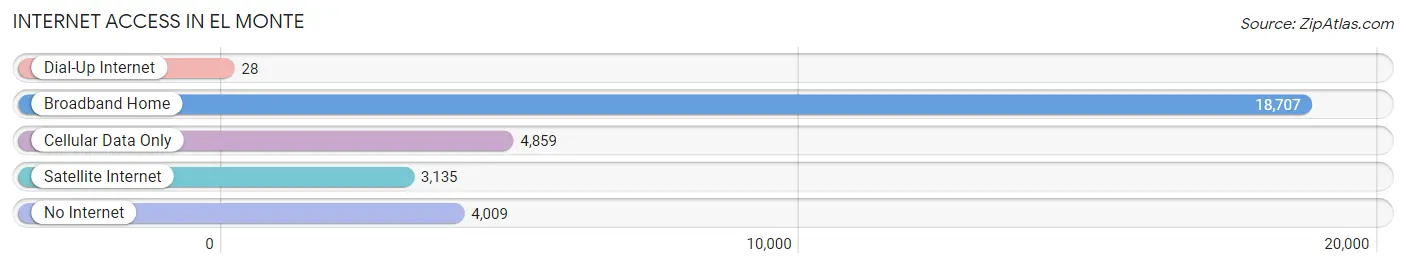
| Internet Type | # Households | % Households |
| Dial-Up Internet | 28 | 0.1% |
| Broadband Home | 18,707 | 63.1% |
| Cellular Data Only | 4,859 | 16.4% |
| Satellite Internet | 3,135 | 10.6% |
| No Internet | 4,009 | 13.5% |
| Total | 29,660 | 100.0% |
El Monte Summary
El Monte, California is a city located in the San Gabriel Valley of Los Angeles County, California. It is situated approximately 11 miles east of downtown Los Angeles and is part of the Greater Los Angeles Area. The city has a population of approximately 113,475 people, making it the 20th largest city in Los Angeles County.
History
El Monte was originally inhabited by the Tongva and Chumash Native American tribes. The area was first explored by Spanish missionaries in 1776, and the city was officially founded in 1849. The city was named after the nearby El Monte Valley, which was named after a Spanish phrase meaning “the mountain”.
In the late 19th century, El Monte became a popular destination for wealthy Los Angeles residents who wanted to escape the hustle and bustle of the city. The city was also known for its agricultural production, which included citrus, grapes, and walnuts.
In the early 20th century, El Monte experienced a population boom due to the construction of the Los Angeles Aqueduct, which brought water to the area. This allowed for the development of the city’s agricultural industry, as well as the growth of its residential neighborhoods.
Geography
El Monte is located in the San Gabriel Valley of Los Angeles County, California. It is situated approximately 11 miles east of downtown Los Angeles and is part of the Greater Los Angeles Area. The city has a total area of 9.2 square miles, of which 8.9 square miles is land and 0.3 square miles is water.
The city is bordered by the cities of South El Monte, Baldwin Park, and Irwindale to the north, the city of Rosemead to the east, the city of South San Gabriel to the south, and the cities of Temple City and Arcadia to the west.
Economy
El Monte’s economy is largely based on the service industry, with many residents employed in retail, healthcare, and hospitality. The city is also home to several manufacturing and distribution companies, including the El Monte-based company, Frito-Lay.
The city is also home to several educational institutions, including Rio Hondo College, El Monte Union High School District, and the El Monte-Rosemead Adult School.
Demographics
As of the 2010 census, El Monte had a population of 113,475 people. The racial makeup of the city was 57.2% Hispanic or Latino, 28.2% White, 8.2% Asian, 5.2% African American, and 1.2% other.
The median household income in El Monte was $45,845, and the median family income was $50,945. The per capita income was $20,845. Approximately 20.2% of the population was below the poverty line.
El Monte is a diverse city, with a large Hispanic population. The city is also home to a large Asian population, with the largest ethnic groups being Chinese, Filipino, and Vietnamese. The city is also home to a large population of immigrants from Mexico, Guatemala, and El Salvador.
Common Questions
What is Per Capita Income in El Monte?
Per Capita income in El Monte is $22,865.
What is the Median Family Income in El Monte?
Median Family Income in El Monte is $64,560.
What is the Median Household income in El Monte?
Median Household Income in El Monte is $59,929.
What is Income or Wage Gap in El Monte?
Income or Wage Gap in El Monte is 18.2%.
Women in El Monte earn 81.8 cents for every dollar earned by a man.
What is Family Income Deficit in El Monte?
Family Income Deficit in El Monte is $10,171.
Families that are below poverty line in El Monte earn $10,171 less on average than the poverty threshold level.
What is Inequality or Gini Index in El Monte?
Inequality or Gini Index in El Monte is 0.44.
What is the Total Population of El Monte?
Total Population of El Monte is 108,682.
What is the Total Male Population of El Monte?
Total Male Population of El Monte is 54,901.
What is the Total Female Population of El Monte?
Total Female Population of El Monte is 53,781.
What is the Ratio of Males per 100 Females in El Monte?
There are 102.08 Males per 100 Females in El Monte.
What is the Ratio of Females per 100 Males in El Monte?
There are 97.96 Females per 100 Males in El Monte.
What is the Median Population Age in El Monte?
Median Population Age in El Monte is 37.4 Years.
What is the Average Family Size in El Monte
Average Family Size in El Monte is 4.0 People.
What is the Average Household Size in El Monte
Average Household Size in El Monte is 3.6 People.
How Large is the Labor Force in El Monte?
There are 53,662 People in the Labor Forcein in El Monte.
What is the Percentage of People in the Labor Force in El Monte?
61.4% of People are in the Labor Force in El Monte.
What is the Unemployment Rate in El Monte?
Unemployment Rate in El Monte is 7.0%.