Cities with the Highest Percentage of Households Heated without Fuel in Oklahoma
RELATED REPORTS & OPTIONS
Fuel-less Heating
Oklahoma
Compare Cities
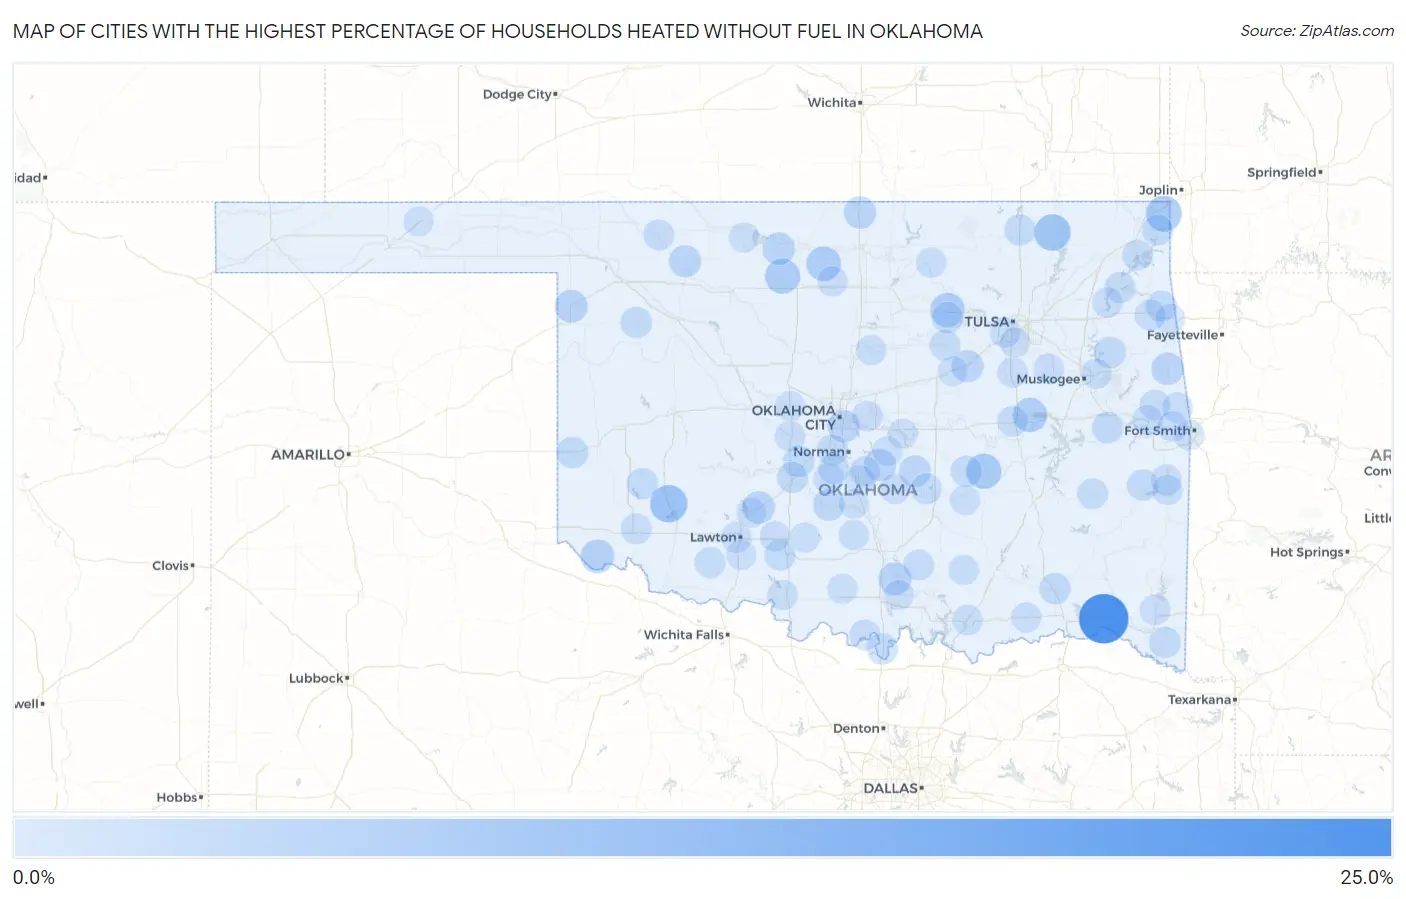
Map of Cities with the Highest Percentage of Households Heated without Fuel in Oklahoma
0.0%
25.0%
Cities with the Highest Percentage of Households Heated without Fuel in Oklahoma
| City | Fuel-less Heating | vs State | vs National | |
| 1. | Swink | 22.2% | 0.30%(+21.9)#1 | 1.2%(+21.0)#497 |
| 2. | Bache | 14.3% | 0.30%(+14.0)#2 | 1.2%(+13.1)#558 |
| 3. | Roosevelt | 8.3% | 0.30%(+8.00)#3 | 1.2%(+7.10)#709 |
| 4. | Delaware | 7.3% | 0.30%(+7.00)#4 | 1.2%(+6.10)#768 |
| 5. | Peoria | 6.6% | 0.30%(+6.30)#5 | 1.2%(+5.40)#836 |
| 6. | Whippoorwill | 6.5% | 0.30%(+6.20)#6 | 1.2%(+5.30)#845 |
| 7. | Horntown | 5.9% | 0.30%(+5.60)#7 | 1.2%(+4.70)#915 |
| 8. | Carrier | 5.6% | 0.30%(+5.30)#8 | 1.2%(+4.40)#952 |
| 9. | Hunter | 5.2% | 0.30%(+4.90)#9 | 1.2%(+4.00)#1,020 |
| 10. | Hoffman | 5.0% | 0.30%(+4.70)#10 | 1.2%(+3.80)#1,055 |
| 11. | Hallett | 5.0% | 0.30%(+4.70)#11 | 1.2%(+3.80)#1,056 |
| 12. | Eldorado | 4.0% | 0.30%(+3.70)#12 | 1.2%(+2.80)#1,285 |
| 13. | Shattuck | 3.4% | 0.30%(+3.10)#13 | 1.2%(+2.20)#1,464 |
| 14. | Gene Autry | 3.3% | 0.30%(+3.00)#14 | 1.2%(+2.10)#1,517 |
| 15. | Nash | 3.1% | 0.30%(+2.80)#15 | 1.2%(+1.90)#1,602 |
| 16. | Fletcher | 3.0% | 0.30%(+2.70)#16 | 1.2%(+1.80)#1,643 |
| 17. | Braman | 3.0% | 0.30%(+2.70)#17 | 1.2%(+1.80)#1,655 |
| 18. | Stilwell | 2.9% | 0.30%(+2.60)#18 | 1.2%(+1.70)#1,672 |
| 19. | Etowah | 2.9% | 0.30%(+2.60)#19 | 1.2%(+1.70)#1,702 |
| 20. | Bristow | 2.8% | 0.30%(+2.50)#20 | 1.2%(+1.60)#1,726 |
| 21. | Valley Brook | 2.8% | 0.30%(+2.50)#21 | 1.2%(+1.60)#1,752 |
| 22. | Waynoka | 2.6% | 0.30%(+2.30)#22 | 1.2%(+1.40)#1,884 |
| 23. | St Louis | 2.4% | 0.30%(+2.10)#23 | 1.2%(+1.20)#2,079 |
| 24. | Lindsay | 2.3% | 0.30%(+2.00)#24 | 1.2%(+1.10)#2,108 |
| 25. | Erick | 2.1% | 0.30%(+1.80)#25 | 1.2%(+0.900)#2,385 |
| 26. | Simms | 2.1% | 0.30%(+1.80)#26 | 1.2%(+0.900)#2,390 |
| 27. | Hulbert | 2.0% | 0.30%(+1.70)#27 | 1.2%(+0.800)#2,515 |
| 28. | Amber | 1.9% | 0.30%(+1.60)#28 | 1.2%(+0.700)#2,673 |
| 29. | Antlers | 1.8% | 0.30%(+1.50)#29 | 1.2%(+0.600)#2,777 |
| 30. | Vici | 1.8% | 0.30%(+1.50)#30 | 1.2%(+0.600)#2,828 |
| 31. | Haworth | 1.8% | 0.30%(+1.50)#31 | 1.2%(+0.600)#2,845 |
| 32. | Holdenville | 1.7% | 0.30%(+1.40)#32 | 1.2%(+0.500)#2,914 |
| 33. | Jennings | 1.7% | 0.30%(+1.40)#33 | 1.2%(+0.500)#2,998 |
| 34. | Dewey | 1.6% | 0.30%(+1.30)#34 | 1.2%(+0.400)#3,103 |
| 35. | Colcord | 1.6% | 0.30%(+1.30)#35 | 1.2%(+0.400)#3,163 |
| 36. | Empire City | 1.6% | 0.30%(+1.30)#36 | 1.2%(+0.400)#3,165 |
| 37. | Thackerville | 1.6% | 0.30%(+1.30)#37 | 1.2%(+0.400)#3,184 |
| 38. | Fanshawe | 1.6% | 0.30%(+1.30)#38 | 1.2%(+0.400)#3,193 |
| 39. | Chickasha | 1.5% | 0.30%(+1.20)#39 | 1.2%(+0.300)#3,251 |
| 40. | Newcastle | 1.5% | 0.30%(+1.20)#40 | 1.2%(+0.300)#3,259 |
| 41. | Wyandotte | 1.5% | 0.30%(+1.20)#41 | 1.2%(+0.300)#3,402 |
| 42. | Lone Wolf | 1.5% | 0.30%(+1.20)#42 | 1.2%(+0.300)#3,405 |
| 43. | Poteau | 1.4% | 0.30%(+1.10)#43 | 1.2%(+0.200)#3,485 |
| 44. | Wilburton | 1.3% | 0.30%(+1.00)#44 | 1.2%(+0.100)#3,791 |
| 45. | Konawa | 1.3% | 0.30%(+1.00)#45 | 1.2%(+0.100)#3,837 |
| 46. | Chattanooga | 1.3% | 0.30%(+1.00)#46 | 1.2%(+0.100)#3,869 |
| 47. | Freedom | 1.3% | 0.30%(+1.00)#47 | 1.2%(+0.100)#3,890 |
| 48. | Henryetta | 1.2% | 0.30%(+0.900)#48 | 1.2%(=0.000)#4,017 |
| 49. | Drumright | 1.2% | 0.30%(+0.900)#49 | 1.2%(=0.000)#4,070 |
| 50. | Dibble | 1.2% | 0.30%(+0.900)#50 | 1.2%(=0.000)#4,117 |
| 51. | Burneyville | 1.2% | 0.30%(+0.900)#51 | 1.2%(=0.000)#4,129 |
| 52. | Kansas | 1.2% | 0.30%(+0.900)#52 | 1.2%(=0.000)#4,138 |
| 53. | Spavinaw | 1.2% | 0.30%(+0.900)#53 | 1.2%(=0.000)#4,165 |
| 54. | Bernice | 1.2% | 0.30%(+0.900)#54 | 1.2%(=0.000)#4,170 |
| 55. | Altus | 1.1% | 0.30%(+0.800)#55 | 1.2%(-0.100)#4,249 |
| 56. | Brushy | 1.1% | 0.30%(+0.800)#56 | 1.2%(-0.100)#4,438 |
| 57. | Cole | 1.1% | 0.30%(+0.800)#57 | 1.2%(-0.100)#4,447 |
| 58. | Mill Creek | 1.1% | 0.30%(+0.800)#58 | 1.2%(-0.100)#4,496 |
| 59. | Broken Bow | 1.0% | 0.30%(+0.700)#59 | 1.2%(-0.200)#4,707 |
| 60. | Haskell | 1.0% | 0.30%(+0.700)#60 | 1.2%(-0.200)#4,783 |
| 61. | Central High | 1.0% | 0.30%(+0.700)#61 | 1.2%(-0.200)#4,797 |
| 62. | Sunray | 1.0% | 0.30%(+0.700)#62 | 1.2%(-0.200)#4,843 |
| 63. | Winchester | 1.0% | 0.30%(+0.700)#63 | 1.2%(-0.200)#4,865 |
| 64. | Belfonte | 1.0% | 0.30%(+0.700)#64 | 1.2%(-0.200)#4,897 |
| 65. | Durant | 0.90% | 0.30%(+0.600)#65 | 1.2%(-0.300)#5,012 |
| 66. | Sallisaw | 0.90% | 0.30%(+0.600)#66 | 1.2%(-0.300)#5,079 |
| 67. | Muldrow | 0.90% | 0.30%(+0.600)#67 | 1.2%(-0.300)#5,172 |
| 68. | Wanette | 0.90% | 0.30%(+0.600)#68 | 1.2%(-0.300)#5,324 |
| 69. | Lawton | 0.80% | 0.30%(+0.500)#69 | 1.2%(-0.400)#5,348 |
| 70. | Choctaw | 0.80% | 0.30%(+0.500)#70 | 1.2%(-0.400)#5,495 |
| 71. | Oakhurst | 0.80% | 0.30%(+0.500)#71 | 1.2%(-0.400)#5,682 |
| 72. | Waurika | 0.80% | 0.30%(+0.500)#72 | 1.2%(-0.400)#5,695 |
| 73. | Minco | 0.80% | 0.30%(+0.500)#73 | 1.2%(-0.400)#5,715 |
| 74. | Howe | 0.80% | 0.30%(+0.500)#74 | 1.2%(-0.400)#5,782 |
| 75. | Garber | 0.80% | 0.30%(+0.500)#75 | 1.2%(-0.400)#5,798 |
| 76. | Slaughterville | 0.70% | 0.30%(+0.400)#76 | 1.2%(-0.500)#6,182 |
| 77. | Fort Gibson | 0.70% | 0.30%(+0.400)#77 | 1.2%(-0.500)#6,198 |
| 78. | Salina | 0.70% | 0.30%(+0.400)#78 | 1.2%(-0.500)#6,323 |
| 79. | Fairfax | 0.70% | 0.30%(+0.400)#79 | 1.2%(-0.500)#6,332 |
| 80. | Boswell | 0.70% | 0.30%(+0.400)#80 | 1.2%(-0.500)#6,368 |
| 81. | Elmore City | 0.70% | 0.30%(+0.400)#81 | 1.2%(-0.500)#6,377 |
| 82. | Coyle | 0.70% | 0.30%(+0.400)#82 | 1.2%(-0.500)#6,398 |
| 83. | Wapanucka | 0.70% | 0.30%(+0.400)#83 | 1.2%(-0.500)#6,406 |
| 84. | Jenks | 0.60% | 0.30%(+0.300)#84 | 1.2%(-0.600)#6,557 |
| 85. | El Reno | 0.60% | 0.30%(+0.300)#85 | 1.2%(-0.600)#6,615 |
| 86. | Healdton | 0.60% | 0.30%(+0.300)#86 | 1.2%(-0.600)#6,889 |
| 87. | Arkoma | 0.60% | 0.30%(+0.300)#87 | 1.2%(-0.600)#6,932 |
| 88. | Dickson | 0.60% | 0.30%(+0.300)#88 | 1.2%(-0.600)#6,962 |
| 89. | Geronimo | 0.60% | 0.30%(+0.300)#89 | 1.2%(-0.600)#6,992 |
| 90. | Allen | 0.60% | 0.30%(+0.300)#90 | 1.2%(-0.600)#7,022 |
| 91. | Depew | 0.60% | 0.30%(+0.300)#91 | 1.2%(-0.600)#7,086 |
| 92. | Shawnee | 0.50% | 0.30%(+0.200)#92 | 1.2%(-0.700)#7,237 |
| 93. | Elgin | 0.50% | 0.30%(+0.200)#93 | 1.2%(-0.700)#7,531 |
| 94. | Pink | 0.50% | 0.30%(+0.200)#94 | 1.2%(-0.700)#7,623 |
| 95. | Lexington | 0.50% | 0.30%(+0.200)#95 | 1.2%(-0.700)#7,633 |
| 96. | Hooker | 0.50% | 0.30%(+0.200)#96 | 1.2%(-0.700)#7,669 |
| 97. | Cherokee | 0.50% | 0.30%(+0.200)#97 | 1.2%(-0.700)#7,671 |
| 98. | Maysville | 0.50% | 0.30%(+0.200)#98 | 1.2%(-0.700)#7,681 |
| 99. | West Siloam Springs | 0.50% | 0.30%(+0.200)#99 | 1.2%(-0.700)#7,690 |
| 100. | Bray | 0.50% | 0.30%(+0.200)#100 | 1.2%(-0.700)#7,725 |
Common Questions
What are the Top 10 Cities with the Highest Percentage of Households Heated without Fuel in Oklahoma?
Top 10 Cities with the Highest Percentage of Households Heated without Fuel in Oklahoma are:
What city has the Highest Percentage of Households Heated without Fuel in Oklahoma?
Swink has the Highest Percentage of Households Heated without Fuel in Oklahoma with 22.2%.
What is the Percentage of Households Heated without Fuel in the State of Oklahoma?
Percentage of Households Heated without Fuel in Oklahoma is 0.30%.
What is the Percentage of Households Heated without Fuel in the United States?
Percentage of Households Heated without Fuel in the United States is 1.2%.