Cities with the Highest Percentage of Households Heated without Fuel in South Dakota
RELATED REPORTS & OPTIONS
Fuel-less Heating
South Dakota
Compare Cities
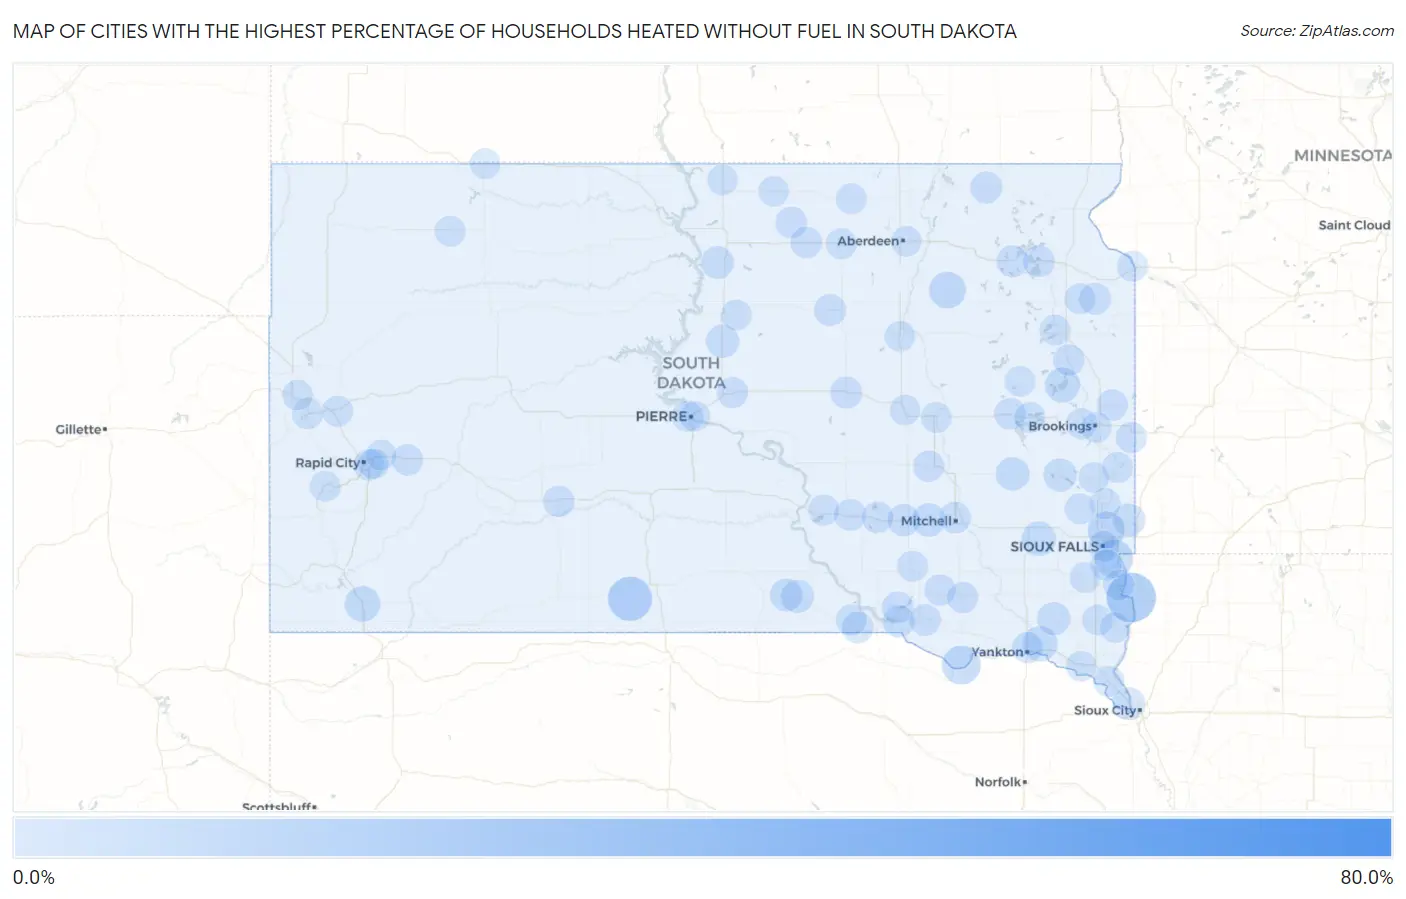
Map of Cities with the Highest Percentage of Households Heated without Fuel in South Dakota
0.0%
80.0%
Cities with the Highest Percentage of Households Heated without Fuel in South Dakota
| City | Fuel-less Heating | vs State | vs National | |
| 1. | Clark Colony | 75.0% | 0.80%(+74.2)#1 | 1.2%(+73.8)#325 |
| 2. | Glendale Colony | 35.3% | 0.80%(+34.5)#2 | 1.2%(+34.1)#461 |
| 3. | Fairview | 21.2% | 0.80%(+20.4)#3 | 1.2%(+20.0)#506 |
| 4. | Two Strike | 15.4% | 0.80%(+14.6)#4 | 1.2%(+14.2)#549 |
| 5. | Prairiewood | 12.0% | 0.80%(+11.2)#5 | 1.2%(+10.8)#598 |
| 6. | Running Water | 9.4% | 0.80%(+8.60)#6 | 1.2%(+8.20)#661 |
| 7. | Shindler | 9.0% | 0.80%(+8.20)#7 | 1.2%(+7.80)#676 |
| 8. | Renner Corner | 7.2% | 0.80%(+6.40)#8 | 1.2%(+6.00)#774 |
| 9. | Conde | 7.0% | 0.80%(+6.20)#9 | 1.2%(+5.80)#795 |
| 10. | Oelrichs | 5.8% | 0.80%(+5.00)#10 | 1.2%(+4.60)#929 |
| 11. | Lake Poinsett | 5.3% | 0.80%(+4.50)#11 | 1.2%(+4.10)#996 |
| 12. | Mission Hill | 5.3% | 0.80%(+4.50)#12 | 1.2%(+4.10)#999 |
| 13. | Canistota | 4.6% | 0.80%(+3.80)#13 | 1.2%(+3.40)#1,128 |
| 14. | Howard | 3.5% | 0.80%(+2.70)#14 | 1.2%(+2.30)#1,438 |
| 15. | Mount Vernon | 3.5% | 0.80%(+2.70)#15 | 1.2%(+2.30)#1,442 |
| 16. | Irene | 3.3% | 0.80%(+2.50)#16 | 1.2%(+2.10)#1,511 |
| 17. | Agar | 3.3% | 0.80%(+2.50)#17 | 1.2%(+2.10)#1,521 |
| 18. | Madison | 3.2% | 0.80%(+2.40)#18 | 1.2%(+2.00)#1,535 |
| 19. | Gregory | 3.1% | 0.80%(+2.30)#19 | 1.2%(+1.90)#1,581 |
| 20. | Garretson | 3.0% | 0.80%(+2.20)#20 | 1.2%(+1.80)#1,639 |
| 21. | Dallas | 2.9% | 0.80%(+2.10)#21 | 1.2%(+1.70)#1,703 |
| 22. | Akaska | 2.9% | 0.80%(+2.10)#22 | 1.2%(+1.70)#1,705 |
| 23. | North Sioux City | 2.7% | 0.80%(+1.90)#23 | 1.2%(+1.50)#1,786 |
| 24. | Plankinton | 2.3% | 0.80%(+1.50)#24 | 1.2%(+1.10)#2,158 |
| 25. | Pickstown | 2.0% | 0.80%(+1.20)#25 | 1.2%(+0.800)#2,527 |
| 26. | Miller | 1.9% | 0.80%(+1.10)#26 | 1.2%(+0.700)#2,640 |
| 27. | Britton | 1.9% | 0.80%(+1.10)#27 | 1.2%(+0.700)#2,647 |
| 28. | Faulkton | 1.9% | 0.80%(+1.10)#28 | 1.2%(+0.700)#2,656 |
| 29. | Stockholm | 1.9% | 0.80%(+1.10)#29 | 1.2%(+0.700)#2,681 |
| 30. | Webster | 1.8% | 0.80%(+1.00)#30 | 1.2%(+0.600)#2,789 |
| 31. | Lake Andes | 1.8% | 0.80%(+1.00)#31 | 1.2%(+0.600)#2,812 |
| 32. | Mitchell | 1.7% | 0.80%(+0.900)#32 | 1.2%(+0.500)#2,888 |
| 33. | Waubay | 1.7% | 0.80%(+0.900)#33 | 1.2%(+0.500)#2,988 |
| 34. | Kimball | 1.5% | 0.80%(+0.700)#34 | 1.2%(+0.300)#3,399 |
| 35. | Fairfax | 1.5% | 0.80%(+0.700)#35 | 1.2%(+0.300)#3,417 |
| 36. | Wagner | 1.4% | 0.80%(+0.600)#36 | 1.2%(+0.200)#3,575 |
| 37. | De Smet | 1.4% | 0.80%(+0.600)#37 | 1.2%(+0.200)#3,602 |
| 38. | Hosmer | 1.4% | 0.80%(+0.600)#38 | 1.2%(+0.200)#3,639 |
| 39. | White Lake | 1.3% | 0.80%(+0.500)#39 | 1.2%(+0.100)#3,873 |
| 40. | Roscoe | 1.3% | 0.80%(+0.500)#40 | 1.2%(+0.100)#3,883 |
| 41. | New Underwood | 1.2% | 0.80%(+0.400)#41 | 1.2%(=0.000)#4,150 |
| 42. | Yankton | 1.1% | 0.80%(+0.300)#42 | 1.2%(-0.100)#4,257 |
| 43. | Castlewood | 1.1% | 0.80%(+0.300)#43 | 1.2%(-0.100)#4,459 |
| 44. | Kadoka | 1.1% | 0.80%(+0.300)#44 | 1.2%(-0.100)#4,482 |
| 45. | Blunt | 1.1% | 0.80%(+0.300)#45 | 1.2%(-0.100)#4,502 |
| 46. | Delmont | 1.1% | 0.80%(+0.300)#46 | 1.2%(-0.100)#4,506 |
| 47. | Rapid City | 1.0% | 0.80%(+0.200)#47 | 1.2%(-0.200)#4,529 |
| 48. | Elkton | 1.0% | 0.80%(+0.200)#48 | 1.2%(-0.200)#4,833 |
| 49. | Woonsocket | 1.0% | 0.80%(+0.200)#49 | 1.2%(-0.200)#4,847 |
| 50. | Tripp | 1.0% | 0.80%(+0.200)#50 | 1.2%(-0.200)#4,864 |
| 51. | White | 1.0% | 0.80%(+0.200)#51 | 1.2%(-0.200)#4,879 |
| 52. | Sioux Falls | 0.90% | 0.80%(+0.100)#52 | 1.2%(-0.300)#4,914 |
| 53. | Harrisburg | 0.90% | 0.80%(+0.100)#53 | 1.2%(-0.300)#5,093 |
| 54. | Dell Rapids | 0.90% | 0.80%(+0.100)#54 | 1.2%(-0.300)#5,149 |
| 55. | Fort Pierre | 0.90% | 0.80%(+0.100)#55 | 1.2%(-0.300)#5,196 |
| 56. | Volga | 0.90% | 0.80%(+0.100)#56 | 1.2%(-0.300)#5,208 |
| 57. | Bonesteel | 0.90% | 0.80%(+0.100)#57 | 1.2%(-0.300)#5,314 |
| 58. | Pukwana | 0.90% | 0.80%(+0.100)#58 | 1.2%(-0.300)#5,319 |
| 59. | South Shore | 0.90% | 0.80%(+0.100)#59 | 1.2%(-0.300)#5,326 |
| 60. | Watertown | 0.80% | 0.80%(=0.000)#60 | 1.2%(-0.400)#5,429 |
| 61. | Sturgis | 0.80% | 0.80%(=0.000)#61 | 1.2%(-0.400)#5,552 |
| 62. | Flandreau | 0.80% | 0.80%(=0.000)#62 | 1.2%(-0.400)#5,672 |
| 63. | Deadwood | 0.80% | 0.80%(=0.000)#63 | 1.2%(-0.400)#5,720 |
| 64. | Ipswich | 0.80% | 0.80%(=0.000)#64 | 1.2%(-0.400)#5,741 |
| 65. | Lake Preston | 0.80% | 0.80%(=0.000)#65 | 1.2%(-0.400)#5,811 |
| 66. | Aberdeen | 0.70% | 0.80%(-0.100)#66 | 1.2%(-0.500)#5,964 |
| 67. | Brookings | 0.70% | 0.80%(-0.100)#67 | 1.2%(-0.500)#5,990 |
| 68. | Canton | 0.70% | 0.80%(-0.100)#68 | 1.2%(-0.500)#6,221 |
| 69. | Gettysburg | 0.70% | 0.80%(-0.100)#69 | 1.2%(-0.500)#6,308 |
| 70. | Corsica | 0.70% | 0.80%(-0.100)#70 | 1.2%(-0.500)#6,385 |
| 71. | Leola | 0.70% | 0.80%(-0.100)#71 | 1.2%(-0.500)#6,425 |
| 72. | Huron | 0.60% | 0.80%(-0.200)#72 | 1.2%(-0.600)#6,648 |
| 73. | Lennox | 0.60% | 0.80%(-0.200)#73 | 1.2%(-0.600)#6,874 |
| 74. | Redfield | 0.60% | 0.80%(-0.200)#74 | 1.2%(-0.600)#6,893 |
| 75. | Elk Point | 0.60% | 0.80%(-0.200)#75 | 1.2%(-0.600)#6,901 |
| 76. | Colton | 0.60% | 0.80%(-0.200)#76 | 1.2%(-0.600)#7,044 |
| 77. | Beresford | 0.50% | 0.80%(-0.300)#77 | 1.2%(-0.700)#7,588 |
| 78. | Alcester | 0.50% | 0.80%(-0.300)#78 | 1.2%(-0.700)#7,737 |
| 79. | Eureka | 0.50% | 0.80%(-0.300)#79 | 1.2%(-0.700)#7,748 |
| 80. | Big Stone City | 0.50% | 0.80%(-0.300)#80 | 1.2%(-0.700)#7,761 |
| 81. | Bryant | 0.50% | 0.80%(-0.300)#81 | 1.2%(-0.700)#7,763 |
| 82. | Hill City | 0.50% | 0.80%(-0.300)#82 | 1.2%(-0.700)#7,768 |
| 83. | Bison | 0.50% | 0.80%(-0.300)#83 | 1.2%(-0.700)#7,793 |
| 84. | Spearfish | 0.40% | 0.80%(-0.400)#84 | 1.2%(-0.800)#8,069 |
| 85. | Box Elder | 0.40% | 0.80%(-0.400)#85 | 1.2%(-0.800)#8,076 |
| 86. | Lemmon | 0.40% | 0.80%(-0.400)#86 | 1.2%(-0.800)#8,386 |
| 87. | Colman | 0.40% | 0.80%(-0.400)#87 | 1.2%(-0.800)#8,396 |
| 88. | Wolsey | 0.40% | 0.80%(-0.400)#88 | 1.2%(-0.800)#8,401 |
| 89. | Herreid | 0.40% | 0.80%(-0.400)#89 | 1.2%(-0.800)#8,419 |
| 90. | Pierre | 0.30% | 0.80%(-0.500)#90 | 1.2%(-0.900)#8,725 |
| 91. | Vermillion | 0.30% | 0.80%(-0.500)#91 | 1.2%(-0.900)#8,761 |
| 92. | Rapid Valley | 0.30% | 0.80%(-0.500)#92 | 1.2%(-0.900)#8,885 |
Common Questions
What are the Top 10 Cities with the Highest Percentage of Households Heated without Fuel in South Dakota?
Top 10 Cities with the Highest Percentage of Households Heated without Fuel in South Dakota are:
#1
21.2%
#2
15.4%
#3
9.4%
#4
9.0%
#5
7.2%
#6
7.0%
#7
5.8%
#8
5.3%
#9
5.3%
#10
4.6%
What city has the Highest Percentage of Households Heated without Fuel in South Dakota?
Fairview has the Highest Percentage of Households Heated without Fuel in South Dakota with 21.2%.
What is the Percentage of Households Heated without Fuel in the State of South Dakota?
Percentage of Households Heated without Fuel in South Dakota is 0.80%.
What is the Percentage of Households Heated without Fuel in the United States?
Percentage of Households Heated without Fuel in the United States is 1.2%.